Special Issue: Geopolitical Environment Simulation on the Belt and Road Region

Simulating potential yields of Chinese superhybrid rice in Bangladesh, India and Myanmar with EPIC model

  • WANG Xiaobo , 1, 2 ,
  • WANG Shaoqiang , 1, 2, * ,
  • CHEN Jinghua 1, 2 ,
  • CUI Huijuan 1 ,
  • WU Yijin 3 ,
  • N H Ravindranath 4 ,
  • Atiq Rahman 5
Expand
  • 1. Key Lab of Ecosystem Network Observation and Modelling, Institute of Geographic Sciences and Natural Resources Research, CAS, Beijing 100101, China
  • 2. University of Chinese Academy of Sciences, Beijing 100049, China
  • 3. College of Urban and Environmental Sciences, Central China Normal University, Wuhan 430079, China
  • 4. Centre for Sustainable Technologies, India Institute of Science, Bangalore 560012, India
  • 5. Bangladesh Centre for Advanced Studies, Dhaka 1212, Bangladesh
*Corresponding author: Wang Shaoqiang, PhD and Professor, specialized in ecological remote sensing and ecological modelling. E-mail:

Author: Wang Xiaobo, PhD Candidate, specialized in ecosystem ecology. E-mail:

Received date: 2018-03-15

  Online published: 2018-07-20

Supported by

Key Program of the Chinese Academy of Sciences, No.ZDRW-ZS-2016-6

National Key Research and Development Program of China, No.2017YFC0503803

Copyright

Journal of Geographical Sciences, All Rights Reserved

Abstract

In this study, information is collected on the weather, soils, field management and agricultural statistics in the Bangladesh, India and Myanmar (BIM) region. Crop growth parameters within the EPIC (Environmental Policy Integrated Climate) model are calibrated using cultivar data and regional experimental records of indica hybrid rice Fyou498 and Fengliangyou4 in China. Potential yields of rice are then simulated in the BIM region from 1996 to 2005. The effects of local irrigation and fertilization levels on super hybrid rice yield are examined. The potential yields of Chinese hybrid rice at local irrigation and fertilization levels in 2000 and at full irrigation and rational fertilization levels are found to be 10.22 t/ha and 11.33 t/ha, respectively. The potential for increasing monsoon rice production in the study region is 227.71 million tons. The eastern Indo-Gangetic Plain in India, the southeast coast of India Peninsula and the Ayeyarwady Delta in Myanmar have the largest potentials for monsoon rice production. The northeastern and southwestern areas of the Deccan Plateau and the northwestern region of the Indo-Gangetic Plain need to improve irrigation equipment to meet the water-use requirements of high-yield rice. The central and southern plains in Myanmar and northeastern India need greater access to nitrogen fertilization for high-yield rice.

Cite this article

WANG Xiaobo , WANG Shaoqiang , CHEN Jinghua , CUI Huijuan , WU Yijin , N H Ravindranath , Atiq Rahman . Simulating potential yields of Chinese superhybrid rice in Bangladesh, India and Myanmar with EPIC model[J]. Journal of Geographical Sciences, 2018 , 28(7) : 1020 -1036 . DOI: 10.1007/s11442-018-1519-4

1 Introduction

The Chinese Ministry of Agriculture, the Chinese Ministry of Foreign Affairs, the National Development and Reform Commission and the Chinese Ministry of Commerce have issued “Vision and actions on jointly promoting the construction of agricultural cooperation on the Belt and Road”. They pointed out that countries along the Silk Road Economic Belt and 21st-Century Maritime Silk Road should strengthen cooperation in agricultural science and technology, highlight the leading position of scientific and technological cooperation, and promote exchange of crop varieties, technologies and agricultural products. As a vital part of the Belt and Road Initiative, the Economic Corridor across the Bangladesh, China, India and Myanmar (BCIM) region has become an important rice-producing area owing to its geographic hydrothermal conditions. According to estimates from the United States Department of Agriculture (USDA), the rice yield in Bangladesh, India and Myanmar (the BIM region) during 2016-2017 accounted for one-third of global rice production. The total rice yields of India, Bangladesh and Myanmar were 108 million tons, 35 million tons and 12 million tons, respectively, which ranked second, fourth and seventh in the world. Rice is the most important staple food for more than 1.5 billion locals in the BIM region. However, agricultural modernization in the BIM region is relatively undeveloped, and yields of leading crop varieties are low. Assessment of rice yield potential is of great significance to local food and social security in the BIM region, given the region’s continuous increase in population and competition for arable land.
There are three main methods for estimating the potential crop yield. (1) Experimental statistical methods, such as counting the maximum or 95th percentile values in actual yield data of paddy fields in a specific climatic region (Foley et al., 2011; Mueller et al., 2012; Waddington et al., 2010) and using frontier production functions to calculate potential yields (Neumann et al., 2010). (2) Field experimental methods aimed at obtaining the maximum yields of rice by cultivation under ideal conditions (Peng et al., 1999). (3) Model simulation methods, namely simulating growth processes of rice by ecophysiological models. The DSSAT (Decision Support System for Agrotechnology Transfer), CERES (Crop Estimation through Resource and Environment Synthesis), ORYZA and EPIC (Environmental Policy Integrated Climate) models are being increasingly used to simulate rice yield in the BIM region (Priya and Shibasaki, 2001; Das et al., 2007; Basak et al., 2010; Subash and Mohan, 2012; Timsina et al., 2016). (4) Upscaling methods based on multisource data and multiple models. These methods comprehensively analyze simulation results of field experimental data and agricultural statistics data, empirical models and process models, and evaluate the potential productivity of grain in the area based on reasonable partitioning (Wart et al., 2013; Ittersum et al., 2013; Guilpart et al., 2017). Results from experimental statistical methods and field experiments lack representation in a large-scale region, and these methods cannot interpret the yield gap easily. Therefore, model simulation and upscale methods are widely used to estimate rice potential yields at scales above the national. Nevertheless, these estimates are mainly based on local rice varieties, and do not consider the effects of research and introduction of potential excellent germplasm resources, especially high-yield hybrid rice.
The Food and Agriculture Organization (FAO) of the United Nations developed hybrid rice as the first choice for easing hunger problems in poor areas in 1992. The governments of the BIM region, all of which gave adequate attention to the positive effects of hybrid rice on the increase of rice yield in poorer areas, started their own research and introduced high-yield hybrid rice in the 1990s. The harvest area of hybrid rice in India was more than 3 million hectares, accounting for about 7% of the rice harvest area by 2016. Harvest areas of hybrid rice in Bangladesh and Myanmar are stable at 600 thousand hectares and 30 thousand hectares, accounting for 5% and 0.4% of the country’s total harvest areas, respectively. However, compared with the hybrid rice harvest area share of over 50% in China, BIM countries still have a long way to go (Hu and Jiang, 2010; Hu et al., 2011; Spielman et al., 2012; Chen et al., 2014). As the first country to successfully utilize rice heterosis in the world, China has proposed a super hybrid rice cultivation plan based on existing high-yield hybrid rice. China possesses abundant excellent germplasm resources. Over the past 20 years, many types of hybrid rice seeds have been introduced to the BIM region from Hubei, Sichuan and Anhui provinces in China. For example, Myanmar has approved the 3S/Long8R hybrid rice combination from Anhui and the combination of JX5A/JX5R and DAR hybrid rice from Sichuan (Chen et al., 2014).
In this work, the EPIC model, calibrated by field experimental data from super hybrid rice in southern China, is applied to simulate potential yields of super hybrid rice in the BIM region, under different irrigation and fertilization scenarios. This can provide references for the scientific extension of super hybrid rice in the BIM region, and speed up the pace of “going global” in Chinese agriculture. It can also demonstrate the potential for rice production in the BIM region, and is conducive to ensuring food security and regional sustainable development in the BCIM Economic Corridor.

2 Data sources and processing

2.1 Data on the Chinese super hybrid rice variety

This work calibrates the growth parameters of Chinese super hybrid rice using regional experimental data and growth characteristic data of two-line indica hybrid rice Fyou498 and three-line indica hybrid rice Fengliangyou4.
Regional experimental data of super hybrid rice from the China Rice Data Center were obtained from 47 field stations in the Yangtze River Basin in 2016. The 2016 diurnal meteorological and radiation data of the experimental sites were replaced by observation data. If data from weather stations were not available, the latest national weather station data at the experimental site were used. The weather station data were obtained from the Climatic Data Center, National Meteorological Information Center in China.
The growth characteristic data of two kinds of super hybrid rice cover harvest index, growth leaf area index, growth effective accumulated temperature, plant height, plant density and radiation utilization ratio. The data were mainly derived from Chinese rice varieties and the pedigree database of the China Rice Data Center, and also referred to the growth characteristics of Fyou498 and Fengliangyou4 found in agricultural production.

2.2 Input data of rice production in the BIM region

The input data of the EPIC model included meteorological data, soil data, field management and tillage data, basic geographic information and agricultural statistics. The specific input parameters and data sources are shown in Table 1. The parameters of tillage technology, tillage depth, operation width and speed were obtained from the sowing mode parameter database of the EPIC model. Harvest efficiency and related parameters were obtained from the harvest mode parameter database of the model. The default soil water potential was -33 kPa when the soil water content reached field capacity, and was -1500 kPa when the soil water content reached the wilting coefficient in the EPIC model. The soil initial water content and nitrogen contents were calculated by the EPIC model based on input data and built-in formulas.
Table 1 EPIC model parameters and data sources
Data module Parameters Data sources
Meteorological data Monthly maximum temperature, monthly minimum temperature, monthly precipitation, wet days and wind speed NCDC, CRU TS V3.23
(Harris et al., 2014)
Monthly solar radiance, standard deviation of monthly temperature, daily maximum temperature, daily minimum temperature, daily precipitation, maximum half hourly precipitation and relative humidity Generated by EPIC, GEPIC and MODAWEC models
Soil data Soil depth, soil texture, content of gravel, bulk density, pH, soil organic carbon, cation exchange capacity, calcium carbonate content and soil albedo ISRIC-wise (Batjes, 2008), WISE30sec (Batjes, 2015)
Field water capacity, wilting coefficient, etc. Generated by the EPIC model
Field management
and tillage data
Spatial distribution of rice planting period and harvest period, spatial distribution of maximum fertilizer amount (nitrogen fertilizer) and maximum amount of irrigation in 2000 EarthStat (Foley et al., 2011;
Mueller et al., 2012),
GEPIC model (Liu et al., 2007; Liu, 2009)
Technical parameters of cultivation harvesting EPIC0509 tillage parameter database
Basic geographic
information
Administrative boundary of Bangladesh, India and Myanmar, digital elevation model, slope data, land use data, etc. AVHRR, GMTED2010 (Danielson and Gesch, 2011), SinoMaps Press
Agricultural statistics Spatial distribution of rainfed area, irrigated area, yield and climatic potential of rice in 2000 EarthStat, SPAM 2000 (You et al., 2017)
The following data processing methods for different modules were used. (1) A grid map of the spatial distribution of monthly meteorological data in the BIM region was generated during 1996-2005 with a resolution of 0.1°×0.1° based on monthly observation data from National Climatic Data Center (NCDC) meteorological stations and interpolation results from the Climatic Research Unit Timeseries (CRU TS) data. The center point of each pixel in the grid was treated as a site in the EPIC model, and the meteorological data were processed. Daily scale meteorological data were generated by the MODAWEC program. (2) Based on the International Soil Reference and Information Centre (ISRIC)-wise and WISE30sec soil profile database, a soil property spatial distribution of 0.1°×0.1° in the BIM region was generated. The center point of each pixel in the grid was treated as a site in the EPIC model, and the soil data were processed. Soil was divided into seven layers in the study region. Attributes of each layer input to the model covered depth, soil bulk density, mechanical composition, pH, organic carbon content, cation exchange capacity and electrical conductivity; other attributes were automatically generated by the EPIC model. (3) The field management and tillage data, basic geographic information and agricultural statistics were resampled as raster data with a resolution of 0.1°×0.1°.

3 Methods

3.1 EPIC and GEPIC models

The EPIC model is a system dynamics model developed to simulate a climate-vegetation- soil-management system by USDA and Texas A&M University in the United States. The model was first used to quantitatively assess effects of soil erosion on agriculture, and then simulation functions were added to calculate the carbon dioxide (CO2) concentration in the atmosphere, change of water quality and soil carbon and nitrogen cycle. The EPIC model has been successfully applied in the fields of crop yield estimation, climate impact assessment, precision agriculture and regional agriculture planning (Gassman et al., 2005; Fan et al., 2012).
Since the EPIC model is a point scale model, the maximum field scale that it can simulate is 250 acres. The model assumes that the entire farmland’s climate, soil and management measures are homogeneous, which renders the model unusable for spatial heterogeneity analysis over large-scale areas. Therefore, the GEPIC (Global Information System (GIS)-based EPIC) model was developed to simulate growth processes of rice, wheat and corn in China and the world, based on GIS 9.1. Crop water productivity and spatial variability of various crops have been analyzed with the GEPIC model, and good simulation results obtained (Liu et al., 2007; Liu, 2009).
The EPIC model simulates growth of crops on a daily basis. The calculation of rice yield could be divided into four steps. (1) According to accumulated temperature, latent heat and stress factors, changes of leaf area index were calculated, and the daily photosynthetically effective radiation received by the crops was obtained. (2) The model calculated the potential biomass per day based on atmospheric CO2, humidity and photosynthetically active radiation. (3) The actual biomass of the crop was calculated according to the potential biomass and crop stress factors. (4) The final yield of the crop was calculated according to the harvest index. In the estimation steps, simulation of crop leaf area index dynamics could fall into two stages: the first stage was calculated from emergence to the maximum value, and the second was from the maximum value to the crop harvest period (Meinardus, 1992). In this study, the solar radiation absorbed by rice was calculated using the Beer law proposed by Monsi and Saeki (Hirose, 2005), and the potential biomass was calculated using the Monteith method (Monteith and Moss, 1977).

3.2 Calibration of model crop parameters

The two-line indica hybrid rice Fyou498 and the three-line indica hybrid rice Fengliangyou4 are demonstrative and popularized super hybrid rice varieties selected by the Chinese Ministry of Agriculture. They were used for calibration of rice growth parameters in this study. Values were firstly assigned to the super hybrid rice’s harvest index (HI), maximum crop height (HMX), maximum potential leaf area index (DMLA) and fraction of growing season when leaf area declined (DLAI), according to Chinese rice varieties, the pedigree database and published literature. Then, potential heat units (PHUs) for planting were determined from rice experimental data and weather data in southern China. Finally, the biomass-energy ratio (WA) with a fixed interval (range: 20-40 kg/MJ, interval: 1 kg/MJ) was successively input into the model to determine appropriate WA values for the best possible simulation accuracy.

3.3 Setting up of harvest area, time and methods

In the EPIC model, crop growth parameters are mainly determined by the intrinsic factors of crops and are usually treated as constants when the same crop is simulated in different regions. Nevertheless, studies have shown that when the growth environments of the crop differ greatly, the growth parameters of the EPIC model will change (Xiong et al., 2014). To reduce uncertainty caused by differences in the growth parameters between different areas in China, India, Bangladesh and Myanmar, the following settings were used in the simulation process. (1) Only the main rice growing areas of the study region were chosen for super hybrid rice yield simulation. Soils in the main rice growing areas mainly included alluvial paddy soils, leached paddy soils and paddy ferralisols (paddy soils from red earths and lateritic earths). In addition, considering monthly distribution of hydrothermal resources, the study set the rainy season as the growing season for super hybrid rice in the BIM region. (2) Out of 47 stations in southern China, 18 were selected using the criterion of whether the gap between the average temperature in the growing season of the experimental stations and the BIM region was less than 10%. These stations’ soils covered alluvial paddy soils, leached paddy soils, paddy ferralisols (paddy soils from red earths and yellow earths) and purple soils. The soil types were similar to those in the main rice growing areas of the BIM region. Basic information on the 18 rice stations is shown in Table 2.
Table 2 Rice regional experimental sites in southern China in 2016
Order number Testing institution Test location Longitude Latitude Sowing date
(month/day)
1 Chongqing Three Gorges Academy of Agricultural Sciences Ganning, Wanzhou, Chongqing 108.26° 30.67° 3/18
2 Rice Institute of Chongqing Academy of Agricultural Sciences Tieqiao, Daguan, Nanchuan, Chongqing 106°33′ 29°35′ 3/26
3 Regenerated Rice Research Center of Chongqing Academy of Agricultural Sciences Shuangzhu, Yongchuan, Chongqing 105.8° 29.3° 3/14
4 Southeast Chongqing Academy of Agricultural Sciences Erdu, Fuling, Chongqing 107°25′ 29°45′ 3/14
5 Seed Management Station in Dachuan District, Dazhou, Sichuan Tonggudui, Maliu, Dachuan 106°59ˊ 30°49ˊ 3/18
6 Jialing Crop Variety Research Center, Sichuan Pingwu, Jianyang 104°38′ 30°23′ 4/9
7 Sichuan Longping High-Techseeds, Ltd. Shehong County 105°22′ 30°48′ 4/10
8 Yibin Academy of Agricultural Sciences, Sichuan Daguan, Nanxi, Yibin 104°54′ 28°58′ 3/16
9 Huangshan Seed Station, Anhui Shuangqiao, Xiuning, Huangshan 118°14′ 29°40′ 4/27
10 Seed Multiplication Farm in Jianyang, Fujian Mafu, Jukou, Jianyang 118°22′ 27°03′ 5/13
11 Hubei Huimin Agricultural Technology Co., Ltd. Lukou, Ezhou 114°38′ 30°04′ 5/5
12 Jingshan Agricultural Science Institute, Hubei Yongxing, Jingshan 113°07′ 31°01′ 5/1
13 Huaihua Agricultural Research Institute, Hunan Shimen, Hecheng, Huaihua 109°58′ 27°33′ 4/26
14 Hunan Jinsenonghua Seed Industry Co., Ltd. Jianxin, Yongan, Liuyang 113°17′ 28°11′ 5/16
15 Jiujiang Academy of Agricultural Sciences, Jiangxi Mahuiling, Jiujiang 115°48′ 29°26′ 5/17
16 Rice Institute of Jiangxi Academy of Agricultural Sciences Wunonggang, Liantang, Nanchang 115°58′ 28°41′ 5/16
17 Jiangshan Seed Station, Zhejiang Shangyu, Jiangshan 118°40′ 28°47′ 5/20
18 China National Rice Research Institute Fuyang, Zhejiang 120°19′ 30°12′ 5/16
According to the Köppen climate classification, there are three major climate types in the main rice growing areas of the BIM region: humid subtropical climate (Cwa), tropical savanna climate (Aw) and tropical monsoon climate (Am). The areas of the three climatic zones account for 35%, 40% and 11% (Peel et al., 2007) of the main rice-producing areas, respectively. Temperature and precipitation during the rice growing season of a typical humid subtropical climate city (Patna), a typical tropical savanna climate city (Dhaka), a typical tropical monsoon climate city (Yangon) and 18 stations in southern China are shown in Table 3.
Table 3 Climate comparison between Chinese stations and major rice-producing areas in the BIM region
City, country Patna, India Yangon, Myanmar Dhaka, Bangladesh Southern Chinese Stations
Köppen climate classification Cwa Am Aw Cwa, Cfa
Climatic index of rice growing season Average high temperature (°C) 34.1 30.8 31.9 29.0-31.5
Average low temperature (°C) 25.2 24.4 25.5 20.9-23.2
Precipitation (mm) 1060 2585 1856 749.3-1770.2
To determine the best time for sowing and harvesting super hybrid rice in the rainy season, April, May, June, July, August and September were successively set up as sowing months in the EPIC model, and sowing and harvesting dates were automatically adjusted depending on the PHUs for the rice. Then, rice yields corresponding to the different sowing dates were calculated. Finally, the maximum values of simulated yields and the best sowing time in each pixel were obtained. The best sowing months of the rainy season in the BIM region are shown in Figure 1. Furthermore, the rice cultivation mode in the EPIC model was set to sow in drills and plains, harvest with 95% efficiency and kill crops.
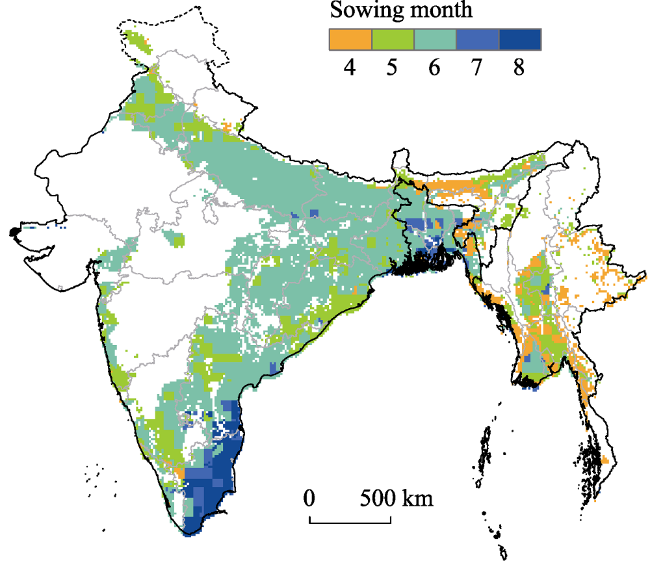
Figure 1 Best sowing months for super hybrid rice in the BIM region

3.4 Scenario setting

This study simulated the following three scenarios of super hybrid rice yield (Figure 2):
(1) Yield potential of super hybrid rice under irrigation and fertilization conditions in the BIM region in 2000 (Y2000): rice yields under the rainfed and irrigated conditions were simulated with restrictions on the rate of fertilizer application in different regions in 2000. Then according to formula (1), the spatial distribution of yields of two kinds of super hybrid rice with irrigation and fertilization in 2000 was calculated:
${{Y}_{2000j}}\text{=}\frac{{{Y}_{rj}}\times {{S}_{rj}}\text{+}{{Y}_{ij}}\times {{S}_{ij}}}{{{S}_{\text{r}j}}\text{+}{{S}_{ij}}}$ (1)
where Y2000 j represents the rice yield at the level of production in 2000 in the area covered by the jth pixel. Yrj and Yij represent yields of rainfed and irrigated conditions in the jth pixel. Srj and Sij represent the rainfed area and irrigated area of rice in the jth pixel.
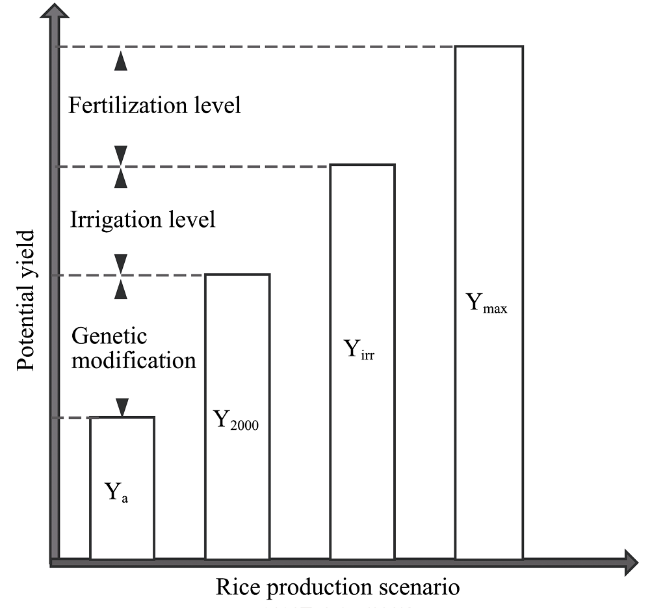
Figure 2 Relationship between rice potential yields under different conditions
(Ya: actual rice yield in 2000; Y2000: potential yield of super hybrid rice with irrigation and fertilization in 2000; Yirr: potential yield of super hybrid rice with sufficient irrigation; Ymax: potential yield of super hybrid rice with sufficient irrigation and fertilization)
(2) Yield potential under sufficient irrigated condition (Yirr): Under the condition of automatic irrigation, the growth of two kinds of super hybrid rice was simulated to ensure that the number of water stress days in the growing season was close to 0. In this scenario, mean values of yield potential of two kinds of super hybrid rice were calculated.
(3) Yield potential under sufficient irrigation and ideal fertilization condition (Ymax): According to the rate of fertilization used in China, the BIM region’s rate of fertilization under automatic irrigation was adjusted to ensure that the number of water stress and nutrient stress days was close to 0 during the rice growing seasons. Then, maximum potential yields and regional average production were calculated.

4 Results and analysis

4.1 Calibration results of super hybrid rice growth parameters

The average yield of super hybrid rice Fyou498 and Fengliangyou4 in the selected 18 experimental sites was 9107 kg/ha in 2016. The average yield simulated by the calibrated EPIC model was 9006 kg/ha, with a relative error of 1.11%. The calibration results of super hybrid rice growth parameters are shown in Table 4.
Table 4 Calibrated EPIC model parameters of Chinese super hybrid rice
Growth parameter Fyou498 Fengliangyou4
WA (kg/MJ) 27.00 27.00
HI 0.56 0.56
TOP (°C) 25.00 25.00
DMLA 7.94 10.08
DLAI 0.80 0.80
HMX (m) 1.12 1.24
PHU (°C) 2233 2284
Actual yields and simulated yields in Chinese stations are shown in Figure 3, where the sequence numbers of the stations correspond to those in Table 2. Relative errors between actual yields and simulated yields are less than 15% in selected stations, except for a seed multiplication farm in Jianyang, Fujian. According to the simulation results of the EPIC model, the rice simulated yield was 31.23% higher than the actual yield in this seed farm (No. 10). The mean maximum temperature, mean minimum temperature and precipitation in Jianyang were higher than the average level of other stations in southern China in 2016. Good hydrothermal conditions gave simulated biomass and yield values up to 23.8 t/ha and 10.1 t/ha, respectively, at the farm. However, rice in Jianyang’s paddy fields had a slight banded sclerotial blight and a 2.8% miscellaneous plant rate in actual production, which reduced the yield of rice to a certain extent. In addition, differences between methods of presoaking, vernalization, seedling raising, transplanting and use of pesticides in 18 stations might produce simulation errors.
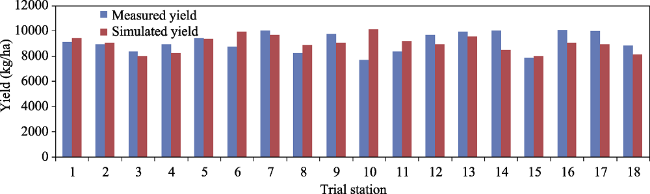
Figure 3 Measured and simulated yields at 18 southern Chinese regional experimental stations

4.2 Distribution of potential yields in the BIM region

According to the simulation results of the EPIC model, the mean potential yields Y2000, Yirr and Ymax were 10.22 t/ha, 10.70 t/ha and 11.33 t/ha, respectively, in the BIM region during 1996-2005. The potential yields of super hybrid rice showed an overall decreasing trend during the period studied (Figure 4). Maximum Y2000, Yirr and Ymax values, reaching 10.97 t/ha, 11.85 t/ha and 12.63 t/ha, respectively, all appeared in 1998 because the multiple stresses of water, temperature and nutrients in the growing season were minimum in this year. Minimum values of Y2000 (9.66 t/ha) and Yirr (9.96 t/ha) appeared in 2005; the minimum value of Ymax (10.62 t/ha) appeared in 1999.
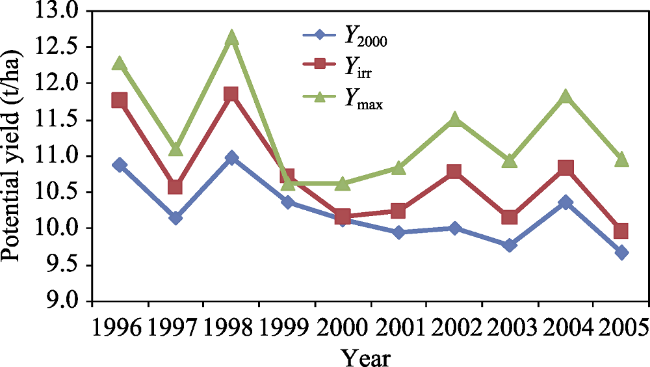
Figure 4 Potential yields of super hybrid rice under different conditions in the BIM region during 1996-2005
The spatial distribution of potential yields of super hybrid rice under different scenarios in 2000 is shown in Figure 5. In terms of mean value of potential yields, Y2000 decreases in the order (from high to low): Bangladesh, Myanmar and India; Yirr decreases in the order: Bangladesh, India and Myanmar; and Ymax decreases in the order: Bangladesh, Myanmar and India. The highest yield potentials were located in Goa, Karnataka and Tamil Nadu in southwestern India, Assam in northeastern India and Sylhet in northeastern Bangladesh. The lowest yield potentials were located in Punjab, Himachal and Jammu and Kashmir in northwestern India. These yield potentials were affected by precipitation, temperature and solar radiation in the rainy season. By comparing Ya and Ymax in the BIM region, bigger yield gaps were found in the northeastern Deccan Plateau and Assam State, and smaller yield gaps were found in the northwestern part of the Indo-Gangetic Plain and central Myanmar.
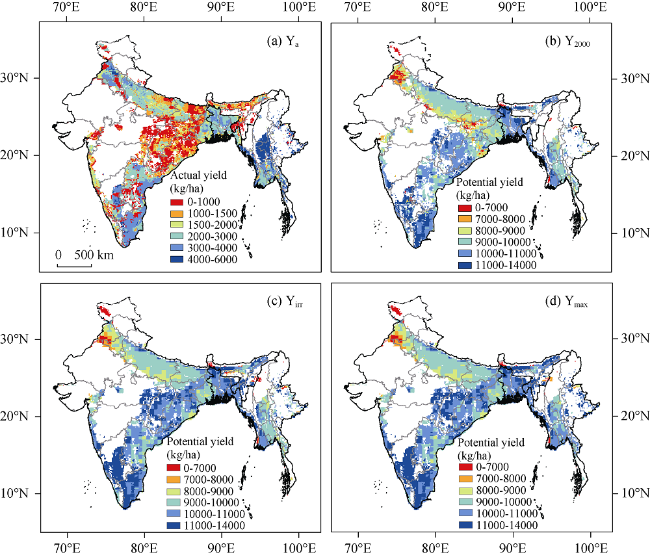
Figure 5 Potential yields of super hybrid rice under different conditions in the BIM region in 2000
Increasing total production potential of kharif rice was projected to be 212.55 million tons with irrigation and fertilization in the BIM region in 2000, 225.34 million tons with sufficient irrigation or 227.71 million tons with sufficient irrigation and ideal fertilization. As shown in Figure 3, there was a relative consistency in the spatial distribution of the total potential production of rice in the three scenarios. At the national scale, the increasing potential order of kharif rice from high to low is: India, Myanmar and Bangladesh. Under the condition of planting super hybrid rice in all regions with full irrigation and ideal fertilization, the states with more than 10 million tons of rice production potential were Uttar Pradesh, West Bengal, Bihar, Orissa, Andhra Pradesh, Jharkhand and Tamil Nadu in India and Ayeyarwady in Myanmar.
According to the spatial distribution of rice climatic potential yields calculated by Foley et al. (2011), the climatic utilization rate for actual yields of rice, which was high in dry areas and low in wet areas, reached only 6% in the BIM region. However, if super hybrid rice was planted, it was possible for the climatic utilization rate to reach more than 25% (Figure 6).
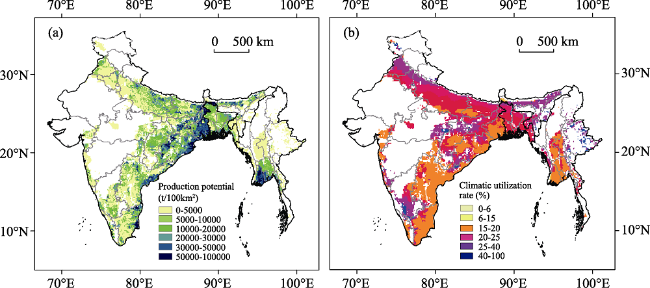
Figure 6 Maximum production potential and climatic utilization efficiency of super hybrid rice in the BIM region

4.3 Analysis of stress factors restricting rice yield

Stress on rainfed rice was more significant than that on irrigated rice according to the time series data of 1996-2005. Figure 7 shows potential yields and stress days of rainfed rice in growing seasons during this period. The results show that the rainfed rice potential yield was the highest in 1998, when the number of mean stress days in the growing season was only 14, and was the lowest in 2002, when the number of mean stress days was 26. With local irrigation and fertilization, the water stress on rainfed rice was greater than the temperature stress, while the temperature stress was greater than the nutrient stress. Water stress and nutrient stress could explain 81% of the mean yield’s interannual variations (P<0.05), and water stress was the most important constraint in rainfed paddy fields in the BIM region. The soil fertility of rainfed farmlands is projected to degenerate, and the number of nutrient stress days to increase annually, which is one of the reasons for the declining trend in the mean potential yield in the study region. With the interannual variations of Y2000, Yirr and Ymax (Figure 4), it can also be found that the drought disaster in 2002 reduced potential yields of rainfed rice to a simulated minimum, but Y2000, Yirr and Ymax in the same period did not decrease. This was mainly due to the relatively high proportion of irrigated area in western India with severe drought stress. Meanwhile, the mean potential yield of irrigated rice was simulated to rise. This weakened the negative effect of the decrease in the yield of rainfed rice, and enhanced stabilization of the paddy field ecosystem to resist drought in western India.
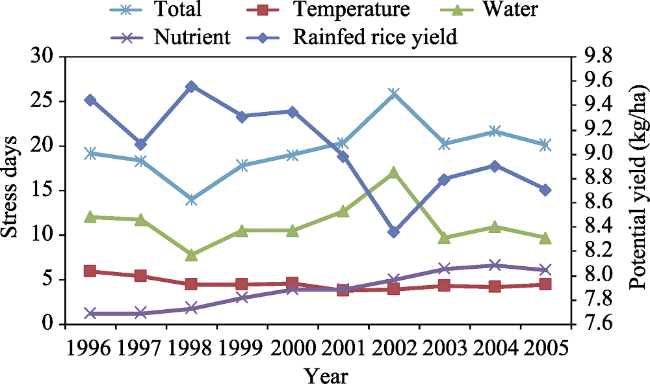
Figure 7 Potential yields and stress days of rainfed rice in the BIM region during the growing seasons of 1996-2005
The yield gap of super hybrid rice caused by insufficient irrigation (△Yirr) was obtained by subtracting Y2000 from Yirr, and the yield gap caused by insufficient fertilization (△Yfer) was obtained by subtracting Yirr from Ymax based on the cross-sectional data in 2000. Increased yields by two types of agriculture inputs in different states are shown in Figure 8. It can be seen that the growth of rice was not restricted by the current level of irrigation and fertilization in the southeast coastal area of the India Peninsula, the central eastern part of the Indo-Gangetic Plain, Bangladesh and the Ayeyarwady Delta. Rice growth was limited by a single leading stress factor, due to Liebig’s law of the minimum.
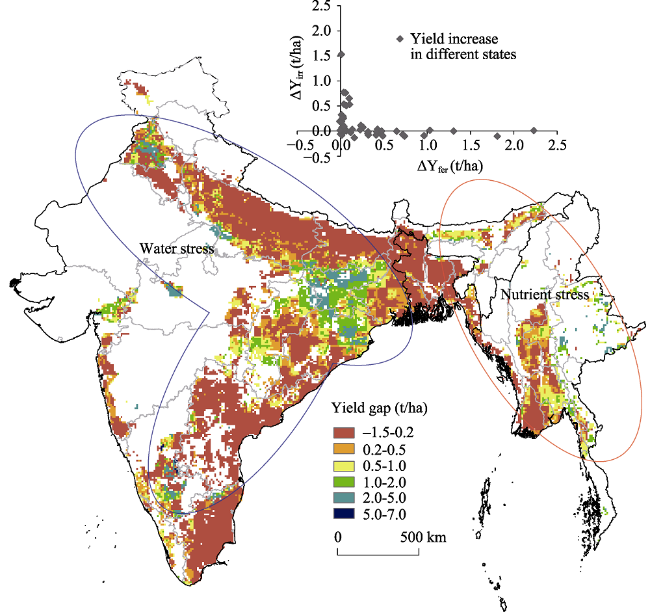
Figure 8 Simulated yield gaps of super hybrid rice between Y2000 and Ymax in the BIM region
At a national scale, water stress in India, nutrient stress in Myanmar and no obvious stress in Bangladesh limited the growth of super hybrid rice with irrigation and fertilization in 2000. At a regional scale, rice yields in the west of the BIM region were mainly restricted by water stress. This included the northeastern and southwestern Deccan Plateau and the northwestern Indo-Gangetic Plain. The average increase of rice yields was 0.58 t/ha and reached a maximum of 6.53 t/ha by developing irrigation. Paddy fields in the northeastern Deccan Plateau were mainly rainfed and the distribution area of irrigated farmland was less than 50 ha/100 km2. The northwest of India, especially Punjab, had a high proportion of irrigated area, but low precipitation caused the rice to grow under water stress. Rice yields in the east of the BIM region were mainly restricted by nutrient stress. This included northeastern India, especially Assam, and the plain areas in central and southern Myanmar. The average increase of rice yields was 0.69 t/ha and could reach 5.34 t/ha at most by improving nitrogen fertilization. These areas had sufficient hydrothermal resources or better irrigation equipment, but the soils lacked nutrients and the rate of nitrogen fertilizer utilization was only 66 kg/ha in the east of the BIM region, which caused the rice to grow under nutrient stress.

5 Discussion

5.1 Evaluation of simulation methods

When new varieties of hybrid rice are introduced into an area, regional experiments for new varieties need to be conducted locally. However, much labor, finance and time are needed for field experiments, and the representativeness of the experimental site on the regional scale is also questionable.
This study therefore selected two varieties of super hybrid rice that have been tested extensively in China, and regional experimental sites were screened to be close to the climate and soil environments in the rainy season in the main rice-producing area of the BIM region. Then, the crop growth parameters of the EPIC model were calibrated. The optimum sowing time and harvest time of super hybrid rice in the study region were calculated from PHUs and model simulation in a rice growing season. Simulation by the EPIC model in different scenarios was based on the actual irrigation and fertilization levels in the BIM region. Localization of cultivation was fully considered during the model operation process. However, there were still differences in climate between the 18 selected Chinese experimental sites and the BIM region. For example, the average daily minimum temperature of the rice growing season in the BIM region was higher than in China, and precipitation in the tropical monsoon climate zone of Myanmar was also higher than for any regional experimental stations in China. Another problem was that it is difficult for a single ecological process model to accurately describe all characteristics of rice growth, especially super hybrid rice resistance to frequent occurrences of drought, waterlogging, specific plant diseases and insect pests in the BIM region. The effects of natural disasters on the growth characteristics and yields of super hybrid rice require further study.

5.2 Rice potential yields in Bangladesh, India and Myanmar

Many studies have investigated rice potential yields in South and Southeast Asia. Field experimental data of the International Rice Research Institute and the Philippine Rice Research Institute under ideal conditions showed that the potential yield of conventional high-yield rice in Asia tropical lowlands with irrigation was 9.90±0.30 t/ha and the potential yield of indica hybrid rice was 10.80±0.40 t/ha (Peng et al., 1999), which is similar to the potential yield of super hybrid rice simulated by the EPIC model in this study. Foley et al. (2011) and Mueller et al. (2012) estimated the potential yield of rice in Bangladesh and India to be 4.98 t/ha and Myanmar to be 5.85 t/ha by counting the high yield record in a relatively homogeneous region. Waddington et al. (2010) used similar methods to estimate the potential yield of rice cropping systems and rice-wheat rotation systems to be 6.98 t/ha and 6.23 t/ha, respectively, in South Asia. Neumann et al. (2010) used a stochastic frontier production function to analyze potential yields and yield gaps of global rice. The spatial distribution trend of potential yields in BIM countries was consistent with this research. Nevertheless, yields estimated by Neumann et al. (2010) were lower than the simulation results from the EPIC model in this study. Wart et al. (2013) and Ittersum et al. (2013) conducted upscaling research of results from field experiments and model simulation based on agroclimatic regions. They found that rice potential yield in Bangladesh was 11.98 t/ha under irrigation condition in a growing season, differing to the simulation result in this study by only 2%, while rice potential yield in India was 9.01 t/ha, which is 20% lower than the present result.
Potential yields estimated by empirical statistical methods, such as investigation of actual yields and analysis of boundary functions, are significantly lower than the results from the EPIC model in this study. Potential yields estimated by field experiments and upscaling research with multiple models are equal to or slightly higher than the results from the EPIC model. Rice is affected by more factors in an actual production activity compared with ideal experiments and models. Waddington et al. (2010) conducted a survey of 672 global agricultural experts and found that in addition to lack of fertilization and nutrient management, low price of rice products, plant diseases, insect pests and inappropriate pest management were also important factors affecting rice yields of lowland farming system in Southeast Asia. Weed competition and soil fertility degradation were the most important factors in South Asian rice farming systems and rice-wheat rotation systems. When empirical statistics were used to calculate yield potential, they did not distinguish and extract the effects of these factors, especially the influence of socio-economic factors on rice yield gap at a local scale. In addition, the potential yield of super hybrid rice simulated by the EPIC model was not significantly higher than that of Bangladesh and Myanmar. This shows that introducing super hybrid rice Fyou498 and Fengliangyou4 may not be able to increase the upper limit of the potential local rice yield in Bangladesh and Myanmar.

5.3 Closing yield gaps

If the countries in the BIM region make efforts to promote super hybrid rice, improve irrigation facilities and increase fertilization, the maximum total production of rice in a rainy season could be increased to 2.47 times as much as the actual production in 2000. Obviously, the BIM region has a great potential for increasing rice production. Nevertheless, it is not only a technical problem, but also a socio-economic problem to close the yield gap between actual and potential production of rice (Godfray et al., 2010).
Many farmers in the BIM region are unable to purchase suitable hybrid rice seeds and learn essential cultivation techniques. There are also few channels to transport rice products to a large consumption market after harvesting rice. Furthermore, when the cost of irrigation, fertilization and seeds is too high, farmers will choose to cultivate low-yield rice according to an input-output ratio. For instance, chemical fertilizers, pesticides and agricultural machinery mostly rely on imports due to limited agricultural production technology in Myanmar, which leads to high costs of rice cultivation. But the price of rice products is low, so farmers in Myanmar are unwilling to cultivate high-yield rice because of the additional costs involved. Compared with India and Bangladesh, field management in Myanmar is more extensive with sparsely populated land. This causes the growth of rice in Myanmar to be generally under the condition of nutrient stress. In recent years, the use of chemical fertilizers and pesticides has not increased. The rate of nitrogen fertilization to rice production was only 16% of that in China.
Finally, closing yield gaps can significantly improve the capacity of food supply, but it will have uncertain impacts on the environment. Rice production has important external effects, such as a large amount of greenhouse gases (e.g., methane and nitrous oxide) can be released by paddy fields (Smith et al., 2008), soil nutrient wastage and degradation can be caused by surfeit use of fertilizer, water eutrophication can result from excess nutrients entering groundwater and lakes, with runoff and local ecological security threatened by inappropriate land use and farmland management (MEA, 2005). Therefore, to improve the practical value of research results, it is necessary to strengthen yield gap mechanisms formed by the decision-making behavior of farmers. In addition to analysing the direct factors leading to low yield, such as management and investment level, farming practices combined with societal, economic and ecologic factors should be comprehensively analyzed, to provide scientific support for food security and agricultural development strategies in the BIM region (Fan et al., 2011).

6 Conclusions

This study has calibrated rice growth parameters of the EPIC/GEPIC model. These were based on southern Chinese regional experimental data of super hybrid rice and simulated spatial distribution of super hybrid rice potential yields in the BIM region in rainy seasons, under different scenarios, during 1996-2005. The following conclusions were obtained:
(1) Mean potential yields with irrigation and fertilization in 2000, sufficient irrigation, sufficient irrigation and ideal fertilization were 10.22 t/ha, 10.70 t/ha and 11.33 t/ha, respectively, in the BIM region during 1996-2005. States with the highest potential yields were Goa, Karnataka, Tamil Nadu and Assam in India, and Sylhet in Bangladesh.
(2) Under sufficient irrigation and ideal fertilization conditions, Chinese super hybrid rice could increase total production by 227.71 million tons in a rainy season in the BIM region according to EPIC model results. The southeast coast of the India Peninsula, the east of the Ganges Plain and the Ayeyarwady Delta have larger spaces to increase rice total production in a rainy season. If super hybrid rice is planted in the study region, climatic potential utilization of rice is expected to exceed 25%.
(3) Water stress in India, nutrient stress in Myanmar and no obvious stress in Bangladesh limited the growth of super hybrid rice with irrigation and fertilization in 2000. It is necessary to further improve irrigation equipment to meet the water consumption of high-yield rice in the Deccan Plateau and northwestern India and increase fertilization in Myanmar and northeastern India.

The authors have declared that no competing interests exist.

[1]
Basak J K, Ali M A, Islam M N et al.Islam M N , 2010. Assessment of the effect of climate change on boro rice production in Bangladesh using DSSAT model.Journal of Civil Engineering, 38(2): 95-108.

[2]
Batjes N H, 2008. ISRIC-WISE Harmonized Global Soil Profile Dataset (Ver.3.1). Report 2008/02, ISRIC - World Soil Information, Wageningen (with data set, available at www.isric.org).

[3]
Batjes N H, 2015. World Soil Property Estimates For Broad-Scale Modelling (WISE30sec). Report 2015/01, ISRIC - World Soil Information, Wageningen (with data set, available at www.isric.org).

[4]
Chen L, Hu J Y, Hmwe Het al., 2014. Current status and developing strategy of hybrid rice in Myanmar.Hybrid Rice, 29(2): 78-83. (in Chinese)The rice production and the current status of hybrid rice including its developing process,breeding,seed production and expansion in Myanmar were introduced. Based on the analysis of the existing barriers in developing hybrid rice,the strategy was put forward to enhance the development of hybrid rice in Myanmar.

[5]
Danielson J J, Gesch D B, 2011. Global multi-resolution terrain elevation data 2010 (GMTED2010). US Geological Survey (with data set, available at https://topotools.cr.usgs.gov/gmted_viewer).

[6]
Das L, Lohar D, Sadhukhan I et al.Sadhukhan I , 2007. Evaluation of the performance of ORYZA2000 and assessing the impact of climate change on rice production in Gangetic West Bengal.Journal of Agrometeorology, 9(1): 1-10.

[7]
Fan L, Lu C H, Chen Z, 2011. A review on crop yield gaps and the causes.Journal of Natural Resources, 26(12): 2155-2166. (in Chinese)Yield gap is the difference between actual yield and potential yield of a crop.Research on yield gap is to survey the magnitude and regional variation of crop yield gaps,analyze the causes and seek measures to narrow or close the gap.Yield gap means the chance for agricultural development.Understanding the magnitude of yield gap and potential to increase crop yield is of great importance for improving food production to meet the growing food demand.This paper firstly discussed the definition and methods of yield gap,and then presented yield gaps of wheat,maize,rice and soybean in the world and in China by literature study.Followed in third section,the factors and their contribution to the yield gap were identified,including meteorological hazards,crop species,water and nutrients,disease,pest and weeds,soil and crop management,and agro-technologies,as well as economic and policy factors.Finally,future research focuses of yield gaps were discussed.

[8]
Fan L, Lu C H, Chen Z, 2012. A review of EPIC model and its applications.Progress in Geography, 31(5): 584-592. (in Chinese)Crop growth model is a useful tool for quantitative evaluation of crop production potentials.Since its study was first published in 1985,EPIC model has been widely used in the world because of its powerful functionality.In this paper,the main structure,function and data requirements were firstly summarized,and then the model applications in the world and China were reviewed.In China,since the first application in 2001,the EPIC model was used to evaluate crop yield potentials,quantify effects of irrigation and climate change on crop production,estimate nutrient losses and soil carbon storage,and predict soil losses.Finally,a brief discussion and suggestions were given on the model use.

DOI

[9]
Foley J A, Ramankutty N, Brauman K A ,et al.2011. Solutions for a cultivated planet.Nature, 478(7369): 337.

DOI

[10]
Gassman P W, Williams J R, Benson V W,et al. 2005. Historical Development and Applications of the EPIC and APEX Models. Center for Agricultural & Rural Development Publications.

[11]
Godfray H C J, Beddington J R, Crute I R , et al.2010. Food security: The challenge of feeding 9 billion people.Science, 327(5967): 812-818.Continuing population and consumption growth will mean that the global demand for food will increase for at least another 40 years. Growing competition for land, water, and energy, in addition to the overexploitation of fisheries, will affect our ability to produce food, as will the urgent requirement to reduce the impact of the food system on the environment. The effects of climate change are a further threat. But the world can produce more food and can ensure that it is used more efficiently and equitably. A multifaceted and linked global strategy is needed to ensure sustainable and equitable food security, different components of which are explored here. 2010 American Association for the Advancement for Science. All Rights Reserved.

DOI PMID

[12]
Guilpart N, Grassini P, Sadras V O ,et al.2017. Estimating yield gaps at the cropping system level.Field Crops Research, 206: 21-32.Yield gap analyses of individual crops have been used to estimate opportunities for increasing crop production at local to global scales, thus providing information crucial to food security. However, increases in crop production can also be achieved by improving cropping system yield through modification of spatial and temporal arrangement of individual crops. In this paper we define the cropping system yield potential as the output from the combination of crops that gives the highest energy yield per unit of land and time, and the cropping system yield gap as the difference between actual energy yield of an existing cropping system and the cropping system yield potential. Then, we provide a framework to identify alternative cropping systems which can be evaluated against the current ones. A proof-of-concept is provided with irrigated rice-maize systems at four locations in Bangladesh that represent a range of climatic conditions in that country. The proposed framework identified (i) realistic alternative cropping systems at each location, and (ii) two locations where expected improvements in crop production from changes in cropping intensity (number of crops per year) were 43% to 64% higher than from improving the management of individual crops within the current cropping systems. The proposed framework provides a tool to help assess food production capacity of new systems (e.g.with increased cropping intensity) arising from climate change, and assess resource requirements (water and N) and associated environmental footprint per unit of land and production of these new systems. By expanding yield gap analysis from individual crops to the cropping system level and applying it to new systems, this framework could also be helpful to bridge the gap between yield gap analysis and cropping/farming system design.

DOI PMID

[13]
Harris I, Jones P D, Osborn T J ,et al .2014. Updated high-resolution grids of monthly climatic observations: The CRU TS3.10 Dataset.International Journal of Climatology, 34(3): 623-642.

DOI

[14]
Hirose T, 2005. Development of the Monsi-Saeki theory on canopy structure and function.Annals of Botany, 95(3): 483-494.Monsi and Saeki (1953) published the first mathematical model of canopy photosynthesis that was based on the light attenuation within a canopy and a light response of leaf photosynthesis. This paper reviews the evolution and development of their theory. Monsi and Saeki showed that under full light conditions, canopy photosynthesis is maximized at a high leaf area index (LAI, total leaf area per unit ground area) with vertically inclined leaves, while under low light conditions, it is at a low LAI with horizontal leaves. They suggested that actual plants develop a stand structure to maximize canopy photosynthesis. Combination of the Monsi-Saeki model with the cost-benefit hypothesis in resource use led to a new canopy photosynthesis model, where leaf nitrogen distribution and associated photosynthetic capacity were taken into account. The gradient of leaf nitrogen in a canopy was shown to be a direct response to the gradient of light. This response enables plants to use light and nitrogen efficiently, two resources whose supply is limited in the natural environment. The canopy photosynthesis model stimulated studies to scale-up from chloroplast biochemistry to canopy carbon gain and to analyse the resource-use strategy of species and individuals growing at different light and nitrogen availabilities. Canopy photosynthesis models are useful to analyse the size structure of populations in plant communities and to predict the structure and function of future terrestrial ecosystems.

DOI PMID

[15]
Hu J Y, Jiang A Q, 2010. Current status and developing strategy of hybrid rice in India.Hybrid Rice, 25(3): 82-87. (in Chinese)This paper presented the current status quo of hybrid rice in India from the breeding,seed production and extension and the existing problems and barriers,based on which the corresponding countermeasures were put forward.

[16]
Hu J Y, Jiang A Q, Jiang X G, 2011. Current status and developing strategy of hybrid rice in Bangladesh.Hybrid Rice, 26(3): 76-81. (in Chinese)

[17]
Ittersum M K V, Cassman K G, Grassini P,et al.2013. Yield gap analysis with local to global relevance: A review.Field Crops Research, 143(1): 4-17.Yields of crops must increase substantially over the coming decades to keep pace with global food demand driven by population and income growth. Ultimately global food production capacity will be limited by the amount of land and water resources available and suitable for crop production, and by biophysical limits on crop growth. Quantifying food production capacity on every hectare of current farmland in a consistent and transparent manner is needed to inform decisions on policy, research, development and investment that aim to affect future crop yield and land use, and to inform on-ground action by local farmers through their knowledge networks. Crop production capacity can be evaluated by estimating potential yield and water-limited yield levels as benchmarks for crop production under, respectively, irrigated and rainfed conditions. The differences between these theoretical yield levels and actual farmers yields define the yield gaps, and precise spatially explicit knowledge about these yield gaps is essential to guide sustainable intensification of agriculture. This paper reviews methods to estimate yield gaps, with a focus on the local-to-global relevance of outcomes. Empirical methods estimate yield potential from 90 to 95th percentiles of farmers yields, maximum yields from experiment stations, growers yield contests or boundary functions; these are compared with crop simulation of potential or water-limited yields. Comparisons utilize detailed data sets from western Kenya, Nebraska (USA) and Victoria (Australia). We then review global studies, often performed by non-agricultural scientists, aimed at yield and sometimes yield gap assessment and compare several studies in terms of outcomes for regions in Nebraska, Kenya and The Netherlands. Based on our review we recommend key components for a yield gap assessment that can be applied at local to global scales. Given lack of data for some regions, the protocol recommends use of a tiered approach with preferred use of crop growth simulation models applied to relatively homogenous climate zones for which measured weather data are available. Within such zones simulations are performed for the dominant soils and cropping systems considering current spatial distribution of crops. Need for accurate agronomic and current yield data together with calibrated and validated crop models and upscaling methods is emphasized. The bottom-up application of this global protocol allows verification of estimated yield gaps with on-farm data and experiments.

DOI

[18]
Liu J, 2009. A GIS-based tool for modelling large-scale crop-water relations.Environmental Modelling & Software, 24(3): 411-422.Recent research on crop-water relations has increasingly been directed towards the application of locally acquired knowledge to answering the questions raised on larger scales. However, the application of the local results to larger scales is often questionable. This paper presents a GIS-based tool, or a GEPIC model, to estimate crop water productivity (CWP) on the land surface with spatial resolution of 30 arc-min. The GEPIC model can estimate CWP on a large-scale by considering the local variations in climate, soil and management conditions. The results show a non-linear relationship between virtual water content (or the inverse of CWP) and crop yield. The simulated CWP values are generally more sensitive to three parameters, i.e. potential harvest index for a crop under ideal growing conditions (HI), biomass-energy ratio indicating the energy conversion to biomass (WA), and potential heat unit accumulation from emergence to maturity (PHU), than other parameters. The GEPIC model is a useful tool to study crop-water relations on large scales with high spatial resolution; hence, it can be used to support large-scale decision making in water management and crop production.

DOI

[19]
Liu J, Williams J R, Zehnder A J B,et al. 2007. GEPIC-modelling wheat yield and crop water productivity with high resolution on a global scale.Agricultural Systems, 94(2): 478-493.With population growth and economic development, the agricultural sector is facing the challenge to produce more food with less water. Crop water productivity (CWP) is important for understanding water–food relationships. It also provides a basis for the assessment of water use efficiency embodied in global food trade. However, traditional methods are not sufficient for estimating CWP on a global scale considering large spatial and temporal variations across different geographical locations. In this paper, a GIS-based EPIC model (GEPIC) is developed and tested to estimate wheat ( Triticum aestivum L.) yield and CWP at a grid resolution of 30′ on the land surface. A comparison between simulated yields and FAO statistical yields in 102 countries over 10 years shows a good agreement. The simulated CWP is also mostly in line with the CWP reported in the literature. The simulation results show that compared with rainfed wheat, irrigated wheat has higher frequencies for high CWP (>0.8 kg m 613) and lower frequencies for low CWP (<0.8 kg m 613). This is likely because irrigation can provide timely water supply to crop development and the management of irrigated crops is usually more intensive than in rainfed production. A strong linear relation is found between CWP and yield. High wheat yield and CWP appear in the European countries, especially those in western and northern Europe. Low wheat yield and CWP are seen in most African countries. The simulation using GEPIC, however, shows that wheat yield and CWP in many African countries could increase substantially with sufficient water supply and fertilizer application. Variations in CWP across countries suggest that global water use could be reduced through food trade. Calculations indicate a saving of 77 × 10 9 m 3 of water in 2000 through international wheat trade as a result of relatively high CWP in major exporting countries. However, the simulation results also suggest that an overall improvement in CWP through better crop management practices in local areas could make a greater contribution to the reduction in global water use.

DOI

[20]
Meinardus A, 1992. EPIC: Erosion productivity impact calculator.International Journal of Computer Vision, 9(1): 5-11.

[21]
Millennium EcosystemAssessment (MEA), 2005. Ecosystems and Human Well-being: Synthesis. Washington DC: Island Press.

[22]
Monteith J L, Moss C J, 1977. Climate and the efficiency of crop production in Britain [and Discussion].Philosophical Transactions of the Royal Society of London, 281(980): 277-294.

DOI

[23]
Mueller N D, Gerber J S, Johnston M, et al.2012. Closing yield gaps through nutrient and water management.Nature, 490(7419): 254-257.

DOI

[24]
Neumann K, Verburg P H, Stehfest E,et al. 2010. The yield gap of global grain production: A spatial analysis.Agricultural Systems, 103(5): 316-326.Global grain production has increased dramatically during the past 50 years, mainly as a consequence of intensified land management and introduction of new technologies. For the future, a strong increase in grain demand is expected, which may be fulfilled by further agricultural intensification rather than expansion of agricultural area. Little is known, however, about the global potential for intensification and its constraints. In the presented study, we analyze to what extent the available spatially explicit global biophysical and land management-related data are able to explain the yield gap of global grain production. We combined an econometric approach with spatial analysis to explore the maximum attainable yield, yield gap, and efficiencies of wheat, maize, and rice production. Results show that the actual grain yield in some regions is already approximating its maximum possible yields while other regions show large yield gaps and therefore tentative larger potential for intensification. Differences in grain production efficiencies are significantly correlated with irrigation, accessibility, market influence, agricultural labor, and slope. Results of regional analysis show, however, that the individual contribution of these factors to explaining production efficiencies strongly varies between world-regions.

DOI

[25]
Peel M C, Finlayson B L, Mcmahon T A, 2007. Updated world map of the Köppen-Geiger climate classification.Hydrology & Earth System Sciences, 11(3): 259-263.

[26]
Peng S, Cassman K G, Virmani S S,et al. 1999. Yield potential trends of tropical rice since the release of IR8 and the challenge of increasing rice yield potential.Crop Science, 39(6): 1552-1559.

DOI

[27]
Priya S, Shibasaki R, 2001. National spatial crop yield simulation using GIS-based crop production model.Ecological Modelling, 136(2/3): 113-129.Traditional decision support systems based on crop simulation models are normally site-specific. In policy formulation, however, spatial variability of crop production often need to be evaluated due to different soil conditions, weather conditions and agricultural practices within a target-region. To address the spatial variability, a spatial model ‘Spatial EPIC’ was developed based on a crop simulation model EPIC (Erosion Productivity Impact Calculator). Since site-specific crop simulation models require point-based or fine resolution data, it is necessary to feed the fine resolution data at each grid-cell in order to ‘spatialize’ crop simulation models. The authors proposed a method to generate fine resolution data from coarse resolution data, which are usually available at regional or national level. In addition, since the original EPIC crop management practices are static in nature, a dynamic adaptation loop is added to evaluate the impacts of agricultural practice changes over temporal scale. Validation of the spatial EPIC was conducted at different spatial scales, i.e. national scale (approx. 50 km cell-size) and regional scale (approx. 10 km cell-size) in India. Results showed that at both resolutions level crop yield varied significantly as a function of seasonal climatic variation, soil water holding characteristics and applied crop management strategies. Also, the study successfully demonstrated model applicability in evaluating an impact of climate changes over major cereal crops productivity at national level taking spatial variability into account.

DOI

[28]
Smith P, Martino D, Cai Z,et al. 2008. Greenhouse gas mitigation in agriculture.Philosophical Transactions of the Royal Society of London, 363(1492): 789-813.

DOI

[29]
Spielman D J, Kolady D E, Ward P S, et al. 2012. Public expenditures, private incentives, and technology adoption: The economics of hybrid rice in South Asia. IFPRI Discussion Paper No.01233. Available at SSRN: .

[30]
Subash N, Mohan H S R, 2012. Evaluation of the impact of climatic trends and variability in rice-wheat system productivity using Cropping System Model DSSAT over the Indo-Gangetic Plains of India.Agricultural & Forest Meteorology, 164(164): 71-81.Indo-Gangetic Plains (IGP), accountable for the region's food security, has undergone climatic fluctuations and variability during the last three decades under the influence of natural or fast trend of population growth, urbanization and industrial development. The objective of this study is to understand the trends of climatic variables over 5 selected locations during the last 25–30 years and the variability of recorded and simulated rice–wheat system yield using DSSAT-CSMv4.5. There was no significant change in rainfall over the years in both the rice and the wheat growing seasons at all the sites except Hisar. The annual change in the rainfall trend was 6128.9mm/year (P<0.05) and during the rice season it was 6120.5mm/year (P<0.01) for Hisar. Incidentally, higher coefficient of variation of 79% has been noticed in annual rainfall. The district average yields of rice varied from 0.9t/ha at Samastipur to 3.8t/ha at Ludhiana. Rice yields decreased from the west to east IGP. The time trend of rice yield ranged from 610.023t/ha per year at Samastipur to 0.055t/ha per year in Faizabad. Negative trends were observed in Samastipur and was statistically significant (P<0.05). In wheat, the yield trend ranged from 0.01t/ha per year at Samastipur to 0.096t/ha per year in Hisar. All the sites had a positive yield trend and at three stations (Hisar, Faizabad and Kanpur) have significant positive trends (P<0.05). Wheat yields appeared to be increasing throughout the IGP. The comparison of observed and simulated rice and wheat yield shows that there is very good agreement between them based on Spearman correlation coefficient (rs), significant at P<0.05 level for all the sites except Samastipur. Thus DSSAT-CSMv4.5 can be used for determining the impact of climatic variability on rice–wheat productivity.

DOI

[31]
Timsina J, Wolf J, Guilpart N,et al. 2016. Can Bangladesh produce enough cereals to meet future demand? Agricultural System,.

[32]
Waddington S R, Li X, Dixon J,et al. 2010. Getting the focus right: production constraints for six major food crops in Asian and African farming systems.Food Security, 2(1): 27-48.To determine the most important production constraints and associated yield losses for six major food crops in 13 farming systems with high poverty in Sub-Saharan Africa, South Asia and East Asia, surveys were conducted with 672 experts representing a diversity of backgrounds and experience. Respondents reported large gaps between highest achieved crop yield on smallholder farms and average yield on farm. Yield gaps were smallest for rice (about 60% of current average smallholder farm grain yields), mid size for wheat and cassava, and larger (sometimes double current farm yields) for sorghum, cowpea and chickpea. Gaps were also smaller in the high input and yield farming systems of East Asia and largest in the marginal, drier systems, particularly in Sub-Saharan Africa. Four categories of production constraint (abiotic, biotic, management and socio-economic) were considered important contributors to yield gaps. A diversity of specific constraints was reported for the crops in the different systems. The most severe and widespread specific constraints for wheat involved the deficiency, high cost and poor management of N fertilizer, and problems associated with drought stress at grain filling, mid season drought and irrigation management. Those for rice included N fertilizer problems, soil fertility depletion, various leaf, stem and head pests and diseases, weed competition and inadequate water management. Striga and weed competition, soil resource degradation, poor soil fertility management, and drought were the most severe specific constraints for sorghum. Insect pests of pod, leaf, stem and flower and the high cost of their control dominated the constraint set for cowpea. Helicoverpa pod borer, Botrytis grey mould and control costs were the most severe for chickpea. Unsuitable varieties/poor seed, soil infertility and fertilizer constraints were also widespread with the legumes. Marketing problems and lack of finance were concerns for cassava along with weed competition, African cassava mosaic virus and poor varieties/planting materials. The findings can help to inform priority setting for international agricultural research and development activities on important food crops in major farming systems occupying areas of high poverty.

DOI

[33]
Wart J V, Bussel L G J V, Wolf J,et al. 2013. Use of agro-climatic zones to upscale simulated crop yield potential.Field Crops Research, 143(1): 44-55.Yield gap analysis, which evaluates magnitude and variability of difference between crop yield potential (Yp) or water limited yield potential (Yw) and actual farm yields, provides a measure of untapped food production capacity. Reliable location-specific estimates of yield gaps, either derived from research plots or simulation models, are available only for a limited number of locations and crops due to cost and time required for field studies or for obtaining data on long-term weather, crop rotations and management practices, and soil properties. Given these constraints, we compare global agro-climatic zonation schemes for suitability to up-scale location-specific estimates of Yp and Yw, which are the basis for estimating yield gaps at regional, national, and global scales. Six global climate zonation schemes were evaluated for climatic homogeneity within delineated climate zones (CZs) and coverage of crop area. An efficient CZ scheme should strike an effective balance between zone size and number of zones required to cover a large portion of harvested area of major food crops. Climate heterogeneity was very large in CZ schemes with less than 100 zones. Of the other four schemes, the Global Yield Gap Atlas Extrapolation Domain (GYGA-ED) approach, based on a matrix of three categorical variables (growing degree days, aridity index, temperature seasonality) to delineate CZs for harvested area of all major food crops, achieved reasonable balance between number of CZs to cover 80% of global crop area and climate homogeneity within zones. While CZ schemes derived from two climate-related categorical variables require a similar number of zones to cover 80% of crop area, within-zone heterogeneity is substantially greater than for the GYGA-ED for most weather variables that are sensitive drivers of crop production. Some CZ schemes are crop-specific, which limits utility for up-scaling location-specific evaluation of yield gaps in regions with crop rotations rather than single crop species. (C) 2012 Elsevier B.V. All rights reserved.

DOI

[34]
Xiong W, Balkovič J, Velde M V D,et al. 2014. A calibration procedure to improve global rice yield simulations with EPIC.Ecological Modelling, 273(8): 128-139.Crop models are increasingly used to assess impacts of climate change/variability and management practices on productivity and environmental performance of alternative cropping systems. Calibration is an important procedure to improve reliability of model simulations, especially for large area applications. However, global-scale crop model calibration has rarely been exercised due to limited data availability and expensive computing cost. Here we present a simple approach to calibrate Environmental Policy Integrated Climate (EPIC) model for a global implementation of rice. We identify four parameters (potential heat unit – PHU, planting density – PD, harvest index – HI, and biomass energy ratio – BER) and calibrate them regionally to capture the spatial pattern of reported rice yield in 2000. Model performance is assessed by comparing simulated outputs with independent FAO national data. The comparison demonstrates that the global calibration scheme performs satisfactorily in reproducing the spatial pattern of rice yield, particularly in main rice production areas. Spatial agreement increases substantially when more parameters are selected and calibrated, but with varying efficiencies. Among the parameters, PHU and HI exhibit the highest efficiencies in increasing the spatial agreement. Simulations with different calibration strategies generate a pronounced discrepancy of 5–35% in mean yields across latitude bands, and a small to moderate difference in estimated yield variability and yield changing trend for the period of 1981–2000. Present calibration has little effects in improving simulated yield variability and trends at both regional and global levels, suggesting further works are needed to reproduce temporal variability of reported yields. This study highlights the importance of crop models’ calibration, and presents the possibility of a transparent and consistent up scaling approach for global crop simulations given current availability of global databases of weather, soil, crop calendar, fertilizer and irrigation management information, and reported yield.

DOI

[35]
You L, Wood-Sichra U, Fritz S,et al. 2017. Spatial Production Allocation Model (SPAM) 2005 v3.2. .

Outlines

/