Special Issue: Geopolitical Environment Simulation on the Belt and Road Region

Quantitative analysis of the impact factors of conventional energy carbon emissions in Kazakhstan based on LMDI decomposition and STIRPAT model

  • LI Jiaxiu , 1, 2, 3 ,
  • CHEN Yaning , 1, * ,
  • LI Zhi 1 ,
  • LIU Zhihui 2
Expand
  • 1. State Key Laboratory of Desert and Oasis Ecology, Xinjiang Institute of Ecology and Geography, CAS, Urumqi 830011, China
  • 2. College of Resource and Environment Science, Xinjiang University, Urumqi 830046, China
  • 3. College of Resources and Environment, University of Chinese Academy of Sciences, Beijing 100049, China
*Corresponding author: Chen Yaning, Professor, E-mail:

Author: Li Jiaxiu, PhD Candidate, specialized in climate change in central Asia. E-mail:

Received date: 2017-09-26

  Online published: 2018-07-20

Supported by

CAS Strategic Priority Research Program, No.XDA19030204

CAS Western Light Program, No.2015-XBQN-B-17

Copyright

Journal of Geographical Sciences, All Rights Reserved

Abstract

Quantitative analysis of the impact factors in energy-related CO2 emissions serves as an important guide for reducing carbon emissions and building an environmentally-friendly society. This paper aims to use LMDI method and a modified STIRPAT model to research the conventional energy-related CO2 emissions in Kazakhstan after the collapse of the Soviet Union. The results show that the trajectory of CO2 emissions displayed U-shaped curve from 1992 to 2013. Based on the extended Kaya identity and additive LMDI method, we decomposed total CO2 emissions into four influencing factors. Of those, the economic active effect is the most influential factor driving CO2 emissions, which produced 110.86 Mt CO2 emissions, with a contribution rate of 43.92%. The second driving factor is the population effect, which led to 11.87 Mt CO2 emissions with a contribution rate of 4.7%. On the contrary, the energy intensity effect is the most inhibiting factor, which caused -110.90 Mt CO2 emissions with a contribution rate of -43.94%, followed by the energy carbon structure effect resulting in -18.76 Mt CO2 emissions with a contribution rate of -7.43%. In order to provide an in-depth examination of the change response between energy-related CO2 emissions and each impact factor, we construct a modified STIRPAT model based on ridge regression estimation. The results indicate that for every 1% increase in population size, economic activity, energy intensity and energy carbon structure, there is a subsequent increase in CO2 emissions of 3.13%, 0.41%, 0.30% and 0.63%, respectively.

Cite this article

LI Jiaxiu , CHEN Yaning , LI Zhi , LIU Zhihui . Quantitative analysis of the impact factors of conventional energy carbon emissions in Kazakhstan based on LMDI decomposition and STIRPAT model[J]. Journal of Geographical Sciences, 2018 , 28(7) : 1001 -1019 . DOI: 10.1007/s11442-018-1518-5

1 Introduction

Climate warming has recently emerged as a focus of major international concern due to the increasing frequency of natural disasters attributed to climate anomalous change (Arnell and Gosling, 2016; Nicogossian et al., 2017; Mccarl et al., 2016; Sauer et al., 2017). Greenhouse gas emissions have been theorized as the leading cause in global climate anomalies. Studies indicate that CO2 contributes about 60% of all greenhouse gases, and its emissions source mainly comes from burning fossil fuels due to human activities (Tunç et al., 2009; Ozturk and Acaravci, 2010). Along with the increase in energy consumption, the total emissions of greenhouse gases will inevitably increase by a large margin.
In addressing this issue, many international seminars have been held to discuss possible solutions to the problem. The 4th IPCC Report in 2007 (IPCC, 2007) and the Bali conference (Caillaud et al., 2012) marked a shift in research focus from looking for evidence of climate abnormalities to exploring measures to respond appropriately to global climate change. Given the current drive in both developed and developing nations to institute low-carbon economies even while coping with climate-related problems, it is particularly important to reduce the growth rate of greenhouse gas emissions through formulating targeted policies and taking effective measures. In fact, finding ways to effectively reduce greenhouse gas emissions has been the frontier research hotspot. One of the key issues is to quantitatively analyze the influencing factors of CO2 emissions, which is directly related to low-carbon policy formulation and the measures implemented.
At present, there are numerous studies on carbon emissions researched from a variety of angles (Moutinho et al., 2015; Karatayev and Clarke, 2016; Karatayev et al., 2016; Parkhomchik and Syrlybayeva, 2016; Schandl et al., 2016; Wang and Li, 2016; Zhang et al., 2016; Ramlall, 2017; Wang et al., 2017b; Zhao et al., 2017). Among other topics, researchers have looked at the quantity of greenhouse gas emissions through establishing various theoretical and mathematical models (Streets et al., 2001; Swan et al., 2013; Tang, 2014), researched the influencing factors of carbon emissions through various metering methods (Tang, 2014; Lin and Beidari, 2015; Zhao et al., 2017), and studied different kinds of controlling policies and measures (Aggarwal and Jain, 2016; Meyers et al., 2016). All of the research seeks to find a mechanism for maximum reduction of greenhouse gas emissions while minimizing any negative impacts on economy.
Studies on the influencing factors of CO2 emissions mainly use two main decomposition methods, one is structural decomposition analysis (SDA) and the other is index decomposition analysis (IDA). Compared to SDA, IDA has more advantages and is widely used. Popular IDA methods include the IPAT model (Wang et al., 2011a), Kaya identity (Ang, 2015), and the Laspeyres decomposition method (Lu et al., 2014). In recent years, numerous scholars have applied these methods to analyze energy-related carbon emissions on both large and small scales (York et al., 2003; Lu et al., 2014; Meyers et al., 2016; Zhao et al., 2017). Some scholars also improved the methods in order to clarify the influence mechanism of carbon emissions. For instance, based on extended Kaya identity, Ang (2004) made the Logarithmic Mean Divisia Index (LMDI) decomposition method, which is easier to use, more adaptable, and better suited to results interpretation. Hence, this approach is now widely applied in several fields, especially in energy-related carbon emissions in industrial sectors (Wang et al., 2011b; Ouyang and Lin, 2015; Li and Wang, 2016; Wang et al., 2017b; Zhao et al., 2017). The other preferred approach is the IPAT model, which is used to quantitatively evaluate environmental pressure through three influencing factors: population size, per capita affluence, and technological level (Wang et al., 2011a). A few authors have improved this model. Such as, York et al. (2003) developed the STIRPAT strategy, which considers the individual influence of each factor on environment and eliminates the problem of the same proportional variation. This model is also widely used in energy-related carbon emissions. Lin et al. (2009) processed an empirical research based on the STIRPAT model and analyzed the environmental impact in China through five influencing factors, the result indicated that population was the largest potential driving factor on environmental variation. Wang et al. (2017a) used the extended STIRPAT model to examine the driving factors of energy-related carbon emissions from a regional perspective. Because energy-related carbon emissions is a key index for regional environment pressure, using the STIRPAT model to analyze the impact factors of carbon emissions is a good way to reflect regional environmental changes and can also provide constructive guidance for sustainable development of ecological environment.
Kazakhstan is a resource-rich country with abundant conventional energies, such as coal, oil and natural gas reserves (Ismailova, 2013). As an essential part of the Silk Road Economic Belt, it occupies an important position in the international energy market. In the first decade of the 21st century, Kazakhstan ranked among the top three countries in the world for accelerated economic growth rates, due mainly to this country’s energy production and consumption (Azatbek and Ramazanov, 2016; Kalyuzhnova and Patterson, 2016; Katenova and Nurmakhanova, 2017). It has gradually positioned itself as the economic engine in Central Asia.
However, along with the rapid economic development, Kazakhstan consumed more conventional energy and then exacerbated more CO2 emissions, with per capita CO2 emissions almost three times higher than the world average (Karatayev et al., 2016) (Figure 1). This has led to numerous energy-related environmental problems (Jiang and Feng, 2006; Xiong et al., 2015). The main cause underlying Kazakhstan’s growing environmental problems is that their industry relies on low-grade coal as the primary raw material. In other words, the energy consumption structure of Kazakhstan is still dominated by coal, with the contribution rates of coal, oil and gas pegged at 63.02%, 19.76% and 17.21%, respectively, to total CO2 emissions (Figure 2). The more energy consumed, the greater the amount of discharging CO2 emissions.
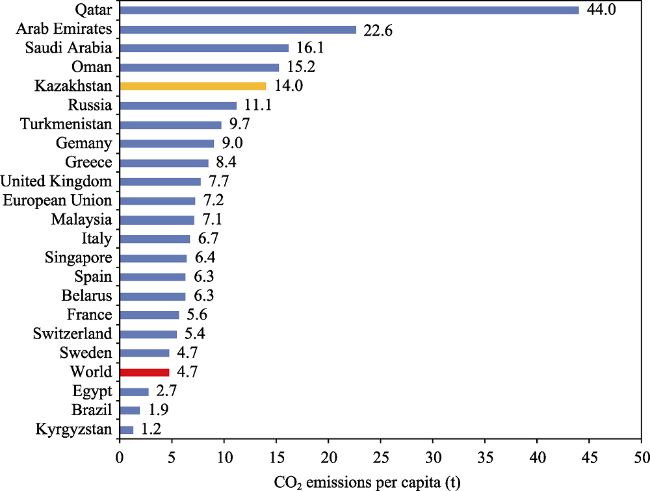
Figure 1 Per capita CO2 emissions rank in the world (Karatayev et al., 2016)
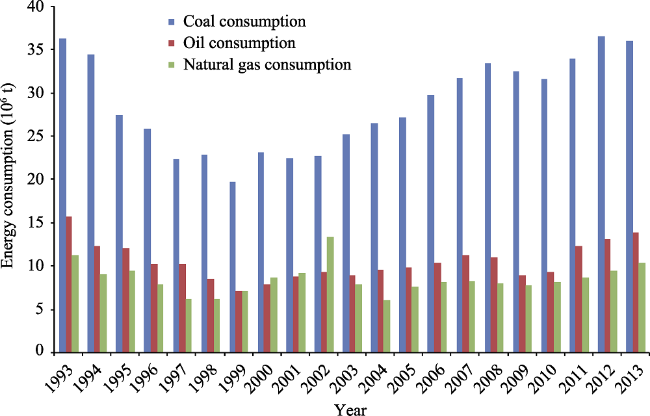
Figure 2 Consumptions of coal, oil and natural gas in Kazakhstan from 1993 to 2013
Kazakhstan, as one of the largest energy bases in the world, the previous studies on this country primarily focused on the national energy reserves and exploitation potentiality (Karatayev and Clarke, 2016; Parkhomchik and Syrlybayeva, 2016), energy geopolitics (Blank, 1995; Xu, 2010), energy multilateral cooperation (Bahgat, 2010; Movkebaeva, 2013) and energy production and exports (Yenikeyeff, 2008; Sarbassov et al., 2013). There was little interest in pursuing issues related to environmental pollution caused by energy consumption or the influence mechanism underscoring the country’s rapid economic growth. Some scholars did research CO2 emissions solely from the macroscopic perspective, but stopped short of quantitatively analyzing the impact mechanism. To bridge this research gap, the present article will quantitatively analyze the energy-related CO2 emissions in Kazakhstan from 1992 to 2013, through applying the LMDI decomposition method and a modified STIRPAT model. The modified STIRPAT can better reflect the efficiency change of each factor to total CO2 emissions. Our purpose in conducting this study is to provide basic theoretical support for more optimized socio-economic development and efficient energy use, as well as to provide a reference for policy formulation to adjust energy structure and achieve low-carbon sustainable development in Kazakhstan.

2 Data and methodologies

2.1 Study area and data

Kazakhstan is located in Central Asia with continental climate, to the north of Russia, to the east of China, to the west of Caspian, and to the south of Uzbekistan, Turkmenistan and Kyrgyzstan, it is the largest landlocked country in the world. This country is about 3000 km long from east to west, and 1700 km wide from north to south, with a territorial area of 271.73 ten thousand km2. Most of the territory is plain and lowland, and the east and southeast are Altai Mountains and Tianshan Mountains. Kazakhstan is rich in mineral resources, with the reputation of “energy and raw materials base” (Macgregor, 2017). The reserves and productions of oil and natural gas in Kazakhstan are just after Russia in the commonwealth of independent states, and oil and gas resources mainly distribute in Atyrau, Mangghsystau, Batysdy kazakstan, Aktube, Kyzylorda and Jambyl (Figure 3). Large oil fields concentrate in the western Mangrac peninsula and Caspian depression. Karakagana possesses the largest nature gas, and accounts for 70% of the total gas reserves in Kazakhstan. The storage of coal resource in Kazakhstan is third only to Russia and Ukraine, and accounts for 2.6% of the total coal reserves in the world (Karatayev et al., 2016). Coal mines are mainly distributed in Karaghandy, Pavlodar, Kostanay, Akmola and Shyghys kazakstan (Figure 3).
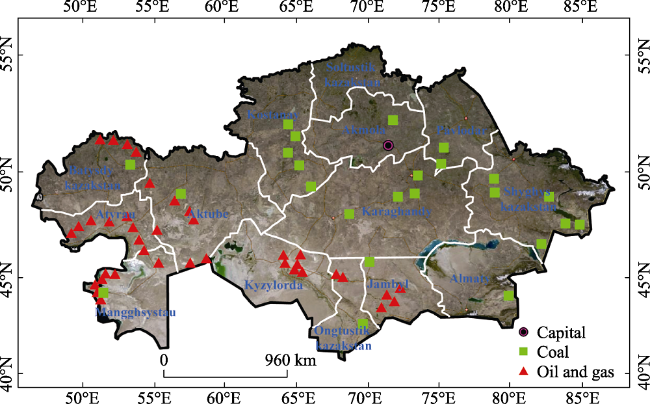
Figure 3 The spatial distribution of coal, oil and gas in Kazakhstan
The data for our research include carbon emissions, energy use, population and GDP, the study period is from 1992 to 2013 in Kazakhstan. The primary conventional energy resources include coal, oil and natural gas, and data on energy consumption of these three resources came directly from the Statistics Department of Kazakhstan (http://www.stat.gov.kz/). Energy-related carbon emissions data were downloaded from Carbon Dioxide Information Analysis Center (CDIAC) (http://cdiac.ess-dive.lbl.gov/), and converted to CO2 emissions simply multiply carbon emissions by 3.667, because per unit carbon burning in oxygen can generate about 3.667 times carbon dioxide. The population and GDP data were extracted from World Bank (http://www.worldbank.org/). We converted the current GDP data to the 2005 constant price in order to eliminate the influence of currency inflation. The total energy use data came from World Bank (http://www.worldbank.org/).

2.2 Methodologies

2.2.1 LMDI decomposition analysis
The LMDI decomposition model shares many features with Kaya identity, and the latter was proposed by Yoichi Kaya, a Japanese scholar (Kaya, 1990). Kaya identity has the advantages of simple mathematical form, as it has no residuals and features strong explanatory power on the change in carbon emissions (Kaya, 1990; Kaya and Yokobori, 1997). In the structure, CO2 emissions are associated with population expansion, energy utilization and economic development level. The relationship among these factors based on Kaya identity can be written as:
$C=\sum\limits_{j}{{{C}_{j}}}=\sum\limits_{j}{P}\times \frac{G}{P}\times \frac{E}{G}\times \frac{C}{E}=\sum\limits_{j}{P}\times A\times I\times S$ (1)
where C indicates the total CO2 emissions (106 tons), while P, G and E represent total population (104 people), gross domestic product (GDP) at the 2005 constant price (108 USD), and total energy consumption (104 tce), respectively. P, A, I and S express the population effect, economic active effect, energy intensity effect and energy carbon structure effect, respectively.
According to Ang’s research (2005), LMDI decomposition method is constructed based on Kaya identity, and includes two different calculation methods: additive LMDI method and multiplicative LMDI method (Wang et al., 2011b; Ang, 2015; Shao et al., 2016; Zhao et al., 2017). The results of these two methods are the same. This paper chose the additive LMDI method to research energy-related CO2 emissions in Kazakhstan as shown in the following equations:
$\Delta {{C}_{tot}}={{C}^{T}}-{{C}^{0}}=\Delta C_{pop}^{T}+\Delta C_{act}^{T}+\Delta C_{\operatorname{int}}^{T}+\Delta C_{str}^{T}$ (2)
$\Delta C_{pop}^{T}=\sum\limits_{j}{\frac{C_{j}^{T}-C_{j}^{0}}{\ln {{C}^{T}}-\ln {{C}^{0}}}\ln \frac{{{P}^{T}}}{{{P}^{0}}}}$ (3)
$\Delta C_{act}^{T}=\sum\limits_{j}{\frac{C_{j}^{T}-C_{j}^{0}}{\ln {{C}^{T}}-\ln {{C}^{0}}}\ln \frac{{{G}^{T}}}{{{G}^{0}}}}$ (4)
$\Delta C_{\operatorname{int}}^{T}=\sum\limits_{j}{\frac{C_{j}^{T}-C_{j}^{0}}{\ln {{C}^{T}}-\ln {{C}^{0}}}\ln \frac{{{I}^{T}}}{{{I}^{0}}}}$ (5)
$\Delta C_{str}^{T}=\sum\limits_{j}{\frac{C_{j}^{T}-C_{j}^{0}}{\ln {{C}^{T}}-\ln {{C}^{0}}}\ln \frac{{{S}^{T}}}{{{S}^{0}}}}$ (6)
where △Ctot means the total increment of CO2 emissions during the study period, and △Cpop, △Cact,Cint and △Cstr are the amounts of variation in CO2 emissions from four influencing factors of population effect, economic active effect, energy intensity effect and energy carbon structure effect, respectively.
2.2.2 Modified STIRPAT model construction
The initial environmental pressure model is the IPAT model proposed by Ehrlich and Holdren (1974) to measure the impact of socio-economic change on environmental pressure. In the acronym IPAT, I represents environmental impact (Impact), P is population size (Population), A denotes per capita affluence (Affluence), and T expresses technology level (Technology). In the traditional IPAT model, environmental pressure is driven by three factors: population, affluence and technology, this model provides very simplistic and effective analysis. However, its biggest defect is that it assumes the elasticity change rate is uniform for population, affluence and technology in relation to environment. That is to say, when any influencing factor increases or decreases by 1%, the environmental pressure likewise gives a 1% variation.
In order to make up for this defect, York et al. (2003) constructed a random STIRPAT model based on the IPAT approach. The model equation can be expressed as:
$I=a{{P}^{b}}{{A}^{c}}{{T}^{d}}e$ (7)
where the implications of I, P, A and T are in keeping with the IPAT model, meaning that they respectively stand for environmental impact, population size, per capita affluence and technology level. Thus, a represents the fit coefficient of the model; b, c and d are the indices of each explanatory variable; and e denotes the error term generated in the model construction. Introducing the indices of b, c and d can better compensate for the defect of proportional changes between the explained variable I and each driving factor. In other words, this model can be applied to analyze the unconstrained effect of independent variables for environmental pressure (Liu et al., 2015; Zhang and Liu, 2015).
The STIRPAT model is a nonlinear approach featuring multiple independent variables. In order to eliminate the larger fluctuant tendency of time series and to overcome the heteroscedasticity of the sequence, we first need to perform logarithmic processing on the original data. Hence, we take the logarithmic transformation of the Equation (7) and obtain the following model:
$\ln I=\ln a+b\ln P+c\ln A+d\ln T+\ln e$ (8)
Similarly, we use this equation to describe the influence mechanism of energy-related CO2 emissions. In our research, we use total CO2 emissions to represent the environmental impact, while the economic development level represents the affluence and the energy intensity represents the technology level. In addition, we expanded Equation (8) to add the influencing factor of energy carbon structure in order to examine the impact of energy structure change on CO2 emissions. However, if more renewable energy than traditional energy were to be used, the energy structure would improve and CO2 emissions would decrease. Therefore, Equation (9) can be rewritten as:
$\ln C=a+b\ln P+c\ln A+d\ln I+e\ln S+f$ (9)
where C represents total CO2 emissions; P represents population size (i.e., total population in Kazakhstan, 104 people); A represents economic development level as expressed by per capita GDP (USD/people, with the GDP converted to the 2005 constant price); I represents energy intensity, meaning energy consumption per GDP (tce/104 USD, where energy consumption is converted to ton of standard coal equivalent); and S represents the energy structure indicated by CO2 emissions per energy consumption (t/tce). Furthermore, a is the constant term, b, c, d and e denote elasticity coefficients of the explanatory variables to the explained variable, and f shows the error term. When each of P, A, I and S increases 1%, CO2 emissions correspondingly increase b%, c%, d% and e%, respectively.

3 Results and analysis

3.1 Trajectory of CO2 emissions in Kazakhstan

The trajectories of CO2 emissions and per capita emissions assumed similar variation trends in Kazakhstan during the study period (Figure 4). Both of them declined first and then rose except the year of 2008 and 2009. In other words, they displayed U-shaped curves from 1992 to 2013, with 1999 marking the decisive turning point.
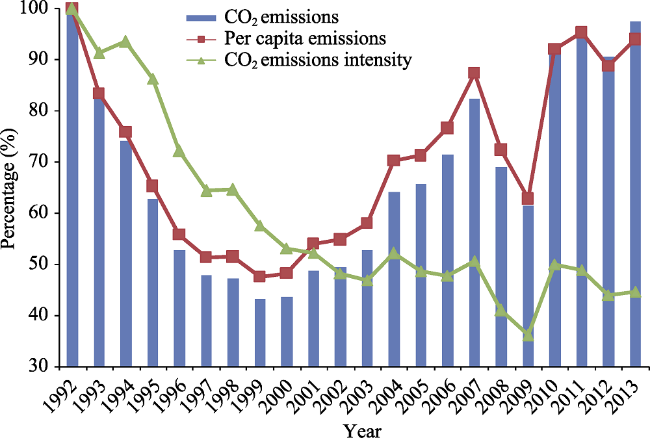
Figure 4 Trajectories of CO2 emissions, per capita emissions and carbon emissions intensity in Kazakhstan (using 1992 as the baseline year)
In general terms, CO2 emissions within the study region can be divided into two periods: 1992-1999 and 2000-2013. During the first stage of 1992 to 1999, CO2 emissions and per capita emissions decreased swiftly at an average annual growth rate of -11.3% and -10.1% respectively, due primarily to the disintegration of the Soviet Union in 1991. At the beginning of independence, Kazakhstan faced serious political and economic crises that were so profound that they prompted many people to emigrate to other countries (Rowland, 2001). This led to a sudden decrease in population of 1.51 million, or an approximate 9% reduction. The gross domestic product (GDP) correspondingly diminished by 105.8 billion USD, or approximately 25%. Amidst the poorly-performing economy and production difficulties, energy use also decreased 43 Mt (million tons), marking an astonishing 54% reduction (Figure 5). Making matters worse was the 1998 Asian financial crisis (Mao, 2014). All of which led to CO2 emissions rapidly decrease in this stage.
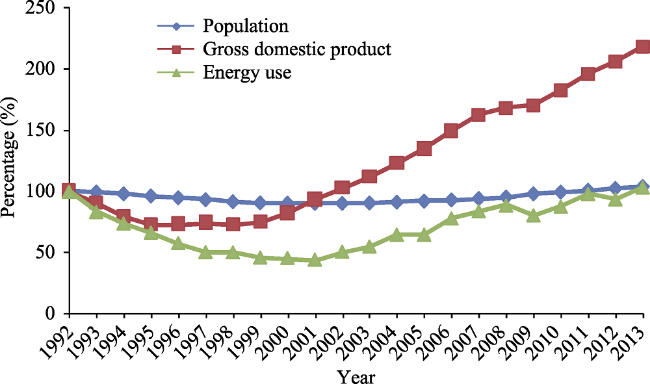
Figure 5 Change rates of population, GDP and energy use from 1992 to 2013 in Kazakhstan (using 1992 as the baseline year)
The second stage is from 2000 to 2013, during which CO2 emissions increased except in 1998, 1999 and 2012, with 2000 to 2007 seeing the fastest increase. Overall, CO2 emissions and per capita emissions increased 104 Mt and 6.42 t/people, with the average annual growth rates of 9.46% and 8.84%, respectively. Emissions fell again from 1998 to 1999 because of the global financial crisis happened in 1998 (Ruziev and Majidov, 2013), as the economic slump weakened the growth of energy consumption. Subsequently, CO2 emissions greatly reduced over those two years. After then, with drastic improvement in the international macro economy and financial environment, CO2 emissions again increased, but at a smaller rate. The European debt crisis during the first half of 2012 (Mao, 2014) also led to slight declines in CO2 and per capita emissions.
Carbon emissions intensity is described as CO2 emissions per unit of GDP growth. Interestingly, and despite the country’s emergence as an energy powerhouse, the carbon emissions intensity of Kazakhstan nearly charted a decrease for the period of 1992 to 2013. It was also affected by economic growth and took a similar course in carbon emissions from 1992 to 1999 and 2008 to 2013. However, it veered from that course between 2000 and 2007, when the economy and energy consumption rapidly increased while carbon emissions intensity decreased. This can be interpreted as the GDP increasing at a far greater rate than energy consumption, thus increasing total CO2 emissions but decreasing CO2 emissions per unit of GDP.

3.2 Additive LMDI decomposition of CO2 emissions

3.2.1 The effect and contribution rate of decomposition factors
In order to further explore the intrinsic influence mechanism in CO2 emissions and gauge the impact of each influencing factor in the two stages delineated above, we applied the additive LMDI method to decompose the total CO2 emissions into four influencing factors: population effect, economic active effect, energy intensity effect and energy carbon structure effect. Then we received the variation and contribution rate of each factor for each year. The decomposition results are shown in Table 1 and Figure 6.
Table 1 Contribution of each influencing factor of CO2 emissions in Kazakhstan (106 t)
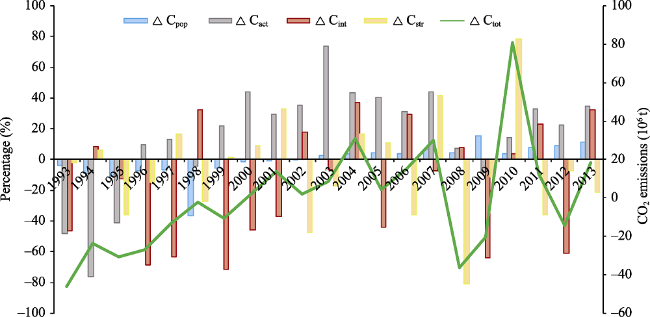
Time Period △Cpop △Cact △Cint △Cstr △Ctot
1992-1993 -1.63 -22.12 -21.42 -0.90 -46.06
1993-1994 -3.07 -25.45 2.87 2.15 -23.50
1994-1995 -3.23 -12.55 -3.94 -11.01 -30.73
1995-1996 -2.36 3.13 -22.80 -4.89 -26.91
1996-1997 -2.15 4.44 -21.09 5.63 -13.17
1997-1998 -2.22 -0.25 1.95 -1.63 -2.14
1998-1999 -1.16 4.41 -14.31 0.24 -10.83
1992-1999 -15.82 -48.38 -78.73 -10.40 -153.33
1999-2000 -0.35 11.32 -11.76 2.40 1.61
2000-2001 -0.21 16.02 -19.86 17.80 13.75
2001-2002 0.01 12.41 6.20 -16.73 1.88
2002-2003 0.46 11.80 -1.05 -2.74 8.47
2003-2004 1.09 13.31 11.38 5.06 30.84
2004-2005 1.56 14.66 -15.91 3.97 4.28
2005-2006 1.96 16.84 16.04 -19.53 15.30
2006-2007 2.37 15.29 -2.52 14.58 29.71
2007-2008 2.48 4.13 4.70 -47.47 -36.15
2008-2009 4.64 -2.54 -18.96 -3.43 -20.29
2009-2010 2.88 11.47 3.00 63.36 80.71
2010-2011 3.61 14.67 10.11 -15.89 12.50
2011-2012 3.55 8.74 -23.84 -2.84 -14.40
2012-2013 3.66 11.12 10.29 -6.90 18.18
2000-2013 27.69 159.24 -32.17 -8.36 146.40
Figure 6 Additive LMDI decomposition of CO2 emissions in Kazakhstan
In the first stage (1992 to 1999), total CO2 emissions posted a -153.33 Mt decrease. All the factors displayed negative effects, especially the main ones of energy intensity and economic activity. Specifically, energy intensity resulted in -78.73 Mt CO2 emissions, and economic activity gave rise to -48.38 Mt CO2 emissions, both of which were the primary contributors to total CO2 emissions continuous decline, the contribution rates were 51.35% and 31.55%, respectively. The lowest contributor was the energy carbon structure effect, which led to only -10.4 Mt CO2 emissions, for a contribution rate of just 6.78%. The main reason underlying these changes was social unrest and economic recession affected by the collapse of the Soviet Union and Asian financial crisis, leading to a decline in people’s living standards and in energy production and consumption, and then reduced CO2 emissions.
In the second stage (2000 to 2013), total CO2 emissions increased 146.4 Mt, but still remained lower than the decrease amount in the first stage. For each factors contribution, economic activity in the second stage produced 159.24 Mt CO2 emissions with a contribution rate of 108.77%, it is far beyond those of the first stage. Within a stabilized political and economic environment, the population also increased, adding a CO2 emissions contribution rate of 18.91%. Furthermore, energy intensity produced -32.17 Mt CO2 emissions and the contribution rate was -21.97%, the negative contribution is less than the first stage, because energy consumption of per unit GDP was less in stage two. Energy carbon structure effect resulted in -8.63 Mt CO2 emissions for a contribution rate of -5.71%, the negative effect was weaker compared to the first stage, this indicated that Kazakhstan still mainly relied on coal consumption to pursue rapid economic growth, so the energy structure was not optimized in this stage. In addition, European debt crisis and global financial crisis also played a large role in changes to energy carbon structure and CO2 emissions.
Overall, the total increment of CO2 emissions increased during the study period, but the variation trend was uneven, especially after 2008. This is impacted not only by international market, but also by local economic activity. More remarkably, CO2 emissions continuously increased during 2000 to 2007. From the perspective of each influencing factor, to be specific, economic activity effectively produced 110.86 Mt CO2 emissions, with a contribution rate of 43.92%. Population was the other driving force, as it led to 11.87 Mt CO2 emissions, and the contribution rate was 4.70%. Meanwhile, population decreased first and then increased in two stages respectively, this repositioned CO2 emissions from a negative effect to a positive one, along with changes in population scale from negative growth prior to 1999 to higher positive growth post-2000.
Moreover, energy intensity was the main inhibiting factor to reduce CO2 emissions. The negative effect was obvious in the first stage but changed in the second stage, causing -110.90 Mt CO2 emissions with a contribution rate of -43.94%. Energy carbon structure was the other inhibiting factor with a significant change in amplitude, especially in 2008 and 2010. It resulted in -18.76 Mt CO2 emissions, with a contribution rate of -7.43%. Given that coal remains the primary energy source in Kazakhstan, a sluggish energy consumption structure will be the main reason for the lack of a dramatic reduction in CO2 emissions (Figure 6).
3.2.2 Cumulative effect of each factor in CO2 emissions
The cumulative effects were calculated to further understand the change of CO2 emissions in the study period (Figure 7). Under the sluggish economy after independence, the cumulative emissions of the economic activity effect appeared as negative growth during the phase of 1992-2002, with the largest negative growth year in 1996. After 2002, the cumulative effect was positive and increased rapidly other than 2008, which was influenced by global financial crisis. Overall, economic activity is the main driving factor to increase CO2 emissions. The cumulative emissions of the energy intensity effect were always negative during the study period and in fact underwent a swift decrease from 1992 to 2001 as a consequence of lower energy consumption, after 2002, the cumulative effect showed almost no obvious change, which indicated that energy use efficiency did not improve by much during this period. The cumulative emissions of the population effect were weak due to the population emigration which occurred after independence, and cumulative emissions were negative until 2010. The cumulative emissions of energy carbon structure effect were almost negative and showed a weak change in every year except 2008 and 2009, which were strongly affected by global financial crisis. Because Kazakhstan mainly depends on coal, oil and natural gas to develop its economy, global market economy has influenced energy production and exportation, and further influenced energy structure and CO2 emissions. The total cumulative emissions until the end year were still lower than the baseline year of 1992, which points to some energy policies taking place as well as CO2 emissions being tied to economic development.
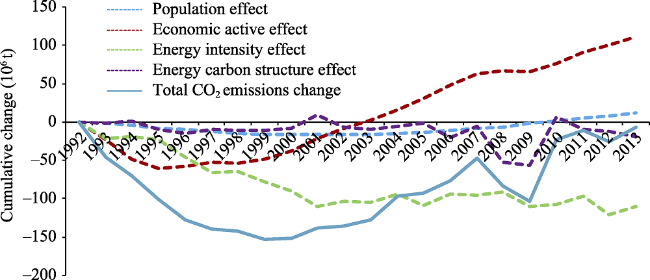
Figure 7 Cumulative effect of each factor in CO2 emissions based on additive LMDI decomposition

3.3 The response between energy-related CO2 emissions and impact factors

The LMDI method can analyze the main effect and contribution of each influencing factor in relation to CO2 emissions in Kazakhstan from a macroscopic perspective. However, the method cannot fully describe carbon emissions variations when one impact factor changes. In other words, it cannot depict the changing response between energy consumption carbon emissions and the driving factors. Based on this defect, we constructed a modified STIRPAT model to describe the changing response relationship between CO2 emissions and its impact factors in Kazakhstan.
3.3.1 Stationarity test
Before establishing the STIRPAT model, the stationarity of each variable must undergo a unit root test. In this paper, we applied the ADF (Augmented Dickey-Fuller) statistic to process the unit root test for the five variables, where lnC is the explained variable and lnP, lnA, lnI and lnS are the explanatory variables. The original hypothesis of the ADF test is that the variable has a unit root. If the ADF test value is smaller than the significant level, we reject the original hypothesis and assume that the data is stationary. Otherwise, the original hypothesis can be accepted. If the original sequence indicates non-stationary status, we need to process the first-order difference. Furthermore, if the first-order difference result is still non-stationary, we need to process the second-order difference. The results are shown in Table 2.
Table 2 Results of ADF unit root test
Variables Test type ADF test value Significant level P-value Conclusion
1% 5% 10%
lnC (c,t,0) -2.58 -4.47 -3.65 -3.26 0.29 Non-stationary
DlnC (c,t,1) -4.17 -4.53 -3.67 -3.28 0.02 Non-stationary
DDlnC (0,0,1) -8.10 -2.70 -1.96 -1.61 0.00 Stationary
lnP (c,0,3) -2.16 -3.86 -3.04 -2.66 0.23 Non-stationary
DlnP (c,t,0) -3.09 -4.50 -3.66 -3.27 0.14 Non-stationary
DDlnP (c,0,0) -5.42 -3.83 -3.03 -2.66 0.00 Stationary
lnA (c,t,4) -3.41 -4.62 -3.71 -3.30 0.08 Non-stationary
DlnA (c,0,2) -2.83 -3.86 -3.04 -2.66 0.07 Non-stationary
DDlnA (0.0.1) -4.69 -2.70 -1.96 -1.61 0.00 Stationary
lnI (0,0,0) -2.31 -2.68 -1.96 -1.61 0.02 Non-stationary
DlnI (0,0,0) -4.09 -2.69 -1.96 -1.61 0.00 Stationary
DDlnI (t,0,2) -5.55 -3.89 -3.05 -2.67 0.00 Stationary
lnS (t,0,0) -3.48 -3.79 -3.01 -2.65 0.02 Non-stationary
DlnS (0,0,1) -5.01 -2.69 -1.96 -1.61 0.00 Stationary
DDlnS (0,0,4) -3.92 -2.73 -1.97 -1.61 0.00 Stationary

Note: In the test type (c,t,k), c is the constant term, t is the trend term and k is the lag order, as determined by AIC criterion. The bold numbers represent the ADF test values through the significant critical level.

From Table 2, we can see that the ADF tests of the second-order difference of the five variables are all through the 1% significant level. This indicates the variables have no unit root and have achieved stationary status. The variables are the same order and single integer sequences, which is the premise for constructing the model.
3.3.2 Multiple collinearity diagnosis
In order to correctly estimate the parameters of the model, we need to verify whether multiple collinear problems exist among different variables. Hence, a multiple collinearity diagnosis must be performed for each variable. The diagnostic results are presented in Table 3.
Table 3 Results of multiple collinearity diagnosis of each variable
Variable Tolerance Variance inflation factor (VIF) Eigenvalue Condition index (CI)
Constant 4.984 1.000
lnP 0.287 3.488 0.011 20.940
lnA 0.132 7.588 0.004 35.381
lnI 0.163 6.134 0.000 124.826
lnS 0.928 1.077 5.998E-06 911.590
Variance inflation factor (VIF) is the reciprocal of tolerance. In general, if the Tolerance of the explanatory variable is less than 0.1 or the VIF is more than 10, the multicollinearity phenomenon may exist among the variables. Table 3 shows that multicollinearity may not exist among variables from the perspective of Tolerance and VIF. However, in statistics, if the Eigenvalue is close to 0 or the CI value is greater than 30, this indicates that multicollinearity might exist among variables. From Table 3 we also see the Eigenvalue values of all explanatory variables are close to 0 and the CI values of lnA, lnI and lnS are all greater than 30. Given this situation, it is possible that multicollinearity exists among explanatory variables and the explained variable from the angles of Eigenvalue and CI. Hence, it is not suitable to use the ordinary least square (OLS) method for unbiased estimation.
3.3.3 Ridge regression analysis
In order to overcome the influence of multicollinearity among variables, methods such as gradual regression, principal component analysis or ridge regression can be used for model fitting to solve this problem. In this paper, we chose ridge regression to effectively solve the multiple collinear problems. Ridge regression estimation was proposed by Hoerl and Kennard (1970). It is a biased estimate method, improved by the least squares estimation. The ridge regression results are shown in Figure 8 and Table 4.
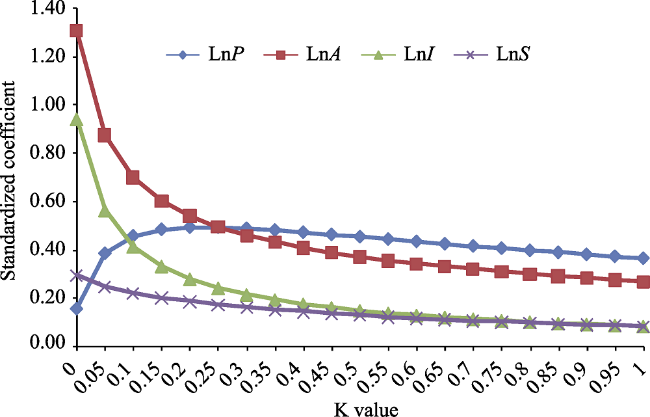
Figure 8 Variation trends of standardized coefficients of the explanatory variations along with K value change
Table 4 Ridge regression results of energy-related CO2 emissions in Kazakhstan
Variable Parameter Standard error Standardized coefficient t Statistics p-Value
LnP 3.1289 0.3801 0.4934 8.2320 0.0000
LnA 0.4138 0.0457 0.5403 9.0562 0.0000
LnI 0.2965 0.0633 0.2793 4.6852 0.0002
LnS 0.6323 0.2086 0.1862 3.0307 0.0075
Constant -22.6320 2.7889 0.0000 -8.1150 0.0000
R2=0.9094 F Statistics=42.6392 Sig.F=0.0001
Ridge regression is performed by adding a set of normal numbers (i.e., ridge parameter K) to the diagonal of a standardized matrix of explanatory variables, which would make the inverse operation relatively stable (Marquardt and Snee, 1975). If the ridge parameter K is chosen reasonably, the results of ridge regression will greatly reduce the variance of parameter estimation under minor unbiasedness. The change range of K value is from 0 to 1. From Figure 8, we can see that when k=0.2, the determination coefficient R2 is 0.9094 and that the change trend of the regression coefficient of each variable gradually towards stability. Therefore, we get a normalized ridge regression equation when k=0.2. However, if we want to analyze the elastic coefficient between CO2 emissions and each influencing factor,we need to further restore the normalized ridge regression to its corresponding non-standardized ridge regression equation. The transformation results are shown in Table 4, and we can see that all the variables passed the significant test. Therefore, the modified STIRPAT model can be written as Equation (10) based on the fitting parameters of ridge regression estimation.
$\ln C=-22.63+3.13\ln P+0.41\ln A+0.30\ln I+0.63\ln S$ (10)
Equation (10) can be used to analyze the response relationship between energy-related CO2 emissions and each influencing factor. From the elastic coefficients of the model, we can see that population size has the greatest influence on increase CO2 emissions: if the population increases 1%, CO2 emissions will increase 3.13%. However, because of the collapse of the Soviet Union, along with social unrest and poor living conditions, the population size of Kazakhstan decreased from 1992 to 1999 due to mass emigration. Following the social recovery, the population began slowly to increase at a rate of 3.62% (Figure 9b) or by 596,180 people over the 1992 population statistics. Thus, the sudden decrease followed by a slow increase limited a large contribution to CO2 emissions.
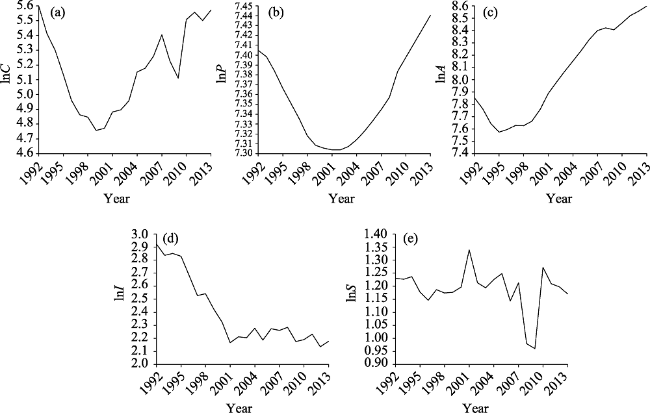
Figure 9 The changing trend of each index by logarithm disposition. (a) total CO2 emissions; (b) population size; (c) economic growth; (d) energy intensity; (e) energy carbon structure
The elastic coefficient of economic activity is 0.41, which indicates a 1% growth of economy and 0.41% increase of CO2 emissions. On the whole, Kazakhstan’s economy experienced a swift increase after economic reform. In fact, it increased almost 110.62% between 1992 and 2013 (Figure 9c), mainly through rises in energy consumption and energy exportation. Therefore, economic growth is the main driving factor to prompt a rapid increase in CO2 emissions.
In reference to energy intensity, the elastic coefficient is 0.30, which indicates that if energy intensity increases 1%, CO2 emissions will increase 0.30%. In other words, the change in energy intensity is positively correlated to CO2 emissions. So, if energy intensity decreases 1%, CO2 emissions will decrease 0.30%. Figure 9d illustrates the decrease in energy intensity from 1992 to 2013, in detail, it decreased -9.80 tce/104 USD in 2013, which was a sharp contrast to 1992 with the decrease rate of -52.6%. The change in energy intensity was not stable, with a significant decrease from 1992 to 1999 (due to the economic recession) and a weak decrease from 2000 to 2013. Generally, energy intensity was an inhibiting factor to CO2 emissions, but the energy use efficiency was relatively low.
Regarding the energy carbon structure effect, the elastic coefficient is 0.63, which indicates that if energy carbon structure increases 1%, CO2 emissions will increase 0.63%. Similar to energy intensity change, this factor also presented a fluctuating declining trend from 1992 to 2013 (Figure 9e), that means energy carbon structure decreases 1%, CO2 emissions reduce 0.63%. Compared to energy intensity, the reducing proportion of energy carbon structure is greater, so adjusting the energy use structure and developing new energies can be a more effective way to reduce CO2 emissions in Kazakhstan.

4 Conclusions and policy suggestions

4.1 Conclusions

CO2 emissions experienced a swift decline from 1992 to 1999 due mainly to the collapse of the Soviet Union, which led to a recession in social and economic development. Following the subsequent economic reform, CO2 emissions gradually increased after 2000 together with economic recovery. Both CO2 emissions and per capita emissions displayed U-shaped curves from 1992 to 2013, while carbon emissions intensity constantly decreased during the study period.
According to LMDI decomposition results, economic activity and population took the positive effects to increase CO2 emissions. Economic activity produced 110.86 Mt CO2 emissions and population expansion led to 11.87 Mt CO2 emissions, the contribution rates of these two factors were 43.92% and 4.70%, respectively, which revealed that rapid economic growth relied on high-carbon energy consumption, which then led to more CO2 emissions. In contrast, the other two factors reducing CO2 emissions were energy intensity effect and the energy carbon structure effect. Energy intensity caused -110.90 Mt CO2 emissions and energy carbon structure resulted in -18.76 Mt CO2 emissions, the contribution rates of these two factors were -43.94% and -7.43%, respectively, indicating that improving energy use efficiency and optimizing energy structure were the valid measures for reducing CO2 emissions.
The modified STIRPAT model was constructed according to ridge regression estimation, such that the elastic coefficients of the model could better reflect the response relationship between energy-related CO2 emissions and the influencing factors. With each individual factor of population size, economic activity, energy intensity and energy carbon structure increase 1%, CO2 emissions increase, respectively, 3.13%, 0.41%, 0.30% and 0.63%. We find that population expansion has the greatest potential to increase CO2 emissions, followed by economic activity effect. Due to decrease in energy intensity and energy carbon structure and both of them positively related to CO2 emissions, the two factors appear to be inhibiting features that reduce CO2 emissions, the difference is, the potential impact of energy carbon structure effect is stronger than the energy intensity one.

4.2 Policy suggestions

Along with rapid socio-economic development in Kazakhstan, the contradiction of excessive energy consumption and lower energy efficiency has begun to be a serious economic shackle hindering green economic development. The government of Kazakhstan has adopted a few measures aimed at mitigating energy consumption (Ardak and Yesdauletova, 2009; Ismailova, 2013), but the relationship between economic growth and CO2 emissions is still in a weak decoupling state (Xiong et al., 2015) and requires urgent optimization in the future. Based on the research, we propose some pertinent suggestions as follows:
Firstly, more clean energy or renewable energy should be exploited to optimize the energy use structure. The energy use structure of Kazakhstan still relies on traditional high-carbon energies, such as coal, oil and gas, with coal continuing to dominate overall energy consumption in Kazakhstan. In order to reduce more greenhouse gas emissions, Kazakhstan should switch to renewable resources to take the place of traditional fuels. Kazakhstan is rich in solar energy, hydropower and wind power resources, which can fully meet the domestic energy demand. However, less than 30% of water and wind resources are used to generate electricity at present (Karatayev et al., 2016). Therefore, Kazakhstan should look to develop technical assistance networks with other countries as well as vigorously develop their renewable resources.
Secondly, Kazakhstan should continue to improve the efficiency of energy utilization. As energy use efficiency mainly depends on technological progress, Kazakhstan should further its investments in advanced energy-saving technologies, and also encourage research and development in this field. At the same time, it should promote innovation in energy exploitation, transformation and utilization. Kazakhstan should as well look to exploiting its geographical advantage in the One Belt and One Road Initiative by strengthening cooperation with China around energy-related technology (Feng and Wang, 2015). Only in this way can the country improve energy efficiency and reduce energy intensity.
Thirdly, Kazakhstan should transform the concept of economic development and advocate for ‘green’ consumption. Additionally, the country should transform its focus from extensive growth to intensive growth, and change its economic development pattern by not only paying attention to economic quantity but also reinforcing green economy improvement. Regarding to population expansion, the country should take full advantage of media, widely advertise its green life philosophy, and advocate a low-carbon lifestyle and consumption patterns. Through these methods, Kazakhstan can both alleviate energy pressure and reduce carbon emissions.

The authors have declared that no competing interests exist.

[1]
Aggarwal P, Jain S, 2016. Energy demand and CO2 emissions from urban on-road transport in Delhi: Current and future projections under various policy measures.Journal of Cleaner Production, 128: 48-61.61Energy and CO2emissions from passenger transport in Delhi for the year 2007 and 2021.61The measurement of CO2emissions using activity based emission factors in India.61Energy demand decreases from 11 to 32% under various (2021-ALT-I to IV) scenarios.61The CO2emissions reduces by ~30% under 2021-ALT-IV scenario.

DOI

[2]
Ang B W, 2004. Decomposition analysis for policymaking in energy: Which is the preferred method?Energy Policy, 32(9): 1131-1139.

DOI

[3]
Ang B W, 2005. The LMDI approach to decomposition analysis: A practical guide.Energy Policy, 33(7): 867-871.In a recent study, Ang (Energy Policy 32 (2004)) compared various index decomposition analysis methods and concluded that the logarithmic mean Divisia index method is the preferred method. Since the literature on the method tends to be either too technical or specific for most potential users, this paper provides a practical guide that includes the general formulation process, summary tables for easy reference and examples.

DOI

[4]
Ang B W, 2015. LMDI decomposition approach: A guide for implementation.Energy Policy, 86: 233-238.61Guidelines for implementing LMDI decomposition approach are provided.61Eight LMDI decomposition models are summarized and compared.61The development of the LMDI decomposition approach is presented.61The latest developments of index decomposition analysis are briefly reviewed.

DOI

[5]
Ardak Yesdauletova, 2009. Kazakhstan’s energy policy: Its evolution and tendencies.Journal of US-China Public Administration, 6(4): 31-39.

[6]
Arnell N W, Gosling S N, 2016. The impacts of climate change on river flood risk at the global scale.Climatic Change, 134(3): 387-401.

DOI

[7]
Azatbek T, Ramazanov A, 2016. Assessment of foreign direct investment, export and economic growth on the example of Kazakhstan.Investment Management and Financial Innovations, 13(4): 129-135.

[8]
Bahgat G, 2010. Energy partnership: China and the Gulf States.OPEC Energy Review, 29(2): 115-131.One of the most significant developments in the global energy market in the last several years has been China's skyrocketing demand for energy. In 1993, China became a net oil importer for the first time in its history and in 2003 replaced Japan as the world's second-largest oil importer (after the United States). The country needs more energy to maintain its spectacular economic performance.

DOI

[9]
Blank S, 1995. Energy, economics and security in Central Asia: Russia and its rivals.Central Asian Survey, 14(3): 64.Five Central Asian states emerged out of the Soviet Union`s Central Asian republics in 1991. Although U.S. policy makers presumed that Iran would inevitably sweep them into its sphere of influence, this has not happened. Nor is it likely to occur. Instead there has developed a multistate competition for influence and even control of these new states. This competition involves Russia as the leading force in the area and Moscow`s main rivals are Turkey, Iran, Pakistan (and India), China, and the United States. This rivalry is particularly strong in the struggle among these states to gain positions of leverage over the energy economy, i.e. production, pipelines, and refining in Central Asia because this region is blessed with enormous energy deposits. These deposits are crucial to Central Asia`s integration with the world economy and economic progress. Indeed, energy exports may be the only way these governments can hope for any economic stability and progress in the future.

DOI

[10]
Caillaud S, Kalampalikis N, Flick U, 2012. The social representations of the Bali Climate Conference in the French and German Media.Journal of Community and Applied Social Psychology, 22(4): 363-378.Climate change is a major current affair for which recent United Nations climate conferences aim to build consensus and develop international solutions. The objective of this article is to compare, through the theoretical lens of social representations, the way in which French and German media, specifically newspapers, represent the Bali climate conference. We use the triangulation of data analysis to take both the pragmatic and the semantic aspects of media discourse into account. Results show that German media adopt both a local and a global vision of climate change and of the conference. Religious metaphors highlight a moral dimension of the conference, suggesting anchoring in human and political categories. In contrast, in French media, we identify that conflicts between countries render the stakes of climate change concrete by war metaphors. The French discourses examined are shown to be organised through the anchoring of political and financial categories. Results are discussed in relation to the history of green movements in the two countries and in relation to practical implications. Copyright 2011 John Wiley & Sons, Ltd.

DOI

[11]
Feng Z, Wang H, 2015. The mode of economic cooperation in the “One Belt and One Road” Construction.New Paradigm for International Business, 20(2): 35-58.In view of the regional economic cooperation and integration, this paper analyzes the strategic conception of "Silk Road Economic Belt" and "21st Century Maritime Silk Road"("One Belt and One Road" for short) raised by the Chinese people. It firstly discusses the major regional cooperation mechanism and the evolution of the type in this conception. Secondly, it discusses the competitive and cooperative relationship between the construction of "One Belt and One Road" and the current regional cooperation mechanism. Also, the possible effect which may exert on the construction of the "One Belt and One Road" from the emerging regional cooperation mechanism is also analyzed. Thirdly, it elaborates on the way China should adopt to guarantee the smooth implementation of "One Belt and One Road" by making use of the current regional cooperation mechanisms and cooperating with the ones that China has not yet participated. The result of this paper shows that China has been facing with two options currently in the construction of "One Belt and One Road." One is through the strategic means of free trade area, and the other one is through the cooperative means of regional and subregional combination. From the perspective of the feasibility and the profitability, the construction of the "One Belt and One Road" should implement an innovative cooperation model, which, at the current stage, is not a supranational mechanism, nor a model at the same level with the Customs Union or the Economic Union; it should be, on the contrary, a platform for friendly cooperation which can provide the countries within the region with better economic exchanges and channel construction, a new idea and cooperative way to create better conditions and opportunities for collaboration among different countries, various mechanisms, and organizations. If conditions are right, it will form a higher and more extensive regional economic cooperation, including the institutional arrangements of the free trade area. Thus, this platform will promote the rejuvenation of the Silk Road and provide direct convenience to the integration of the region. This can also be called negative integration, a notion raised by Tinbergen, which is a development that seems to be doing nothing but can actually make contributions proactively.

DOI

[12]
Hoerl A E, Kennard R W, 1970. Ridge Regression: Application to nonorthogonal problems.Technometrics, 12(1): 69-82.

DOI

[13]
Holdren J P, Ehrlich P R, 1974. Human population and the global environment: Population growth, rising per capita material consumption, and disruptive technologies have made civilization a global ecological force.American Scientist, 62(3): 282-292.Publication » Human Population and the Global Environment: Population growth, rising per capita material consumption, and disruptive technologies have made civilization a global ecological force.

[14]
IPCC, 2007. Summary for Policymakers. In: Climate Change 2007: The Physical Science Basis. Contribution of Working Group I to the Fourth Assessment Report of the Intergovernmental Panel on Climate Change. Cambridge, United Kingdom and New York, NY, USA: Cambridge University Press.

[15]
Ismailova D, 2013. Some trends in energy policy of Kazakhstan.European Journal of Business and Economics, 3: 9-11.

[16]
Jiang Y L, Feng L G, 2006. Transport-related resource and environmental issues in China.World Transport Policy and Practice, 12(4): 17-28.

[17]
Kalyuzhnova Y, Patterson K, 2016. Kazakhstan: Long-term economic growth and the role of the oil sector.Comparative Economic Studies, 58(1): 93-118.This study combines a narrative and modelling framework to analyse the development of Kazakhstan’s oil sector since its takeoff following separation from the USSR. As in the case of other emerging or transitional countries with large natural resource endowments, a key question is whether the exploitation of the natural resource is a benefit to longer term economic development: is it a curse, a blessing – or neither? Narrative evidence suggests that the establishment of good governance, in terms of institutions and policies, provides a background to sound long-term development, especially if combined with the development of sectors outside the natural resource sector, for example diversification into manufacturing and services, often through attracting FDI. The narrative is supported by econometric modelling of the relationship between domestic output, overseas output and exports of oil, which finds in favour of a sustained positive effect of oil exports on GDP. The model then provides a basis for projection of the growth in GDP given a consensus view of likely developments in the oil price.

DOI

[18]
Karatayev M, Clarke M L, 2016. A review of current energy systems and green energy potential in Kazakhstan.Renewable and Sustainable Energy Reviews, 55: 491-504.Kazakhstan is rich in natural resources including coal, oil, natural gas and uranium and has significant renewable potential from wind, solar, hydro-power and biomass. In spite of this, the country is currently dependent upon fossil fuels for power generation. Coal-fired plants account for 75% of total power generation leading to concerns over greenhouse gas emissions and impacts on human health and the environment. Recent economic growth in Kazakhstan has driven increased demand for energy services, making the construction of additional generating capacity necessary for enabling sustained economic growth. In this context, renewable energy resources are becoming an increasingly attractive option to help bridge the demand upply gap and to decrease national greenhouse gas emissions. This study presents an overview of the existing energy system in Kazakhstan and investigates policy drivers for the energy sector. We review existing studies, national reports, energy strategies and plans, to identify and describe key barriers that prevent diffusion of renewable energy technologies in Kazakhstan. We propose potential measures to overcome specific barriers in order to successfully develop a renewable energy sector in Kazakhstan. It is seen that the likely major contributors to replacing fossil fuel based energy services are likely to be wind power and solar energy technologies, with biomass and hydro energy sources likely to play a lesser role. The barriers to development include low electricity tariffs, transmission losses and inefficient technologies, weak regulatory and legal frameworks and a high-risk business environment.

DOI

[19]
Karatayev M, Hall S, Kalyuzhnova Y,et al. 2016. Renewable energy technology uptake in Kazakhstan: Policy drivers and barriers in a transitional economy.Renewable and Sustainable Energy Reviews, 66: 120-136.Kazakhstan has considerable renewable energy potential, the development of which can provide significant environmental, economic and social benefits. The country's national low carbon energy strategy aims to bring the share of renewables in electricity production to 50% by 2050. Despite the considerable renewable energy resource base, and ambitious deployment targets, the current contribution of non-hydro renewable energy to final electricity demand is less than one percent. Adoption of renewable energy technologies in a fossil fuel resource-rich country like Kazakhstan remains a big challenge but current low oil prices and a weakening economy may offer new opportunities. Deploying an Analytical Hierarchy Process methodology we identify the most significant barriers to uptake of renewable energy in the context of the electricity sector. The main factors preventing the penetration and scale-up of renewables include: a political and regulatory framework which supports and promotes a continued focus on fossil fuels, supported in part by regional geopolitics; a lack of awareness of sustainable alternative energy generation systems and a combination of social poverty and poor education in communities that are most likely to benefit from broadly distributed renewable technologies; market conditions driven by current electricity tariffs; inefficient but incumbent power technologies; and a high-risk business environment. Ranking barriers by importance will provide practitioners and regulators a mechanism to improve policies and incentivize renewable energy uptake in Kazakhstan and other resource-rich transition economies in Central Asia.

DOI

[20]
Katenova M, Nurmakhanova M, 2017. Financial development and economic growth: The case of Kazakhstan.International Review of Business Research Papers, 13(1): 151-160.

DOI

[21]
Kaya Y, 1990. Impact of carbon dioxide emission control on GNP growth: Interpretation of proposed scenarios. IPCC Energy and Industry Subgroup, Response Strategies Working Group, Paris, France.

[22]
Kaya Y, Yokobori K, 1997. Environment, Energy, and Economy: Strategies for Sustainability. Tokyo, New York, Paris: United Nations University Press.

[23]
Li D Q, Wang D Y, 2016. Decomposition analysis of energy consumption for an freeway during its operation period: A case study for Guangdong, China.Energy, 97: 296-305.61Decomposition model was used to analyze energy consumption of freeway management.61This attempt finds the impact of traffic volume on management energy consumption.61Tunnels and toll stations mainly affect the management energy consumption.61Using alternate materials and energy-saving technology improved energy efficiency.

DOI

[24]
Lin S, Zhao D, Marinova D, 2009. Analysis of the environmental impact of China based on STIRPAT model.Environmental Impact Assessment Review, 29(6): 341-347.Assuming that energy consumption is the main source of GHG emissions in China, this paper analyses the effect of population, urbanisation level, GDP per capita, industrialisation level and energy intensity on the country's environmental impact using the STIRPAT model with data for 1978 2006. The analysis shows that population has the largest potential effect on environmental impact, followed by urbanisation level, industrialisation level, GDP per capita and energy intensity. Hence, China's One Child Policy, which restrains rapid population growth, has been an effective way of reducing the country's environmental impact. However, due to the difference in growth rates, GDP per capita had a higher effect on the environmental impact, contributing to 38% of its increase (while population's contribution was at 32%). The rapid decrease in energy intensity was the main factor restraining the increase in China's environmental impact but recently it has also been rising. Against this background, the future of the country looks bleak unless a change in human behaviour towards more ecologically sensitive economic choices occurs.

DOI

[25]
Lin S J, Beidari M, 2015. Energy consumption trends and decoupling effects between carbon dioxide and gross domestic product in South Africa.Aerosol and Air Quality Research, 15(7): 2676-2687.

DOI

[26]
Liu Y, Yang Z, Wu W, 2015. Assessing the impact of population, income and technology on energy consumption and industrial pollutant emissions in China.Applied Energy, 155: 904-917.Elucidating the complex mechanism of the impact of demographic changes, economic growth, and technological advance impacts on energy consumption and pollutant emissions is fundamentally necessary to inform effective strategies on energy saving and emission reduction in China. Here, based on a balanced provincial panel dataset in China over the period 1990 2012, we used an extended STIRPAT model to investigate the effects of human activity on energy consumption and three types of industrial pollutant emissions (exhaust gases, waste water and solid waste) at the national and regional levels and tested the environmental Kuznets curve (EKC) hypothesis. Empirical results show that a higher population density would result in a decrease in energy consumption in China as a whole and in its eastern, central and western regions, but the extent of its effect on the environment depends on the type of pollutants. Higher population density increased wastewater discharge but decreased solid waste production in China and its three regions. The effect of economic development on the environment was heterogeneous across the regions. The proportion of industrial output had a significant and positive influence on energy consumption and pollutant emissions in China and its three regions. Higher industrial energy intensity resulted in higher levels of pollutant emissions. No strong evidence supporting the EKC hypothesis for the three industrial wastes in China was found. Our findings further demonstrated that the impact of population, income and technology on the environment varies at different levels of development. Because of the regional disparities in anthropogenic impact on the environment, formulating specific region-oriented energy saving and emission reduction strategies may provide a more practical and effective approach to achieving sustainable development in China.

DOI

[27]
Lu Z, Yang Y, Wang J,et al. 2014. Factor decomposition of carbon productivity in China: Based on the Laspeyres Decomposition Method.Journal of Industrial Technological Economics, 61: 1893-1896.In response to the urgent situation of global warming,the development of low- carbon economy is an inevitable trend,because carbon emission began to restrain the production. And the core of low- carbon economy is improving the carbon productivity. Using the Laspeyres index decomposition method,this paper examines the influence on the change of China's carbon productivity during the period 2000 ~ 2010. Research results show that the level of China's carbon productivity has improved gradually in the first decade of the new century,but there exists the characteristics of non- uniform growth; the low- carbon technology progress has a positive impact on the carbon productivity growth,while the unreasonable carbon structure is negative; industrial sectors with advanced low- carbon technology can not get appropriate carbon emission space,which is the root cause of the slow growth in carbon productivity. There is a significant difference between the levels of contribution in the industrial sectors,due to the changes of the carbon emission space and low- carbon technology. Herein,some releant recommendations are presented in the last.

DOI

[28]
Macgregor J, 2017. Determining an optimal strategy for energy investment in Kazakhstan.Energy Policy, 107: 210-224.

DOI

[29]
Mao Z, 2014. Cosmopolitanism and global risk: News framing of the Asian financial crisis and the European debt crisis. International Journal of Communication, 8(1): 1029-1048.

[30]
Marquardt D W, Snee R D, 1975. Ridge regression in practice.American Statistician, 29(1): 3-20.

[31]
Mccarl B A, Adams D M, Alig R J,et al. 2016. Effects of global climate change on the US forest sector: Response functions derived from a dynamic resource and market simulator.Climate Research, 15(3): 195-205.

[32]
Meyers S, Schmitt B, Chester-Jones M,et al. 2016. Energy efficiency, carbon emissions, and measures towards their improvement in the food and beverage sector for six European countries.Energy, 104: 266-283.61The Food and Beverage sector in Europe was assessed for carbon reduction potential.61Significant emission reductions can be achieved by energy efficiency and renewables.61The Bakery and Meat branches can reduce energy consumption by 30–40%.61Small and coal burning companies have the greatest potential for emission reduction.61Financial barriers remain the hardest obstacle to realize reduction potential.

DOI

[33]
Moutinho V, Moreira A C, Silva P M, 2015. The driving forces of change in energy-related CO2 emissions in Eastern, Western, Northern and Southern Europe: The LMDI approach to decomposition analysis.Renewable and Sustainable Energy Reviews, 50: 1485-1499.The objective of this work is to identify the relevant factors that have influenced the changes in the level of CO2 emissions among four groups (eastern, western, northern and southern) of European countries. Our results show that CO2 emissions are correlated with the energy consumption of the economy for the group of countries under analysis, which is determined by the change of population among the various countries. Similarly, renewable energy consumption is also determined by the size and structure of the countries, as reflected by the value added to the economy. When comparing the results of the post-Kyoto period to the previous period for the four groups of European countries, one concludes that there are clear improvements in the reductions of emissions. This resulted primarily from changes to the energy mix, switching to cleaner fuels for end-user energy production (a volte-face in the behaviour of the energy mix effect), while the changes in the factors driving emissions resulted from a reduction in the usage of fossil fuels for producing energy. In general, the relative contributions of these two factors show the importance of the impact of changing the structure of the mix for producing energy, with a view to complying with the targets for reductions in CO2 emissions, reflecting the value placed on the significant impact assigned to emissions levels.

DOI

[34]
Movkebaeva G A, 2013. Energy cooperation among Kazakhstan, Russia, and China within the Shanghai Cooperation Organization.Russian Politics and Law, 51(1): 80-87.China, Kazakhstan, and Russia are making progress in energy cooperation, but so far largely on the basis of bilateral agreements. The Shanghai Cooperation Organization Energy Club offers opportunities to expand that cooperation in a way that benefits all the organization's members and observer states.

DOI

[35]
Nicogossian A, Stabile B, Kloiber O,et al. 2017. Climate change and global health in the 21st century: Evidence and resilience.World Medical and Health Policy, 9(3): 280-282.react-text: 416 Slow global economic recovery is affecting health and access to care by an ever-increasing number of individuals globally. International health organizations are advocating increased attention to fighting and preventing non-communicable disorders and equitable access to health. World Bank estimates that an additional annual contribution of 10 billion USD will be required to improve... /react-text react-text: 417 /react-text [Show full abstract]

DOI

[36]
Ouyang X, Lin B, 2015. An analysis of the driving forces of energy-related carbon dioxide emissions in China’s industrial sector.Renewable and Sustainable Energy Reviews, 45: 838-849.Both energy consumption and the growth of carbon dioxide (CO2) emissions in China are attributed to the industrial sector. Energy conservation and CO2emissions reduction in China’s industrial sector is decisive for achieving a low-carbon transition. We analyze the change of energy-related CO2emissions in China’s industrial sector from 1991 to 2010 based on the Logarithmic Mean Divisia Index (LMDI) method. Results indicate that industrial activity is the major factor that contributes to the increase of industrial CO2emissions while energy intensity is the major contributor to the decrease of CO2emissions. Industry size shows a varying trend interchanging intervals of growth along the study period. Moreover, both energy mix and carbon intensity of energy use have negative effects on the increase of CO2emissions. The cointegration method is adopted to further explore determinants of CO2emissions in China’s industrial sector. Results show that there exists a long-run relationship between industrial CO2emissions and affecting factors such as CO2emissions per unit of energy consumption, industrial value added, labor productivity and fossil fuel consumption. China’s industrial CO2emissions are mainly attributed to the coal-dominated energy structure. Policy suggestions are thus provided to reduce industrial CO2emissions in China.

DOI

[37]
Ozturk I, Acaravci A, 2010. CO2 emissions, energy consumption and economic growth in Turkey.Renewable and Sustainable Energy Reviews, 14(9): 3220-3225.This paper examines the long run and causal relationship issues between economic growth, carbon emissions, energy consumption and employment ratio in Turkey by using autoregressive distributed lag bounds testing approach of cointegration. Empirical results for Turkey over the period 1968–2005 suggest an evidence of a long-run relationship between the variables at 5% significance level in Turkey. The estimated income elasticity of carbon emissions per capita is 610.606 and the income elasticity of energy consumption per capita is 1.375. Results for the existence and direction of Granger causality show that neither carbon emissions per capita nor energy consumption per capita cause real GDP per capita, but employment ratio causes real GDP per capita in the short run. In addition, EKC hypothesis at causal framework by using a linear logarithmic model is not valid in Turkish case. The overall results indicates that energy conservation policies, such as rationing energy consumption and controlling carbon dioxide emissions, are likely to have no adverse effect on the real output growth of Turkey.

DOI

[38]
Parkhomchik L, Syrlybayeva B, 2016. Evaluation of the shale gas potential in Kazakhstan. Shale Gas: Ecology, Politics, Economy. Cham: Springer, 193-204.

[39]
Ramlall I, 2017. Internalizing CO2 emissions via central banks’ financials: Evidence from the world.Renewable and Sustainable Energy Reviews, 72: 549-559.

DOI

[40]
Rowland R H, 2001. Regional population change in Kazakhstan during the 1990s and the impact of nationality population patterns: Results from the recent census of Kazakhstan.Post-Soviet Geography and Economics, 42(8): 571-614.Abstract An American geographer specializing in population change and urbanization in the countries of the former USSR examines nationwide and regional total, urban, and rural population change in Kazakhstan for 1989-1999, using data from the recently released 1999 census of Kazakhstan. Of particular interest is the analysis of nationality data in the census, available at a level of detail not matched since the last Soviet census in 1989. For the first time in more than a decade, a detailed investigation is possible of changes in the regional and rural-urban populations of major nationality groups in Kazakhstan during the 1990s. Journal of Economic Literature, Classification Numbers: O18, R12, R23. 10 figures, 15 tables, 35 references.

DOI

[41]
Ruziev K, Majidov T, 2013. Differing effects of the global financial crisis on the Central Asian Countries: Kazakhstan, the Kyrgyz Republic and Uzbekistan.Europe-Asia Studies, 65(4): 682-716.Kazakhstan, the Kyrgyz Republic and Uzbekistan are neighbouring countries in post-Soviet Central Asia which share similar culture and language. Their economic structures were similar under central planning: they provided the agricultural basis to the Soviet economy. But, since independence, these economies have grown structurally more heterogeneous due to variations in the implementation of market-oriented reforms, the degree of integration into the global economy and natural resource endowment. This article attempts to demonstrate how this heterogeneity can explain the differing effects of the recent Global Financial Crisis on these countries' economies in general and in the banking sector in particular.

DOI

[42]
Sarbassov Y, Kerimray A, Tokmurzin D,et al. 2013. Electricity and heating system in Kazakhstan: Exploring energy efficiency improvement paths.Energy Policy, 60(5): 431-444.61Energy system of Kazakhstan has been analysed by a Markal–Times based model.61Different energy policy measurements have been implemented and assessed.61Energy efficiency measures combined with GHG emission reduction scenarios.61Four scenarios have been studied, to quantify the potential reduction of losses.

DOI

[43]
Sauer T J, Norman J M, Sivakumar M V K,et al. 2017. Sustaining soil productivity in response to global climate change: Science, policy, and ethics.Vadose Zone Journal, 11(2): 531-531.This book with sixteen chapters is a multi-disciplinary volume exploring the ethical, political and social issues surrounding the stewardship of soil resources. Based on topics presented by an international group of experts at a conference convened through the support of the Organization for Economic Cooperation and Development, chapters include scientific studies on carbon sequestration, ecosy...

DOI

[44]
Schandl H, Hatfield-Dodds S, Wiedmann T,et al. 2016. Decoupling global environmental pressure and economic growth: Scenarios for energy use, materials use and carbon emissions.Journal of Cleaner Production, 132(1): 45-56.61Economic and environmental objectives can be achieved simultaneously.61Well-designed policies deliver reductions in resource use and emissions.61Integrated modelling with detail for economic interactions.61Decarbonisation and dematerialization achievable without decline in global economic growth.61Consumption and territorial (production) view of resource use and emissions.

DOI

[45]
Shao S, Yang L, Gan C,et al. 2016. Using an extended LMDI model to explore techno-economic drivers of energy-related industrial CO2 emission changes: A case study for Shanghai (China).Renewable and Sustainable Energy Reviews, 55: 516-536.Although investment and R&D activities can exert significant effects on energy-related industrial CO2 emissions (EICE), related factors have not been fairly uncovered in the existing index decomposition studies. This paper extends the previous logarithmic mean Divisia index (LMDI) decomposition model by introducing three novel factors (R&D intensity, investment intensity, and R&D efficiency). The extended model not only considers the conventional drivers of EICE, but also reflects the microeconomic effects of investment and R&D behaviors on EICE. Furthermore, taking Shanghai as an example, which is the economic center and leading CO2emitter in China, we use the extended model to decompose and explain EICE changes. Also, we incorporate renewable energy sources into the proposed model to carry out an alternative decomposition analysis at Shanghai s entire industrial level. The results show that among conventional (macroeconomic) factors, expanding output scale is mainly responsible for the increase in EICE, and industrial structure adjustment is the most significant factor in mitigating EICE. Regardless of renewable energy sources, the emission-reduction effect of energy intensity focused on by the Chinese government is less than the expected due to the rebound effect, but the introduction of renewable energy sources intensifies its mitigating effect, partly resulting from the transmission from the abating effect of industrial structure adjustment. The effect of energy structure is the weakest. Although all the three novel factors exert significant effects on EICE, they are more sensitive to policy interventions than conventional factors. R&D intensity presents an obvious mitigating effect, while investment intensity and R&D efficiency display an overall promotion effect with some volatility. The introduction of renewable energy sources intensifies the promotion effect of R&D efficiency as a result of the reen paradox effect. Finally, we propose that CO2 mitigation efforts should be made by considering both macroeconomic and microeconomic factors in order to achieve a desirable emission eduction effect.

DOI

[46]
Streets D G, Jiang K, Hu X,et al. 2001. Recent reductions in China’s greenhouse gas emissions.Science, 294(5548): 1835-1837.Using the most recent energy and other statistical data, we have estimated the annual trends in China's greenhouse gas emissions for the period 1990 to 2000. The authors of this Policy Forum calculate that CO2 emissions declined by 7.3% between 1996 and 2000, while CH4 emissions declined by 2.2% between 1997 and 2000. These reductions were due to a combination of energy reforms, economic restructuring, forestry policies, and economic slowdown. The effects of these emission changes on global mean temperatures are estimated and compared with the effects of concurrent changes in two aerosol species, sulfate and black carbon.

DOI PMID

[47]
Swan L G, Ugursal V I, Ian B M, 2013. Hybrid residential end-use energy and greenhouse gas emissions model: Development and verification for Canada.Journal of Building Performance Simulation, 6(1): 1-23.This article presents the Canadian Hybrid Residential End-Use Energy and GHG Emissions Model (CHREM), a model based upon building performance simulation, and compares its estimates with residential sector energy consumption surveys and the estimates of other models. The CHREM advances the state of the art of residential sector energy consumption and green house gas (GHG) emissions modelling by three new contributions: (i) the use of a database of 16,952 unique house descriptions of thermal envelope and energy conversion system information that statistically represent the Canadian housing stock; (ii) a 090004hybrid090005 modelling approach that integrates the neural network and engineering modelling methods to estimate the energy consumption of the major end-uses, providing the capacity to model alternative and renewable energy technologies, such as solar energy and energy storage systems; and (iii) a method for the accumulation and treatment of energy consumption and GHG emissions results as a function of end-use and energy source.

DOI

[48]
Tang J R, 2014. Analysis on the carbon emission in Henan Province and its influence factors based on VAR model.Sustainable Development, 4(3): 42-50.

DOI

[49]
Tunç G İ, Türüt-Aşık S, Akbostancı E, 2009. A decomposition analysis of CO2 emissions from energy use: Turkish case.Energy Policy, 37(11): 4689-4699.Environmental problems, especially “climate change” due to significant increase in anthropogenic greenhouse gases, have been on the agenda since 1980s. Among the greenhouse gases, carbon dioxide (CO) is the most important one and is responsible for more than 60% of the greenhouse effect. The objective of this study is to identify the factors that contribute to changes in CO emissions for the Turkish economy by utilizing Log Mean Divisia Index (LMDI) method developed by Ang (2005) [Ang, B.W., 2005. The LMDI approach to decomposition analysis: a practical guide. Energy Policy 33, 867–871]. Turkish economy is divided into three aggregated sectors, namely agriculture, industry and services, and energy sources used by these sectors are aggregated into four groups: solid fuels, petroleum, natural gas and electricity. This study covers the period 1970–2006, which enables us to investigate the effects of different macroeconomic policies on carbon dioxide emissions through changes in shares of industries and use of different energy sources. Our analysis shows that the main component that determines the changes in CO emissions of the Turkish economy is the economic activity. Even though important changes in the structure of the economy during 1970–2006 period are observed, structure effect is not a significant factor in changes in CO emissions, however intensity effect is.

DOI

[50]
Wang C, Wang F, Zhang X,et al. 2017a. Examining the driving factors of energy related carbon emissions using the extended STIRPAT model based on IPAT identity in Xinjiang.Renewable and Sustainable Energy Reviews, 67: 51-61.Analysis of driving factors of energy related carbon emissions from the regional perspective is necessary and helpful for China to achieve its reduction targets. An extended STIRPAT model based on the classical IPAT identity was used to determine the main driving factors for energy related carbon emissions in Xinjiang. In order to get the best understanding of driving factors on carbon emissions during 1952–2012, we divided the process into 3 stages, such as “Before Reform and Opening up” (1952–1978), “After Reform and Opening up” (1978–2000), and “Western Development” (2000–2012). Research results show that the impacts and influences of various factors on carbon emissions are different in the three different development stages. Before the Reform and Opening up (1952–1977), carbon intensity and population size are the two dominant contributors to the carbon emissions increments, while energy consumption structure is the important influencing factor in curbing carbon emissions. After the Reform and Opening up (1978–2000), economic growth and population size are the two dominant contributors to the carbon emissions increments, while carbon intensity plays the important negative effect on carbon emissions. During the Western Development (2001–2012), fixed assets investment and economic growth are the two dominant contributors to the carbon emissions increments, while carbon intensity plays the important negative effect on carbon emissions. Solving these problems effectively will be of great help for Xinjiang to harmonize economic growth and carbon emissions reduction, even environmental damage reduction.

DOI

[51]
Wang D, Nie R, Shi H Y, 2011a. Scenario analysis of China’s primary energy demand and CO2 emissions based on IPAT Model.Energy Procedia, 5: 365-369.Based on the policies of economic, energy and environment, the IPAT model is applied to analyze the scenarios of China's future primary energy demand and CO2 emissions. The results show that: primary energy demands and CO2 emissions will grow rapidly before 2020, due to the impact of the industrialization. The LCS scenario's primary energy demand reach 4.48 billion tce and CO2 emission 10.58 billion tons in 2020, which are far less than those in scenario-BUS; the goals of CO2 emission reduction and energy structure optimization are at the cost of slowing economic growth to some extent in scenario-LCS. The aggregate GDP has decreased by 8.26 trillion yuan compared to that in scenario-BUS; there are great scenario differences in energy demand structure. The expected energy structure would be achieved in scenario-LCS, as the share of coal slowly decreases and its physical quantity reaches 3.76 billion tons, and the non-fossil energies structure amounts to 15.95%; The scenario of LCS is a realistic choice to low carbon economy. The keys of the energy saving and energy structure optimization are the clean utilization of coal and development of new energy on a large scale.

DOI

[52]
Wang Q, Jiang X T, Li R, 2017b. Comparative decoupling analysis of energy-related carbon emission from electric output of electricity sector in Shandong Province, China.Energy, 127: 78-88.As a major contributor to carbon dioxide emissions, the electric power sector has instigated significant changes in environmental issues. To show the effectiveness of the program, research on whether the changes of electricity production and CO 2 emissions are out of sync are conducted by applying a decoupling elasticity analysis method. Then the decoupling index from the electricity analysis on the basis of the extended multilevel LMDI method are applied to study Shandong Province, covering the period from 1995 to 2012. Finally, a comparative decoupling stability analysis is applied. Our results indicate electricity output and coal consumption play significant roles in determining levels of CO2 emissions. Also, “relative decoupling” and “no decoupling” were the main states during the study period. We also found that the decoupling index performed better (in terms of stability) than did the electricity output elasticity of CO 2 emission.

DOI

[53]
Wang Q, Li R, 2016. Drivers for energy consumption: A comparative analysis of China and India.Renewable and Sustainable Energy Reviews, 62: 954-962.China and India accounted for two-thirds of the world07s rise in energy use between 2000 and 2012. This paper aimed to calculate theP(population)–A(affluence)–T(technology) effects of energy use in China and India – the world07s two most populous and largest developing countries. To this end, a combination of the IPAT method and the logarithmic mean divisia index technique, and annual time-series data on population, energy consumption, and gross domestic product during 1970–2012 are used. In China, a 12.53-fold growth of energy use emissions from 1970 to 2012 is driven by a combination of rapid growth in individual income and slow growth in population, with offset by technological advancement since 1980. The accelerating rise in energy use since 2000 is a result of accelerating growth rates in individual income and a reversal of earlier declining in energy intensity (technological advancement). Unlike China, the long-term rise in energy use exceeded the long-term rise in individual income in India. In addition, a strong trend of decline in energy intensity has not yet occurred in India. Thus, a 7.39-folds growth of Indian energy use for 1970–2012 was a result of relatively rapid increase in population and relatively slow increase in income, without effective offset by technological advancement. It suggests that market-oriented economic and energy reforms need to send the correct price signal to promote energy-efficient technologies thus improving energy efficiency, which is the key to a sustainable energy future in China and India.

DOI

[54]
Wang W W, Zhang M, Zhou M, 2011b. Using LMDI method to analyze transport sector CO2 emissions in China.Energy, 36(10): 5909-5915.China has been the second CO 2 emitter in the world, while the transportation sector accounts for a major share of CO 2 emissions. Analysis of transportation sector CO 2 emissions is help to decrease CO 2 emissions. Thus the purpose of this paper is to investigate the potential factors influencing the change of transport sector CO 2 emissions in China. First, the transport sector CO 2 emissions over the period 1985 2009 is calculated based on the presented method. Then the presented LMDI (logarithmic mean Divisia index) method is used to find the nature of the factors those influence the changes in transport sector CO 2 emissions. We find that: (1) Transport sector CO 2 emissions has increased from 79.67 Mt in 1985 to 887.34 Mt in 2009, following an annual growth rate of 10.56%. Highways transport is the biggest CO 2 emitter. (2) The per capita economic activity effect and transportation modal shifting effect are found to be primarily responsible for driving transport sector CO 2 emissions growth over the study period. (3) The transportation intensity effect and transportation services share effect are found to be the main drivers of the reduction of CO 2 emissions in China. However, the emission coefficient effect plays a very minor role over the study period.

DOI

[55]
Xiong C, Yang D, Huo J,et al. 2015. The relationship between energy consumption and economic growth and the development strategy of a low-carbon economy in Kazakhstan.Journal of Arid Land, 7(5): 706-715.Fossil energy is the material basis of human survival, economic development and social progress. The relationship between energy consumption and economic growth is becoming increasingly close. However, energy consumption is the major source of greenhouse gases, which can significantly affect the balance of the global ecosystem. It has become the common goal of countries worldwide to address climate change, reduce carbon dioxide emissions, and implement sustainable development strategies. In this study, we applied an approximate relationship analysis, a decoupling relationship analysis, and a trend analysis to explore the relationship between energy consumption and economic growth using data from Kazakhstan for the period of 1993–2010. The results demonstrated: (1) the total energy consumption and GDP in Kazakhstan showed a ”U”-type curve from 1993 to 2010. This curve was observed because 1993–1999 was a period during which Kazakhstan transitioned from a republic to an independent country and experienced a difficult transition from a planned to a market economy. Then, the economic system became more stable and the industrial production increased rapidly because of the effective financial, monetary and industrial policy support from 2000 to 2010. (2) The relationships between energy consumption and carbon emissions, economic growth and energy exports were linked; the carbon emissions were mainly derived from energy consumption, and the dependence of economic growth on energy exports gradually increased from 1993 to 2010. Before 2000, the relationship between energy consumption and economic growth was in a recessional decoupling state because of the economic recession. After 2000, this relationship was in strong and weak decoupling states because the international crude oil prices rose and energy exports increased greatly year by year. (3) It is forecasted that Kazakhstan cannot achieve its goal of energy consumption by 2020. Therefore, a low-carbon economy is the best strategic choice to address climate change from a global perspective in Kazakhstan. Thus, we proposed strategies including the improvement of the energy consumption structure, the development of new energy and renewable energy, the use of cleaner production technologies, the adjustment and optimization of the industrial structure, and the expansion of forest areas.

DOI

[56]
Xu X, 2010. The oil and gas links between Central Asia and China: A geopolitical perspective.OPEC Energy Review, 23(1): 33-54.This paper is dedicated to a better understanding of the oil and gas links between Central Asia and China and the sequential implications. The author's message is threefold. 1. China's growing economic momentum, coupled with its energy constraints, has led the country to search for overseas resources. Considering the fact that Central Asia enjoys prolific hydrocarbon resources, while China has huge energy demands, there is no doubt about the economic and geopolitical importance of Central Asian resources to China. What China needs to do now is to build a bridge to link these resources. The key rationale behind this is a regional energy linkage, which constitutes a new visionary way of handling input into China. 2. Considering the costs of the transportation infrastructure inside China and the comparison between the replacement costs of foreign and domestic oil, it makes sense for China to move westwards to maximise the benefits from Central Asia and other neighbouring regions. At the same time, China has to bear the huge cost of overseas expansion and high risk, both economically and geopolitically. 3. China cannot ignore the new "Great Game" played in Central Asia and the Caucasus region. All the major powers involved so far have their varying motivations and advantages to reap from their influence on the landlocked region. China, advantageously positioned on the border of Central Asia, sees an opportunity to broaden its geo-economic role in the region and beyond, so as to become a more important geopolitical force. At the turn of the century, China will give higher priority to market penetration and aggressive diplomacy. Further alliances and geopolitical goals in Central Asia, the Middle East and Russia will be explored. However, the benefits to China will depend on the effective management of uncertainties and the status of its geopolitical strength.

DOI

[57]
York R, Rosa E A, Dietz T, 2003. STIRPAT, IPAT and ImPACT: Analytic tools for unpacking the driving forces of environmental impacts.Ecological Economics, 46(3): 351-365.Despite the scientific consensus that humans have dramatically altered the global environment, we have a limited knowledge of the specific forces driving those impacts. One key limitation to a precise understanding of anthropogenic impacts is the absence of a set of refined analytic tools. Here we assess the analytic utility of the well-known IPAT identity, the newly developed ImPACT identity, and their stochastic cousin, the STIRPAT model. We discuss the relationship between these three formulations, their similar conceptual underpinnings and their divergent uses. We then refine the STIRPAT model by developing the concept of ecological elasticity (EE). To illustrate the application of STIRPAT and EE, we compute the ecological elasticities of population, affluence and other factors for cross-national emissions of carbon dioxide (CO 2) from fossil fuel combustion and for the energy footprint, a composite measure comprising impacts from fossil fuel combustion, fuel wood, hydropower and nuclear power. Our findings suggest that population has a proportional effect (unitary elasticity) on CO 2 emissions and the energy footprint. Affluence monotonically increases both CO 2 emissions and the energy footprint. However, for the energy footprint the relationship between affluence and impact changes from inelastic to elastic as affluence increases, while for CO 2 emissions the relationship changes from elastic to inelastic. Climate appears to affect both measures of impact, with tropical nations having considerably lower impact than non-tropical nations, controlling for other factors. Finally, indicators of modernization (urbanization and industrialization) are associated with high impacts. We conclude that the STIRPAT model, augmented with measures of ecological elasticity, allows for a more precise specification of the sensitivity of environmental impacts to the forces driving them. Such specifications not only inform the basic science of environmental change, but also point to the factors that may be most responsive to policy.

DOI

[58]
Zhang C, Liu C, 2015. The impact of ICT industry on CO2 emissions: A regional analysis in China.Renewable and Sustainable Energy Reviews, 44(44): 12-19.The existing literatures mainly focus on the relationships between ICT and CO2 emissions in developed countries from the perspective of technology, but little attention has been paid to China. Concerning regional differences in China, this paper investigates the impact of ICT industry on CO2 emissions at the national and regional levels using the STIRPAT model and provincial panel data during the period 2000–2010. The results show that ICT industry contributes to reducing China’s CO2 emissions and the impact of ICT industry on CO2 emissions in the central region is greater than that in the eastern region, while that in the western region is insignificant. The findings not only contribute to advancing the existing literature, but also deserve special attention from policymakers.

DOI

[59]
Zhang W, Li K, Zhou D,et al. 2016. Decomposition of intensity of energy-related CO2 emission in Chinese provinces using the LMDI method.Energy Policy, 92: 369-381.61Carbon emission intensity decreased rapidly from 1995 to 2012.61Energy intensity is the more significant driver for decrease of carbon intensity.61The most contribution of EI's decrease came from secondary industries.61The most contribution of CD's decrease came from secondary and tertiary industries.61Several policies of reducing carbon emission intensity in China have been raised.

DOI

[60]
Zhao Y, Li H, Zhang Z,et al. 2017. Decomposition and scenario analysis of CO2 emissions in China’s power industry: Based on LMDI method.Natural Hazards, 86(2): 645-668.Abstract The power industry is a major contributor to CO2 emissions in China and thus plays a critical role in achieving the targets of CO2 emission reduction. This study analyzes the historical trajectory and feature of CO2 emissions in China’s power industry, explores the driving factors of CO2 emission change using LMDI method, and develops two emission reduction scenarios to evaluate the reduction potential of CO2 emissions. Results show the following: (1) China’s power industry has experienced a significant but unstable increase in CO2 emissions from 343.18 Mt in 1985 to 3447.57 Mt in 2013, a growth rate of 904.60%. (2) Industrial-scale effect plays a dominant role in promoting CO2 emission growth in China’s power industry, and the corresponding contribution degree reaches 111.73%. Energy intensity effect contributes most to the decrease in CO2 emissions, with a contribution degree of 6116.82%. Capital productivity effect is another important factor leading to the increase in CO2 emissions. (3) The aggregate CO2 emission reduction in China’s power industry would reach 18,031.62 Mt in the ideal scenario and 15,466.03 Mt in the current policy scenario during 2014–2030. Finally, this study provides policy implications for energy-saving and CO2 emission reduction in China’s power industry.

DOI

Outlines

/