Research Articles

Reconstructing provincial cropland area in eastern China during the early Yuan Dynasty (AD1271-1294)

  • LI Meijiao , 1, 2 ,
  • HE Fanneng , 1, * ,
  • YANG Fan 1, 2 ,
  • LI Shicheng 3
Expand
  • 1. Key Laboratory of Land Surface Pattern and Simulation, Institute of Geographic Sciences and Natural Resources Research, CAS, Beijing 100101, China
  • 2. University of Chinese Academy of Sciences, Beijing 100049, China
  • 3. School of Public Administration, China University of Geosciences, Wuhan 430074, China
Corresponding author:He Fanneng, Professor, specialized in historical geography and environmental changes. E-mail:

Author: Li Meijiao, PhD Candidate, specialized in historical land use/cover change. E-mail:

Received date: 2018-03-09

  Accepted date: 2018-05-20

  Online published: 2018-12-20

Supported by

National Key R&D Program of China, No.2017YFA0603304; National Natural Science Foundation of China, No.41671149; The Special Program for Basic Work of the Ministry of Science and Technology, China, No.2014FY210900

Copyright

Journal of Geographical Sciences, All Rights Reserved

Abstract

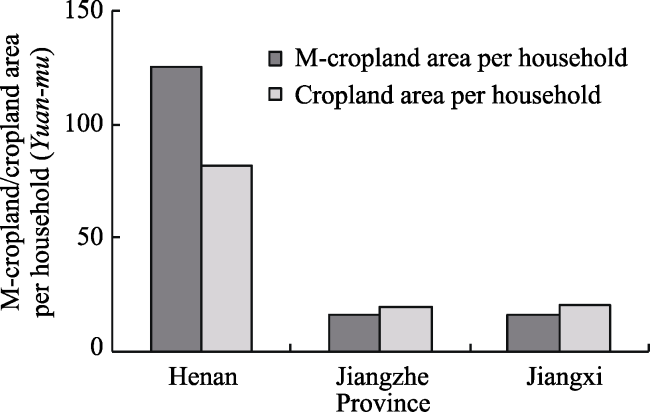
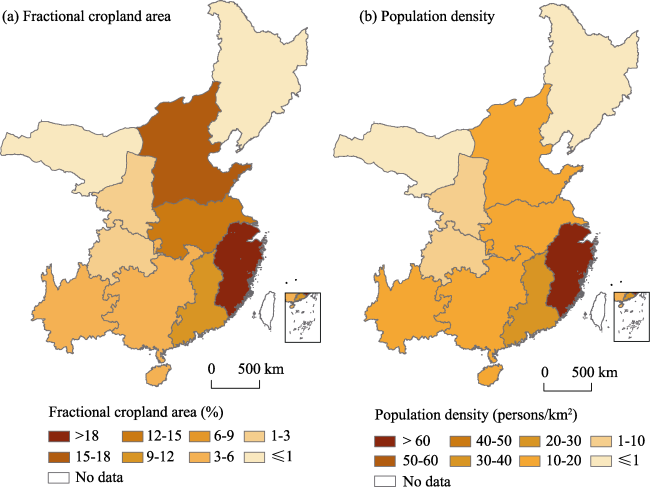
Reconstructing historical land use and land cover change (LUCC) at the regional scale is an important component of global environmental change studies and of improving global historical land use datasets. By analyzing data in historical documents, including military-oriented cropland (hereafter M-cropland) area, the number of households engaged in M-cropland (hereafter M-household) reclamation, cropland area, and the number of households, we propose a conversion relationship between M-cropland area and cropland area reclaimed by each household. A provincial cropland area estimation method for the Yuan Dynasty is described and used to reconstruct the provincial cropland area for AD1290. Major findings are as follows. (1) Both the M-cropland and cropland areas of each household were high in the north and low in the south during the Yuan Dynasty, which resulted from different natural conditions and planting practices. Based on this observation, the government-allocated M-cropland reclamation area to each household was based on the cropland area reclaimed by each household. (2) The conversion relationship between M-cropland and cropland areas per household showed conversion coefficients of 1.23 and 0.65 for the south and north, respectively. (3) The cropland area in the entire study area in AD1290 was 535.4×10⁶ mu (Chinese area unit, 1 mu=666.7 m2), 57.8% in the north and 42.2% in the south. The fractional cropland areas for the entire study area, north, and south were 6.8%, 6.6%, and 7.1%, respectively and the per capita cropland areas for the whole study area, north, and south were 6.7, 15.6, and 4.1 mu, respectively. (4) Cropland was mainly distributed in the middle and lower reaches of the Yellow River (including the Fuli area), Huaihe River Basin (including Henan Province), and middle and lower reaches of the Yangtze River (including Jiangzhe, Jiangxi, and Huguang provinces).

Cite this article

LI Meijiao , HE Fanneng , YANG Fan , LI Shicheng . Reconstructing provincial cropland area in eastern China during the early Yuan Dynasty (AD1271-1294)[J]. Journal of Geographical Sciences, 2018 , 28(12) : 1994 -2006 . DOI: 10.1007/s11442-018-1576-8

1 Introduction

Land use and land cover change (LUCC) is a significant factor in global environment change (Turner et al., 1994; Ramankutty et al., 2006; Mahmood et al., 2014; Arneth et al., 2017). As an important part of LUCC, historical land use and land cover change has also received wide attention because they provide long-term land use data for global environmental change studies (Brovkin et al., 2004; Fuchs et al., 2015a; Houghton et al., 2017). Finally, it is also regarded as an important theme in many global research projects, including Land-Use and Land-Cover Change (LUCC) (Turner et al., 1995), BIOME 300 (Robert et al., 2000), Global Land Project (GLP) (Ojima et al., 2007), and Land Cover 6k in the Past Global Change (PAGES, http://www.pages.org/).
Historical LUCC research has significantly progressed with the promotion of these global research projects, with the most representative achievements shown in several global-scale LUCC datasets. A historical database of global land use was produced by the Center for Sustainability and the Global Environment at the University of Wisconsin-Madison (Ramankutty and Foley, 1999); the latest version of this dataset covered the period 1700-2007 (Ramankutty, 2012). The Historical Database of the Global Environment (HYDE) was established by the National Institute for Public Health and the Environment, which has been updated several times, and the latest version, HYDE3.2, provides an improved description of cropland distribution for the period 10000BC-AD2015 (Klein Goldewijk et al., 2017). Based on these two datasets, Pongratz et al. (2008) reconstructed the global cropland and pasture dataset (hereafter PJ dataset) from AD800 to 1700 using historical population data as a proxy. In addition, an anthropogenic land cover change dataset, KK10, reconstructed global land use from 8000BC to AD1850 using the relationship between population and deforestation (Kaplan et al., 2009, 2011). These datasets have been widely used to reveal global and regional land cover change trends and estimate the effect of LUCC on global and regional environmental change (Tian et al., 2012; Kaplan et al., 2012). However, their publishers specifically stated that the global datasets can only be applied to continental-to-global scale studies and cannot be used at regional scale (Ramankutty and Foley, 1999). Some researchers also evaluated the reliability of these global datasets at regional scale; the results illustrated that these datasets have many uncertainties at the regional scale and do not reflect the trends and characteristics of land use change in China (Li et al., 2010; He et al., 2013; Zhang et al., 2013) and Europe (Kaplan et al., 2017). In addition, estimated results for regional carbon emissions using global datasets are quite different from the results using regional datasets (Klein Goldewijk et al., 2013). For instance, carbon emissions in China for the past 300 years estimated by Houghton et al. (1983) using global datasets were greater by 30%-50% than the results calculated by Chinese scholars Ge et al. (2008) using regional-scale datasets. Consequently, some scholars have reconstructed historical LUCC datasets at the regional scale (Waisanen and Bliss, 2002; Tian et al., 2014; Fuchs et al., 2015b; Lundmark et al., 2017). These regional studies can provide more reliable data at the regional scale compared to global datasets, and also can meet the needs of regional environmental change simulations.
China has a long history and abundant historical documents. The presence of these historical materials provides a great advantage for reconstructing historical LUCC. Given these abundant historical documents, Chinese scholars have conducted many studies estimating historical land use. For example, Ge et al.(2008) and Jin et al. (2015) calibrated the provincial cropland area of Chinese traditional agricultural regions over the past 300 years utilizing historical documents, modern surveys, and inventory data. Ye et al. (2009) reconstructed the cropland area of northeastern China over the past 300 years using historical data calibration in combination with a relationship model for multi-source cropland data. However, the bulk of existing research encompasses only the last three centuries. A few cropland reconstruction studies covering the last millennium have been conducted, including reconstructing provincial cropland area for AD976, 997, 1066, and 1078 in the Song Dynasty (from AD960 to AD1279) (He et al., 2017) and cropland area of Huizhou in the Ming Dynasty (from AD1368 to AD1644) (Zhao, 2003). However, reconstructions of provincial cropland area in the Yuan Dynasty (from AD1271 to AD1368), an important period of the last millennium in China, has not yet started due to a serious shortage of historical inventory data. The limited research on the Yuan Dynasty has been carried out based on military-oriented cropland (hereafter M-cropland) materials (Zhou, 1984; Wu, 2005; Chen, 2008).
These studies provide a good foundation for cropland reconstruction of the Yuan Dynasty. However, calculating the cropland area of the Yuan Dynasty at the provincial level remains a challenging problem. Therefore, the objective of this paper is to estimate cropland area at the provincial level using provincial M-cropland area and sporadic available cropland area data during the Yuan Dynasty. By analyzing land and tax systems and population policies, we explore the relationship between M-cropland area, number of households engaged in M-cropland (M-households), cropland area, and number of households, and propose an estimation method for provincial cropland area. We then apply these datasets and methods to reconstruct the provincial cropland area during the Yuan Dynasty.

2 Data sources

2.1 Study area

The Yuan Dynasty (AD1271-1368) was the first unified regime established by nomads in China. From AD1234 to 1271, the Mongolians gradually unified eastern China by conquering the Jin (AD1115-1234) and Southern Song (AD1127-1279) dynasties, the two dynasties divided by the Huaihe River. At its greatest, the territory extended north to Mongolia and Siberia, south to the South China Sea, southwest to include Tibet and Yunnan, northwest to eastern Xinjiang, and northeast to the Outer Hinggan Mountains and Sea of Okhotsk, which was larger than the present Chinese territory. In this study, the research area for the Yuan Dynasty territory is located within the boundaries of China (Figure 1), encompassing continental China, excluding Tibetan Plateau and Xinjiang, and covering an area of 5.26×10⁶ km2. After the Yuan Dynasty was established, the provincial boundary of the study area changed many times. The ten fixed administrative zones of the study area remained until AD1294 and included Zhongshu (also called Fuli areas), Liaoyang, Gansu, Shaanxi, Henan, Jiangzhe, Jiangxi, Huguang, Sichuan, and Yunnan provinces. In this study, the ten provinces were employed as the basic administrative unit of cropland area reconstruction.
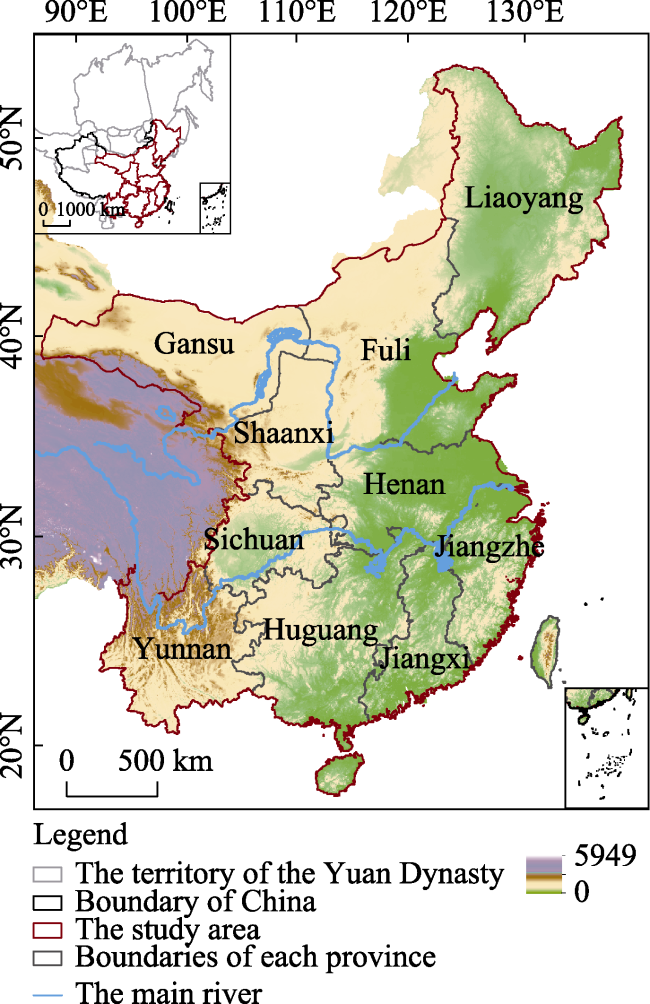
Figure 1 Illustration of the study area. The map of the Yuan Dynasty was obtained from the Historical Atlas of China (Tan, 1982), and the blue lines represent the current locations of the Yellow and Yangtze rivers today.

2.2 Military-oriented cropland area and number of households

The Chinese military-oriented agricultural system originated during the Han Dynasty. M-cropland was cultivated by station troops or farmers in the frontier areas. The characteristics of the M-cropland system are summarized as follows. (1) Wasteland was allocated uniformly to military or ordinary households (hereafter M-household) by the central or local government. (2) According to the area of allocated M-cropland, farm cattle, tools, and seeds were also provided to the M-households. (3) After harvest, the M-households delivered grain for military supplies according to quotas or shares (Guo et al., 1997). The M-cropland system in China attained the most prosperous status during the Yuan Dynasty.
After the Yuan Dynasty was established, the government organized large-scale M-cropland reclamation within the territory to reclaim abandoned cropland that resulted from the wars and provide military supplies for the frontier areas. Therefore, M-cropland played an important role in the finance and the military of the Yuan Dynasty. Provincial data, including M-cropland area and number of M-households, are recorded in detail in the Monograph on Military from the History of the Yuan Dynasty (《元史·兵志》) (Song, 1973a). According to the records, most M-cropland areas were reclaimed from AD1264 to 1294. Furthermore, M-cropland area data for the early Yuan Dynasty are reliable, and represent M-cropland area for AD1294.

2.3 Cropland area data

In the Yuan Dynasty, taxes were calculated based on the household unit. Therefore, the governor made much effort to register the number of households, and cropland was registered only incidentally. Therefore, most landholders underreported cropland area to the government to evade agricultural taxes. To increase national income, Emperor Renzong, AD1311- 1320, conducted a massive project to measure the real cropland area across the entire nation in AD1314. This project was first implemented in Henan, Jiangzhe, and Jiangxi provinces. All types of cropland were measured and recorded for the three provinces, with project completion in AD1328. However, because super-landholders lodged strong opposition, this project was not implemented in other regions of the country (Chen and Shi, 2000). Therefore, reliable cropland area is available only for the three provinces.
Specifically, cropland areas for Henan, Jiangzhe, and Jiangxi provinces were obtained from the Monograph on Food and Property from the History of the Yuan Dynasty (《元史·食货志》) (Song, 1973b). Cropland areas for Jiqing, Zhenjiang, and Qingyuan Lus (a secondary administrative region of the Yuan Dynasty) in Jiangzhe Province were derived from the New Jinling Chronicles (《金陵新志》) (Zhang, 1990), Zhenjiang Chronicles (《镇江志》) (Yu, 1990), and Siming Chronicles (《四明志》) (Yuan, 1990), respectively. Cropland areas for Guangzhou Lu and Xiangshan Counties in Jiangxi Province and Zengcheng County were obtained from the Nanhai Chronicles (《南海志》) (Chen and Lv, 1990).

2.4 Number of households

Data on the number of households at the provincial scale were obtained from the History of Chinese Population (Wu et al., 2000). Wu et al. (2000) calibrated the provincial number of households using a range of historical materials, including the Monograph on Geography from the History of the Yuan Dynasty, local chronicles, and materials for flood and drought disaster relief. The data are noted as appropriate for AD1290. In addition, Lu- and county-level data on the number of households were supplemented by chronicles for local regions from the Yuan Dynasty. The population density for each province within the study area was calculated using the number of households, mean persons per household (approximately five during the Yuan Dynasty), and the area of each province, which was obtained from the Historical Atlas of China (Tan, 1982).

3 Methods

3.1 Overview of methods

The aim of this study is to reconstruct the provincial cropland area during the early Yuan Dynasty. To accomplish this goal, there were two major steps (Figure 2):
1) Analyze the relationship between M-cropland area per household and cropland area per household. Based on the described historical inventory data and historical records for M-cropland area per household, cropland area per household and M-cropland system, we analyzed the relationship between M-cropland area and cropland area reclaimed per household. Subsequently, the regional conversion coefficient between the two variables was determined.
2) Estimate the provincial cropland area of the Yuan Dynasty for AD1290. Using the provincial number of households, M-cropland area per household, and conversion coefficient, we developed a provincial cropland area estimation model. This model was used to reconstruct the cropland area of the Yuan Dynasty for AD1290 at the provincial level. Finally, the spatial distribution characteristics of the provincial cropland area during the early Yuan Dynasty were analyzed.
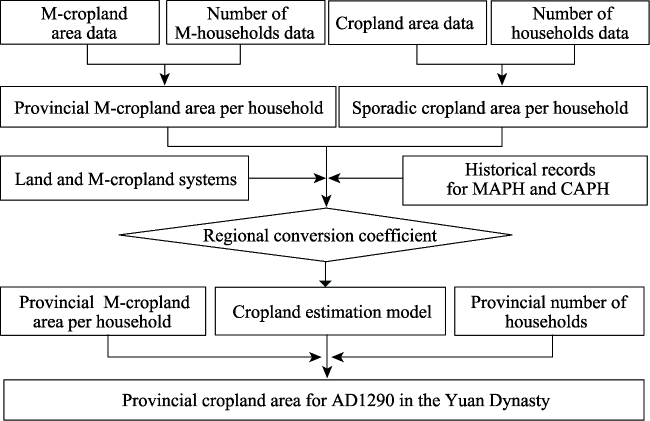
Figure 2 Scheme for reconstructing cropland area at the provincial level in the early Yuan Dynasty (MAPH and CAPH represent the M-cropland area per household and cropland area per household, respectively.)

3.2 The relationship between M-cropland and cropland for each household

Based on provincial M-cropland area and M-household numbers; sporadic provincial, Lu- or county-level cropland area; and data on the number of households recorded in local chronicles, we calculated the provincial M-cropland and sporadic cropland areas per household. The results show that M-cropland area per household was significantly different in the north and south (Figure 3), with high values in the north and low values in the south. Specifically, M-cropland areas per household for Fuli, Henan, and Liaoyang provinces primarily vary between 100 and 130 Yuan-mu (area unit of the Yuan Dynasty, 1 Yuan-mu = 600.0 m2). Shaanxi and Gansu provinces had values of approximately 60 Yuan-mu. However, in the south, values were distributed mainly between 15 and 20 Yuan-mu. The same observations are also found in historical documents and records. For instance, in the History of the Yuan Dynasty, M-cropland area per household for Nanyang Fu, the tertiary administrative region of the Yuan Dynasty, in Henan Province was about 150 Yuan-mu (Song, 1973c). However, in Tingzhou, Jiangzhe Province, the area was only 15 Yuan-mu (Hu, 1986). We hypothesize that this large difference was due to variations in the natural environment and planting practices between the north and the south.
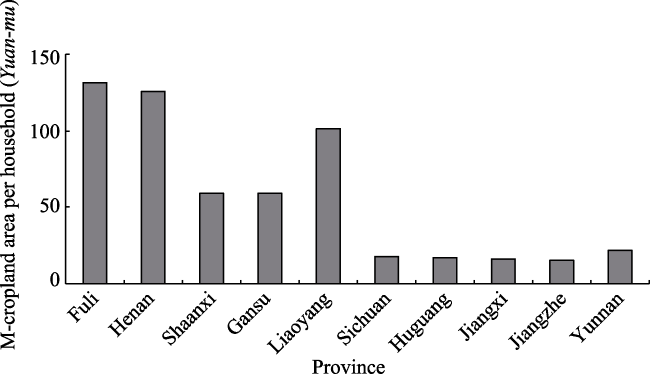
Figure 3 M-cropland area per household in each province in the Yuan Dynasty in AD1294
The cropland area per household had the same spatial pattern as M-cropland area per household (Figure 4). Specifically, in the north, Henan Province had a mean area of 81 Yuan-mu. In contrast, in the south, the values ranged between 20 and 35 Yuan-mu, and the values for Jiangzhe and Jiangxi provinces were 19 and 20 Yuan-mu, respectively. Historical documents from the Yuan Dynasty also record this dichotomy (Table 1). M-cropland area household and cropland area per household were well correlated in Henan, Jiangzhe, and Jiangxi provinces (Figure 5), which indicates that M-cropland reclamation area was allocated to each household by the government based on the local cropland area per household. Thus, to estimate the provincial cropland area using M-cropland area, we first analyzed the quantitative relationship between M-cropland area per household and cropland area per household using the sporadic historical data from the Yuan Dynasty.
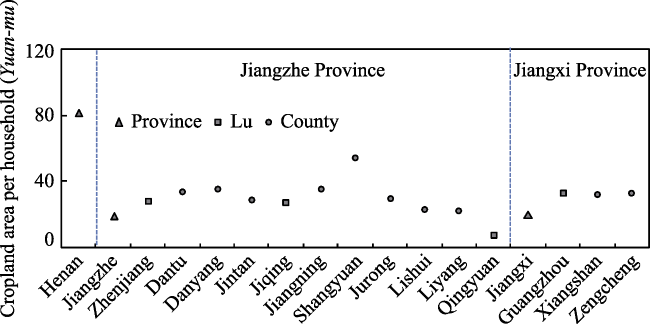
Figure 4 Cropland area per household in Henan, Jiangzhe, and Jiangxi provinces and their sub-level administrative regions for AD 1328
Table 1 Historical records describing cropland area per household during the Yuan Dynasty
Location Cropland area per
household (in Yuan-mu)
Literature source
North 80-100 Zishan Collected Works (Hu, 2003)
Shaoxing Lu in Jiangzhe Province 30 Wanzhai Collected Works (Gong, 2003)
Northeast 30 Continued Textual Research of Ancient China (Fang, 2003)
Yongfeng County in Jiangxi Province 5 Shenzhai Collected Works (Liu, 2003)
Figure 5 M-cropland area per household and cropland area per household during the Yuan Dynasty for Henan, Jiangzhe, and Jiangxi provinces

3.3 Determining regional conversion coefficients

The cropland area per household to M-cropland area per household ratios for Henan, Jiangzhe, and Jiangxi provinces are 0.65, 1.22, and 1.24, respectively (Figure 5). Jiangzhe and Jiangxi provinces are located in the south and have similar ratios, suggesting good accuracy. The mean ratio for the two provinces, 1.23, was used as the conversion coefficient for the south. While from only a single province in the north, the ratio for Henan Province, 0.65, was used as the conversion coefficient from M-cropland area per household to cropland area per household for the north.

3.4 Model for estimating provincial cropland area

Subsequently, using the provincial number of households, M-cropland area per household, and conversion coefficients, a model was developed to convert provincial M-cropland area into cropland area. The provincial cropland area estimation model is as follows:
${{C}_{k}}=\alpha \cdot {{H}_{k}}\cdot \left( \frac{{{C}_{kt}}}{{{H}_{kt}}} \right)\cdot \frac{\sum\nolimits_{i=1}^{n}{\frac{{{C}_{i}}}{{{H}_{i}}}}}{\sum\nolimits_{i=1}^{n}{\frac{{{C}_{it}}}{{{H}_{it}}}}}$
where Ck denotes the cropland area for k province, Hk refers to the number of households in k province, Ckt denotes the M-cropland area for k province, and Hkt is the number of M-households in k province. Ci and Cit denote the provincial cropland area and M-cropland area for the north, including Henan Province, or south, including Jiangzhe and Jiangxi provinces, respectively. Hi and Hit refer to the provincial number of households and M-households in the north or south, respectively. α is the conversion coefficient from Yuan-mu to mu, and its value is 0.92 (Wu, 2006).

4 Results and analysis

4.1 Cropland area during the early Yuan Dynasty

Using the proposed model and historical inventory data, we reconstructed the provincial cropland area during the early Yuan Dynasty (Table 2). The results show that the total cropland area of the entire study area in AD1290 was about 535.4×10⁶ mu and the fractional cropland area (FCA) was about 6.8%. The northern cropland area was 309.7×10⁶ mu, accounting for 57.8% of the total cropland area, and the associated FCA was 6.6%. The southern cropland area was 225.7×10⁶ mu, accounting for 42.2% of the total cropland area, and the associated FCA was 7.1%. The per capita cropland area for the whole study area was 6.7 mu, although this value varied significantly between the north and the south. The north value was 15.6 mu, while the south value was only 4.1 mu.
Table 2 Cropland area estimates for AD1290 in the Yuan Dynasty
Variable Entire study area North Proportion (%) South Proportion (%)
Cropland area (106 mu) 535.4 309.7 57.8 225.7 42.2
Fractional cropland area (%) 6.8 6.6 - 7.1 -
Per capita cropland area (mu) 6.7 15.6 - 4.1 -

4.2 Spatial distribution of the fractional cropland area

To reveal the characteristics of cropland spatial distribution, the FCA for each province in AD1290 was calculated using the reconstructed provincial cropland area and provincial land area provided in the Historical Atlas of China (Tan, 1982). As shown in Figure 6a, in the early Yuan Dynasty cropland area was distributed mainly in the middle and lower reaches of the Yellow River (including the Fuli area), Huaihe River Basin (including Henan Province), and middle and lower reaches of the Yangtze River (including Jiangzhe, Jiangxi, and Huguang provinces). The FCAs of these regions were greater than 5%. However, in the southwest (including Sichuan and Yunnan provinces), northwest (including Shaanxi and Gansu provinces), and northeast (including Liaoyang Province), the FCAs were 3% and lower.
Figure 6 The spatial distribution of fractional cropland area (a) and population density (b) in AD1290 at the provincial level
The middle and lower reaches of the Yellow River are traditional agricultural areas in China. On the eve of establishing the Yuan Dynasty, military materials for the Mongolian government were also primarily supplied by this region. For instance, in AD1266, to conquer the Southern Song Dynasty and unify the territory of the south, Kublai, the first emperor of the Yuan Dynasty, implemented several military policies to exhort the people of northern China to vigorously reclaim cropland to support military supplies to frontier areas (Song, 1973d). As a result, land reclamation in this region was greatly developed, and its FCA reached 16.6% in AD1290 (Figure 6a). However, the agriculture of this region was also influenced by the wars between the Jin Dynasty and Mongolian government.
The middle and lower reaches of the Yangtze River have been another significant agricultural area in China. Since the Tang Dynasty (AD618-907), most taxes to the central government were paid by this region. In the early Yuan Dynasty, the FCA in Jiangzhe Province was about 18.8% (Figure 6a) and the taxes remained higher than other provinces, accounting for 37.1% of the total. Within the other two provinces, i.e., Jiangxi and Huguang provinces, land reclamation levels of the north were comparable to that of Jiangzhe Province. But for the south of two provinces, land reclamation was restricted by their bad natural conditions and limited population resources. Therefore, FCAs for these two provinces were inferior to the value of Jiangzhe Province: about 9.6% and 5.2%, respectively.
The FCA of the Huaihe River Basin was lower than that of the two previously described regions: about 13.1% in AD1290 (Figure 6a). Before the Yuan Dynasty, this region was the main grain-producing area, and its FCA was similar to the value for the middle and lower reaches of the Yellow River. However, beginning in the AD1230s, wars between the Mongolian government and Jin and Southern Song dynasties resulted in a significant population decrease and degradation in cropland. Although large swaths of M-croplands, accounting for about one-third of the total M-cropland areas, were reclaimed in this region in the early Yuan Dynasty (Wu, 1997), land reclamation levels were still lower than those of past dynasties (He et al., 2017).
In comparison with other regions, land reclamation in the southwest, northwest, and northeast was less developed in the early Yuan Dynasty. For instance, the FCAs for Yunnan, Sichuan, Shaanxi, and Liaoyang provinces for AD1290 were only 3.4%, 2.3%, 2.1%, and 0.6%, respectively (Figure 6a). Their lower FCAs were mainly due to labor shortages in these regions. Influenced by wars, the population density in Sichuan Province decreased from 52 persons/km2 in AD1223 to 8 persons/km2 in AD1290. Population densities in the northeast were less than 3 persons/km2 in AD1290 (Figure 6b). Numerous M-cropland measures in the early Yuan Dynasty also failed to change the declining land reclamation levels in these areas. Finally, in Gansu Province, the arid climate was less suitable for agricultural production, which, coupled with a sparse population, resulted in an FCA of only 0.5% during the early Yuan Dynasty (Figure 6a).

5 Conclusions

In this study, we reconstructed provincial cropland area during the early Yuan Dynasty by analyzing historical records, including M-cropland area, number of M-households, cropland area, and number of households. The main conclusions are as follows.
(1) Both M-cropland area per household and cropland area per household were high in the north and low in the south. Regional differences resulted from variations in the natural environment and planting practices. Based on observed relationships, the government-allocated M-cropland reclamation area to each household was based on the cropland area reclaimed by each household. We established a model for this relationship using M-cropland area, number of M-households, and number of households at the provincial level. This model was used to estimate the provincial cropland area during the Yuan Dynasty. The calculated conversion coefficients for the north and south are 0.65 and 1.23, respectively.
(2) The total cropland area for the entire study area in AD1290 was 535.4×10⁶ mu and the FCA was 6.8%. In the north, the cropland area was 309.7×10⁶ mu, accounting for 57.8% of the total, and the FCA was about 6.6%. In the south, the cropland area was 225.7×10⁶ mu, accounting for 42.2% of the total, and the FCA was about 7.1%. The per capita cropland areas for the entire study area, north, and south were 6.7, 15.6, and 4.1 mu, respectively. Spatially, cropland was primarily distributed in the middle and lower reaches of the Yellow River (including the Fuli area), Huaihe River Basin (including Henan Province), and middle and lower reaches of the Yangtze River (including Jiangzhe, Jiangxi, and Huguang provinces). The FCAs for these regions were greater than 5%. However, in the southwest (including Sichuan and Yunnan provinces), northwest (including Shaanxi and Gansu provinces), and northeast, the FCAs were 3% or lower.
(3) Due to the shortage of historical inventory data, only provincial cropland area for AD1290 was reconstructed and some uncertainties remain. For example, the relationship between M-cropland area per household and cropland area per household was determined using the provincial M-cropland area per household and sporadic cropland area per household at the provincial, Lu, or county level. These sporadic data reflected the regional difference between the two indicators, but additional data would provide more reliable results. In addition, we estimated the conversion coefficient for the north and south regions of the study area. With more data, we could determine conversion coefficients at the provincial or lower level, which would reduce uncertainties in the reconstruction results.

The authors have declared that no competing interests exist.

[1]
Arneth A, Sitch S, Pongratz Jet al., 2017. Historical carbon dioxide emissions caused by land-use changes are possibly larger than assumed.Nature Geoscience, 10(2): 79-84.The terrestrial biosphere absorbs about 20% of fossil-fuel CO2 emissions. The overall magnitude of this sink is constrained by the difference between emissions, the rate of increase in atmospheric CO2 concentrations, and the ocean sink. However, the land sink is actually composed of two largely counteracting fluxes that are poorly quantified: fluxes from land-use change and CO2 uptake by terrestrial ecosystems. Dynamic global vegetation model simulations suggest that CO2 emissions from land-use change have been substantially underestimated because processes such as tree harvesting and land clearing from shifting cultivation have not been considered. As the overall terrestrial sink is constrained, a larger net flux as a result of land-use change implies that terrestrial uptake of CO2 is also larger, and that terrestrial ecosystems might have greater potential to sequester carbon in the future. Consequently, reforestation projects and efforts to avoid further deforestation could represent important mitigation pathways, with co-benefits for biodiversity. It is unclear whether a larger land carbon sink can be reconciled with our current understanding of terrestrial carbon cycling. Our possible underestimation of the historical residual terrestrial carbon sink adds further uncertainty to our capacity to predict the future of terrestrial carbon uptake and losses.

DOI

[2]
Brovkin V, Sitch S, Bloh W Vet al., 2004. Role of land cover changes for atmospheric CO2 increase and climate change during the last 150 years.Global Change Biology, 10(8): 1253-1266.

DOI

[3]
Chen D Z, Lv G S, 1990. Nanhai Chronicles: Vol. 6. Beijing: Zhonghua Book Company, 8417-8418. (in Chinese)

[4]
Chen G H, Shi W M, 2000. The General History of Chinese Economy. Beijing: The Economic Daily Press, 1-789. (in Chinese)

[5]
Chen R, 2008. Land exploitation and utilization in the Anhui areas during the Yuan Dynasty.Agricultural History of China, (4): 66-75. (in Chinese)The government lands and civil lands had been exploited and utilized as fully as possible in the Anhui areas during the Yuan Dynasty. The government lands occupied by the feudal regime were often used as official salary, opening up wasteland and growing food grain, bestowing on nobles and officials, graz- ing land. Opening up wasteland and growing food grain, which was flourishing and widely dispersed, lasted for a long time and made a strong impact. The civil lands occupied by the bureaucrat landlords, well- to- do land- lords, patriarchal clan landlords, land- holding peasants, schools run by the local people, temples, etc. had a lot of types. Lands occupied by the patriarchal clans and the schools, which were flourishing, had some regional features. Tenancy system was very popular in both the government lands and civil lands. Rent in kind was pri- mary and money rent was secondary in the form of government and civil land rent.

[6]
Fang H, 2003. Continued Textual Research of Ancient China:Vol.18. Shanghai: Shanghai Ancient Books Publishing House, 513. (in Chinese)

[7]
Fuchs R, Schulp C J E, Hengeveld G Met al., 2015a. Assessing the influence of historic net and gross land changes on the carbon fluxes of Europe.Global Change Biology, 22(7): 2526-2539.Abstract Legacy effects of land cover/use on carbon fluxes require considering both present and past land cover/use change dynamics. To assess past land use dynamics, model-based reconstructions of historic land cover/use are needed. Most historic reconstructions consider only the net area difference between two time steps (net changes) instead of accounting for all area gains and losses (gross changes). Studies about the impact of gross and net land change accounting methods on the carbon balance are still lacking. In this study, we assessed historic changes in carbon in soils for five land cover/use types and of carbon in above-ground biomass of forests. The assessment focused on Europe for the period 1950 to 2010 with decadal time steps at 1-km spatial resolution using a bookkeeping approach. To assess the implications of gross land change data, we also used net land changes for comparison. Main contributors to carbon sequestration between 1950 and 2010 were afforestation and cropland abandonment leading to 14.6 PgC sequestered carbon (of which 7.6 PgC was in forest biomass). Sequestration was highest for old-growth forest areas. A sequestration dip was reached during the 1970s due to changes in forest management practices. Main contributors to carbon emissions were deforestation (1.7 PgC) and stable cropland areas on peaty soils (0.8 PgC). In total, net fluxes summed up to 20302TgC02yr611 (9802TgC02yr611 in forest biomass and 10502TgC02yr611 in soils). For areas that were subject to land changes in both reconstructions (35% of total area), the differences in carbon fluxes were about 68%. Overall for Europe the difference between accounting for either gross or net land changes led to 7% difference (up to 11% per decade) in carbon fluxes with systematically higher fluxes for gross land change data.

DOI PMID

[8]
Fuchs R, Verburg P H, Clevers J G P W, et al., 2015b. The potential of old maps and encyclopaedias for reconstructing historic European land cover/use change.Applied Geography, 59(5): 43-55.61We examined the added value of old data for historic land reconstructions.61The study focuses on Continental Europe and the period around 1900.61Historic maps improved accuracy of the land allocation in our reconstruction by 16.5%.61Old maps improved the representation of spatial elements of landscapes in our model.61Historic land records showed strong agreement with independent data, such as old maps.

DOI

[9]
Ge Q S, Dai J H, He F Net al., 2008. Land use changes and their relations with carbon cycles over the past 300a in China.Science China Earth Sciences, 51(6): 871-884.中国科学院机构知识库(CAS IR GRID)以发展机构知识能力和知识管理能力为目标,快速实现对本机构知识资产的收集、长期保存、合理传播利用,积极建设对知识内容进行捕获、转化、传播、利用和审计的能力,逐步建设包括知识内容分析、关系分析和能力审计在内的知识服务能力,开展综合知识管理。

DOI

[10]
Gong S T, 2003. Wanzhai Collected Works:Vol. 7. Shanghai: Shanghai Ancient Books Publishing House, 53. (in Chinese)

[11]
He F N, Li M J, Li S C, 2017. Reconstruction of Lu-level cropland areas in the Northern Song Dynasty (AD976-1078).Journal of Geographical Sciences, 27(5): 606-618.Based on data on taxed-cropland area and on the number of households in historical documents, a probabilistic model of cropland distribution and a cropland area allocation model were designed and validated. Cropland areas for the years AD976, 997, 1066, and 1078 were estimated at the level of Lu(an administrative region of the Northern Song Dynasty). The results indicated that(1) the cropland area of the whole study region for AD976, 997, 1066, and 1078 was about 468.27 million mu(a Chinese unit of area, with1 mu=666.7m2), 495.53 million mu, 697.65 million mu, and 731.94 million mu, respectively. The fractional cropland area(FCA) increased from 10.7% to 16.8%, and the per capita cropland area decreased from 15.7 mu to 8.4 mu.(2) With regard to the cropland spatial pattern, the FCA of the southeast, north, and southwest regions of the Northern Song territory increased by 12.0%, 5.2%, and 1.2%, respectively. The FCA of some regions in the Yangtze River Plain increased to greater than 40%, and the FCA of the North China Plain increased to greater than 20%. However, the FCA of the southwest region(except for the Chengdu Plain) in the Northern Song territory was less than 6%.(3) There were 84.2% Lus whose absolute relative error was smaller than 20% in the mid Northern Song Dynasty. The validation results indicate that our models are reasonable and that the results of reconstruction are credible.

DOI

[12]
He F N, Li S C, Zhang X Zet al., 2013. Comparisons of cropland area from multiple datasets over the past 300 years in the traditional cultivated region of China.Journal of Geographical Sciences, 23(6): 978-990.AbstractLand use/cover change is an important parameter in the climate and ecological simulations. Although they had been widely used in the community, SAGE dataset and HYDE dataset, the two representative global historical land use datasets, were little assessed about their accuracies in regional scale. Here, we carried out some assessments for the traditional cultivated region of China (TCRC) over last 300 years, by comparing SAGE2010 and HYDE (v3.1) with Chinese Historical Cropland Dataset (CHCD). The comparisons were performed at three spatial scales: entire study area, provincial area and 60 km by 60 km grid cell. The results show that (1) the cropland area from SAGE2010 was much more than that from CHCD; moreover, the growth at a rate of 0.51% from 1700 to 1950 and 0.34% after 1950 were also inconsistent with that from CHCD. (2) HYDE dataset (v3.1) was closer to CHCD dataset than SAGE dataset on entire study area. However, the large biases could be detected at provincial scale and 60 km by 60 km grid cell scale. The percent of grid cells having biases greater than 70% (

DOI

[13]
Houghton R A, Hackler J L, 2003. Sources and sinks of carbon from land-use change in China.Global Biogeochemical Cycles, 17(2): 1034. doi: 10.1029/2002GB001970.1] Changes in land use contribute to the current terrestrial carbon sink in most regions of the northern midlatitudes but are poorly documented for China, the world's third largest country. We attempted to reconstruct the last 300 years of land-use change in China, emphasizing changes in the area of forests. Changes in the area of croplands were inadequate for reconstruction of forest loss because the long-term loss of forest area was more than twice the current area of croplands. We used historical information to reconstruct changes in forest area over time and the ecological literature to estimate the carbon stocks of the major natural ecosystems (vegetation and soil). We used a bookkeeping model to calculate the flux of carbon to or from living vegetation, dead vegetation, soils, and wood products under different types of land use. According to the data and assumptions, 180 (range: 80090009200) 0103 106 ha of forest were lost, and 1709000933 PgC were released to the atmosphere between 1700 and 2000. About 25% of the loss was from soils. The accelerated clearing and logging of forests in northeastern and southwestern China led to emissions of carbon that reached peaks of 0.20900090.5 PgC yr0908081 from the late 1950s through the 1970s. Lower rates of deforestation since then, as well as expanding areas of tree plantations, reversed the net flux of carbon from a source to a sink during the 1990s.

DOI

[14]
Houghton R A, Nassikas A A, 2017. Global and regional fluxes of carbon from land use and land cover change 1850-2015.Global Biogeochemical Cycles, 31(3): 456-472.The net flux of carbon from land use and land cover change (LULCC) is an important term in the global carbon balance. Here we report a new estimate of annual fluxes from 1850 to 2015, updating earlier analyses with new estimates of both historical and current rates of LULCC and including emissions from draining and burning of peatlands in Southeast Asia. For most of the 186 countries included we relied on data from Food and Agriculture Organization to document changes in the areas of croplands and pastures since 1960 and changes in the areas of forests and "other land" since 1990. For earlier years we used other sources of information. We used a bookkeeping model that prescribed changes in carbon density of vegetation and soils for 20 types of ecosystems and five land uses. The total net flux attributable to LULCC over the period 1850-2015 is calculated to have been 145 ± 16 Pg C (1 standard deviation). Most of the emissions were from the tropics (102 ± 5.8 Pg C), generally increasing over time to a maximum of 2.10 Pg C yrin 1997. Outside the tropics emissions were roughly constant at 0.5 Pg C yruntil 1940, declined to zero around 1970, and then became negative. For the most recent decade (2006-2015) global net emissions from LULCC averaged 1.11 (±0.35) Pg C yr, consisting of a net source from the tropics (1.41 ± 0.17 Pg C yr), a net sink in northern midlatitudes (-0.28 ± 0.21 Pg C yr), and carbon neutrality in southern midlatitudes.

DOI

[15]
Hu T C, 1986. Linting Chronicles: The Yongle Canon: Vol. 7892. Beijing: Zhonghua Book Company. (in Chinese)

[16]
Hu Z Y, 2003. Zishan Collected Works:Vols 22, 23. Shanghai: Shanghai Ancient Books Publishing House, 17, 38. (in Chinese)

[17]
Jin X B, Cao X, Du X Det al., 2015. Farmland dataset reconstruction and farmland change analysis in China during 1661-1985.Journal of Geographical Sciences, 25(9): 1058-1074.This research reconstructs China’s provincial farmland dataset in the last 300 years (1661–1985) by applying factor correction, citing replacement, linear interpolation, cohesion and contrast,...

DOI

[18]
Kaplan J O, Krumhardt K M, Ellis E Cet al., 2011. Holocene carbon emissions as a result of anthropogenic land cover change.The Holocene, 21(5): 775-791.

DOI

[19]
Kaplan J O, Krumhardt K M, Gaillard M Jet al., 2017. Constraining the deforestation history of Europe: Evaluation of historical land use scenarios with pollen-based land cover reconstructions.Land, 6(4): 91. doi: 10.3390/land6040091.

DOI

[20]
Kaplan J O, Krumhardt K M, Zimmerman N E, 2009. The prehistoric and preindustrial deforestation of Europe.Quaternary Science Reviews, 28(27/28): 3016-3034.Humans have transformed Europe's landscapes since the establishment of the first agricultural societies in the mid-Holocene. The most important anthropogenic alteration of the natural environment was the clearing of forests to establish cropland and pasture, and the exploitation of forests for fuel wood and construction materials. While the archaeological and paleoecological record documents the time history of anthropogenic deforestation at numerous individual sites, to study the effect that prehistoric and preindustrial deforestation had on continental-scale carbon and water cycles we require spatially explicit maps of changing forest cover through time. Previous attempts to map preindustrial anthropogenic land use and land cover change addressed only the recent past, or relied on simplistic extrapolations of present day land use patterns to past conditions. In this study we created a very high resolution, annually resolved time series of anthropogenic deforestation in Europe over the past three millennia by 1) digitizing and synthesizing a database of population history for Europe and surrounding areas, 2) developing a model to simulate anthropogenic deforestation based on population density that handles technological progress, and 3) applying the database and model to a gridded dataset of land suitability for agriculture and pasture to simulate spatial and temporal trends in anthropogenic deforestation. Our model results provide reasonable estimations of deforestation in Europe when compared to historical accounts. We simulate extensive European deforestation at 1000 BC, implying that past attempts to quantify anthropogenic perturbation of the Holocene carbon cycle may have greatly underestimated early human impact on the climate system.

DOI

[21]
Kaplan J O, Krumhardt K M, Zimmermann N E, 2012. The effects of land use and climate change on the carbon cycle of Europe over the past 500 years.Global Change Biology, 18(3): 902-914.The long residence time of carbon in forests and soils means that both the current state and future behavior of the terrestrial biosphere are influenced by past variability in climate and anthropogenic land use. Over the last half-millennium, European terrestrial ecosystems were affected by the cool temperatures of the Little Ice Age, rising CO2 concentrations, and human induced deforestation and land abandonment. To quantify the importance of these processes, we performed a series of simulations with the LPJ dynamic vegetation model driven by reconstructed climate, land use, and CO2 concentrations. Although land use change was the major control on the carbon inventory of Europe over the last 500 years, the current state of the terrestrial biosphere is largely controlled by land use change during the past century. Between 1500 and 2000, climate variability led to temporary sequestration events of up to 3 Pg, whereas increasing atmospheric CO2 concentrations during the 20th century led to an increase in carbon storage of up to 15 Pg. Anthropogenic land use caused between 25 Pg of carbon emissions and 5 Pg of uptake over the same time period, depending on the historical and spatial pattern of past land use and the timing of the reversal from deforestation to afforestation during the last two centuries. None of the currently existing anthropogenic land use change datasets adequately capture the timing of the forest transition in most European countries as recorded in historical observations. Despite considerable uncertainty, our scenarios indicate that with limited management, extant European forests have the potential to absorb between 5 and 12 Pg of carbon at the present day.

DOI

[22]
Klein Goldewijk K, Beusen A, Doelman Jet al., 2017. Anthropogenic land use estimates for the Holocene-HYDE 3.2.Earth System Science Data, 9(2): 927-953.This paper presents an update and extension of HYDE, the History Database of the Global Environment (HYDE version 3.2). HYDE is an internally consistent combination of historical population estimates and allocation algorithms with time-dependent weighting maps for land use. Categories include cropland, with new distinctions for irrigated and rain-fed crops (other than rice) and irrigated and rain-fed rice. Grazing lands are also provided, divided into more intensively used pasture and less intensively used rangeland, and further specified with respect to conversion of natural vegetation to facilitate global change modellers. Population is represented by maps of total, urban, rural population, population density and built-up area. The period covered is 1062000 before Common Era (BCE) to 2015 Common Era (CE). All data can be downloaded from <a href="https://doi.org/10.17026/dans-25g-gez3" target="_blank">https://doi.org/10.17026/dans-25g-gez3. We estimate that global population increased from 4.402million people (we also estimate a lower range 65<65620.01 and an upper range of 8.9 million) in 106200062BCE to 7.257 billion in 201562CE, resulting in a global population density increase from 0.03 persons (or capita, in short cap)62km612 (range 0–0.07) to almost 5662cap62km612 respectively. The urban built-up area evolved from almost zero to roughly 5862Mha in 201562CE, still only less than 0.562% of the total land surface of the globe. Cropland occupied approximately less than 162% of the global land area (136203762Mha, excluding Antarctica) for a long time period until 162CE, quite similar to the grazing land area. In the following centuries the share of global cropland slowly grew to 2.262% in 170062CE (ca. 29362Mha, uncertainty range 220–36762Mha), 4.462% in 185062CE (57862Mha, range 522–63762Mha) and 12.262% in 201562CE (ca. 159162Mha, range 1572–160462Mha). Cropland can be further divided into rain-fed and irrigated land, and these categories can be further separated into rice and non-rice. Rain-fed croplands were much more common, with 2.262% in 170062CE (28962Mha, range 217–36162Mha), 4.262% (54962Mha, range 496–60662Mha) in 185062CE and 10.162% (131662Mha, range 1298–132562Mha) in 201562CE, while irrigated croplands used less than 0.0562% (4.362Mha, range 3.1–5.562Mha), 0.262% (2862Mha, range 25–3162Mha) and 2.162% (27762Mha, range 273–27862Mha) in 1700, 1850 and 201562CE, respectively. We estimate the irrigated rice area (paddy) to be 0.162% (1362Mha, range 9–1662Mha) in 170062CE, 0.262% (2862Mha, range 26–3162Mha) in 185062CE and 0.962% (11862Mha, range 117–12062Mha) in 201562CE. The estimates for land used for grazing are much more uncertain. We estimate that the share of grazing land grew from 5.162% in 170062CE (66762Mha, range 507–82062Mha) to 9.662% in 185062CE (119262Mha, range 1068–130462Mha) and 24.962% in 201562CE (324162Mha, range 3211–327062Mha). To aid the modelling community we have divided land used for grazing into more intensively used pasture, less intensively used converted rangeland and less or unmanaged natural unconverted rangeland. Pasture occupied 1.162% in 170062CE (14562Mha, range 79–17562Mha), 1.962% in 185062CE (25362Mha, range 218–28762Mha) and 6.062% (78762Mha, range 779–79562Mha) in 201562CE, while rangelands usually occupied more space due to their occurrence in more arid regions and thus lower yields to sustain livestock. We estimate converted rangeland at 0.662% in 170062CE (8262Mha range 66–9362Mha), 162% in 185062CE (12962Mha range 118–13662Mha) and 2.462% in 201562CE (31062Mha range 306–31262Mha), while the unconverted natural rangelands occupied approximately 3.462% in 170062CE (43762Mha, range 334–53362Mha), 6.262% in 185062CE (81062Mha, range 733–88162Mha) and 16.562% in 201562CE (214562Mha, range 2126–216462Mha).

DOI

[23]
Klein Goldewijk K, Verburg P H, 2013. Uncertainties in global-scale reconstructions of historical land use: An illustration using the HYDE data set.Landscape Ecology, 28(5): 861-877.AbstractLand use and land-use change play an important role in global integrated assessments. However, there are still many uncertainties in the role of current and historical land use in the global carbon cycle as well as in other dimensions of global environmental change. Although databases of historical land use are frequently used in integrated assessments and climate studies, they are subject to considerable uncertainties that often are ignored. This paper examines a number of the most important uncertainties related to the process of reconstructing historical land use. We discuss the origins of different types of uncertainty and the sensitivity of land-use reconstructions to these uncertainties. The results indicate that uncertainties not only arise as result of the large temporal and spatial variation in historical population data, but also relate to assumptions on the relationship between population and land use used in the reconstructions. Improving empirical data to better specify and validate the assumptions about the relationship between population and land use, while accounting for the spatial and temporal variation, could reduce uncertainties in the reconstructions. Such empirical evidence could be derived from local case studies, such as those conducted in landscape ecology, environmental history, archeology and paleoecology.

DOI

[24]
Li B B, Fang X Q, Ye Yet al., 2010. Accuracy assessment of global historical cropland datasets based on regional reconstructed historical data: A case study in Northeast China.Science China Earth Sciences, 53(11): 1689-1699.

DOI

[25]
Liu Y S, 2003. Shenzhai Collected Works: Vol.9. Shanghai: Shanghai Ancient Books Publishing House, 7. (in Chinese)

[26]
Lundmark H, Josefsson T, Östlund L, 2017. The introduction of modern forest management and clear-cutting in Sweden: Ridö State Forest 1832-2014.European Journal of Forest Research, 136(2): 269-285.The effects of clear-cutting and potential alternatives continue to be hot topics during discussions of forestry and nature conservation. This study presents forest data from Rid02n, an island in Lake

DOI

[27]
Mahmood R, Pielke R A, Hubbard K Get al., 2014. Land cover changes and their biogeophysical effects on climate.International Journal of Climatology, 34(4): 929-953.ABSTRACTLand cover changes (LCCs) play an important role in the climate system. Research over recent decades highlights the impacts of these changes on atmospheric temperature, humidity, cloud cover, circulation, and precipitation. These impacts range from the local- and regional-scale to sub-continental and global-scale. It has been found that the impacts of regional-scale LCC in one area may also be manifested in other parts of the world as a climatic teleconnection. In light of these findings, this article provides an overview and synthesis of some of the most notable types of LCC and their impacts on climate. These LCC types include agriculture, deforestation and afforestation, desertification, and urbanization. In addition, this article provides a discussion on challenges to, and future research directions in, assessing the climatic impacts of LCC.

DOI

[28]
Ojima D S, McConnell W J, Moran E, et al., 2007. The future research challenge: The global land project. In: Terrestrial Ecosystems in a Changing World. Berlin and Heidelberg: Springer, 313-322.The Global Land Project (GLP) represents the joint, land-based research agenda of two major global change science programmes: (i) the International Geosphere-Biosphere Programme (IGBP), which original

DOI

[29]
Past Global Changes Working Group(PAGES), 2014.Land Cover 6k. .

[30]
Pongratz J, Reick C, Raddatz Tet al., 2008. A reconstruction of global agricultural areas and land cover for the last millennium.Global Biogeochemical Cycles, 22(3): 1-16.

[31]
Ramankutty N, 20122012. Global cropland and pasture data from 1700-2007. Accessed from .

[32]
Ramankutty N, Delire C, Snyder P, 2006. Feedbacks between agriculture and climate: An illustration of the potential unintended consequences of human land use activities.Global and Planetary Change, 54(1/2): 79-93.Agriculture has significantly transformed the face of the planet. In particular, croplands have replaced natural vegetation over large areas of the global land surface, covering around 18 million km 2 of the land surface today. To grow crops, humans have taken advantage of the resource provided by climate optimum temperature and precipitation. However, the clearing of land for establishing croplands might have resulted in an inadvertent change in the climate. This feedback might, in turn, have altered the suitability of land for growing crops. In this sensitivity study, we used a combination of land cover data sets, numerical models, and cropland suitability analysis, to estimate the degree to which the replacement of natural vegetation by croplands might have altered the land suitability for cultivation. We found that the global changes in cropland suitability are likely to have been fairly small, however large regional changes in cropland suitability might have occurred. Our theoretical study showed that major changes in suitability occurred in Canada, Eastern Europe, the Former Soviet Union, northern India, and China. Although the magnitude, sign, and spatial patterns of change indicated by this study may be an artifact of our particular model and experimental design, our study is illustrative of the potential inadvertent consequences of human activities on the land. Moreover, it offers a methodology for evaluating how climate changes due to human activities on the land may alter the multiple services offered by ecosystems to human beings.

DOI

[33]
Ramankutty N, Foley J A, 1999. Estimating historical changes in global land cover: Croplands from 1700 to 1992.Global Biogeochemical Cycles, 13(4): 997-1027.Human activities over the last three centuries have significantly transformed the Earth's environment, primarily through the conversion of natural ecosystems to agriculture. This study presents a simple approach to derive geographically explicit changes in global croplands from 1700 to 1992. By calibrating a remotely sensed land cover classification data set against cropland inventory data, we derived a global representation of permanent croplands in 1992, at 5 min spatial resolution [Ramankutty and Foley, 1998]. To reconstruct historical croplands, we first compile an extensive database of historical cropland inventory data, at the national and subnational level, from a variety of sources. Then we use our 1992 cropland data within a simple land cover change model, along with the historical inventory data, to reconstruct global 5 min resolution data on permanent cropland areas from 1992 back to 1700. The reconstructed changes in historical croplands are consistent with the history of human settlement and patterns of economic development. By overlaying our historical cropland data set over a newly derived potential vegetation data set, we analyze our results in terms of the extent to which different natural vegetation types have been converted for agriculture. We further examine the extent to which croplands have been abandoned in different parts of the world. Our data sets could be used within global climate models and global ecosystem models to understand the impacts of land cover change on climate and on the cycling of carbon and water. Such an analysis is a crucial aid to sharpen our thinking about a sustainable future.

DOI

[34]
Robert T, Watson I R, Noble B B, 2000. Land use,land-use change and forestry. Special Report of the Intergovernmental Panel on Climate Change. Cambridge: Cambridge University Press.The exchange of carbon between the atmosphere and biosphere is an important factor in controlling global warming and climate change. Consequently, it is important to examine how carbon flows between different pools and how carbon stocks change in response to afforestation, reforestation, and deforestation, and other land-use activities. This IPCC Special Report is a comprehensive, state-of-the-art examination of the scientific and technical implications of carbon sequestration and the global carbon cycle. It also examines environmental and socioeconomic issues, conservation, sustainable resource management, and development issues in relation to carbon sequestration. The volume will be invaluable for government policymakers, business/industry analysts and officials, environmental groups, and researchers in global change, atmospheric chemistry, soil science, and economics.

[35]
Song L, 1973a. Monograph on Military from the History of the Yuan Dynasty. Beijing: Zhonghua Book Company, 2558-2579. (in Chinese)

[36]
Song L, 1973b. Monograph on Food and Property from the History of the Yuan Dynasty. Beijing: Zhonghua Book Company, 2354. (in Chinese)

[37]
Song L, 1973c. The History of the Yuan Dynasty: Vol. 19. Beijing: Zhonghua Book Company, 415. (in Chinese)

[38]
Song L, 1973d. The History of the Yuan Dynasty: Vol. 156. Beijing: Zhonghua Book Company, 3670. (in Chinese)

[39]
Tan Q X, 1982. The Historical Atlas of China:The Sixth Book. Beijing: SinoMaps Press, 12-41. (in Chinese)

[40]
Tian H Q, Banger K, Bo Tet al., 2014. History of land use in India during 1880-2010: Large-scale land transformations reconstructed from satellite data and historical archives.Global and Planetary Change, 121(10): 78-88.61A gridded, annual database of land-use history (1880–2010) for India61A significant increase of deforestation rate under British rule61Increased forest area driven by government policies after the 1980s61Cropland area increased by 50millionha or 56% for the period from 1880 to 2010.61Rapid cropland expansion occurred during 1950–1980 driven by technology and policy.

DOI

[41]
Tian Y C, Li J, Ren Z Y, 2012. The cropland change and spatial pattern in Loess Plateau over past 300 years.Journal of Arid Land Resources and Environment, 26(2): 94-101. (in Chinese)Based on the crop land raster data of the Loess Plateau over past 300 years,we utilized Exploratory Spatial Data Analysis(ESDA) to analyze the change of crop land area of counties in the Loess Plateau over 300 years.The results indicated that in the past three hundred years,the crop land area in Loess Plateau showed the tendency from increase to decrease,and then increase again.The global Moran's I indexes for crop land area per capita at county level of Loess Plateau reached the significant positive spatial correlation.The crop land area among counties on Loess Plateau took on evident spatial accumulative effect.The two types of clusters(High-High and Low-Low) among counties on Loess Plateau had a significant zonation,and it's variation rule showed dramatic spatial differentiation characteristics.

[42]
Turner B L II, Meyer W B, Skole D L, 1994. Global land-use/land-cover change: Towards an integrated study.Ambio, 23(1): 91-95.Human actions are altering the terrestrial environment at unprecedented rates, magnitudes, and spatial scales. Land-cover change stemming from human land uses represents a major source and a major element of global environmental change. Not only are the global-level data on land-use and land-cover change relatively poor, but we need a much better understanding of the underlying driving forces for these changes. Many forces have been proposed as significant, but single-factor explanations of land transformation have proved to be inadequate. How the human causes interact, and under what circumstances each is important, are questions needing systematic research. An international and interdisciplinary agenda is currently being developed to address these issues, through several closely-connected foci of study. A division of the world according to common situations of environment, human driving forces, and land-cover dynamics will be followed by detailed study of the processes at work within each situation. The results will form the basis for a concurrent effort to develop a global land model that can offer projections of patterns of land transformation.

DOI

[43]
Turner B L II, Skole D L, Sanderson Get al., 1995. Land-use and Land-cover Change: Science/Research Plan.

[44]
Waisanen P J, Bliss N B, 2002. Changes in population and agricultural land in conterminous United States counties, 1790 to 1997.Global Biogeochemical Cycles, 16(4): 1137. doi: 10.1029/2001 GB001843.1] We have developed a data set of changes in population and agricultural land for the conterminous United States at the county level, resulting in more spatial detail than in previously available compilations. The purpose was to provide data on the timing of land conversion as an input to dynamic models of the carbon cycle, although a wide variety of applications exist for the physical, biological, and social sciences. The spatial data represent the appropriate county boundaries for each census year between 1790 and 1997, and the census attributes are attached to the appropriate spatial region. The resulting time series and maps show the history of population (17900900091990) and the history of agricultural development (18500900091997). The patterns of agricultural development reflect the influences of climate, soil productivity, increases in population size, variations in the general economy, and technological changes in the energy, transportation, and agricultural sectors.

DOI

[45]
Wu H, 2006. New Concise History of Chinese Measurement. Beijing: China Metrology Publishing House, 119-131. (in Chinese)

[46]
Wu H Q, 1997. Agricultural Geography of the Yuan Dynasty. Xi’an: Xi’an Cartographic Publishing House, 1-188. (in Chinese)

[47]
Wu S D, Ge J X, 2000. The History of Chinese Population:Vol.III. Shanghai: Fudan University Press. (in Chinese)

[48]
Wu W W, 2005. Investigation on the military-oriented cropland in the Huaihe River areas during the Yuan Dynasty.Journal of Historical Science, (8): 118-120. (in Chinese)

[49]
Ye Y, Fang X Q, RenY Yet al., 2009. Cropland cover change in Northeast China during the past 300 years.Science China Earth Science, 52(8): 1172-1182.Land use/cover change induced by human activities has emerged as a “global” phenomenon with Earth system consequences. Northeast China is an area where the largest land cultivation activities by migrants have happened in China during the past 300 years. In this paper, methods including documentary data calibration and multi-sourced data conversion model are used to reconstruct historical cropland cover change in Northeast China during the past 300 years. It is concluded that human beings have remarkably changed the natural landscape of the region by land cultivation in the past 300 years. Cropland area has increased almost exponentially during the past 300 years, especially during the past 100 years when the ratio of cropland cover changed from 10% to 20%. Until the middle of the 19th century, the agricultural area was still mainly restricted in Liaoning Province. From the late 19th century to the early 20th century, dramatic changes took place when the northern boundary of cultivation had extended to the middle of Heilongjiang Province. During the 20th century, three agricultural regions with high ratio of cropland cover were formed after the two phases of spatial expansion of cropland area in 1900s–1930s and 1950s–1980s. Since 1930s–1940s, the expansion of new cultivated area have invaded the forest lands especially in Jilin and Heilongjiang Provinces.

DOI

[50]
Yu X L, 1990. Zhenjiang Chronicles: Vol. 5. Beijing: Zhonghua Book Company, 2690-2694. (in Chinese)

[51]
Yuan J, 1990. Siming Chronicles: Vol. 12. Beijing: Zhonghua Book Company, 6511. (in Chinese)

[52]
Zhang X Z, 1990. New Jinlin Chronicles: Vol. 7. Beijing: Zhonghua Book Company, 5635-5643. (in Chinese)

[53]
Zhang X Z, He F N, Li S C, 2013. Reconstructed cropland in the mid-eleventh century in the traditional agricultural area of China: Implications of comparisons among datasets.Regional Environmental Change, 13(5): 969-977.AbstractReconstructions of historical cropland area and spatial distribution are necessary for studying human effects on the environment due to agricultural development. To understand the current status of reconstructions of cropland area and its spatial distribution in the mid-eleventh century in the traditional agricultural area of China, we compared three available datasets: the historic cropland inventories-based HE dataset, the population-based History Database of the Global Environment (HYDE) dataset, and the PJ dataset. The results indicate that the HYDE and PJ datasets estimated the regional mean cropland area fraction (a ratio of cropland area to total land area, hereafter, CAF) for the study area to be 0.12 and 0.09, respectively, both of which were lower than the HE estimation of 0.18. Moreover, both the HYDE and PJ datasets have a poor ability to capture the spatial distribution of the historical CAF. The HYDE dataset overestimated the cropland area in North China and underestimated the cropland area in the Yangtze River reach. The HYDE dataset also overestimated the cropland area along the great rivers in North China. The PJ dataset underestimated the cropland area in the old agricultural area and overestimated the cropland area in the relatively new agricultural area. These incorrect spatial distributions from the HYDE and PJ datasets mainly resulted from the underestimation of the historical population and an incorrect approach for the spatial allocation of cropland within China. The incorrect approach was mainly derived from a poor understanding of the historic spatial distribution of cropland. Using the expert knowledge of local historians may be an effective method to reduce the uncertainties in the global historic cropland reconstruction.

DOI

[54]
Zhao Y, 2003. An analysis of land data of the Huizhou area in the Ming and Qing dynasties.Historical Research in Anhui, (5): 84-89. (in Chinese)This article centers on the studies of land data of the Huizhou area combined historical taxation materials and modern statistics.In relation to some aspects,such as the examination on the land data about different time,the differences between taxation units and cultivated land data as well as the definition of saturation point on cultivated land area,the article explores that the taxation units during particular period in Huizhou can reflect the real land area,based on which it revalues the cultivated land area of Jia Qing and Dao Guang Period.

[55]
Zhou J Z, 1984. The military-oriented cropland of Henan Jiangbei province in the Yuan Dynasty.Historical Research in Anhui, (5): 10-17. (in Chinese)

Outlines

/