
Journal of Geographical Sciences >
Potential range expansion of the red imported fire ant (Solenopsis invicta) in China under climate change
Author: Wang Huanjiong: Associate Professor, specialized in climate change and biometeorology. E-mail: wanghj@igsnrr.ac.cn
Received date: 2017-06-12
Accepted date: 2017-11-16
Online published: 2018-12-20
Supported by
National Key Research and Development Program of China, No.2016YFC1201302
Copyright
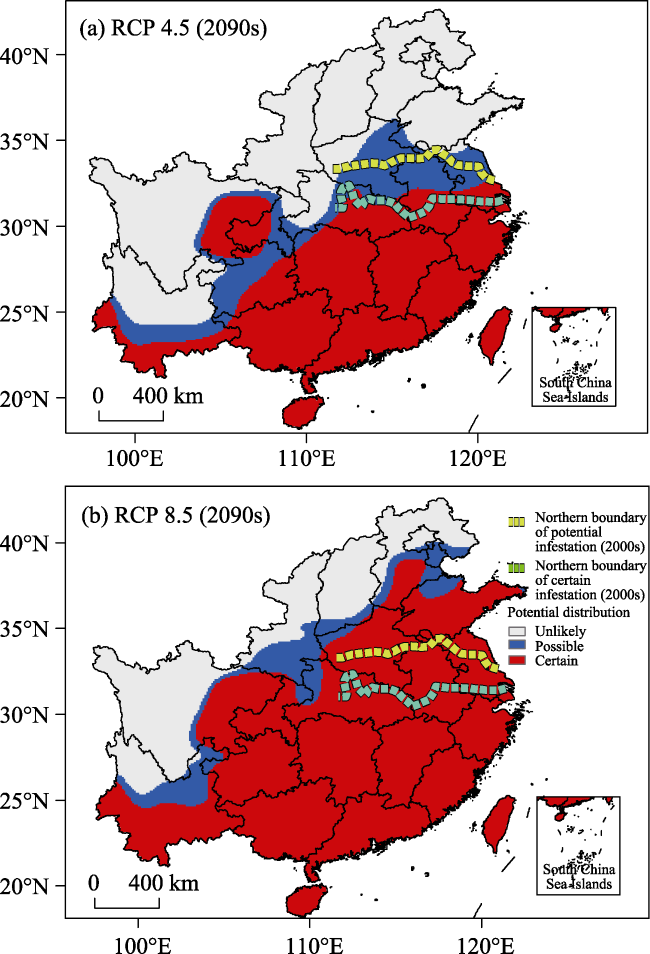
The red imported fire ant (RIFA, Solenopsis invicta), a notorious invasive insect, has received considerable attention owing to its impacts on native biodiversity, agriculture, and human health. Under global warming, the inhabitable area of the RIFA may be enlarged. However, few studies have focused on the potential range expansion of the RIFA in East Asia. Using a process-based physiological model, we simulated the potential range of the RIFA in China based on gridded temperature datasets for the current (2004-2012) and future (2090-2100) climates under Representative Concentration Pathway (RCP) 4.5 and RCP 8.5. It was found that the southeastern part of China (below 32°N) is suitable for RIFA proliferation. The present distribution area of the RIFA corresponds well with the potential range simulated by the model. In the RCP 4.5 and RCP 8.5 warming scenarios, the inhabitable area of the RIFA along the northern boundary would on average extend 101.3±85.7 (mean±SD) and 701.2±156.9 km, respectively, by the end of the 21st century. Therefore, future climate change would significantly affect the inhabitable area of the RIFA. Our results provide the basis for local quarantine officials to curtail accidental introductions of this insect, especially in the certain and possible infestation zones.
WANG Huanjiong , WANG Hui , TAO Zexing , GE Quansheng . Potential range expansion of the red imported fire ant (Solenopsis invicta) in China under climate change[J]. Journal of Geographical Sciences, 2018 , 28(12) : 1965 -1974 . DOI: 10.1007/s11442-018-1574-x
Table 1 Different possibilities of the reproductive success of the red imported fire ant (RIFA). asum: the total number of alates produced by a colony during its lifetime. P: mean annual precipitation during 2004-2012. |
| Types | Conditions |
|---|---|
| Certain infestation | asum≥3900 and P≥510 mm |
| Possible infestation | 1500≤asum<3900 and P≥510 mm |
| Unlikely infestation | asum<1500 or P<510 mm |
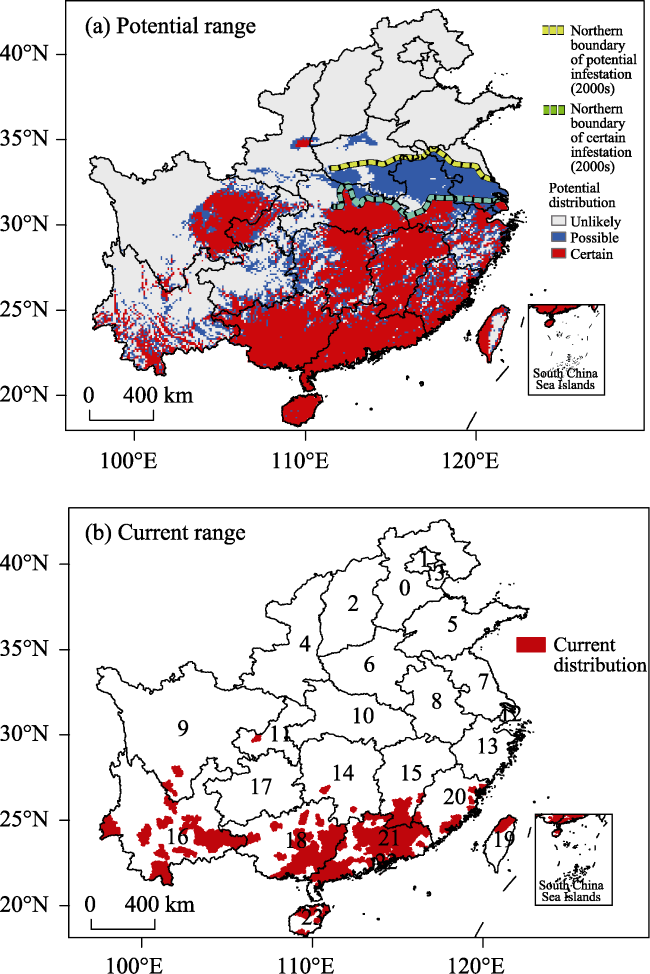
Table 2 Comparisons between the potential and current range of the red imported fire ant (RIFA) for each province or region |
| No. | Name | Total area | Current area | Potential range (%) | Comparison (%) | ||||
|---|---|---|---|---|---|---|---|---|---|
| Certain | Possible | Unlikely | Certain | Possible | Unlikely | ||||
| 23 | Hainan | 291 | 93(32.0%) | 98.6 | 1.4 | 0.0 | 100.0 | 0.0 | 0.0 |
| 21 | Guangdong | 1559 | 956(61.3%) | 92.5 | 4.9 | 2.6 | 94.0 | 4.2 | 1.8 |
| 18 | Guangxi | 2103 | 679(32.3%) | 85.6 | 9.2 | 5.1 | 97.1 | 2.5 | 0.4 |
| 15 | Jiangxi | 1527 | 174(11.4%) | 79.6 | 12.6 | 7.9 | 92.0 | 5.7 | 2.3 |
| 20 | Fujian | 1103 | 121(11.0%) | 62.0 | 24.1 | 13.9 | 80.2 | 12.4 | 7.4 |
| 22 | Hong Kong | 26 | 8(30.8%) | 57.7 | 0.0 | 42.3 | 87.5 | 0.0 | 12.5 |
| 19 | Taiwan | 322 | 62(19.3%) | 57.1 | 9.6 | 33.2 | 59.7 | 17.7 | 22.6 |
| 12 | Shanghai | 59 | NaN | 55.9 | 32.2 | 11.9 | NaN | NaN | NaN |
| 14 | Hunan | 1929 | 24(1.2%) | 55.7 | 24.0 | 20.4 | 62.5 | 33.3 | 4.2 |
| 11 | Chongqing | 770 | 13(1.7%) | 40.4 | 22.9 | 36.8 | 84.6 | 15.4 | 0.0 |
| 10 | Hubei | 1755 | NaN | 39.7 | 21.9 | 38.4 | NaN | NaN | NaN |
| 13 | Zhejiang | 937 | NaN | 38.5 | 33.5 | 28.0 | NaN | NaN | NaN |
| 8 | Anhui | 1331 | NaN | 22.8 | 63.3 | 14.0 | NaN | NaN | NaN |
| 9 | Sichuan | 4552 | 54(1.2%) | 20.3 | 7.8 | 71.9 | 24.1 | 25.9 | 50.0 |
| 16 | Yunnan | 3422 | 738(21.6%) | 18.6 | 15.9 | 65.5 | 29.0 | 27.6 | 43.4 |
| 17 | Guizhou | 1603 | NaN | 9.8 | 25.0 | 65.2 | NaN | NaN | NaN |
| 7 | Jiangsu | 976 | NaN | 2.0 | 61.4 | 36.6 | NaN | NaN | NaN |
| 4 | Shaanxi | 2041 | NaN | 1.5 | 4.7 | 93.8 | NaN | NaN | NaN |
| 2 | Shanxi | 1599 | NaN | 0.3 | 1.2 | 98.5 | NaN | NaN | NaN |
| 6 | Henan | 1612 | NaN | 0.0 | 35.2 | 64.8 | NaN | NaN | NaN |
| 0 | Hebei | 1967 | NaN | 0.0 | 0.0 | 100.0 | NaN | NaN | NaN |
| 1 | Beijing | 175 | NaN | 0.0 | 0.0 | 100.0 | NaN | NaN | NaN |
| 3 | Tianjin | 121 | NaN | 0.0 | 0.0 | 100.0 | NaN | NaN | NaN |
| 5 | Shandong | 1546 | NaN | 0.0 | 0.0 | 100.0 | NaN | NaN | NaN |
Note: The number of each province (or region) corresponds to the number shown in Figure 1b. The total area of each province and current inhabitable area of the RIFA were measured by the number of cells (0.1 °× 0.1°). The number in the bracket is the percentage of the total area where the RIFA has been reported. The “comparison” columns show the percentages of the current area where the probability of the RIFA being found are certain, possible, or unlikely. NaN indicates that the RIFA had not invaded this province/region by 2014. The province/regions were ordered by the percentage of the total area within the certain infestation zone. |
Figure 2 Potential range of the red imported fire ant (RIFA) in the warming scenarios. The northern boundary of the potential and certain infestation zones of the RIFA in the current climate condition (2004-2013) are shown: (a) RCP 4.5; (b) RCP 8.5. |
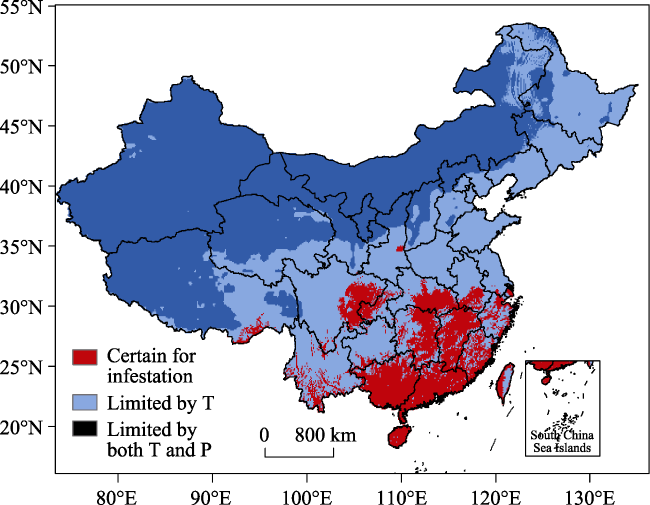
Figure 3 The factors limiting RIFA distribution in China. T: temperature; P: precipitation. |
Table 3 The difference in the number of cells within the certain infestation zone of the red imported fire ant (RIFA) between the 2000s and the 2090s in RCP 4.5 and RCP 8.5. |
| Number | Name | RCP 4.5 | RCP 8.5 |
|---|---|---|---|
| 6 | Henan | 9 | 1482 |
| 17 | Guizhou | 594 | 1388 |
| 5 | Shandong | 0 | 1309 |
| 16 | Yunnan | 259 | 1290 |
| 8 | Anhui | 455 | 1028 |
| 7 | Jiangsu | 316 | 956 |
| 14 | Hunan | 753 | 855 |
| 10 | Hubei | 101 | 846 |
| 13 | Zhejiang | 565 | 565 |
| 20 | Fujian | 417 | 417 |
| 0 | Hebei | 0 | 400 |
| 11 | Chongqing | 33 | 373 |
| 9 | Sichuan | ‒139 | 336 |
| 15 | Jiangxi | 312 | 312 |
| 18 | Guangxi | 248 | 302 |
| 19 | Taiwan | 133 | 133 |
| 21 | Guangdong | 112 | 112 |
| 12 | Shanghai | 19 | 19 |
| 4 | Shaanxi | ‒31 | 11 |
| 2 | Shanxi | ‒5 | 9 |
| 23 | Hainan | 4 | 4 |
| 1 | Beijing | 0 | 0 |
| 3 | Tianjin | 0 | 0 |
| 22 | Hong Kong | 0 | 0 |
Table S1 Standard values of model parameters derived from Korzukhin et al. (2001)) |
| Model parameters | Values |
|---|---|
| Max territory area, Smax | 100 m2 |
| Territory area at which worker mortality causes colony death, Smin | 0.02 m2 |
| Minimum area for colony production Srep | 10 m2 |
| Initial territory area, S0 | 0.01 m2 |
| Queen longevity, tmax | 3000 days |
| Colony proliferation parameter, q | 89 |
| The day of the year when colony founding, J0 | 165 |
| Temperature when colony growth begins, T1 | 21°C |
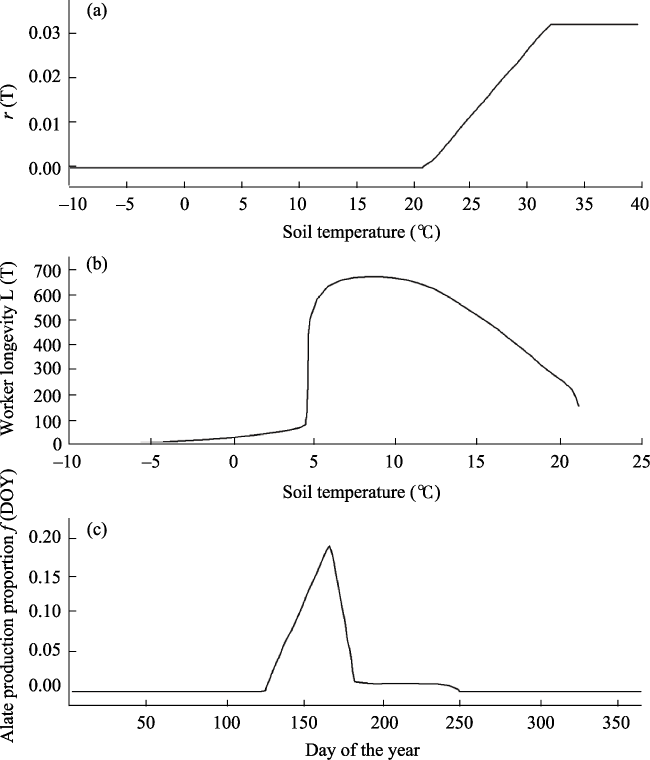
Figure S1 Three empirical curves used in the model of Korzukhin et al. (2001). (a) Colony growth rate in response to soil temperature (T). (b) Worker longevity L(T). 1/L(T) represents the colony decrease rate in response to T. (c) The share of resources directed to alate production f(DOY). DOY: day of the year. |
The authors have declared that no competing interests exist.
| [1] |
|
| [2] |
|
| [3] |
|
| [4] |
|
| [5] |
|
| [6] |
|
| [7] |
|
| [8] |
|
| [9] |
|
| [10] |
|
| [11] |
IPCC, 2013. Summary for policymakers. Climate Change 2013: The Physical Science Basis. In: Stocker T F,Qin D, Plattner G K, et al. Contribution of Working Group I to the Fifth Assessment Report of the Intergovernmental Panel on Climate Change. Cambridge: Cambridge University Press, 3-29.
|
| [12] |
|
| [13] |
|
| [14] |
|
| [15] |
|
| [16] |
|
| [17] |
|
| [18] |
|
| [19] |
|
| [20] |
|
| [21] |
|
| [22] |
|
| [23] |
|
| [24] |
|
| [25] |
|
| [26] |
|
| [27] |
|
| [28] |
|
| [29] |
|
| [30] |
|
| [31] |
|
| [32] |
|
/
| 〈 |
|
〉 |