Research Articles

Simulation of future land-use scenarios in the Three Gorges Reservoir Region under the effects of multiple factors

  • SHAO Jing’an , 1, 2 ,
  • DANG Yongfeng 3 ,
  • WANG Wei 3 ,
  • ZHANG Shichao 1, 2
Expand
  • 1. College of Geography and Tourism, Chongqing Normal University, Chongqing 400047, China
  • 2. Key Laboratory of Surface Process and Environment Remote Sensing in the Three Gorges Reservoir Area, Chongqing 400047, China
  • 3. Academy of Forestry Inventory and Planning, State Forestry Administration, Beijing 100714, China

Author: Shao Jing’an (1976-), Professor, specialized in regional environment evolution and climate responses. E-mail:

Received date: 2017-05-13

  Accepted date: 2017-08-31

  Online published: 2018-12-20

Supported by

Chongqing University Innovation Team for 2016, No.CXTDX201601017; Chongqing Research Program of Basic Research and Frontier Technology, No.cstc2017jcyjB0317

Copyright

Journal of Geographical Sciences, All Rights Reserved

Abstract

Model simulation and scenario change analysis are the core contents of the future land-use change (LUC) study. In this paper, land use status data of the Three Gorges Reservoir Region (TGRR) in 1990 was used as base data. The relationship between driving factors and land-use change was analyzed by using binary logistic stepwise regression analysis, based on which land use in 2010 was simulated by CLUE-S model. After the inspection and determination of main parameters impacting on driving factors of land use in the TGRR, land use of this region in 2030 was simulated based on four scenarios, including natural growth, food security, migration-related construction and ecological conservation. The results were shown as follows: (1) The areas under ROC curves of land-use types (LUTs) were both greater than 0.8 under the analysis and inspection of binary logistic model. These LUTs include paddy field, dryland, woodland, grassland, construction land and water area. Therefore, it has a strong interpretation ability of driving factors on land use, which can be used in the estimation of land use probability distribution. (2) The Kappa coefficients, verified from the result of land-use simulation in 2010, were shown of paddy field 0.9, dryland 0.95, woodland 0.97, grassland 0.84, construction land 0.85 and water area 0.77. So the results of simulation could meet the needs of future simulation and prediction. (3) The results of multi-scenario simulation showed a spatial competitive relationship between different LUTs, and an influence on food security, migration-related construction and ecological conservation in the TGRR, including some land use actions such as the large-scale conversion from paddy field to dryland, the occupation on cultivated land, woodland and grassland for rapid expansion of construction land, the reclamation of woodland and grassland into cultivated land, returning steep sloping farmland back into woodland and grassland. Therefore, it is necessary to balance the needs of various aspects in land use optimization, to achieve the coordination between socio-economy and ecological environment.

Cite this article

SHAO Jing’an , DANG Yongfeng , WANG Wei , ZHANG Shichao . Simulation of future land-use scenarios in the Three Gorges Reservoir Region under the effects of multiple factors[J]. Journal of Geographical Sciences, 2018 , 28(12) : 1907 -1932 . DOI: 10.1007/s11442-018-1571-0

As a source of strong human disturbance to particular regions, construction of hydraulic engineering projects, especially immense reservoir projects, necessarily leads to utilization, modification, and reshaping of the surface of areas impacted by construction, thereby deeply affecting local land-use pattern and process (Long et al., 2008; Zhang et al., 2009; Zhang et al., 2011). The construction of hydraulic engineering projects itself encompasses a series of strenuous human activities that can cause regional land-use change (LUC). Moreover, the land in reservoir regions is inevitably subject to the combined effects of activities following project construction, such as resettlements of environmental migrants, removal and reconstruction of cities and towns, supporting infrastructure construction as well as socio-economic development and post-resettlement support after completion of construction. This can further intensify the competition for space among original land use types (LUTs). As a result, the diversity of spatial pattern of land use is likely to increase or decrease (Jabbar et al., 2006; Zeng et al., 2011; Ni and Shao, 2013). In this study, an analysis was performed to identify natural, socio-economic factors that drove changes in land use and land management methods in the site of a large reservoir project and its surrounding areas. Based on the results of analysis, an empirical model for diagnosing LUC was created and used to simulate and forecast the evolution of future land use in the study area in different scenarios. The typical case investigated in this study can provide a reference for future research on LUC induced by construction of hydraulic engineering projects and the findings are expected to give deeper insights into the evolution of land use in the study area.
The Three Gorges Reservoir Region (TGRR) is a special geographic region that arose from the development and construction of the Three Gorges Project in China, one of the world’s largest water projects (Wu et al., 2003; Morgan et al., 2012). Due to its special location and physical geography, the TGRR has become a hot area of research on LUC (Liu and Feng, 2001; Shao et al., 2008; Zhang et al., 2009; Shao et al., 2013). Liu et al. (2005) have applied a Markov process to predict the land-use structure in Wanzhou District of Chongqing, which is situated at the heart of the TGRR. Cao et al. (2007) have simulated the spatial pattern of LUC in the TGRR in 2005 and 2010 using the CA and AO models. Dong et al. (2009) have used a localized SLEUTH model to simulate the processes of urban expansion and land use/cover change in the main urban districts of Chongqing. However while most of these studies have focused on simulation and analysis of historical LUC in the TGRR, few studies have provided simulation or scenario analysis of future LUC in this region. As a result, two important issues remain unresolved, including how different LUTs compete with each other under the effects of multiple factors and whether the LUC driven by the pursuit of self-interest by different parties is positive or negative. Additionally, very few studies have been done to simulate and predict LUC in the whole TGRR on a regional scale (Li et al., 2010; Wang et al., 2014). The CLUE-S model can be used for system dynamics modeling of competition between LUTs in a region based on quantification of the relationship between land use and factors driving LUC and the results can reveal both quantitative and spatial variations in land use. Thus this study used the CLUE-S model to simulate the LUC in the TGRR in different future scenarios, with an aim to uncover the competitive relationship among different LUTs.
In this study, the probabilities of conversion between LUTs were evaluated using an auto-logistic regression model based on neighborhood enrichment. The evaluation used the TGRR’s land-use data from 2000 as the base data and took into account the effects of the Three Gorges Project and the ensuing resettlement, development and construction on the region’s land use. The CLUE-S model was used to simulate the spatial pattern of land use in the TGRR in 2010 and the simulated pattern was verified through a comparison with the actual data. Then an empirical model for diagnosing LUC was constructed. Based on this, the paths of evolution of land-use pattern in different scenarios was modeled for the following two decades (between 2010 and 2030) using the CLUE-S model, for the purpose of deepening people’s awareness and understanding of the process of LUC in the TGRR.

1 Materials and methods

1.1 Regional overview

As a modern geographic concept, the TGRR is the region directly or indirectly affected by the backwater of the reservoir, including 32 districts or counties of Chongqing and Hubei (Figure 1). Extending over the medium-high mountains and valleys in central Hubei and the ridge-and-valley region in eastern Sichuan, the TGRR’s topography consists primarily of mountains and hills. The region has a dense drainage network. The main course of the Yangtze River runs through the region, and the Jialing and Wujiang rivers are its largest tributaries within the region. The main types of soil include purple soil, yellow-brown earth, paddy soil and limestone soil. Subtropical evergreen/deciduous forest and mixed coniferous forest are the major vegetation types of the TGRR; evergreen/deciduous broad-leaved forest is the major type of the region’s zonal vegetation. This region has diverse types of land use, with agricultural land accounting for a large proportion of total land area. Farming is practiced primarily on sloping farmland to adapt to the topography. The TGRR has experienced rapid expansion of construction land as a result of the migration, development and construction, especially expansion of urban functional development zone of Chongqing, built-up area of Yichang, and regions centered on cities and towns along rivers. The project of storing clear water and discharging muddy water of the reservoir frequently causes significant short-term changes to the water bodies in the TGRR. In addition to storing reservoir water, the Three Gorges Project involves relocation, removal and reconstruction of cities and towns, supporting infrastructure construction as well as socio-economic development and post-resettlement support (environmental migration and industrial restructuring, etc.) after completion of construction. These activities all have prompted rapid and profound changes in the land-use structure and land functions of the TGRR, especially sudden, continuous and long-lasting changes that have never being found in previous projects. Moreover, environmental problems induced by LUC become increasingly prominent and serious. Soil erosion by water, soil degradation and non-point source pollution are becoming new bottlenecks in the operation of the reservoir and regional development (Mao et al., 2002). After the Three Gorges Project was nearly completed and came into full operation in 2010, the entire reservoir region entered a new historical period called the post-resettlement period. The Central People’s Government issued the Follow-up Work Plan for the Three Gorges Project (the Plan) in order to address potential problems that may surface in the post-resettlement period. The Plan covers issues such as the well-being and prosperity of the migrants, socio-economic development, ecological conservation, prevention and control of geological disasters, and the impacts of the reservoir operation on the regions in the middle and lower reaches of the Yangtze River. The execution of the Plan would necessarily bring about new structural and functional changes in the TGRR’s land, thereby affecting the spatial pattern, process, and path of evolution of land use.
Figure 1 Administrative division and DEM of the Three Gorges Reservoir Region

1.2 Data sources

This subsection presents the main data sources used in the study: 1) The land-use data was obtained by correction and interpretation of the land use/cover data (1:100,000) for 2000 and 2010, which were provided by the Data Center for Resources and Environmental Sciences, Chinese Academy of Sciences. The data correction and interpretation were performed based on the results of a field survey and the outcomes were proved to meet related accuracy requirements. Application of the CLUE-S model requires each LUT involved to make up more than 1% of the total land area of the study area (Luo et al., 2010). Because the unused land in the TGRR accounted for far less than 1% of its total land area, this study only investigated the following six LUTs: paddy field, dryland, woodland, grassland, construction land and water area, which were measured in hectare. 2) The digital elevation model (DEM) data was downloaded from the website of the Environmental and Ecological Science Data Center for West China. Then the DEMs (in meter) of the TGRR were derived from the downloaded data by background subtraction and clipping. The ArcGIS Spatial Analyst was employed to extract data about slope gradient and aspect. 3) The data about administrative boundaries, roads, rivers, and residential areas came from the National Geomatics Center of China. 4) The precipitation and temperature data were offered by the National Meteorological Information Center and the meteorological bureaus of Chongqing and Hubei; they were sourced from 25 national weather stations and 42 local weather stations in the TGRR and its surrounding areas; the annual precipitations and annual average temperatures of different areas were extracted from the weather data and then the collaborative Kriging interpolation was performed on the data extracted in combination with the elevations of the stations. 5) The statistical data used in this study, including data on population (total population, urban population, and rural population), administrative area, GDP, food production, and fertilizer input, were obtained from the Statistical Yearbooks of Chongqing and Hubei, Rural Statistical Yearbooks of Chongqing and Hubei, and China County Statistical Yearbook for the period from 2000 to 2015.

1.3 Methods

1.3.1 Logistic regression analysis based on neighborhood enrichment
The traditional binary Logistic regression is often used to determine the probability of a certain LUT occurring in a certain cell. However, this method was rejected as a basis for simulation and prediction in future scenarios because it overlooks the spatial dependence of land-use data (Wu et al., 2008; Wu et al., 2010). In this study, a spatial autocorrelation factor was combined with land conversion probability and spatial autocorrelation between LUTs in neighboring cells to construct an auto-logistic model that is capable of reflecting the effects of spatial autocorrelation inherent in spatial statistical analysis (He et al., 2003). This model can be expressed as
${{P}_{i}}=\frac{exp({{\beta }_{0}}+{{\beta }_{1}}{{X}_{1i}}+\cdots \cdots +{{\beta }_{n}}Autoco{{v}_{i}})}{1+exp({{\beta }_{0}}+{{\beta }_{1}}{{X}_{1i}}+\cdots \cdots +{{\beta }_{n}}Autoco{{v}_{i}})}$ (1)
where Pi is the probability of the i-th LUT in a particular cell; X1i, X2i, …, Xni, are driving factors behind the conversion of the i-th LUT; β0 is a constant, and β1, β2, …, βn are the regression coefficients for the explanatory variables X; and Autocovi is the spatial autocorrelation factor.
The neighborhood enrichment in neighborhood analysis was introduced as the spatial autocorrelation factor Autocovi, in order to reflect the neighborhood relation among LUTs (Verburg et al., 2004). Then a binary Logistic regression analysis was performed, with the influence of neighbors being regarded as a driver behind LUC. The introduction of neighborhood enrichment complements the simple Logistic regression analysis. The neighborhood enrichment is defined as:
${{F}_{i,k,d}}=\frac{{{n}_{k,d,i}}/{{n}_{d,i}}}{{{N}_{k}}/N}$ (2)
where Fi,k,d is the neighborhood enrichment, in which i denotes the location of a raster cell, k represents LUT, and d is neighbor radius; nk,d,i is the number of cells containing the k-th LUT within a d radius of the i-th cell; nd,i is the total number of cells within a d radius of the i-th cell; Nk is the total number of cells containing the k-th LUT within the TGRR; and N is the total number of cells within the TGRR. The Neighborhood Statistics tool provided by ArcGIS9.3 was employed to set the size of each neighbor at 10 m by 10 m, which means that the distance between neighbors is 10 m.
The regression results were then evaluated using a Receiver Operating Characteristic (ROC) curve, also known as the sensitivity curve. As a composite indicator of the sensitivity and specificity of continuous variables, the ROC curve offers a graphical representation of the relationship between sensitivity and specificity. The values of sensitivity and specificity can be calculated by giving multiple cut-off values to the continuous variable. Then the ROC curve can be generated by plotting the sensitivity on the ordinate versus the (1-specificity) on the abscissa. The larger area under the curve, the higher the diagnostic accuracy (Pontius and Laura, 2001; Chen et al., 2015). The selected driving factors are normally considered to have good explanatory power when the values of ROC are greater than 0.7.
1.3.2 Simulation using the CLUE-S model
The CLUE-S model comprises two modules: non-spatial land demand and space allocation (Verburg et al., 2008; Verburg et al., 2010). The former is responsible for calculating a region’s annual demand for each LUT through analysis of driving factors like population, socio-economy and relevant policies and regulations. The latter serves to generate the spatial probability distributions of LUTs using methods such as empirical analysis and spatial variability and then allocate the results calculated by the module of non-spatial land demand to particular spatial locations. Simulation of the spatio-temporal dynamics of land use can be achieved through a number of iterations (Verburg et al., 2009; Zheng et al., 2015). The specific parameters are presented below:
1) Selection and acquisition of driving factors. The spatial pattern and process of land use have complex relationships with site conditions. Human activities aimed at meeting any kinds of human needs ultimately rely on land, but all take place within existing biological, economical, institutional, and technical frameworks. The physiographical factors (topography, hydrology, climate, soil, etc.) have significant control over land-cover types and are restricted by LUC. They exert effect on human activities related to land use, and thus on land-use conversion. The probability and possibility of LUC are to some extent determined by these factors. According to the competition model in neoclassical economics and the principle of optimal utility and best use, maximizing socio-economic and ecological benefits are the highest goal people pursue in activities related to land use. Therefore, socio-economic development (involving factors like population, traffic, economy) as well as policies and regulations (e.g. government project plans) that provide it convenience and guidelines are the major factors driving LUC. To use the CLUE-S model, the selected driving factors are required to be relatively stable or change in an abrupt manner rather than a gradual manner during the study period. In this study, four groups of factors that meet this requirement were selected after considering their availability, data consistency, measurability and correlation (Verburg, 2008), including topographic factors (elevation, slope gradient and slope aspect), climatic factors (annual precipitation and annual average temperature), distance factors (the distances to the nearest urban area, rural residential area, water area, and main roads), and socio-economic factors (population density, per capita GDP, rate of urbanization, food production per unit land area, and fertilizer input). The main roads refer to railway, expressway, national road, and county road. The distances can be obtained using the Euclidean distance tool offered by ArcGIS. Statistical data about the socio-economic factors were collected at district (county) level and the data were then rasterized.
2) Calculation of land demand. Calculation of land demand is a relatively independent module in the CLUE-S model. The land-use data from 2000 and 2010 were used as the base data needed for the simulation. The yearly land-use data for the study period were derived from the base data by quadratic polynomial interpolation. After verification, an empirical interpolation formula was yielded. The time step was set at one year for the quantitative simulation of land demand.
3) Delineation of the restricted area. The restricted area was the whole TGRR. The designed maximum water level of the reservoir has been 175 m since 2010. Because muddy water is discharged from the reservoir during the flood season from July to September and clear water is stored in the relatively dry season months of October and November, the area below this level is subject to seasonal submersion. Therefore, the LUT of this area was determined to be water area that would not change. The restricted area was then changed to be the reservoir region outside the areas below the water level of 175 m.
4) Determination of conversion elasticity coefficient and conversion rate matrix. The coefficient of elasticity of land-use conversion represented the probability that a given LUT will be converted to another LUT. It can be defined by the model parameter ELAS and its values fall within the range of 0 to 1. The higher the conversion elasticity coefficient of a LUT, the more stable the LUT is and the lower the probability that it will be turned into another LUT. Additionally, as the CLUE-S model is sensitive to changes in this coefficient, the conversion elasticity coefficients of the LUTs in the TGRR were determined after a series of efforts, including an overview of LUC in this region, creating a matrix of conversion rates for the period from 2000 to 2010, and adjustments to the model testing. The results are listed in Table 1. The conversion rate matrix shows the pattern of conversion between different LUTs. A conversion rate of 0 means that the LUT cannot be converted, while a conversion rate of 1 indicates that the LUT is changeable.
Table 1 The determination of elastic parameters of land-use conversion
Types of scenarios* Paddy field Dryland Woodland Grassland Construction land Water area
The simulation results in 2010 0.6 0.45 0.77 0.35 0.83 0.58
Natural growth Using the same simulation parameters as those in 2010
Food security 0.78 0.8 0.65 0.43 0.7 0.6
Migration-related construction 0.54 0.63 0.75 0.5 0.88 0.58
Ecological conservation 0.56 0.66 0.8 0.75 0.73 0.5

*Note: Types of scenarios as shown in Table 2.

Figure 2 shows the pattern of land-use conversion in the TGRR. For a sparsely populated region, the prediction of LUC normally does not take into account the conversion of construction land unless the future demand for construction land decreases. It is difficult to convert the dryland in the TGRR to paddy field, primarily because the site conditions of the dryland are unsuitable for paddy field farming and the cost of paddy field farming is much higher than dryland farming. This, together with the growing wages paid for nonfarm jobs, drives rural workers to shift away from agriculture to non-agricultural sectors on a large scale. In response, part of existing paddy field is currently cultivated in ways that require less labor input, primarily dryland farming. Moreover, the sloping farmland in the TGRR does not allow for mechanized farming and delivers just paltry returns. Due to these shortages and the shrinking labor force, arable land is left uncultivated and converted to woodland or grassland across the TGRR. The outflow of rural workers and the aging of those left behind further intensify this trend. Water area change is time dependent. During the period before 2010, the land along the banks of the Yangtze River and its main tributaries had been submerged by the periodic water storage in the Three Gorges Project. Therefore, the TGRR underwent greater expansion of water area than its shrinkage. Since 2010 when the project was nearly completed, the zone located between the designed maximum and minimum water levels had experienced repeated land conversion due to its fluctuating water levels, which makes it difficult to simulate and forecast local LUC. Therefore, the zone below the designed maximum water level, at 175 m, was treated as a changeless zone dominated by water area.
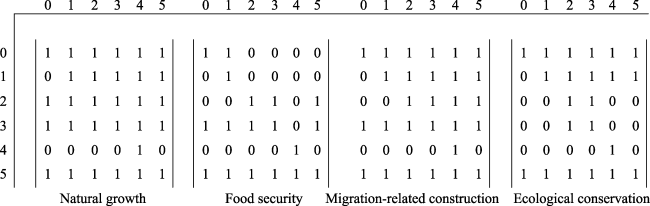
Figure 2 Matrix of land-use conversion rules under four scenarios
Note: The numbers from 0 to 5 outside straight line box were paddy field, dryland, woodland, grassland, construction land and water area, respectively. In the matrix, the means of 0 is not possible, and the means of 1 is feasible. The lines in the matrix mean transfer out, and the columns represent transfer in.
1.3.3 Validation of the simulation results
The results of LUC simulation were evaluated using the Kappa coefficient. The Kappa coefficient is frequently used to assess the accuracy of image classification. If two images differ significantly, the Kappa coefficient should be small (Liu et al., 2009). It can be expressed as:
K = (P0-Pc) / (1-Pc) (3)
P0 = s/n (4)
Pc = (a1·b1 + a0·b0)/n2 (5)
where K is the Kappa coefficient; P0 is the observed agreement between the raster graphics resulting from the actual land-use map and the simulation results; Pc is the expected agreement; N is the total number of pixels in each raster graphic; a1 and a0 represent the numbers of pixels with values of 1 and 0, respectively, in the actual raster graphic; b1 and b0 denote the numbers of pixels with values of 1 and 0, respectively, in the simulated raster graphic; and s is the number of pixels in the actual raster graphic that have the same values as the corresponding ones in the simulated raster graphic. The values of Kappa fall within the interval [0, 1]. The agreement can be divided into five levels based on the values of Kappa. The five levels and the corresponding value ranges of Kappa are as follows: 0.0-0.20: slight agreement; 0.21-0.40: fair agreement; 0.41-0.60: moderate agreement; 0.61-0.80: substantial agreement; 0.81-1: almost perfect agreement (Peng, 2013).
1.3.4 Design of land-use scenarios
Future scenarios were designed to analyze the possible patterns and processes of LUC in the TGRR. The TGRR is characterized by big cities and villages, massive mountains and a large reservoir. Therefore, it has experienced rapid and profound LUC driven by complex and varying factors during the process from damming the Yangtze River, to storing reservoir water, and then to the post-resettlement development. The LUC in each of the three stages has and will have much bearing on the regional and even national interests. In this context, governments in this region should not only ensure the food security, but also improve the well-being of the resettled people without sacrificing local ecological health. The land-use pattern and process in the TGRR are inevitably subject to the combined effects of the region’s economic development, fragility of ecosystem, and post-resettlement development and construction. After careful consideration of the status quo of land use as well as future socio-economic development strategies, four land-use scenarios were designed for forecasting the region’s future land demand; these scenarios emphasized natural growth, food security, migration-related construction, and ecological conservation, respectively. Land-use simulation was then performed in these scenarios for the period from 2020 to 2030, which was determined primarily based on the Plan prepared in 2010. Details of the four scenarios are given in Table 2.
Table 2 Land use demand in different scenarios of the Three Gorges Reservoir Region
Types of scenarios Description of scenarios
Natural growth Land-use simulation in natural growth scenario will be carried out in the future, using land-use change rate during 2000-2010 as the rate of future land-use change.
Food
security
Under the goal of “cultivated land protection and farmers’ income increase”, we should adhere to the policy of “red line” of cultivated land, avoid the number of cultivated land being controlled due to excessive exploitation and also meet the demand for grain growth. Therefore, the main purpose of setting up the food security scenario is to control the quantity and direction of cultivated land roll out following the actual conditions, and give priority to protecting the original high-quality contiguous cultivated land. Under the premise of grain self-sufficiency in the TGRR, the paddy field will continue to be transformed into dryland by driving practical interests. With the further increase of slope farmland abandonment and the implementation of a new round of policy of returning farmland to woodland, paddy field and dryland near the mountain area gradually transformed into forest and grassland. Thus, in the future, the area of paddy field and dryland in the TGRR will be reduced to some extent. At the same time, the water area may increase in order to improve the irrigation guarantee rate. In addition, according to the division of the main functional areas of Chongqing and Hubei, the woodland in the TGRR will still be effectively protected, and most of the forest areas are restricted development zones. Therefore, the forest land in the TGRR is basically unchanged. After 2010, when the TGRR entered the post immigration period, the growth rate of construction land slowed down, but it still maintained a certain rate of growth.
Immigration-related construction When the TGRR entered the post immigration period, the strategic focus of socio-economic development was to readjust the socio-economic development strategy, build a national ecological economic zone, and reconstruct the complete industrial structure of the TGRR. Therefore, the migration-related construction scenario is set up to meet the basic needs of the socio-economic development in the post immigration period. In this scenario, cultivated land in relatively flat terrain area will be significantly reduced. Woodland has been increased because of the implementation of policy of returning farmland to forest, and the abandonment of cultivated land. The grassland was reduced slightly because of it cultivated to farmland. In addition, with the rapid development of aquaculture in the TGRR, the water surface has increased rapidly.
Ecological conservation In the development strategy of ecological construction, the state has positioned the Three Gorges Reservoir as a strategic reserve of freshwater resources and positioned it as a national environmental protection zone and a key ecological functional reserve. Therefore, the main purpose of setting up ecological conservation scenario is to strictly protect ecological land (e.g., woodland, grassland, water area, etc.). Cultivated land, especially dryland, has been significantly reduced due to the implementation of ecological conservation measures such as returning farmland to forests and forest projects, and woodland and grassland have increased significantly. Because of irrigation and water conservancy facilities construction and aquacultural development, the water area will be relatively increased, but the range is not large. The policy of large-scale development and construction is prohibited, and the expansion rate of construction land is less than that of migration-related construction scenario.
1.3.5 Extraction of the patterns of LUC in different scenarios
Spatial overlays of the actual raster graphic for 2010 and the simulated ones for 2020 and 2030 from different scenarios were performed through an algebraic operation on the digital raster graphics, in order to extract polygons that can reflect the dynamics of land use over the three years. The operation can be written as:
code = (code2010+1) × 100 + (code2020+1) × 10 + code2030+1 (6)
where code is a code indicating the LUC occurring in a polygon between 2010 and 2030, and code2010, code2020, and code2030 are the original codes of the six LUTs (0 through to 5) in 2010, 2020, and 2030, respectively. Therefore, in the code yielded by the algebraic operation, the number in the hundreds place denoted the LUT in 2010, the number in the tens place denoted the LUT in 2020, and the number in the ones place represented the LUT in 2030; the original codes of paddy field, woodland, grassland, construction land, and water area were then replaced by numbers 1 through to 6. The LUC code represents the LUC occurring during the periods from 2010 to 2020 and from 2020 to 2030. For example, the code “112” indicates that the LUT is paddy field in both 2010 and 2020 and then it changes to dryland from 2020 to 2030.
Given its spatial and temporal variability, the LUC occurring between 2010 and 2030 in the TGRR was divided into three types: early change, late change and continuous change. A polygon showing early change experienced LUC only in the period between 2010 and 2020. For example, the LUC represented by the code “122” is classified as early change. Late changes only took place between 2020 and 2030. Codes like “112” reflect this LUC type. Continuous changes mean that LUC occurred in both periods. Codes like “121” and “124” represent this LUC type. The total areas subject to the three types of LUC (measured in km2) were calculated separately. The future spatiotemporal evolutions of the TGRR’s land use in different scenarios were then predicted from the results.

2 Results and analysis

2.1 Diagnosis of the driving factors behind LUC

The results of the ROC test (Table 3) show that the goodness of fit of the model for all LUTs were higher than 0.8. This demonstrates that the selected driving factors had good explanatory power and can be used to simulate and forecast the probabilities of LUTs in the TGRR in the future.
Table 3 Results of auto-logistic regression for different land use types in 2010
Code Paddy field Dryland Woodland Grassland Construction land Water area
Bata coefficient Exp
(B)
Bata coefficient Exp
(B)
Bata coefficient Exp
(B)
Bata coefficient Exp
(B)
Bata coefficient Exp
(B)
Bata coefficient Exp
(B)
sc1gr0 -0.0008 0.9992 -0.0005 0.9995 0.0003 1.0003 0.0003 1.0003 -0.0038 0.9962 -0.003 0.997
sc1gr1 -0.0452 0.9558 0.0217 1.0219
sc1gr2 0.001 1.001 -0.0007 0.999
sc1gr3 -0.001 0.999
sc1gr4 0.1485 1.1601
sc1gr5
sc1gr6 0.00001 1 -0.00001 0.99999 -0.0005 0.9995
sc1gr7 0.00001 1 -0.008 0.992
sc1gr8 -0.00001 1
sc1gr9 -7.95 0.0004 2.4797 11.9375 -29.5009 0
sc1gr10 0.0085 1.0086 0.0131 1.0132 -0.0094 0.9906
sc1gr11 -0.0001 0.9999
sc1gr12 0.0005 1.0005
sc1gr13 0.2594 1.2961
Lyfd0 0.738 2.0918
Lyfd1 1.4647 4.3261 0.2414 1.273
Lyfd2 -0.2814 0.7547 3.1686 23.7745
Lyfd3 0.0616 1.0636 1.0544 2.8702
Lyfd4 0.0952 1.0999
Lyfd5 -0.028 0.9723 0.114 1.121
Constant -1.258 0.2841 -2.8154 0.0599 -6.429 0.0016 -3.838 0.022 -2.269 0.103 0.851 2.342
ROC value 0.91 0.842 0.885 0.903 0.989 0.997
*Note: The type of factors represented by the encoded sc1gr0-sc1gr13 are sc1gr0 (elevation/m), sc1gr1 (slope degree/°), sc1gr2 (slope aspect), sc1gr3 (average annual rainfall/mm), sc1gr4 (average annual temperature/℃), sc1gr5 (the nearest distance to town/m), sc1gr6 (the nearest distance to rural settlements/m), sc1gr7 (the nearest distance to water area/m), sc1gr8 (the nearest distance to the main road/m), sc1gr9 (population density/(×104 person/km2)), sc1gr10 (urbanization rate/%), sc1gr11 (per capita GDP/(yuan/person)), sc1gr12 (per unit area grain production/(t/km2)), and sc1gr13 (chemical fertilizer input (pure calculation)/×104t), respectively. Lyfd0-Lyfd5 are the neighborhood abundance of the paddy field, dry land, woodland, grassland, construction land and water area, respectively. Beta coefficient is the coefficient of relationship diagnosed by logistic regression equation. Exp (B) is Beta coefficient taking as a natural power index coefficient to e as the base. Its value is equal to the ratio of the event, i.e., winning rate. ROC value is the goodness of fit.
The study found that the probability of paddy field had close correlations with topographic, climatic, and socio-economic factors. Elevation and slope gradient were negatively correlated with the probability of paddy field. Slope gradient exerted a dominant influence on the distribution of paddy field. With each 1° increase in slope gradient, the probability of paddy field decreased by 4.42%, suggesting that a steeper slope tended to have a smaller paddy field area. The probability of annual precipitation was approximately 1, suggesting that it contributed little to the distribution of paddy field. Population density had a strong negative correlation with the probability of paddy field, and the corresponding regression coefficient was -7.95. Each 10,000 people per km2 increase in population density was associated with a 99.96% decrease in the probability of paddy field, indicating that population had a great effect on the distribution of paddy field. Normally, paddy field is primarily distributed in densely populated areas. However, as the arable land per worker substantially increased due to the mass migration of rural workers seeking better-paid non-farm jobs, the relatively elderly left-behind workers in rural areas had to choose less labor-intensive LUTs. They usually transformed paddy field to dryland, which was one of the most common types of land conversion in this region. As a result, the dryland area increased while the paddy field area decreased. By contrast, the distribution of dryland was correlated only with elevation and distance factors, and their correlations were not strong. The probability of elevation was 0.9995. With each 1 m increase in elevation, the probability of dryland dropped by only 0.05%. The distance factors affecting the distribution of dryland included the distances to the nearest rural residential area, water area and key roads. Their probabilities were all 1, suggesting no significant influence on the distribution of dryland. In terms of neighborhood with other LUTs, the distribution of dryland was positively correlated with the distribution of grassland.
Major factors influencing the distribution of woodland included elevation, slope gradient and aspect, annual average temperature, distance to the nearest rural residential area, population density and food production per unit land area. Population distribution had the strongest influence; the probability of population density was as high as 11.9375. Annual average temperature was the second largest factor affecting the distribution of woodland, with every 1℃ rise in annual average temperature being associated with a 16.01% increase in the probability of woodland. Each 1° increase in slope gradient led to a 2.19% increase in the probability of woodland. The probabilities of elevation, slope aspect, distance to the nearest rural residential area, and food production per unit land area were around 1, indicating that the four factors contributed little to the distribution of woodland. Some socio-economic factors, such as population density, urbanization rate, and fertilizer input, were found to be capable of explaining, and significantly correlated with, the distribution of grassland, while elevation and per capita GDP had little influence. The probability of population density approached 0, suggesting that an area with a higher population density tended to have a lower probability of grassland. Urbanization rate affected the distribution of grassland in a way similar to how it affected the distribution of paddy field. Its probability was 1.0132, lower than that of urbanization rate. An additional 10,000 tons of fertilizer input tended to increase the probability of grassland by 27.3%.
Compared to other LUTs, the distribution of construction land and water area could be explained by fewer driving factors and their correlations were not significant. Elevation affected the distribution of construction land and water area in similar ways, as the two LUTs were located in similar topographic settings. In addition, the distribution of construction land was also affected by distance to the nearest rural residential area and urbanization rate. Distance to the nearest water area was another factor influencing the distribution of water area; the longer the distance, the lower the probability of water area.

2.2 Validation of the simulation results and characteristics of LUC

2.2.1 Characteristics of LUC
Table 4 shows that a total of 1,202.33 km2 of land in the TGRR, equivalent to 2.06% of the region’s area, was subject to LUC during the period from 2000 to 2010. This demonstrates that only localized LUC occurred in this region, which is consistent with the findings by Shao et al. (2013). The areas of paddy field and dryland lost were significantly larger than the areas of newly created paddy field and dryland. During the 10-year period, the TGRR experienced a huge loss of farmland, primarily due to the conversion of dryland (577.9 km2). Meanwhile, dryland was the major source of land for expansion of other LUTs. The area of newly created woodland (472.62 km2) exceeded the area of woodland lost (144.47 km2), as a result of vigorous growth of woodland. The newly created woodland mainly resulted from the conversion of farmland, especially dryland (242.78 km2). The newly formed water area (200.26 km2) was much larger than the water area lost (1.91 km2). The construction of the Three Gorges Project led to extensive submersion of the land along the banks of the Yangtze River. In this process, conversion of all other LUTs into water area occurred. The expansion of construction land (314.03 km2), which was attributed mostly to the conversion of farmland, far outpaced its shrinkage (14.15 km2). The lost farmland was primarily converted into woodland during the nationwide implementation of the “Grain for Green” program or occupied by construction land during the post-resettlement development and supporting infrastructure construction. The conversion of farmland to woodland mostly occurred on steeply sloping dryland, while the farmland occupied by construction land was mostly gentle sloping dryland and paddy field. In addition to sloping dryland, new woodland was also established on grassland by afforestation of barren hills. The enlargement of water area was primarily a result of reservoir construction. Paddy field, dryland and grassland can be easily converted and were thus at a disadvantage in the competition with other LUTs in the TGRR. Woodland possessed advantage in the competition for space due to the protection offered by relevant policies. Despite not being competitive enough, water area and construction land were the major products of the conversion of other LUTs and they have been at an advantage over other LUTs in the competition during the ten years. This was attributable to the development and construction in this region.
Table 4 Land-use conversion matrix in the Three Gorges Reservoir Region during 2000-2010 (km2)
2000 2010
Woodland Grassland Water area Construction land Paddy field Dryland Total transferring out area
Woodland 15.94 76.88 28.8 0.97 21.88 144.47
Grassland 195.89 32.02 14.66 0.45 51.57 294.6
Water area 0.02 0.12 0.81 0.04 0.94 1.91
Construction land 0.84 0.35 12.97 0 0 14.15
Paddy field 33.09 1.21 26.98 107.35 0.66 169.3
Dryland 242.78 121.26 51.41 162.42 0.02 577.9
Total transferring into area 472.62 138.87 200.26 314.03 1.49 75.06 1202.33
2.2.2 Validation of the simulation results
A comparison of the actual land-use map and the simulation results for 2010 (Figure 3) shows that the spatial locations of the six LUTs in the former were generally consistent with those in the latter, with no significant positional error. Only localized differences were observed between them.
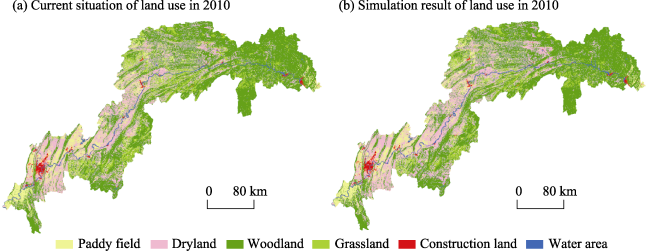
Figure 3 Land-use map (a) and simulation map (b) of the Three Gorges Reservoir Region in 2010
Table 5 reveals some differences in the areas of different LUTs between the actual land-use map and the simulated results. The simulated area of paddy field increased 681.7 km2 from its actual area, while the simulated area of dryland decreased 683.75 km2 from its actual area. As the increase in the paddy field area roughly offset the decrease in the dryland area, there was almost no net change in the farmland area. Compared to their actual areas, the simulated woodland and grassland expanded by 11 km2 and 1 km2, respectively, while the simulated construction land and water area shrunk by 9.5 km2 and 3 km2, respectively. The differences in these four LUTs’ areas were much smaller than those in paddy-field and dryland areas. This finding suggests that the conversion of paddy field to dryland and restoration of paddy field from dryland frequently occurred in the largely mountainous TGRR, due to the difficulty in the mechanization of farming and the increased opportunity cost of farming. This greatly complicated the simulation.
Table 5 The examinations of land-use modeling results in 2010
Inspection index Paddy field Dryland Woodland Grassland Construction land Water area
Status area/km2 6238.25 13643.25 29083 7538.5 693 992.5
Simulated area/km2 5556.5 14327 29094 7539.5 683.5 989.5
Overlap area/km2 5382 13180.5 28682 6469.25 598.5 767
Overlap rate/% 96.86 92 98.58 85.80 87.56 77.51
Kappa coefficient 0.90 0.92 0.97 0.84 0.85 0.77
The six LUTs were ranked in descending order of overlap ratio: woodland, paddy field, dryland, grassland, construction land, and water area. The Kappa coefficients of woodland, dryland, paddy field, grassland and construction land were higher than 0.81, indicating that the simulated spatial patterns of the five LUTs approximately coincided with their actual spatial patterns on a regional scale. The Kappa coefficient of water area was between 0.61 and 0.80. This relatively lower agreement was primarily due to the significant change in water area during the period from 2000 to 2010, i.e. the stage of storing reservoir water of the project.

2.3 Land-use simulation in future scenarios

2.3.1 Scenario 1: natural growth
In the scenario of natural growth, the main LUTs in the TGRR were woodland, grassland, dryland, and paddy field over the two decades between 2010 and 2030, and the spatial patterns of land use in 2020 and 2030 were largely consistent (Figures 4a and 4b).
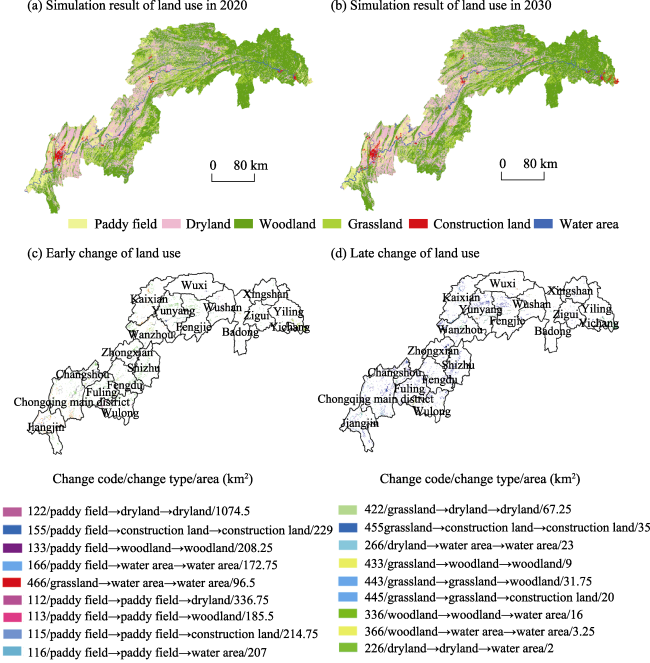
Figure 4 The spatial representation of evolution paths of main land uses under natural growth scenario in the Three Gorges Reservoir Region during 2010-2030
In this scenario, large-scale conversions of paddy field and grassland were the main types of land conversion in both the early period (from 2010 to 2020) and the late period (from 2020 to 2030). These conversions produced new dryland (from paddy field), construction land, woodland, and water area. As shown in Figures 4c and 4d, the conversion of paddy field into dryland was the most prominent form of conversion; a total of 1411.25 km2 of paddy field was replaced by dryland over the two periods. It took place in all districts and counties of Chongqing and was especially active in low mountainous and hilly areas. Extension of construction land was the second most prominent form of conversion; it primarily involved occupying paddy field (443.75 km2) and grassland (55 km2). The paddy field and grassland in gentle sloping areas were the first to be occupied during the construction of the TGRR, especially the sprawl or discontinuous expansion of urban areas. Abandoned dryland or paddy field was the major source of land for establishment of new woodland. The TGRR saw woodland area increases of 208.25 km2 in the early period and 185.5 km2 in the late period. The new woodland was largely distributed in the belt along the Yangtze River in Jiangjin District (at the tail of the reservoir region), the parallel ridges in the main urban districts of Chongqing, the hilly area in southern Chongqing, Wanzhou District and Kaixian County at the heart of the TGRR. The new water areas spread mainly over paddy field (379.75 km2) and grassland (139 km2) and sporadically over small areas of dryland and woodland.
2.3.2 Scenario 2: food security
The land-use simulation in the scenario of food security focused on the conversions of, and conversions to, paddy field and dryland and it was intended to raise the minimum requirements for food security in the future when food self-sufficiency occurs in the TGRR. Contiguous high-quality farmland was protected from conversion for other purposes that could pose a threat to food security. Figures 5a and 5b demonstrate that the localized expansion and shrinkage of paddy field and dryland did not affect the overall spatial pattern of farmland. The spatial pattern of contiguous high-quality farmland was consistent to its actual spatial pattern in 2010 and the simulated pattern in scenario 1. Similarly, no noticeable change was detected in the spatial patterns of woodland, grassland, construction land, and water area.
Figure 5 The spatial representation of evolution paths of main land uses under food security scenario in the Three Gorges Reservoir Region during 2010-2030
In the scenario of food security, the TGRR mainly underwent conversions from and to paddy field and dryland in both the early period (2010-2020) and the late period (2020-2030). The main forms of the conversions included the conversion of paddy field to dryland, expansion of construction land, leaving farmland uncultivated, and enlargement of water area. As can be seen in Figures 5c and 5d, the conversion of paddy field to dryland occurred only in the early period and produced 666 km2 of new dryland, which was less than half that in scenario 1. This suggests that this conversion was not as widespread as in scenario 1. The expansion of construction land was also not as significant as in scenario 1. The new construction land came primarily from the conversions of paddy field and dryland in both periods, which totaled 462.75 km2. The conversion of paddy field to dryland and expansion of construction land in scenario 2 were relatively moderate in comparison with scenario 1, because part of the paddy field and dryland were turned into grassland. This is the most profound contrast to scenario 1 where the grassland shrunk substantially. Additionally, some farmland was left uncultivated in the scenario of food security. The areas of new grassland created from uncultivated farmland in the early and the late periods were 163 km2 and 173.5 km2, respectively. The new grassland was distributed in Kaixian County, Wanzhou District, Shizhu County, and southern Jiangjin District of Chongqing as well as Badong, Yiling and other remote mountainous areas in Hubei.
2.3.3 Scenario 3: migration-related construction
In the scenario of migration-related construction, the LUC in the TGRR was primarily characterized by continuous expansion of construction land and the accompanying remarkable shrinkage of paddy field, dryland and grassland. Figures 6a and 6b reveal that the expansion of construction land was attributed largely to the expansion of urban areas, especially the counties and market towns along the Yangtze River in Chongqing. These included Changshou and Fuling districts which are close to the main urban districts of Chongqing, counties along the Yangtze River in the central part of the TGRR, and their surrounding villages and towns. The rapid expansion of these urban areas was largely propelled by the steady new urbanization throughout the country, which necessarily occupied surrounding farmland and grassland and thus put them at a disadvantage in the competition for space. The spatial pattern of woodland was relatively stable over the two periods, owing to its remoteness from urban areas and relevant regulatory protection.
In this scenario, the major forms of land conversion in the TGRR over the two decades were the expansion of construction land, conversion of paddy field and dryland, establishment of new woodland and expansion of water area. The expansion of construction land was much more active in scenario 3 (Figures 6c and 6d) than in scenarios 1 and 2. The new construction land (2146.25 km2) was derived mainly from paddy field, grassland and dryland, leading to shrinkage of the three LUTs. The land involved was concentrated in the cities and towns around the segment of the Yangtze River within the key urban districts and Wanzhou District of Chongqing, and scattered in urban areas along the primary and secondary tributaries of the Yangtze River. The conversion of paddy field to dryland (633.25 km2) took place only between 2010 and 2020, like in scenario 2. The new dryland derived from paddy field was found in all districts (counties) of Chongqing. Meanwhile, the growth of woodland was also noticeable. Over the two periods, 1166.75 km2 of new woodland was created from paddy field, dryland and grassland.
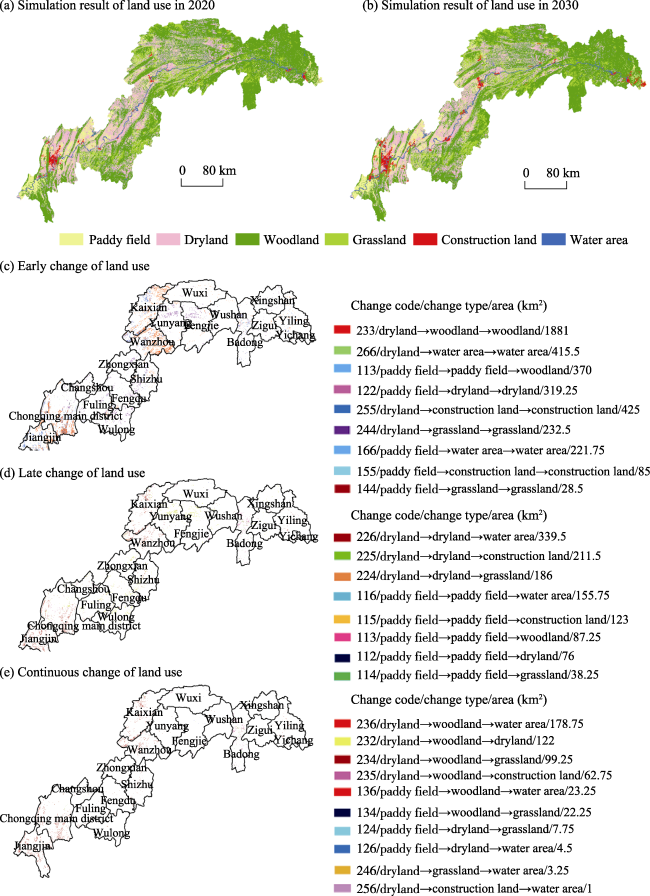
Figure 6 The spatial representation of evolution paths of main land uses under migration-related construction scenario in the Three Gorges Reservoir Region during 2010-2030
2.3.4 Scenario 4: ecological conservation
The land-use simulation in the scenario of ecological conservation focused on LUTs of high ecological value, such as woodland, grassland and water area. As illustrated in Figures 7a and 7b, the woodland, grassland and water area kept spreading from their actual scopes in 2010 outward to the surrounding paddy field and dryland. The wide distribution of paddy field and dryland made them vulnerable to the expansion of woodland, grassland and water area. In this scenario, therefore, the competition for space among the LUTs was reflected in the outward spreading land for ecological conservation (LEC) and the retreating cropland. Like in the previous three scenarios, the TGRR in this scenario also underwent the following five forms of land conversion: turning farmland back into forests, leaving farmland uncultivated, conversion of paddy field to dryland, expansion of construction land, and enlargement of water area. However, the land conversions usually occurred continuously in the two decades, which is the most striking difference from the other three scenarios.
Figure 7 The spatial representation of evolution paths of main land uses under ecological conservation scenario in the Three Gorges Reservoir Region during 2010-2030
As can be seen in Figures 7c and 7d, these five forms of conversion were more noticeable in the early period (2010-2020) than in the late period (2020-2030). The region’s LUC was dominated by extensive conversions of paddy field and dryland in both periods. Farmland suitable for forestation was turned back into forests, and steep or scattered farmland was usually left uncultivated. During the period between 2010 and 2020, a total of 2251 km2 of woodland was created from farmland, and the new woodland was concentrated in the mountainous areas in eastern Jiangjin, the southern part of Chongqing’s main urban district, Wanzhou District, and Kaixian County. In the period between 2020 and 2030, the region primarily underwent the conversion of paddy field into woodland (87.25 km2). Uncultivated paddy field and dryland were primarily turned into grassland. This conversion created in roughly equal areas of new grassland in the two periods: 261 km2 in the early period and 262 km2 in the late period. Compared to the other three scenarios, the conversion of paddy field to dryland in this scenario (395.25 km2) was less significant and more concentrated. Construction land also expanded over farmland; the area of farmland occupied by construction land was 702.25 km2, smaller than that area observed in scenario 3. Figure 7e demonstrates that the dominant continuous LUC was the change of farmland in 2010 to woodland in 2020 and then to other LUTs by 2030. The continuous changes occurred in limited areas compared to early changes and late changes and these areas were scattered in the TGRR. There were two continuous changes involving over 100 km2 of land: the change of dryland to woodland then to water area, and the change of dryland to woodland and then dryland. The competition between the LEC and the land protected for food security was more intense in this scenario than in other three scenarios.
2.3.5 Comparative analysis
A comparison of Figures 4-7 reveals the five dominant forms of land conversion the TGRR experienced in the four scenarios: conversion of paddy field to dryland, expansion of construction land, turning farmland back into forests, enlargement of water area, and leaving farmland uncultivated. The land areas involved in these land conversions between 2010 and 2030 were calculated from the data in Figures 4-7, for a comparison of the outcomes obtained from the four scenarios (Figure 8). As shown in Figure 8, the conversion of paddy field to dryland was most intense in the scenario of natural growth; the area of land involved in this conversion was 1411.25 km2, much greater than those in other scenarios (< 1,000 km2). The expansion of construction land was most dramatic in the scenario of migration-related construction; the construction land area increased by 1939.5 km2 to meet the land demand for construction. In the scenario of ecological conservation, the TGRR underwent large-scale conversion of farmland to woodland; the area of woodland created from farmland reached 2338.25 km2, larger than the areas of land involved in other conversions.
Figure 8 Scenario comparison of the main land-use change in the Three Gorges Reservoir Region during 2010-2030
This is because no additional limitation was imposed on this conversion (the conversion elasticity coefficient of woodland was set high, at 0.8). The expansion of water area and uncultivated land was also noticeable in the scenario of ecological conservation, primarily due to the limitations on the development of water area and grassland.

3 Discussion

3.1 Influences of the driving factors behind LUC

Driving factors behind LUC have been discussed in many studies. Among various models used in relevant research, the CLUE-S model is able to capture the combined effects of natural factors (elevation, slope gradient, precipitation, temperature, etc.) and socio-economic factors (population, income, urbanization, food, etc.) on multiple spatio-temporal scales and reveal the relationships between the spatial pattern of land use and the driving factors selected. The suitability of different LUTs in each spatial unit can be inferred from the results of simulation. This study found that elevation, slope gradient and precipitation had different degrees of negative correlation with the distribution of paddy field and dryland in the TGRR. This finding is similar to the result by Peng (2013) about the quantitative relationship between the TGRR’s land-use pattern and the factors influencing it. Slope gradient was found to be the major factor controlling the distribution of woodland in this region, which supports Zhang and Lou’s (2011) and Li et al.’s (2013) findings that “low lying and gentle sloping areas tend to have low densities of vegetation”. Compared to other LUTs, construction land and water area made up relatively small proportions of total land area. For this reason, there were relatively fewer factors influencing their overall distribution on a broad spatial scale. In this study, therefore, elevation and their distances to the nearest city and town, rural residential area, and water area were selected as the only factors influencing the distribution of the two LUTs. However, construction land and water area are extremely susceptible to impacts of human activities. Research has shown that the wave of development and construction triggered by the establishment of the TGRR, including the construction of the Three Gorges Project itself, has greatly promoted the expansion of construction land and water area in this region (Wang et al., 2013; Xiu et al., 2013).
The driving factor analysis described in this paper has two weaknesses. First, the CLUE-S model is unable to give full consideration to dynamic factors that are likely to vary sharply within a short period, such as policy- and project-related factors, due to its low sensitivity to such factors. It is therefore incapable of simulating abrupt LUCs, including those caused by the establishment of urban development zones and industrial parks. For example, the simulated evolution of the construction land in the main urban districts of Chongqing between 2000 and 2010 did not indicate the accurate direction of the city’s urban expansion during this period. Second, the simulation in this study failed to visually demonstrate the influences of policy- and project-related factors on land use, due to the difficulty in spatialization of these dynamic factors. For example, before the reservoir water level reached the designed maximum level (175 m), the LUC in the region took place within a very short span of time and thus did not allow for direct spatialization. Therefore, future studies should choose longer time spans and more diverse driving factors in order to achieve more accurate simulation.

3.2 Interpretation of the simulation results

The biggest advantage of the CLUE-S model in the LUC simulation is that it can allocate non-spatial land demand to particular spatial locations and define the level of difficulty in converting different LUTs. The four land-use scenarios described in this paper took into account both the general patterns of LUC, and the characteristics typical of the TGRR. For example, the conversion of paddy field into dryland, leaving farmland uncultivated and other forms of land conversion are common trends of LUC in China, and strict protection of woodland, grassland and other types of LEC, and active expansion of construction land and water area is obvious trend that is typical of the TGRR.
The conversion of paddy field to dryland occurred in the four scenarios. The land area involved in this conversion was substantially larger in the scenario of natural growth than in other three scenarios, which is consistent with the trend discovered by Shao et al. (2013) in a remote sensing study of the LUC in the TGRR during the hydraulic engineering construction of the Three Gorges Project. This phenomenon occurred because the land demand in this scenario was calculated using the rate of change observed over the period between 2000 and 2010, during which the conversion of paddy field to dryland was widespread while the conversions of paddy field to woodland and grassland are involved in smaller areas of land. Moreover, existing literature suggests that the conversion of paddy field and dryland into grassland had become a common trend in the TGRR. This trend has been accelerated by the rapid urbanization and industrialization after 2010 and the low comparative efficiency of farming (Shao et al., 2015; 2016). Therefore, this form of land conversion was included in the scenario design.
Strict protection of woodland, grassland and other types of LEC has been implemented in the TGRR since 2000 as a part of ecological improvement efforts. Efforts included turning farmland back into forests, forest engineering, etc. More importantly, the concept of ecological civilization defined at the 18th National Congress of the Communist Party of China and the strategic decision to protect the ecological environment of the TGRR made by General Secretary Xi Jinping at the beginning of 2016 offered policy support for the retention or extension of LEC. However, the expansion of LEC is bound to cause shrinkage of farmland, especially steep sloping farmland. The massive movement of rural young and prime working-age labor force to urban areas and the difficulty in mechanization of farming on steep sloping farmland were another two important drivers behind the conversion of farmland into woodland and grassland. Therefore, the expanding woodland and grassland occupied large tracts of farmland in the scenario of ecological conservation.
Expansion of construction land was most vigorous in the scenario of migration-related construction. It was propelled by a range of driving forces, including the resettlement of migrants to new settlements nearby, removal and reconstruction of cities and towns, supporting infrastructure construction, industrialization, new urbanization, construction of new socialist countryside, and the policy to relocate poor villages deep in high mountains. During the migration, large numbers of rural people moved to cities or leapfrogged from mountainous areas with rugged terrain to regions with gentler terrain and convenient transportation, which necessarily boosted the expansion of construction land. As the expansion of construction land needs to occupy large expanses of high-quality farmland or gentle sloping farmland on low mountains and hills, the farmland area was inevitably reduced. However, the future expansion of construction land in the TGRR will be subject to restrictions imposed by the policy guidance on “building an ecological protective screen in the upper reaches of the Yangtze River” from the central government.
In terms of model processing, the CLUE-S model used in this study has two major shortcomings as follows:
(1) To execute the CLUE-S model, the raster data must be converted to the ASCII format. The raster size and the degree of information integrity during the conversion inevitably affect the accuracy of computation. In this study, the selected driving factors and the primary raster data on land use were included in the Binary logistic model and the ROC curve was used to examine the regression results for different raster sizes. Based on this, the raster size was determined to be 500 m by 500 m. In addition, this study did not analyze the influence of raster size and conversion accuracy on the results of land-use simulation in different scenarios. This needs to be addressed with CLUE-S models capable of multi-scale analysis in future research.
(2) As the land demand calculation is independent of the CLUE-S model’s input, a plugin model is needed to perform the calculation. In this study, the land demand was calculated through interpolation, the most frequently used method in previous studies. The calculation did not consider how the relationship between land use and economic development affected land demand, primarily because the variation in land demand on a broad (regional) scale depends on multiple factors, including dynamic socio-economic factors that can not be related to individual raster cells. Therefore, this study used district (county)-level administrative divisions of the TGRR as the statistical units and each administrative division was treated as a spatial unit with homogeneous attributes. In this way, potential errors were avoided and the model was adapted to the land-use simulation on a broad scale. As the combination of spatial pattern simulation and land demand prediction can improve the accuracy of land-use simulation, the combination of land demand calculation model and the CLUE-S model is expected to be a focus of future research.

3.3 Scale selection for the driving factor analysis

Driving factor analysis is not only an important part of research on LUC, but also provides the key basis for formulating proper regulatory policies on land use. Analysis of driving factors behind LUC greatly depends on the scale for analysis, and the scale for analysis is strongly correlated with the study area. If a study is conducted on a regional or national scale, the driving factor analysis is normally regional or national in scale (Dong et al., 2009; Li et al., 2010). If a study looks at a landscape or community, the driving factor analysis should be performed on the corresponding scale. The analysis in the former case is a macro-scale analysis, while that in the latter case is a micro-scale analysis (Shao et al., 2008; Shao et al., 2016). Studies conducted on different scales require different data bases and differ in the depth of information about the driving mechanism behind LUC they can reveal. This study was conducted on a regional scale to analyze future land use in the whole TGRR (or the catchment basin of the reservoir). Therefore, the analysis of factors influencing land use and the selection of parameters for the land-use simulation in different scenarios were also done on a regional scale. Besides, to facilitate collection and preparation of time series data for a long period with multiple time points, the study used districts (counties) as the spatial units to identify the socio-economic factors that affected land use.
LUC usually occurs locally and the driving factors behind it necessarily have close relationship with local basic environments and their surroundings, such as special site conditions, socio-economic background, etc. Though regional economic environment and policies can lead to local LUC, the surroundings of an area undergoing LUC remain the source of most essential driving forces. In this study, therefore, the driving mechanism behind LUC in the TGRR was analyzed on a regional (county) scale and the region’s future land use was then simulated and forecast in several scenarios based on the analysis results. For this reason, the analysis was not precise enough to illustrate the driving factors in depth. This could affect the accuracy of analysis of the LUC process and path under the effects of the selected driving factors, and thereby the results of land-use forecasting.
The scale selection for driving factor analysis exposed another weakness of this study. As the socio-economic data collected on district (county) scale was allocated to particular spatial locations and then converted to rasters of the same size, different forms of land conversion in a district (county) could exhibit the same value for a certain socio-economic factor. This can reduce the accuracy of the driving factor analysis and thereby the accuracy of the land-use simulation in future scenarios.

4 Conclusions

The auto-logistic regression model based on neighborhood enrichment is able to well explain the driving factors behind LUC in the TGRR and it can be used to estimate the probability distributions of LUTs in the TGRR. The probability of paddy field was primarily correlated with topographic, climatic, and socio-economic factors. No factor was identified to have significant effect on the distribution of dryland. Slope gradient was the main factor controlling the distribution of woodland. Population density, urbanization rate, and fertilizer input had strong effects on the distribution of grassland and can explain its suitability. The distribution of construction land was explained by relatively fewer driving factors and their correlations were not significant.
The simulated land-use data for 2010 generated by the CLUE-S model was compared with the observational data. The overlap ratios between their raster graphics by LUT show that the model was most accurate in simulating woodland and least accurate in simulating water area. The Kappa test demonstrates that the simulation results generally meet the needs of future simulation and forecasting.
The land demand in the scenario of natural growth was calculated using the rate of change observed over the period between 2000 and 2010. In this scenario, paddy field gradually shrunk, while dryland expanded substantially. Woodland area increased slowly, while grassland area kept decreasing. The accelerating expansion of construction land is a threat to food security.
In the scenario of food security, the TGRR exhibited an overall decrease in farmland area. But as the contiguous high-quality farmland was effectively retained, food security was ensured. There was an obvious increase in grassland area; the new grassland was created primarily from uncultivated farmland.
In the scenario of migration-related construction, the TGRR underwent rapid expansion of construction land, especially in the areas involved in resettlement of migrants, removal and reconstruction of cities and towns, and construction of supporting infrastructure. The construction activities were done at the cost of large areas of high-quality farmland, posing a threat to food security in the TGRR.
In the scenario of ecological conservation, the priority was to protect and restore woodland and grassland, which have significant ecological value. Efforts included turning farmland back into forests, forest engineering, etc. The expansion of LEC also occupied large areas of farmland, especially inferior farmland on steep slopes.
In conclusion, relevant parties should take into account the needs of natural growth, food security, migration-related construction, and ecological conservation, and reconcile their conflicting needs, in future efforts to optimize the land-use structure of the TGRR.

The authors have declared that no competing interests exist.

[1]
Cao Yingui, Wang Jing, Tao Jiaet al., 2007. Simulating regional land use change based on CA and AO.Progress in Geography, 26(3): 88-95. (in Chinese)Regional land use change is an important part of global change. The research of land use change in the reservoir area of Three Gorges has attracted a lot of attention with construction of Three Gorges dam. The reservoir area of Three Gorges has become one of the important research areas. Based on the Landsat TM datum in 1995 and 2005, simulated multi-land use types change in the reservoir area of Three Gorges was conducted with the support of RS and GIS. In the process of research, the theory of Cellular Automata and the model of Arc-Object were used, with programming in the VB environment to fulfill the simulation and the forecasting. Firstly, transform the land use map of coverage format into grid format, and the shatters were set 100*100m. Secondly, sample on the land use change map using the RASTER CALCULATOR in GIS, and then judge the transfer situation in order to determine the transfer probability of different land use types in the scale of 3*3 neighborhood. Thirdly, program in the VB environment and simulate repeatedly until the simulation result fits for the precision. Lastly, continue simulating and get the land use map in 2010 and 2015. The forecasting map indicates that the areas of urban land and rivers will increase and the area of cultivated land will decrease, which are reasonable and convincing because of the policy of returning cultivated land to forestry land and the rising of water level in the reservoir area.

DOI

[2]
Chen Y L, Huang C S, Liu J Y, 2015. Statistical evidences of seismo-ionospheric precursors applying receiver operating characteristic (ROC) curve on the GPS total electron content in China.Journal of Asian Earth Sciences, 114(15): 393-402.Evidence of the seismo-ionospheric precursor (SIP) is reported by statistically investigating the relationship between the total electron content (TEC) in global ionosphere map (GIM) and 56M826.0 earthquakes during 1998–2013 in China. A median-based method together with the z test is employed to examine the TEC variations 30days before and after the earthquake. It is found that the TEC significantly decreases 0600–1000 LT 1–6days before the earthquake, and anomalously increases in 3 time periods of 1300–1700 LT 12–15days; 0000–0500 LT 15–17days; and 0500–0900 LT 22–28days before the earthquake. The receiver operating characteristic (ROC) curve is then used to evaluate the efficiency of TEC for predicting M826.0 earthquakes in China during a specified time period. Statistical results suggest that the SIP is the significant TEC reduction in the morning period of 0600–1000 LT. The SIP is further confirmed since the area under the ROC curve is positively associated with the earthquake magnitude.

DOI

[3]
Dong Lixin, Wu Bingfang, Guo Zhenhuaet al., 2009. Remote sensing monitor and simulation prediction of cultivated and woody land changes for Three-Gorges Reservoir region.Transactions of the CSAE, 25(Suppl.2): 290-297. (in Chinese)With the progress of the Three Gorges Project,the change of eco-environment and the influence of urbanization on ecosystem in the reservoir region have attracted worldwide attention.The information of land-use/cover in two phases(1992 and 2002)was extracted through the object-oriented methods.The dynamic characteristics of cultivated and woody land changes were analyzed.Based on the SLEUTH model,the process of urbanization and associated land-use/cover change were simulated in the Chongqing region.The influence of urbanization on cultivated and woody land in future was analyzed.The results showed that cultivated land decreased,while woody land increased during the 10 years.Meanwhile,the proportion of cultivated land with larger 25 degree and of forest decreased,and Urban and built-up land extended sharply.The results of simulation showed that urban would expand slower in future decades,and new spreading centers had occurred.Hence,the cultivated and woody land would decrease continually.In the currently activity intension,the trend of cultivated and woody land would decrease obviously.The results will offer the foundation of decision-making for the local eco-environment construction and the urban development.

DOI

[4]
He F L, Zhou J L, Zhu H T, 2003. Autologistic regression model for the distribution of vegetation.Journal of Agricultural, Biological, and Environmental Statistics, 8(2): 205-222.Modeling the contagious distribution of vegetation and species in ecology and biogeography has been a challenging issue. Previous studies have demonstrated that the autologistic regression model is a useful approach for describing the distribution because spatial correlation can readily be accounted for in the model. So far studies have been mainly restrained to the first-order autologistic model. However, the first-order correlation model may sometimes be insufficient as long-range dispersal/migration can play a significant role in species distribution. In this study, we used the second-order autologistic regression model to model the distributions of the subarctic evergreen woodland and the boreal evergreen forest in British Columbia, Canada, in terms of climate covariates. We investigated and compared three estimation methods for the second-order model--the maximum pseudo-likelihood method, the Monte Carlo likelihood method, and the Markov chain Monte Carlo stochastic approximation. Detailed procedures for these methods were developed and their performances were evaluated through simulations. The study demonstrates the importance for including the second-order correlation in the autologistic model for modeling vegetation distribution at the large geographical scale; each of the two vegetations studied was strongly autocorrelated not only in the south-north direction but also in the northwest-southeast direction. The study further concluded that the assessment of climate change should be performed on the basis of individual vegetation or species because different vegetation or species likely respond differently to different sets of climate variables.

DOI

[5]
Jabbar M T, Shi Z H, Wang T Wet al., 2006. Vegetation change prediction with geo-information techniques in the Three Gorges Area of China.Pedosphere, 16(4): 457-467.A computerized parametric methodology was applied to monitor, map, and estimate vegetation change in combination with “3S” (RS—remote sensing, GIS—geographic information systems, and GPS—global positioning system) technology and change detection techniques at a 1:50000 mapping scale in the Letianxi Watershed of western Hubei Province, China. Satellite images (Landsat TM 1997 and Landsat ETM 2002) and thematic maps were used to provide comprehensive views of surface conditions such as vegetation cover and land use change. With ER Mapper and ERDAS software, the normalized difference vegetation index (NDVI) was computed and then classified into six vegetation density classes. ARC/INFO and ArcView software were used along with field observation data by GPS for analysis. Results obtained using spatial analysis methods showed that NDVI was a valuable first cut indicator for vegetation and land use systems. A regression analysis revealed that NDVI explained 94.5% of the variations for vegetation cover in the largest vegetation area, indicating that the relationship between vegetation and NDVI was not a simple linear process. Vegetation cover increased in four of areas. This meant 60.9% of land area had very slight to slight vegetation change, while 39.1% had moderate to severe vegetation change. Thus, the study area, in general, was exposed to a high risk of vegetation cover change.

DOI

[6]
Li Jianguo, Pu Lijie, Liu Jinpinget al., 2013. The temporal and spatial characteristics of vegetation activity in Three Gorges Reservoir Area (Chongqing) from 2001 to 2010 and its influencing factors.Resources Science, 34(8): 1500-1507. (in Chinese)Three Gorges Reservoir Area (Chongqing) is a significant ecological barrier and vegetation resource pool in southwest China. The growth condition and trend of vegetation in Three Gorges Reservoir Area (Chongqing) play a very important role in maintaining Three Gorges Reservoir Area sustainable and stable as well as studying the carbon cycle and balance. This paper has investigated the vegetation change and its influencing factors in Three gorges Reservoir area (Chongqing) from 2001 to 2010 based on multi-temporal MODIS NDVI dataset. The results show that: 1)The middle and high mountain areas in the east and middle-south part of Three Gorges reservoir area (Chongqing) have high NDVI value, while the paralleled ridge-valley areas in the east of Sichuan and the valley areas in west of Yangtze River and its tributary have low NDVI value. It is of great significance to strengthen the protection and construction of vegetation in the middle and high mountain areas in the east and middle-south part of Three Gorges reservoir area (Chongqing); 2)The vegetation activities in Three Gorges Reservoir Area (Chongqing) have gradually displayed an increasing trend on the whole over the past decade; 3)The vegetation activities within the study area present a polarized trend. The vegetation activities decrease further in the region with sparse vegetation, but keep stable or increasing in the region with thick vegetation, which is especially obvious in summer. The main reason is the further decrease of minimum value caused by human activities in sparse vegetation area; 4) The NDVI of the broadleaf forest is the highest (0.6904) among six vegetation types in the study area, but the NDVI of the aquatic vegetation is the lowest (0.5710). Meanwhile, meadow, shrub and shrub-grassland all maintain a rapid growth with rates of 0.6% and 0.48% respectively, while the growth rate of aquatic vegetation is only 0.2%. The NDVI values of other vegetation types are all increasing, with 0.47% for coniferous forest type, 0.46% for cultivated vegetation type and 0.38% for broadleaf forest type; 5)Terrain (DEM), slope and terrain amplitude are the most important factors that affect the status of vegetation growth in the study area, and they fundamentally determine the spatial distribution of vegetation and change trend. Terrain (DEM) is a sufficient condition to shape slope and amplitude, thus becoming a fundamentally decisive factor for the vegetation distribution in this area. Simultaneously, human activities have been becoming a main factor that brings about the degradation of vegetation coverage.

[7]
Li Yangbin, Shao Jing’an, Li Yuechen, 2010. The status and prospect of land use/land cover changes in Three Gorges Reservoir Area.Journal of Chongqing Normal University (Natural Science), 27(2): 31-35. (in Chinese)

[8]
Liu Miao, Hu Yuanman, Chang Yuet al., 2009. Analysis of temporal predict in abilities for the CLUE-S land use model.Acta Ecologica Sinica, 29(11): 6110-6119. (in Chinese)Model simulation is an important approach in ecological studies when actual field experiments are unfeasible.Predicting future land use under different scenarios using land use models is necessary to assist land use planning and policy making.However,many studies failed to analyze the predicting ability in temporal scales,which may have incorrect simulation results.This study investigates the temporal predicting ability of a land use model(CLUE-S) based on kappa coefficient in the upper reach of Minjiang River.Our results showed that CLUE-S can be used to predict up to 22 years and beyond which the prediction results may become unreliable.Our study provides a usable approach in examining temporal variations in land use models.

[9]
Liu Qicheng, Xiong Wenqiang, Han Guifeng, 2005. Tendency forecast of Three Gorge land using by means of Markov.Journal of Chongqing University (Natural Science Edition), 28(2): 107-110. (in Chinese)In order to grasp the trend of land-using structure transition, adjust social and economical development strategies, and optimize the land-using structure, the land structure in latest years is forecasted, based on the analysis of land using actually and the first-hand data of the year 1995~2001. The theory of Markov chain is used to construct the transition probability matrix. The character of land structure transition is analyzed. The result shows that the plough reduce rapidly,the land is not fully utilize and the traffic land increase slowly.

DOI

[10]
Liu Yansui, Feng Dexian, 2001. Sustainable potential and models of land use in the Three Gorges Reservoir Area.Geographical Research, 20(2): 139-145. (in Chinese)Sustainable land use is one of the essential objectives of exploitation, utilization and protection of the future land resources in Three Gorges Reservoir Area (TGRA) It is beneficial to revealing the structural characteristics of eco economic system of land use the situation among their subsystems to evaluate sustainable use of land resources aimed at its actual characteristics Furthermore, the scientific gist of making measures for strategic adjustment of land use and resettlement in the near future can be obtained by studying the ways and models of sustainable land use In this paper, the quantitative model for evaluation of sustainable land use is built Then based on the evaluation and analysis of sustainable land use potential and regional difference in TGRA, it is pointed out that the land use level as a whole are not only weakly sustainable, but also differs greatly in different regions Since there are a lot of impediment factors,therefore, the sticking point to make measures for land use is that the principles including adjustment measure to local conditions and guidance according to types must be complied, and the relationship among ecological rehabilitation,resettlement and economic development will be correctly disposed The main approach models inclucle four ways, namely,tree planting and of forestation, terracing slope land, optimizing structure and industrial breakthrough

DOI

[11]
Long H L, Wu X Q, Wang W Jet al., 2008. Analysis of urban-rural land-use change during 1995-2006 and its policy dimensional driving forces in Chongqing, China.Sensors, 8: 681-699.This paper analyzes the urban-rural land-use change of Chongqing and its policy dimensional driving forces from 1995 to 2006, using high-resolution Landsat TM (Thematic Mapper) data of 1995, 2000 and 2006, and socio-economic data from both research institutes and government departments. The outcomes indicated that urban-rural land-use change in Chongqing can be characterized by two major trends: First, the non-agricultural land increased substantially from 1995 to 2006, thus causing agricultural land especially farmland to decrease continuously. Second, the aggregation index of urban settlements and rural settlements shows that local urban-rural development experienced a process of changing from aggregation (1995-2000) to decentralization (2000-2006). Chongqing is a special area getting immersed in many important policies, which include the establishment of the municipality directly under the Central Government, the building of Three Gorges Dam Project, the Western China Development Program and the Grain-for-Green Programme, and bring about tremendous influences on its land-use change. By analyzing Chongqing's land-use change and its policy driving forces, some implications for its new policy of rban-rural Integrated Reform are obtained. That is more attentions need to be paid to curbing excessive and idle rural housing and consolidating rural construction land, and to laying out a scientific land-use plan for its rural areas taking such rural land-use issues as farmland occupation and rural housing land management into accounts, so as to coordinate and balance the urban-rural development.

DOI PMID

[12]
Luo G P, Yin C Y, Chen Xet al., 2010. Combining system dynamic model and CLUE-S model to improve land use scenario analyses at regional scale: A case study of Sangong watershed in Xinjiang, China.Ecological Complexity, 7: 198-207.Uses of models of land use change are primary tools for analyzing the causes and consequences of land use changes, assessing the impacts of land use change on ecosystems and supporting land use planning and policy. However, no single model is able to capture all of key processes essential to explore land use change at different scales and make a full assessment of driving factors and impacts. Based on the multi-scale characteristics of land use change, combination and integration of currently existed models of land use change could be a feasible solution. Taken Sangong watershed as a case study, this paper describes an integrated methodology in which the conversion of land use and its effect model (CLUE), a spatially explicit land use change model, has been combined with a system dynamic model (SD) to analyze land use dynamics at different scales. A SD model is used to calculate area changes in demand for land types as a whole while a CLUE model is used to transfer these demands to land use patterns. Without the spatial consideration, the SD model ensures an appropriate treatment of macro-economic, demographic and technology developments, and changes in economic policies influencing the demand and supply for land use in a specific region. With CLUE model the land use change has been simulated at a high spatial resolution with the spatial consideration of land use suitability, spatial policies and restrictions to satisfy the balance between land use demand and supply. The application of the combination of SD and CLUE model in Sangong watershed suggests that this methodology have the ability to reflect the complex behaviors of land use system at different scales to some extent and be a useful tool for analysis of complex land use driving factors such as land use policies and assessment of its impacts on land use change. The established SD model was fitted or calibrated with the 1987 1998 data and validated with the 1998 2004 data; combining SD model with CLUE-S model, future land use scenarios were analyzed during 2004 2030. This work could be used for better understanding of the possible impacts of land use change on terrestrial ecosystem and provide scientific support for land use planning and managements of the watershed.

DOI

[13]
Mao Hanying, Gao Qun, Feng Renguo, 2002. The selection of pillar industries under the ecologically and environmentally friendly principles in Three Gorges Area.Acta Geographica Sinica, 57(5): 553-560. (in Chinese)The authors put forward six principles for selection of pillar industries in Three Gorges Area: ① good ecological benefit; ②marketable product and market rapidly expanding ability; ③strong driving and affiliating ability; ④ good economic benefit; ⑤ technical progress and able to adopt new technological knowledge; ⑥ propitious to the labor employment and establish indices, including three hiberarchys,six series and 17 items.The weight of every item is evaluated by AHP:ecological index is 0.28; market index is 0.22; economical benefit is 0.16;technological innovation index is 0.14; labor employment index is 0.12; industrial correlative domino effect index is 0.08. By carefully and deliberately weighing under these indices,the authors think to choose five pillar industries to foster as keystones and analysis their development.

DOI

[14]
Morgan T K K B, Sardelic D N, Waretini A F, 2012. The Three Gorges Project: How sustainable?Journal of Hydrology, 460/461(16): 1-12.In 1984 the Government of China approved the decision to construct the Three Gorges Dam Project, the largest project since the Great Wall. The project had many barriers to overcome, and the decision was made at a time when sustainability was a relatively unknown concept. The decision to construct the Three Gorges Project remains contentious today, especially since Deputy Director of the Three Gorges Project Construction Committee, Wang Xiaofeng, stated that e absolutely cannot relax our guard against ecological and environmental security problems sparked by the Three Gorges Project (Bristow, 2007; McCabe, 2007). The question therefore was posed: how sustainable is the Three Gorges Project? Conventional approaches to sustainability assessment tend to use monetary based assessment aligned to triple bottom line thinking. That is, projects are evaluated as trade-offs between economic, environmental and social costs and benefits. The question of sustainability is considered using such a traditional Cost-Benefit Analysis approach, as undertaken in 1988 by a CIPM-Yangtze Joint Venture, and the Mauri Model Decision Making Framework (MMDMF). The Mauri Model differs from other approaches in that sustainability performance indicators are considered independently from any particular stakeholder bias. Bias is then introduced subsequently as a sensitivity analysis on the raw results obtained. The MMDMF is unique in that it is based on the M ori concept of Mauri, the binding force between the physical and the spiritual attributes of something, or the capacity to support life in the air, soil, and water. This concept of Mauri is analogous to the Chinese concept of Qi, and there are many analogous concepts in other cultures. It is the universal relevance of Mauri that allows its use to assess sustainability. This research identified that the MMDMF was a strong complement to Cost-Benefit Analysis, which is not designed as a sustainability assessment tool in itself. The MMDMF does have relevance in identifying areas of conflict, and it can support the Cost-Benefit Analysis in assessing sustainability, as a Decision Support Tool. The research concluded that, based on both models, the Three Gorges Project as understood in 1988, and incorporating more recent sustainability analysis is contributing to enhanced sustainability.

DOI

[15]
Ni J P, Shao J A, 2013. The drivers of land use change in the migration area, Three Gorges Project, China: Advances and prospects.Journal of Earth Science, 24(1): 136-144.

DOI

[16]
Peng Li, 2013. Study on land use change and land use structure optimization in Three Gorges Reservoir Area [D]. Wuhan: Huazhong Agricultural University. (in Chinese)

[17]
Pontius J, Laura C S, 2001. Land-cover change model validation by an ROC method for the Ipswich watershed, Massachusetts, USA.Agriculture, Ecosystems and Environment, 2001, 85(1-3): 239-248.Scientists need a better and larger set of tools to validate land-use change models, because it is essential to know a model prediction accuracy. This paper describes how to use the relative operating characteristic (ROC) as a quantitative measurement to validate a land-cover change model. Typically, a crucial component of a spatially explicit simulation model of land-cover change is a map of suitability for land-cover change, for example a map of probability of deforestation. The model usually selects locations for new land-cover change at locations that have relatively high suitability. The ROC can compare a map of actual change to maps of modeled suitability for land-cover change. ROC is a summary statistic derived from several two-by-two contingency tables, where each contingency table corresponds to a different simulated scenario of future land-cover change. The categories in each contingency table are actual change and actual non-change versus simulated change and simulated non-change. This paper applies the theoretical concepts to a model of deforestation in the Ipswich watershed, USA.

DOI

[18]
Shao Huaiyong, Xian Wei, Yang Wunianet al., 2008. Land use/cover change during lately 50 years in Three Gorges Reservoir Area.Chinese Journal of Applied Ecology, 19(2): 453-458. (in Chinese)Based on the topographic maps(1:50 000) in 1955,MSS images in 1972,and TM images in 1986 and 2000,the dynamic changes of land use during lately 50 years in Three Gorges Reservoir Area were quantitatively analyzed,with their driving forces discussed.The results showed that during lately 50 years,the structure of land use in the study area changed obviously,with a decrease of woodland,water area and unused land,and an increase of cultivated land,grassland and construction land.During the periods of 1955-1972,1972-1986 and 1986-2000,woodland had a persistent and gradual decrease,grassland and cultivated land underwent a process of increase-decrease-increase and of increase-increase-decrease,respectively,construction land increased continually,while water area and unused land kept decreasing.Policy,economic development,and population growth were the main driving factors of the land use change in the study area.

PMID

[19]
Shao Jing’an, Zhang Shichao, Li Xiubin, 2015. Farmland marginalization in the mountainous areas: Characteristics, influencing factors and policy implications.Journal of Geographical Sciences, 25(6): 701-722.Based on SPOT-5 images, 1:1 million topographic maps, the maps of the returning farmland to forest project and the Chongqing forest project, social and economic statistics, etc., this paper identifies the features and factors influencing farmland marginalization. The results showed: (1) During 2002–2012, the rate of farmland marginalization was 16.18%, which was mainly found in the high areas of northern Qiyao mountains and the medium-altitude areas of southern Qiyao mountains. And this farmland marginalization will increase, associated with non-agriculturalization of rural labourers and aging of the remaining labourers. (2) Elevation, distance radius from villages and road connections had a great influence on farmland marginalization. Farmland marginalization rates showed an increasing trend with the increase of elevation, and 60.88% of the total farmland marginalization area is found at an altitude greater than 1000 m above sea level. The marginalization trend also increases with slope and distance from the distribution network. (3) Farmland area per labourer and the average age of farm labourers were major factors driving farmland marginalization. Farmland transfer and small agricultural machinery sets affect farmland marginalization with respect to management and productivity efficiency. (4) Farmland with “comparative-disadvantage-dominated marginalization” accounted for 55.32% of the total farmland marginalization area, followed by “location-dominated marginalization” (33.80%). (5) According to the specifics of each real situation, different policies are suggested to mitigate the marginalization. A “continuous marginalization” policy will encourage the return of farmland to forest in “terrain-dominated marginalization”. An “anti-marginalization” policy is suggested to create new rural accommodation and improve the rural road system to counteract “terrain-dominated marginalization”. And another “anti-marginalization” policy is planned to improve management and micro-mechanization for “comparative-disadvantage-dominated marginalization”. A new idea was developed to integrate high resolution remote sensing and statistical data with survey information to identify land marginalization and its driving forces in mountainous areas.

DOI

[20]
Shao Jing’an, Zhang Shichao, Li Xiubin, 2016. Effectiveness of farmland transfer in alleviating farmland abandonment in mountain regions.Journal of Geographical Sciences, 26(2): 203-218.Farmland abandonment is a type of land use change in the mountain region, and this change is under rapid development. Whether farmland transfer can prevent this process and promote the effective allocation of land resources or not is a question worth studying and discussion. With the help of the previous research findings, the objective of this paper was to find out the role of farmland transfer on preventing farmland abandonment, by using the methods of multiple view with two factors, and single factor correlation analysis. The results showed that: (1) At village level, a significant negative correlation between farmland transfer and farmland abandonment existed in the study site, with R 2 = 0.7584. This correlation of farmland with high grade farming conditions presented more outstandingly. The fitted curve for the farmland at Level I had the largest R 2 at 0.288, while that for the farmland at Level IV had the smallest R 2 at 0.103. Which indicated that farmland transfer could prevent the abandonment of farmland with high grade farming conditions? (2) At plot level, the abandonment rate of farmland with high grade farming conditions was significantly lower than that of farmland with poor grade farming conditions. It was the lowest at 10.49% for the farmland with Level I farming conditions, whereas the farmland with Level I farming conditions was 26.21%. Abandoned farmland was mainly contributed by farmland with Level IV farming conditions in the study site. (3) At village level, the role of farming conditions on farmland abandonment was insignificant. The univariate correlation analysis revealed that the abandonment ratio was negatively correlated with the proportions of farmland at Levels I and II and their accumulated proportion; however, their R 2 were small at 0.194, 0.258, and 0.275, respectively. The abandonment of farmland with high farming conditions still existed. The abandonment ratios of farmland at Levels I and II were high at 9.96% and 10.60%, respectively. This presented that farmland transfer on behalf of the land rental market was still not developed. (4) However, the village possessed the high rate of farmland transfer, and its rate of farmland abandonment with high grade farming conditions was all lower. When the transfer ratios of farmland were over 20%, the abandonment ratios of farmland at Levels I and II were 6.47% and 6.92%, respectively. Farmland abandonment was still controlled by the improvement of land rental market. And the functions of land rental market optimizing the utilization of farmland resources have been presented to a certain degree. (5) To further improve the marketing degree of land rental, the probability of farmland abandonment could be reduced. Especially, their function to farmland with high grade farming conditions was very obvious, and could avoid the waste of farmland resources with high grade farming conditions.

DOI

[21]
Shao Jing’an, Zhang Shichao, Wei Chaofu, 2013. Remote sensing analysis of land use change in the Three Gorges Reservoir area, based on the construction phase of large-scale water conservancy project.Geographical Research, 23(12): 2189-2203. (in Chinese)There is a the strong correlation of major land use transformation patterns with the timing and strength of subjectivity projects and their hysteresis effects when large-scale water conservancy projects(especially extra-large reservoir) constructed. The construction phase of Three Gorges Project in this paper was divided into five time points,considering the impacts of strong cloudy and foggy on image quality and its availability. The objectives of this paper was to comparatively understand the characteristics and trajectories of land use change the different project construction stages in the Three Gorges Reservoir Area through single land use dynamic degree,land use composite index,land use degree change,using five-term TM/ ETM image data. The results showed:(1) The transformation of cultivation land and forest-grass land,building land occupied cultivation land and forest land,interchange between forest and grassland,and cultivation land,forest land and grassland water flooded by water body were the main ways of land use conversion throughout the construction phase of the Three Gorges Reservoir Area.(2) Land use change and its drivers presented significant detailed trajectory with the stage under the framework of the overall pattern,due to the drivers occurring at different times,and the differences of their role strengthen degree during various construction stages.(3) The composite index of land use degree was relatively stable,and it was more than in the middle level throughout the construction phase. However,the change in land use composite index took overall on decreasing tendency with a "W"-type dynamic pattern.(4) The distribution breadth and concentration degree of major land use conversion patterns possessed larger differences at spatial scale. Moreover,the effects of subjectivity projects on major land use conversion patterns showed strong heterogeneity with the deepening of project construction phase. The results of this paper will contribute to rich the people's understanding to land use under the stress of water conservancy,and provide a scientific basis and reliable support to arrange adaptive land use regulation policy in the future.

DOI

[22]
Shen G Z, Xie Z Q, 2004. Three Gorges Project: Chance and challenge.Science, 304(30): 681.Shen G, Xie Z.

DOI PMID

[23]
Verburg P H, 2008. Tutorial CLUE-S and DYNA-CLUE. Handbook of CLUE-S Model.

[24]
Verburg P H, Berkel van D B, Doorn van A Met al., 2010. Trajectories of land use change in Europe: A model-based exploration of rural futures.Landscape Ecology, 25: 217-232.Land use change is characterized by a high diversity of change trajectories depending on the local conditions, regional context and external influences. Policy intervention aims to counteract the negative consequences of these changes and provide incentives for positive developments. Region typologies are a common tool to cluster regions with similar characteristics and possibly similar policy needs. This paper provides a typology of land use change in Europe at a high spatial resolution based on a series of different scenarios of land use change for the period 2000鈥2030. A series of simulation models ranging from the global to the landscape level are used to translate scenario conditions in terms of demographic, economic and policy change into changes in European land use pattern. A typology developed based on these simulation results identifies the main trajectories of change across Europe: agricultural abandonment, agricultural expansion and urbanization. The results are combined with common typologies of landscape and rurality. The findings indicate that the typologies based on current landscape and ruralities are poor indicators of the land use dynamics simulated for the regions. It is advocated that typologies based on (simulated) future dynamics of land change are more appropriate to identify regions with potentially similar policy needs.

DOI

[25]
Verburg P H, de Nijs T C M, van Eck J Ret al., 2004. A method to analyse neighbourhood characteristics of land use patterns.Computers, Environment and Urban Systems, 28(6): 667-690.Neighbourhood interactions between land use types are often included in the spatially explicit analysis of land use change. Especially in the context of urban growth, neighbourhood interactions are often addressed both in theories for urban development and in dynamic models of (urban) land use change. Neighbourhood interactions are one of the main driving factors in a large group of land use change models based on cellular automata (CA).This paper introduces a method to analyse the neighbourhood characteristics of land use. For every location in a rectangular grid the enrichment of the neighbourhood by specific land use types is studied. An application of the method for the Netherlands indicates that different land use types have clearly distinct neighbourhood characteristics. Land use conversions can be explained, for a large part, by the occurrence of land uses in the neighbourhood.The neighbourhood characterization introduced in this paper can help to further unravel the processes of land use change allocation and assist in the definition of transition rules for cellular automata and other land use change models.

DOI

[26]
Verburg P H, Eickhout B, van Meijl H, 2008. A multi-scale, multi-model approach for analyzing the future dynamics of European land use.The Annals of Regional Science, 42(1): 57-77.Europe rural areas are expected to witness massive and rapid changes in land use due to changes in demography, global trade, technology and enlargement of the European Union. Changes in demand for agricultural products and agrarian production structure are likely to have a large impact on landscape quality and the value of natural areas. Most studies address these changes either from a macro-economic perspective focusing on changes in the agricultural sector or from a local perspective by analyzing recent changes in landscapes for small case studies. This paper describes a methodology in which a series of models has been used to link global level developments influencing land use to local level impacts. It is argued that such an approach is needed to properly address the processes at different scales that give rise to the land use dynamics in Europe. An extended version of the global economic model (GTAP) and an integrated assessment model (IMAGE) are used to calculate changes in demand for agricultural areas at the country level while a spatially explicit land use change model (CLUE-s) was used to translate these demands to land use patterns at 1 km 2 resolution. The global economic model ensures an appropriate treatment of macro-economic, demographic and technology developments and changes in agricultural and trade policies influencing the demand and supply for land use related products while the integrated assessment model accounts for changes in productivity as result of climate change and global land allocation. The land use change simulations at a high spatial resolution make use of country specific driving factors that influence the spatial patterns of land use, accounting for the spatial variation in the biophysical and socio-economic environment. Results indicate the large impact abandonment of agricultural land and urbanization may have on future European landscapes. Such results have the potential to support discussions on the future of the rural area and identify hot-spots of landscape change that need specific consideration. The high spatial and thematic resolution of the results allows the assessment of impacts of these changes on different environmental indicators, such as carbon sequestration and biodiversity. The global assessment allows, at the same time, to account for the tradeoffs between impacts in Europe and effects outside Europe.

DOI

[27]
Verburg P H, Overmars K P, 2009. Combining top-down and bottom-up dynamics in land use modeling: Exploring the future of abandoned farmlands in Europe with the Dyna-CLUE model.Landscape Ecology, 24: 1167-1181.Land use change is the result of interactions between processes operating at different scales. Simulation models at regional to global scales are often incapable of including locally determined processes of land use change. This paper introduces a modeling approach that integrates demand-driven changes in land area with locally determined conversion processes. The model is illustrated with an application for European land use. Interactions between changing demands for agricultural land and vegetation processes leading to the re-growth of (semi-) natural vegetation on abandoned farmland are explicitly addressed. Succession of natural vegetation is simulated based on the spatial variation in biophysical and management related conditions, while the dynamics of the agricultural area are determined by a global multi-sector model. The results allow an exploration of the future dynamics of European land use and landscapes. The model approach is similarly suitable for other regions and processes where large scale processes interact with local dynamics.

DOI

[28]
Wang Riming, Xiong Xingyao, Xiao Yang, 2014. Simulation of land use spatial pattern change on county scale of Yongchuan District in Chongqing.Chinese Agricultural Science Bulletin, 30(35): 166-171. (in Chinese)This article chose Chongqing Yongchuan, which was located in the three gorges reservoir region, asthe research area, to classify and analyze the spatial change patterns of land use in 2000, 2005 and 2010 byusing GIS technology. The results indicated that Yongchuan district, under the drive of rapid urbanization, hada remarkable increase of urban area and slight increase of forest area. Accordingly, farmland area was reducingin the 10 years as a source of forest and urban land supply. In this paper, the spatial change patterns of landuse in 2015 were simulated three times with the CLUE-S model by using the spatial data of land use in 2010 and the driving factors affected land use change. The simulated results show that the forest and urban landexpansion will be at the consumption of farmland. Above all, the ecological protection model have a goodcontrol effect, thus the forest, grassland and water, which have the ecological service function, should be betterprotected and increased, and inhibit the rapid expansion of urban construction. The delimitation of ecologicalprotection area is important to the protection of ecological environment.

[29]
Wang X W, Chen Y, Song L Cet al., 2013. Analysis of lengths, water areas and volumes of the Three Gorges Reservoir at different water levels using Landsat images and SRTM DEM data.Quaternary International, 304(5): 115-125.The impoundment and operation of the Three Gorges Reservoir (TGR) are geophysical “controlled experiments”. However, detailed procedures, data source and uncertainties on TGR's basic parameters, such as lengths, water areas and volumes, were not available to the science community, and are provided in this study by using Landsat images, SRTM DEM data and in situ measurements. Reservoir lengths are between 65002km and 70002km at the water level of 17502m above sea level (a.s.l.). The natural (but near maximum) water area of the Yangtze River within the reservoir (at the full range of 69902km) based on Landsat images was 48902km2 in August, 2002, before the impoundment. At 17502m a.s.l., the total water area mapped by Landsat images (92902km2) is 6510% less than those derived from SRTM DEM data (100602km2) and reported by Three Gorges Corporation (TGC) (104002km2). SRTM DEM data could classify 90–92% of these areas as water areas, while the total areas from Landsat, SRTM and TGC have over 96% agreements at water levels ≤17002m. The larger estimate of water area by DEM data from both TGC and SRTM at 17502m could be partially explained by the construction of levees. The total static volumes derived from SRTM DEM data above 7002m have a linear relationship (R202=020.99, Mean Absolute Difference02=020.4302km3) with those reported by the Information Center of Water Resource (ICWR), Ministry of Water Resource, China. The analysis also suggests that the ICWR-reported water volumes in the reservoir neglect the wedge storage in a flooding peak.

DOI

[30]
Wu G P, Zeng Y N, Xiao P Fet al., 2010. Using autologistic spatial models to simulate the distribution of land-use patterns in Zhangjiajie, Hunan Province.Journal of Geographical Sciences, 20(2): 310-320.Nowadays,spatial simulation on land use patterns is one of the key contents of LUCC.Modeling is an important tool for simulating land use patterns due to its ability to inte-grate measurements of changes in land cover and the associated drivers.The conventional regression model can only analyze the correlation between land use types and driving factors, but cannot depict the spatial autocorrelation characteristics.Land uses in Yongding County, which is located in the typical karst mountain areas in northwestern Hunan province,were investigated by means of modeling the spatial autocorrelation of land use types with the purpose of deriving better spatial land use patterns on the basis of terrain characteristics and infrastructural conditions.Through incorporating components describing the spatial autocor-relation into a conventional logistic model,we constructed a regression model(Autologistic model),and used this model to simulate and analyze the spatial land use patterns in Yong- ding County.According to the comparison with the conventional logistic model without con- sidering the spatial autocorrelation,this model showed better goodness and higher accuracy of fitting.The distribution of arable land,wood land,built-up land and unused land yielded areas under the ROC curves(AUC)was improved to 0.893,0.940,0.907 and 0.863 respec- tively with the autologistic model.It is argued that the improved model based on autologistic method was reasonable to a certain extent.Meanwhile,these analysis results could provide valuable information for modeling future land use change scenarios with actual conditions of local and regional land use,and the probability maps of land use types obtained from this study could also support government decision-making on land use management for Yongding County and other similar areas.

DOI

[31]
Wu Guiping, Zeng Yongnian, Zou Binget al., 2008. Simulation on spatial land use patterns using autologistic method: A case study of Yongding County, Zhangjiajie.Acta Geographica Sinica, 63(2): 156-164. (in Chinese)

[32]
Wu J G, Huang J H, Han X Get al., 2003. Three Gorges Dam: Experiment in habitat fragmentation?Science, 300(5623): 1239-1240.Abstract Habitat fragmentation is the primary cause of the loss of biodiversity and ecosystem services, but its underlying processes and mechanisms remain poorly understood. Studies of islands and insular terrestrial habitats are essential for improving our understanding of habitat fragmentation. We argue that the Three-Gorges Dam, the largest that humans have ever created, presents a unique grand-scale natural experiment that allows ecologists to address a range of critical questions concerning the theory and practice of biodiversity conservation.

DOI PMID

[33]
Xiu X B, Tan Y, Yang G S, 2013. Environmental impact assessments of the Three Gorges Project in China: Issues and interventions.Earth-Science Reviews, 124: 115-125.The paper takes China's authoritative Environmental Impact Statement for the Yangzi (Yangtze) Three Gorges Project (TGP) in 1992 as a benchmark against which to evaluate emerging major environmental outcomes since the initial impoundment of the Three Gorges reservoir in 2003. The paper particularly examines five crucial environmental aspects and associated causal factors. The five domains include human resettlement and the carrying capacity of local environments (especially land), water quality, reservoir sedimentation and downstream riverbed erosion, soil erosion, and seismic activity and geological hazards. Lessons from the environmental impact assessments of the TGP are: (1) hydro project planning needs to take place at a broader scale, and a strategic environmental assessment at a broader scale is necessary in advance of individual environmental impact assessments; (2) national policy and planning adjustments need to react quickly to the impact changes of large projects; (3) long-term environmental monitoring systems and joint operations with other large projects in the upstream areas of a river basin should be established, and the cross-impacts of climate change on projects and possible impacts of projects on regional or local climate considered.

DOI

[34]
Zeng Fanhai, Zhang Yong, Zhang Shenget al., 2011. Research on land utilization change of Wanzhou District based on RS and GIS in recent 22 years.Environment and Ecology in the Three Gorges, 33(3): 43-46. (in Chinese)From impounding of the Three Gorges Reservoir,the water level rose sustainably,with human activities moving to high elevation area.Problems which land utilization impacted on eco-environment outstand increasingly.In this paper,the research focused on the change of land utilization by taking Wanzhou district as studied area.Taking RS and GIS as main technologies,the status of land utilization of Wanzhou district were analyzed.The results indicated that the land utilization of Wanzhou district changed obviously in recent 22 year from 1986 to 2008.The area of cultivated land decreased continually,and the area of construction land,water area and forest land increased continually.The degrees of land utilization change were different in difference periods.The most severe period was the years form 2000 to 2008.The main factors caused the change of land utilization includes policy,social economy and population.The study provides reference to rational land use.

[35]
Zhang J X, Liu Z J, Sun X X, 2009. Changing landscape in the Three Gorges Reservoir area of Yangtze River from 1977 to 2005: Land use/land cover, vegetation cover changes estimated using multi-source satellite data.International Journal of Applied Earth Observation and Geoinformation, 11(6): 403-412.The eco-environment in the Three Gorges Reservoir Area (TGRA) in China has received much attention due to the construction of the Three Gorges Hydropower Station. Land use/land cover changes (LUCC) are a major cause of ecological environmental changes. In this paper, the spatial landscape dynamics from 1978 to 2005 in this area are monitored and recent changes are analyzed, using the Landsat TM (MSS) images of 1978, 1988, 1995, 2000 and 2005. Vegetation cover fractions for a vegetation cover analysis are retrieved from MODIS/Terra imagery from 2000 to 2006, being the period before and after the rising water level of the reservoir. Several analytical indices have been used to analyze spatial and temporal changes. Results indicate that cropland, woodland, and grassland areas reduced continuously over the past 30 years, while river and built-up area increased by 2.79% and 4.45% from 2000 to 2005, respectively. The built-up area increased at the cost of decreased cropland, woodland and grassland. The vegetation cover fraction increased slightly. We conclude that significant changes in land use/land cover have occurred in the Three Gorges Reservoir Area. The main cause is a continuous economic and urban/rural development, followed by environmental management policies after construction of the Three Gorges Dam.

DOI

[36]
Zhang Q F, Lou Z P, 2011. The environmental changes and mitigation actions in the Three Gorges Reservoir region, China.Environmental Science & Policy, 14(8): 1132-1138.The Three Gorges Dam (TGD) is by far the world's largest hydroelectric scheme. Due to its unprecedented magnitude, the TGD has been controversial ever since it was proposed in the early 20th century and building commenced in 1993. Recent problems, including geological disasters (e.g., landslides) in the uplands and algal blooms in the aquatic environment since the reservoir's partial filling to 156 m in 2006, suggest that the environmental challenge has never been greater than now. The environmental deterioration might be further intensified when the reservoir reaches its final water level of 175 m. Solving the environmental challenges will be essential for the sustainable development of the Three Gorges Reservoir region (TGRR), and environmental sustainability in the TGRR is a high priority for the nation considering its critical location in the Yangtze Basin, which contributes 40% of China's GDP. This article reviews primary environmental assessments for biodiversity conservation, the water environment, water level fluctuation zone, and the uplands after the partial filling in the reservoir region. It also discusses the success of mitigation efforts to date. Although there are successes in mitigation particularly in conservation of endangered plants and fishes, it seems likely that environmental conditions in the TGRR could only get worse in the short term. Building a partnership among the TGD stakeholders, including local residents, governments, and international communities is necessary to meet the mounting environmental challenge in the TGRR and beyond.Highlights? Environmental assessments for the Three Gorges Reservoir region. ? Review on the mitigation efforts for the environmental changes. ? Partnership building among the stakeholders.

DOI

[37]
Zheng H W, Shen G Q, Hao Wet al., 2015. Simulating land use change in urban renewal areas: A case study in Hong Kong.Habitat International, 46: 23-34.61This research is the pilot study of applying CLUE-S model and Markov Chain prediction for land use change in urban renewal.61The validation shows a relatively high reliability of this method to simulate land use change in urban renewal district.61Probability maps provide implications of land use problems (such as a need for balanced distribution of open space).61Scenario analysis shows different policy directions of land use in the future.

DOI

Outlines

/