Research Articles

Comparative research on regional differences in urbanization and spatial evolution of urban systems between China and India

  • LI Jiaming , 1 ,
  • YANG Yu , 1, 2, * ,
  • FAN Jie 1, 2 ,
  • JIN Fengjun 1, 2 ,
  • ZHANG Wenzhong 1, 2 ,
  • LIU Shenghe 1, 2 ,
  • FU Bojie , 2, 3, *
Expand
  • 1. Key Laboratory of Regional Sustainable Development Modeling, Institute of Geographic Sciences and Natural Resources Research, CAS, Beijing 100101, China
  • 2. College of Resources and Environment, University of Chinese Academy of Sciences, Beijing 100049, China
  • 3. State Key Laboratory of Urban and Regional Ecology, Research Center for Eco-Environmental Sciences of CAS, Beijing 100085, China
Corresponding author:Fu Bojie, Academician, E-mail: ; Yang Yu, Associate Professor, E-mail:

Author: Li Jiaming, PhD, specialized in economic geography and urbanization. E-mail:

Received date: 2017-08-20

  Accepted date: 2017-10-17

  Online published: 2018-12-20

Supported by

National Natural Science Foundation of China, No.41230632, No.41671166, No.41571159, No.41430636, No.41701128

Copyright

Journal of Geographical Sciences, All Rights Reserved

Abstract

As two rising great powers, China and India have undergone similar development processes, but they also exhibit significant differences in development paths and patterns. The significant differences in political systems, economic systems, and developmental environment between the two countries have attracted great attention from scholars. This research focuses on the regional differences and spatial evolution processes in urbanization and urban systems between the two countries from a geographical perspective. Based on the demographic censuses of both countries and the urban population data from the United Nations, this paper systematically compared and analyzed the spatial characteristics of urbanization and urban systems in China and India using various methods including spatial analysis, parameter estimation, and nonparametric estimation. The results indicate that: (1) Since the 1990s, the regional differences in urbanization in China have transformed from south-north differences to coastal-inland differences, whereas the north-south differences in India have been stable. (2) In recent years, the correlation between population density and urbanization rate kept increasing in China, while such correlation has been decreasing in India. (3) The economic reform posed significantly different effects on the spatial evolution of the urban systems in the two countries. The economic reform changed the major driving force for urban development in China from geographical and historical factors to the spatial structure of the economic system. However, in India, the driving forces for urban development have always been geographical and historical factors, and the economic reform even decreased the effect of the spatial structure of the economic system on urban development.

Cite this article

LI Jiaming , YANG Yu , FAN Jie , JIN Fengjun , ZHANG Wenzhong , LIU Shenghe , FU Bojie . Comparative research on regional differences in urbanization and spatial evolution of urban systems between China and India[J]. Journal of Geographical Sciences, 2018 , 28(12) : 1860 -1876 . DOI: 10.1007/s11442-018-1568-8

1 Introduction

Since the late 20th century, China and India have been rising rapidly and transforming from undeveloped agricultural countries to advanced industrialized countries. Meanwhile, both countries have significantly influenced the global economic structure due to their huge economic scales. China and India not only share similar attributes as Asian countries with long histories and large populations, the two countries have also experienced similar development processes since modern times. China and India became independent sovereign states around the 1950s. In the late 1970s and early 1990s respectively, China and India both pushed forward economic reform, implementing a series of economic policies such as deregulation and opening-up to the outside world. Both countries joined the WTO in 1995 and 2001, respectively, and became the second and seventh largest economic entities in the world respectively after about 70 years of development since independence.
However, the differences in development paths and the competitive relationship between China and India have attracted great attention due to the differences in natural conditions, historical cultures, and social environments - especially political systems. Huang and Khanna (2003) even proposed the concept of “competition between dragon and elephant” for describing the competitive relationship between China and India. Since then, discussions on the competition between ‘dragon and elephant’ have been ongoing internationally. Most of these studies compared the international competitiveness in economy and industry, as well as the sustainability of development between the two countries from the perspectives of economic development and political system. Gulati and Fan (2007) compared the differences and gain/loss in rural reforms between China and India from the perspective of poverty alleviation. Mukherjee and Zhang (2007) analyzed differences in rural industrial development between China and India from three aspects: political systems, structures of ownership, and credit systems. Lu et al. (2009) analyzed foreign investors’ preferences in China and India from the perspectives of the legal and financial systems. Haley and Haley (2006) analyzed the effects of national development orientations such as exports on the commercial environments in China and India. The political system in India better complies with the western ideas of democracy and freedom compared to China. It is considered as a model of economic development under a democratic system. Thus, a range of issues such as the advantages and disadvantages of development paths and the sustainability of economic growth in China and India have been of great interest to scholars (Huang and Khanna, 2003; Korukonda et al., 2007; Srinivasan, 2006). Meanwhile, Chinese scholars also analyzed the similarities and differences in history, culture, economy, etc. between China and India. Wang and Wu (2003) compared the future development in China and India by considering differences in history, economy, religion, culture, and technology. Zhang (2006), from China’s point-of-view, introduced the politics, economy, culture, religion, society, and diplomacy of India. Other scholars have focused on comparisons in a single field such as industrial structure, rural financial systems, land systems, and export (Deng, 2010; Shi, 2011; Yang and Liu, 2012; Yao and Liu, 2015).
Most existing research compared differences in economies and systems of the two countries on a macroscopic scale. However, China and India both span extensive territories, and differences in internal regional developments are significant. Since China and India have long histories, besides the current political and economic systems in place, factors such as longstanding cultural traditions and rural-urban relationships also significantly affected the development paths in China and India. At present, few researches have focused on the differences in regional and rural development between the two countries. Comparative studies of urbanization and urban systems between China and India from a spatial geographic perspective are especially scarce. Wen (2016) compared the process of urbanization in China and India after their liberation or independence. The research stated that fast development of the economy following economic reforms resulted in increased rates of urbanization in China and India. Based on the developmental experiences of China, economic reforms accelerated the process of urbanization, however the situation in India might be different. For example, research by Bhagat (2005) showed that the rate of urbanization in India was the greatest in the 1970s to 1980s, while the rate of urbanization slowed down in the 1990s, 10 years after the economic reform. In metropolitans such as Mumbai, Kolkata and Chennai, the rate of population growth also quickly decreased. This demonstrated that there are significant regional differences in the process of urbanization (Bhagat, 2005). Li and Liu (2015) studied spatial differences in urbanization to some extent. They concluded that regional differences in urbanization in China were mainly between inland and coastal areas, while in India the regional differences in urbanization were primarily between the south and north. However this assessment of regional characteristics and differences was performed at the province/state spatial scale, therefore the descriptions of regional characteristics and differences were not sufficiently detailed spatially.
Overall, the comparison between China and India has not drawn much attention from scholars in China. Most existing studies are conducted on the macroscopic scale with respect to economy and systems, and few systematic studies have been performed on urban development and internal regional differences between the two countries. In this study, the urbanization process and spatial evolution of urban systems in China and India were systematically compared using cities as the basic spatial unit, in order to reveal the regional differences and driving mechanisms of urbanization in both countries.

2 Study areas and data resources

2.1 General comparison of the study areas

Since economic reform in 1991, India’s economy has developed rapidly. The nominal GDP of India reached $2.61 trillion USD in 2015, making India the world’s seventh largest economy. When adjusted for purchasing power, India’s GDP is $9.55 trillion USD, trailing only China and the United States of America. The per capita GDP is $1965 USD, which is significantly lower than the $8239 USD per capita GDP in China.
In 2015, the total population in India was 1.311 billion, second only to that in China. As in China, the spatial distribution of population in India is not homogeneous. Specifically, three states have populations of over 100 million. The state with the highest population is Uttar Pradesh (199,581,500). The state with the least population is the Laccadive Islands, with a population of 64429. In terms of population density, the capital Delhi has the highest density (11297 person/km2), and Arunachal Pradesh has the lowest density (17 person/km2).
India is the largest country in the South Asian Subcontinent. It is the 17th largest country in the world with an area of 2,980,000 km2 (excluding occupied territories along the China-India border and the Indian-controlled areas in Kashmir). It is nearly 1/3 of the territory area of China. However, India’s landscape is dominated by plains, with mountains and plateaus largely at altitudes below 1000 m. The low and smooth terrain, in addition to the warm and rainy climate, makes most regions arable in India. The overall conditions for agricultural development in India are superior to those in China.
India comprises 28 states (Pradesh) and 7 union territories, in which Telangana Pradesh was separated from Andhra Pradesh in 2014. As of 2011, India had 475 urban agglomerations (UA), 640 districts, and 3894 census towns (Table 1). At the end of 2010, China had 31 provinces (including municipalities and autonomous regions), 333 prefecture-level divisions, and 2856 counties. The urban agglomerations in India are similar to China’s direct-controlled municipalities, prefecture-level cities, and county-level cities; and the districts in India are similar to the counties in China.
Table 1 India’s urbanization and population profiles in states and union territories in 2011
State
(Union territory)
Population in 2011 (person) Urbanization rate (%) Population density
(person/km2)
State
(Union territory)
Population in 2011
(person)
Urbanization
rate (%)
Population density
(person/km2)
Uttar Pradesh 199,581,477 26.17 828 North
Arkande
10,116,752 30.23 189
Maharashtra 112,372,972 45.22 365 Himachal Pradesh 6,856,509 10.03 123
Bihar 103,804,637 11.30 1102 Tripura 3,671,032 48.40 350
West Bengal 91,347,736 31.87 1029 Meghalaya 2,964,007 20.07 132
Andhra Pradesh 84,665,533 33.36 308 Manipur 2,721,756 29.21 122
Central states 72,597,565 27.63 236 Nagaland 1,980,602 28.86 119
Tamil Nadu 72,138,958 23.21 555 Goa 1,457,723 62.17 394
Rajasthan 68,621,012 24.87 201 Chhattigarh 25,540,196 23.24 189
Karnataka 61,130,704 38.67 319 Mizoram 1,091,014 52.11 52
Gujarat 60,383,628 42.60 308 Sikkim 607,688 25.15 86
Odisha 41,947,358 16.69 269 Delhi 16,753,235 97.50 9,340
Kerala 33,387,677 47.70 859 Puducherry 1,244,464 68.33 2,598
Jharkhand 32,966,238 24.05 414 Chandigarh 1,054,686 97.25 9,252
Assam 31,169,272 14.10 397 Andaman Islands 379,944 37.70 46
Punjab 27,704,236 37.48 550 Dadra and Nagar Haveli 342,853 46.72 698
Haryana 25,353,081 34.88 573 Daman 242,911 75.17 2,169
Jammu and
Kashmir
12,548,926 27.38 56 Laccadive Islands 64,429 78.07 2,013

Note: Jammu and Kashmir, located in the north of India, is disputed border area between India and Pakistan. The population data of this area is provided by Indian governments.

2.2 Data source

The data for this study are derived primarily from census data from China and India, and urban population data from the United Nations Department of Economic and Social Affairs. On one hand, we used the census data to analyze population distributions and urbanization processes. Both China and India conduct comprehensive censuses every decade. This study analyzed the process and spatial pattern of urbanization based on comparisons of population data from China’s 1990, 2000 and 2010 censuses and India’s 1991, 2001 and 2011 censuses. Although the censuses were conducted one year apart, it did not impact on the characteristics of the 10-year population structure. On the other hand, we also used the United Nations population data for cities with more than 300,000 people to analyze the urban systems and their spatial evolution in the two countries. The United Nations population data include cities with populations of more than 300,000 in 2015 (China’s prefecture- and county-level cities, India’s urban agglomerations (UA)), and include the population of these cities at five-year intervals starting from 1950.

3 Urbanization and population spatial distribution patterns in China and India

Urbanization not only manifests as aggregation of population and non-agricultural industries towards cities, but also involves changes in lifestyle, values, technology, and urban and rural landscapes. At the same time it is strongly correlated to industrialization. Urbanization, to a certain extent, reflects the comprehensive development level of the country or region. However, there are differences in the specific statistics of urbanization in different countries. Therefore, it is necessary to clarify the meaning of urbanization in China and India before conducting a comparative analysis. Urbanization in China refers to the proportion of the urban resident population to the total population. In addition to local residents, the resident population includes people who have lived in the area for over half a year. In comparison, urbanization rate in India is calculated as the ratio of the registered urban population to the total population. Urban areas include state-recognized cities and towns, as well as areas with more than 5000 people at a population density of over 400 person/km2 and with at least 75% of males working in non-agricultural industries.

3.1 Comparison of the urbanization process in China and India

Since the 20th century, the total population and urbanization development in China and India indicated that, although China consistently had a higher population than India, China’s urbanization rate was lower than India for an extended period compared with India. Only after the late 1980s did the urbanization level in China become consistently higher than in India.
With respect to the changes in total population, the birth control policy in China since the 1980s resulted in a significant decrease in population growth, whereas population in India kept growing rapidly during this period. By 2015, the total population in the two countries is close (1.375 and 1.311 billion for China and India, respectively). However, recent population growth in India has decreased. From 2001-2011, the population growth in India decreased by 3.90% compared to the previous ten years. With respect to the changes in urbanization, implementation of Chinese economic reform policies since the late 1970s resulted in a steady and rapid increase in urbanization in China. The annual increase in urbanization has remained higher than 1% since the 1990s. While India also carried out a series of economic policies including opening-up in the 1990s, the urbanization rate did not exhibit a rapid increase. In fact, the urbanization growth rate in India was the highest between 1971 and 1981, and started to decrease in the 1990s (Figure 1). The annual urbanization rate in India never reached 1% during this period. Therefore, China outperformed India in the late 1980s with respect to urbanization. Thereafter, the gap in urbanization between the two countries continuously expanded. Overall, the levels of urbanization in both countries have been significantly higher than that immediately following liberation or independence at about 10%.
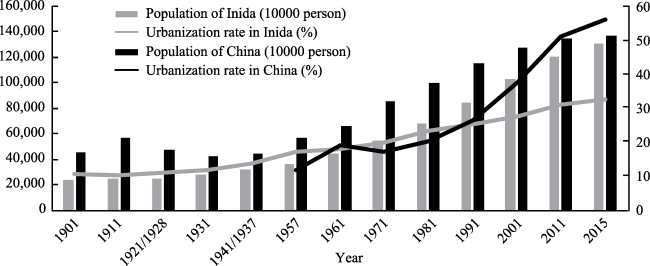
Figure 1 Change of population scale and urbanization in China and India since 1901
Note: China’s data before 1949 came from China’s Population History. Due to the lack of data in 1921 and 1941, the total population of 1928 and 1937 was used instead. The data after 1949 are obtained from the China Statistical Yearbooks. India’s data are obtained from the Office of the Registrar General & Census Commissioner.

3.2 Evolution of urbanization spatial patterns in China and India

From the evolution of spatial pattern of urbanization in China over 20 years, the urbanization level of provincial units has continuously increased. The regional differences in urbanization gradually evolve from differences between south and north to differences between coastal and inland regions. In the 1990s, China’s urbanization rate was generally lower than 50% in all regions except the three direct-controlled municipalities Beijing, Shanghai and Tianjin. Central and southern provinces had urbanization rates of 30% or less. In 2000, the urbanization rate of some provinces in the southeast coastal and central regions exceeded 30%, with urbanization in Guangdong at more than 50%. The trend of rapid development of the eastern coastal areas was emerging. By 2010, except Tibet, all of China’s provincial areas displayed an urbanization rate of more than 30%. The coastal and northeastern regions had urbanization rates of more than 50%. The spatial pattern of high urbanization in coastal regions and low urbanization in inland regions was very obvious (Figure 2).
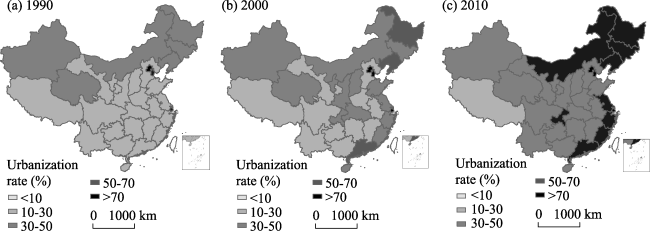
Figure 2 Evolution of spatial patterns of urbanization in China from 1990 to 2010
Unlike the dramatic changes in China, the spatial pattern of urbanization in India has been relatively stable, and the regional characteristics of north-south urbanization differences have been strengthened. Although the level of urbanization in India has continually increased, regions with declines in urbanization also exist. In 1991, the Delhi area had the highest urbanization rate in India at nearly 90%, but urbanization rates in most of the other regions were below 30%. Among the five states where the urbanization rates were above 30%, only the Mizoram state with a smaller area and lower population reached 46.10% urbanization. Urbanization in the other four states was about 30%. In the northern region, in the Himachal Pradesh state located in the northwest of the Himalayas, the urbanization rate was even lower than 10%. From 2001 to 2011, the urbanization rate in India slowly increased, but urbanization rates in most regions were still below 30%. Urbanization in the state of Tamil Nadu even decreased from 40.04% in 2001 to 23.20% in 2011. The overall urbanization spatial pattern did not show a significant change. Although the urbanization rate in the northern region of Punjab and West Bengal states gradually reached 30%, it did not alter the spatial pattern of urbanization being higher in the south than the north. Moreover, with the increasing urbanization of Andhra Pradesh in the south, this pattern was further enhanced (Figure 3). In fact, India also exhibited differences in urbanization between coastal and inland regions, but because the southern states are all coastal, this difference is consistent with the difference between north and south. It is noteworthy that the urbanization of Maharashtra along the Arabian Sea in the west of India is higher than that of the eastern states along the Bay of Bengal. This was likely due to the influence of the Western European countries such as Great Britain on India being stronger compared to the influence from East Asian countries.
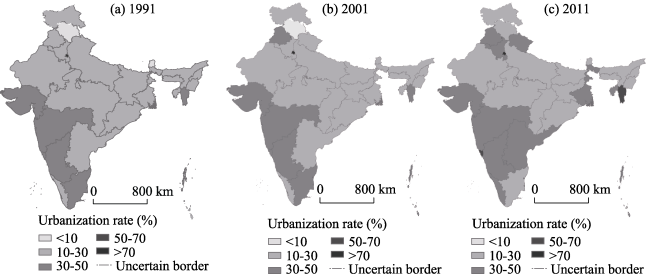
Figure 3 Evolution of urbanization spatial pattern in India between 1991 and 2011

3.3 Population agglomeration and its correlation with urbanization

Based on the 2010 China census and the 2011 Indian census data, we use the local Moran's I to analyze the spatial distribution of population. The results showed that there was a significant spatial difference between the total population and the urban population in India, whereas in China these two populations are spatially similar (Figure 4). India’s total population spatially formed four major regions: the northern region mainly includes Uttar Pradesh, Bihar state and West Bengal; the southern region mainly includes Maharashtra and Andhra Pradesh. India’s urban population in the southern region is concentrated in Maharashtra, Andhra Pradesh and Kerala, while in the northern region the urban population is concentrated in smaller regions around Kolkata. The northern region mainly consists of areas with larger urban population surrounded by a swath of areas with smaller urban population, i.e. a high-low distribution pattern. Compared with the total population, areas with concentrated urban population are significantly smaller (Figure 5). In China, the distributions of total population and urban population are relatively similar, with both mainly concentrated in the southeastern coastal areas, Chongqing and other western regions of urban population also showed a spatial pattern of high-low distribution (Figure 4).
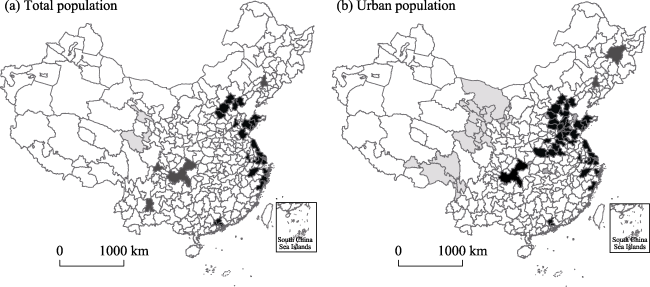
Figure 4 Characteristics of spatial distribution of population in China
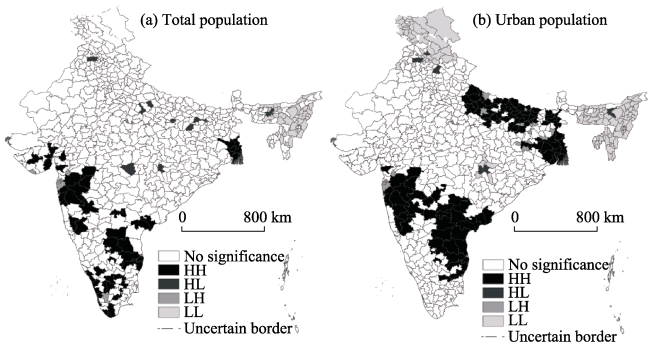
Figure 5 Characteristics of spatial distribution of population in India
Further comparative studies were made at the county-level administrative units with respect to population density. The results still showed that the population distribution in China was characterized by differences between coastal and inland areas. Although to a certain extent this coastal-inland difference also held true in India, the more significant difference observed in India was between north and south due to patches of high population density areas in northern India. The coastal-inland difference in population distribution was consistent with that in urbanization. However, in India, the urbanization pattern is opposite to the differences in population distribution between north and south. In other words, the urbanization rate is higher in areas with higher population density in China, whereas the urbanization rate is surprisingly low in areas with high population density in India (Figure 6).
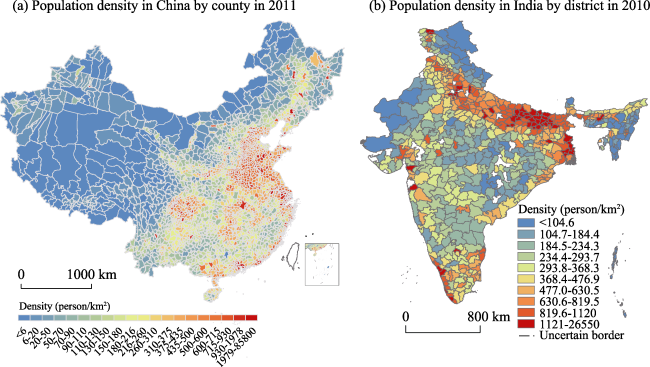
Figure 6 Characteristics of Spatial distribution of population density in China and India
The areas with high population density but low urbanization rates in India are mainly in Uttar and Bihar states in northern India. These two states have the largest population in India (both with a total population of more than 100 million). The large-scale distribution of agricultural population indicated that the population per unit of agricultural land is high in both states, which indicated excessive agricultural population in these areas to some extent. Generally speaking, as the economy develops, the joint forces of excessive labor force in rural areas and relatively high income in urban areas result in migration of the rural population to cities, resulting in a rapid increase in urbanization. The situation of a highly concentrated agricultural population in northern India might be attributed to the dominant role of agriculture in the local economy, as well as the lack of employment in urban areas. These led to limited population flow from rural to urban areas. Additionally, limitations in infrastructure, economic conditions, and land regulations made it difficult for the poor rural population to migrate long distance toward more developed regions in India (Mukherjee and Zhang, 2007). The phenomenon of a highly concentrated agricultural population also existed in China prior to the 1980s. Zhou Yixing (1995) conducted an in-depth study of this situation, which concluded that besides relaxing population migration policies, adjustment of urban industrial structure, development of industries in villages and towns are also effective measures for solving this problem.
Although analysis of the data for China in 2011 showed a significant positive correlation between population density and urbanization, the study of Yeh and Xu (1984) on urbanization rate in 1978 by province showed that population density was only one of two main factors (the other was industrialization), and the population density negatively influenced urbanization. In order to further clarify the relationship between urbanization and population density, the nonparametric estimation method was applied to investigate the correlation between urbanization rate and population density at the provincial level during the three time periods. The results indicated a positive correlation between urbanization rate and population density at the province/state level for both China and India, however this positive correlation only became significant when the urbanization rate reached 50% (Figure 7).
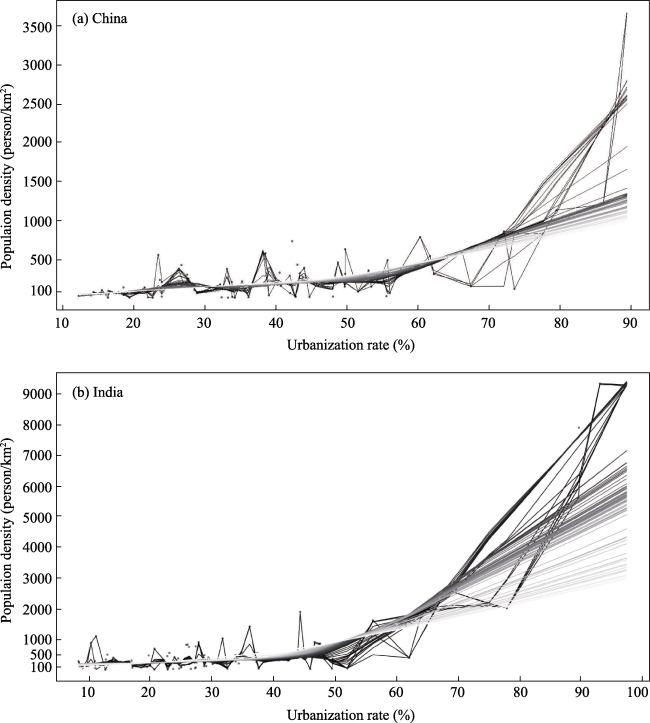
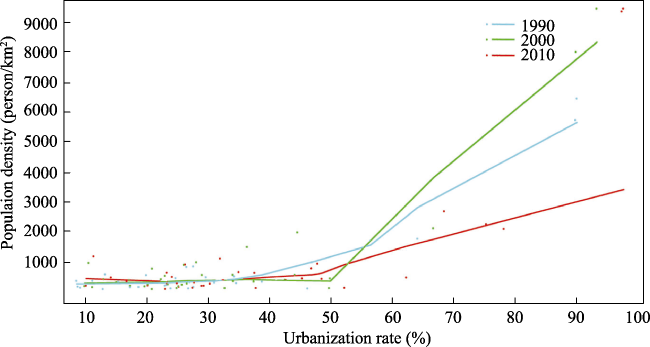
Figure 7 Correlation between urbanization and population density in China and India
Further comparative analysis was performed on the trends in the correlation between urbanization and population density in both countries during the three-time periods. The results showed that the correlation between urbanization and population density increased continuously in China. In 1990, urbanization was only loosely correlated to population density, while positive correlation between the two emerged in 2000, which then became stronger in 2010 (Figure 8). The weak correlation between urbanization and population density in 1990 may be caused by population restriction policies in large cities. With the relaxation of urban population restrictions, population continuously migrated to more economically developed cities under the market mechanisms, resulting in the observed positive correlation.
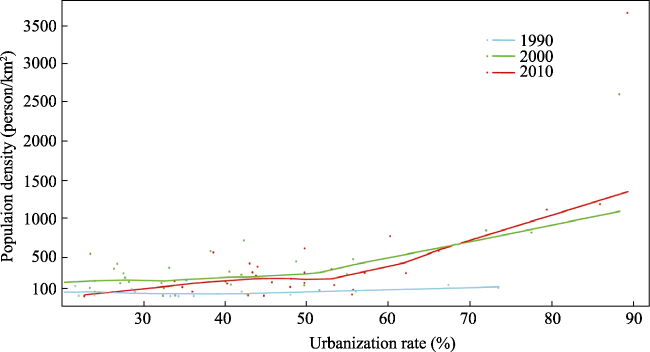
Figure 8 Changes in correlation between urbanization and population density in China
While in India, the correlation between urbanization and population density showed a trend of continuous decrease. In 1991, the positive correlation between the two variables was most significant among the three periods studied. In 2000, little correlation was observed between urbanization and population density in areas with an urbanization rate less than 50%, and the correlation further decreased in 2010 (Figure 9). The same conclusions could be drawn from the results of Pearson correlation and Spearman rank correlation tests. At the provincial level, although correlation between urbanization and population density in India remained significant through all three periods, the correlation coefficient gradually decreased (Table 2) from 1991 to 2010. The results above suggested that economic reform in India might not effectively promote the migration of surplus rural labors to urban areas.
Figure 9 Changes in correlation between urbanization and population density in India
Table 2 Comparison of the correlation between urbanization and population density in different periods in China and India
Year China India
Pearson correlation Spearman correlation Pearson correlation Spearman correlation
1990/1991 0.143 0.047 0.846** 0.483**
2000/2001 0.706** 0.393* 0.820** 0.441**
2010/2011 0.719** 0.546** 0.769** 0.453**

Note: * Significant correlation at the 0.05 level, **Significant correlation at the 0.01 level

4 Differences and spatial evolution of the urban systems in China and India

The urban system is the basis of urbanization. China and India have large populations and long histories. After long periods of evolution, both countries have relatively developed urban systems. However, due to different natural and geographical environments as well as social culture, the urban systems and their spatial evolution exhibit differences in the two countries. India uses district as the basic unit of demographic census, however this census unit is not suitable as the basis for the study of urban systems. Because according to the census data at the district level, two districts have a population more than 10 million, which are Tana, a satellite city of Mumbai, and the north 24 districts, around Kolkata. Both districts are relatively similar to a subordinate district of Beijing, and should belong to the city they located in the urban system. Therefore, the United Nations urban population data was used for the analysis of urban systems and its spatial evolution. City was used as the basic unit in China, including municipalities, prefecture-level cities, and county-level cities, while urban agglomeration (UA) was used as the basic unit in India. The major drawback with the urban population data from the United Nations was the omission of urban areas with populations of less than 300,000 people. Therefore, this study mainly reflected the status of urban systems in large- and medium-sized cities in China and India.

4.1 Comparative analysis of the urban systems in China and India

According to Zipf’s law, a one-dimensional linear model was used to fit the urban systems in large cities in China and India. The results showed that the urban systems of large- and medium-sized cities in the two countries were consistent with the characteristics of a rank-size distribution. The result is especially applicable to the relation between a city’s size and its rank in the urban system in India, which after conversion to a logarithmic scale, had a slope close to 1 (Figure 10 and Table 3). In this study, small- and medium-sized cities with populations of less than 300,000 people were not included. If these cities were considered, the characteristics of the rank-size distribution in China would be more significant. In India, over 65% of urban agglomerations (UA) (309 total) had a population of less than 300,000 in 2015, therefore the overall slope from regression on urban system size and rank in India might be higher than 1, meaning that it might also exhibit first-order distribution characteristics to some extent. As two countries with long histories, China and India have gone through long-term evolution of their urban systems, so the rank-size characteristics are generally consistent with the development of their urban systems.
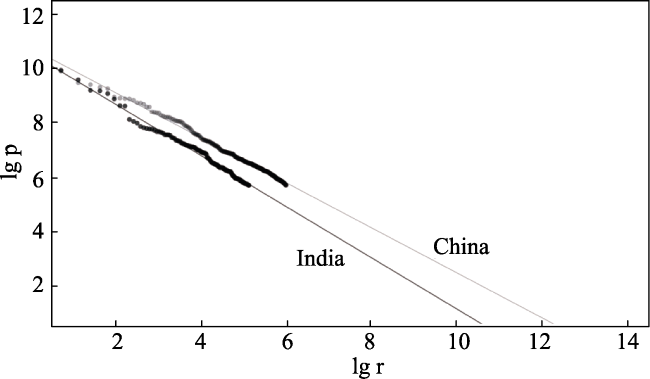
Figure 10 Comparison between China and India in development of urban systems
Table 3 Fitting analysis of urban systems in China and India
China India
a b a b
Value 10.7622 -0.8251 10.5622 -0.9380
Goodness of fit 0.9936 0.99

4.2 Evolution of urban systems in China and India and its driving force

Based on the United Nations data for cities with populations greater than 300,000, the evolution of urban systems in China and India was investigated. Emphasis was placed on the influence of economic reforms on urban systems. A series of economic reform policies had been implemented in China and India since 1978 and 1991, respectively. Therefore, the year 1950 was taken as the reference year for analysis of the change in urban scale growth and the influential factors before and after the implementation of economic reforms in both countries, thereby reflecting the influence of economic reforms on regional urban systems.
From the spatial evolution of urban systems in China in different periods, it is observed that the spatial pattern of urban systems in China during the period of 1950-1980 did not change significantly. Rapid urban development occurred primarily in central regions of China such as Hubei, Henan and the Bohai Rim region. No significant change was observed in the southeast coastal area. During the period of 1980-2015, the urban scale in coastal areas such as Guangdong, Fujian, and Jiangsu increased rapidly, as did the density of large-scale cities (Figure 11). These data suggested that economic reform might have played an important role in the development of regional urban systems.
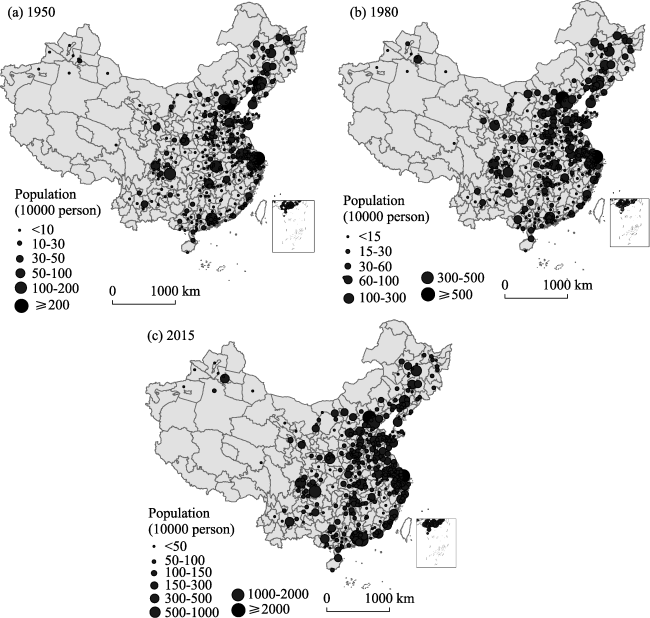
Figure 11 Change of urban spatial patterns in China
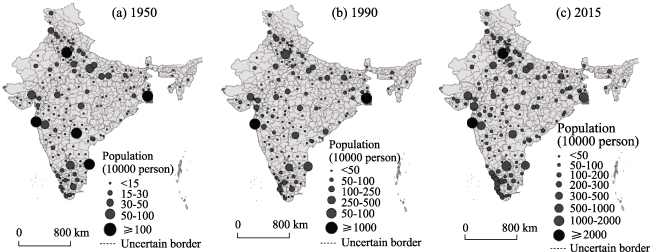
Figure 12 The evolution of urban spatial pattern in India
From the spatial evolution of urban systems in India, the overall pattern of regional urban systems did not show a significant change. The spatial pattern of six dominant major cities (Delhi, Mumbai, Kolkata, Chennai, Bangalore and Hyderabad) had been formed since 1950. In 1950, the urban scales of Delhi, Mumbai, Kolkata, Chennai and Hyderabad were comparable. Hereafter, Delhi and Mumbai developed relatively faster. Bangalore’s development was faster than Chennai and Hyderabad, and became the fourth largest city in India. Despite all of these, the overall urban pattern did not change significantly. The spatial distribution of the six core cities was dispersed, and did not show any trend to agglomerate in coastal areas. There was relatively little difference before and after the economic reform.
Krugman et al. categorized factors that influence the development of cities into first nature or second nature. The first nature category mainly consists of natural geographical environment or locational situation determined by random historical factors. The second nature refers to the impact of the spatial structure of the economic systems, such as the presence of neighboring economically advanced metropolitans. Overall, before the economic reform, China was more affected by first nature factors, while after the economic reform it was significantly affected by second nature factors. India, however, was mainly affected by first nature factors both before and after the economic reform.
To further clarify the driving force behind the spatial evolution of urban systems in China and India, we assumed that the spatial pattern of urban systems in 1950 in China and India was influenced only by first natural factors. As both China and India had just become independent countries, the modern economic system was not yet formed, and the economic systems were primarily agriculture based. Our assumption is reasonably consistent with the practical conditions in 1950, and also complies with the general practice in research of the spatial evolution of urban systems. Based on this, our research separately analyzed the increase in urban size and the correlation between the urban size in 1950 and the distance to the nearest core city in the country. We listed Beijing, Shanghai, Guangzhou, Chongqing, Tianjin and Shenzhen as China’s six core cities, and Delhi, Mumbai, Kolkata, Chennai, Bangalore and Hyderabad as India’s six core cities. As Shenzhen was just gradually developing into a core city after the Chinese economic reform, analysis of the relationship between city size increase and distance to the core cities from 1950 to 1980 excluded Shenzhen.
Based on the results from the Pearson correlation and the Spearman rank correlation analysis, the growth of urban scale in China and India before economic reform was mainly affected by first natural factors (Table 4). Although the influence of the initial city scales in 1950 on the city scales after the economic reforms significantly decreased, if the sizes of the cities at the beginning of the reforms were chosen as a baseline (1980 in China and 1990 in India), the influence of initial city scale on the city scales in China after economic reform was still significantly lower than that before the reform. Whereas in India, the influence of initial city scale on the growth of city scales was greater the post reform than the prior to reform. Therefore, after Chinese economic reform, the effect of initial city size on its growth decreased significantly, while in India the growth of city scales after reform was still significantly affected by the initial city size.
Table 4 Correlation between urban development and initial scale in China and India
Year China India
Pearson
correlation
Spearman correlation Pearson
correlation
Spearman correlation
Urban scale in 1950 and its growth (1950-1980/1990) 0.730** 0.860** 0.857** 0.646**
Urban scale in 1950 and its growth (1980/1990-2015) 0.768** 0.350** 0.623** 0.496**
Urban scale in 1980/1990 and its growth (1980/1990-2015) 0.796** 0.440** 0.848** 0.737**

Note: * Significant correlation at the 0.05 level, **Significant correlation at the 0.01 level

From the analysis of urban scale growth and distance to national core cities, prior to economic reform, the urban growth in China had already been influenced by the core cities to some extent, although the influence was relatively weak. Following the economic reform, the influence of core cities on urban growth increased significantly in China. But in India, core cities did not show a significant effect on urban growth either before or after the economic reform. The correlation between urban scale growth and the distance to core cities even became less significant in India after the reform (Table 5). Prior to economic reform, the p value of the Spearman rank correlation test for urban scale growth and distance to core cities was 0.050, which rose to 0.806 after economic reform. This suggested that economic reform weakened the driving function of core cities in the development of surrounding urban areas.
Table 5 Correlation between urban development and distance to core cities in China and India
Year China India
Pearson
correlation
Spearman correlation Pearson
correlation
Spearman correlation
Distance to six major cities and urban scale growth (1950-1980/1990) -0.053
(0.301)
-0.146**
(0.004)
0.108
(0.176)
0.155
(0.050)
Distance to six major cities and urban scale growth (1980/1990-2015) -0.189**
(0.000)
-0.243**
(0.000)
0.016
(0.837)
0.020
(0.806)

Note: * Significant correlation at the 0.05 level, **Significant correlation at the 0.01 level

In general, the factors affecting urban development in China clearly evolved from historical or natural factors before economic reform to economic factors after economic reform. In contrast, economic reform in India did not generate significant driving power to urban system development, and the initial urban scale played an important role in the urban development. Significant differences can be observed between China and India with respect to the radiative driving functions of core cities in the development of national and surrounding urban systems. Contrary to the economic pattern featured by large-scale urban agglomerations in areas such as Beijing-Tianjin-Hebei, Yangtze River Delta, and Pearl River Delta in China, areas surrounding core cities in India did not form large-scale economic collaboration zones centered on the core cities, and core cities in India did not create large-scale regional influences.
To some extent, the differences in urban spatial structures reflected the difference in the direction of industrial development between the two countries. In China, the economic spatial structure is based on urban agglomeration with centralized distribution of large-, medium- and small-sized cities in a certain geographical range. The joint development of core cities and surrounding urban areas facilitated the formation of highly efficient regional manufacturing production systems, resulting in rapid development of manufacturing industry. In comparison in India, service outsourcing was the focus after India’s economic reform, in order to fully utilize congenital advantages such as language. The service industry has a typical point aggregation pattern, consistent with the relatively loose urban spatial patterns in India. Although we tend to believe that the development of different industries resulted in differences in urban spatial structure in China and India, rather than that the development of industries adapted to the different urban spatial structure in the two countries, more evidence is required to draw conclusions on this issue.
In addition, the differences in the spatial structure of cities in China and India are due not only to changes in the influence of the economic system after economic reform, but also to the traditional social cultures of these two societies. In China even before the economic reform, correlation to some extent existed between urban growth and distance to core cities. The closer cities were to core cities, the faster they grew. This correlation was found to be weak in India prior to or after the reform.

5 Conclusion and discussion

In this study, the spatial pattern and evolution of urbanization and urban systems in China and India were systematically compared and analyzed by using census data and the data of cities with populations larger than 300,000 from the UN. The results show that:
From the trends in development following economic reform, especially after the 1990s, China’s urbanization rate increased rapidly. But in India, the urbanization growth rate did not significantly increase after the economic reform in 1991. From the perspective of spatial pattern changes since the 1990s, the spatial differences in urbanization in China have changed rapidly from north-south to coastal-inland disparity, while the spatial pattern of urbanization in India has remained stable, primarily north to south. Since states in south India are coastal, this difference between north and south also reflects a coastal-inland difference.
Although population density and urbanization did not correlate at the district scale in India, there were significant positive correlations at the provincial (state) level in both China and India. In both China and India this correlation increased significantly when the urbanization rate was above 50%. The positive correlation between population density and urbanization in China has become more significant since 1990, but the correlation in India was found to decline over time.
The urban systems of large and medium cities in China and India are consistent with the characteristics of the rank-size distribution. Considering the evolution of the spatial structure of the urban system, the spatial distribution of urban space in India was relatively scattered, and there was no major change resulting from economic reform. This is considerably different from the situation in China, where large and medium cities tended to agglomerate towards coastal areas after economic reform. The change of influencing factors before and after the economic reform of China and India also confirms the evolutionary trend of urban spatial structure in the two countries. Following economic reform, the spatial structure of China’s economic system had a significant impact on urban development, while the influence of history and natural environment dropped significantly. In India, the historical urban scale maintained an important influence on subsequent development, and economic reform appears to have even reduced the impact of economic systems on urban development. China’s urban agglomeration-based urban spatial system and India’s decentralized urban structure are strongly related to the main development direction of the two countries’ industries. Although the development of industries may be an important factor leading to differences in urban spatial structure besides the impact of the economic system, the differences in the spatial structure and its evolutionary driving forces between China and India may also be influenced by long-term social cultural factors.

The authors have declared that no competing interests exist.

[1]
Bhagat R B, 2005. Urban growth by city and town size in India. Presented at the 2005 annual meeting of the population association of America Philadelphia Pennsylvania, March 31-April 2.

[2]
Deng Xiaoxia, 2010. Comparison of rural financial system between China and India [D]. Southwestern University of Finance and Economics. (in Chinese)

[3]
Gulati A, Fan S, 2007. The dragon and the elephant: Agricultural and rural reforms in China and India.Intl. Food Policy Res Inst.What can we learn from the process of economic reform in China and India? Does the sequencing of reform and an agriculture-led package matter? What could other developing countries and countries in economic transition learn from the experiences of India and China? What could these two countries learn from their own as well as each other's experiences? How can the two largest developing countries cooperate in their agricultural and economic development and work together at multilateral negotiations, such as those conducted through the World Trade Organisation, to address the concerns of developing countries? This paper summarises the key findings of a number of studies that were prepared fortwo international conferences devoted to comparing the rural development and agricultural reform experiences of China (the dragon) and India (the elephant) over the last several decades.

DOI

[4]
Haley U C V, Haley G T, 2006. The Indian elephant and the Chinese dragon: Differing development strategies of India and China and effects on business environments.Indian Journal of Economics & Business, (Special Issue): 131-146.

[5]
Huang Y, Khanna T, 2003. Can India overtake China?Foreign Policy, (137): 74.

[6]
Korukonda A R, Carrillo G, Bathala Cet al., 2007. The dragon and the elephant: A comparative study of financial systems, commerce, and commonwealth in India and China.ICFAI Journal of International Business, 2(3): 7-20.

[7]
Li Wenjing, Liu Hong, 2015. City size, spatial and temporal changes mechanism of urbanization in India and China.Journal of East China University of Science and Technology Social Sciences Edition, 30(5): 37-48. (in Chinese)As the most two populous developing countries,India and China are in the process of urbanization.The comparison of the urbanization of the two countries will help us understand some mechanisms of it. There are massive differences in city size between China and India. The city size structure of India is pyramidal and that of China is spindle-shaped. The urban space structure is gradient in both India and China. The coastal area are more urbanized and the inland area are less urbanized. Human resources play the most important role in urbanization in both countries. National industrialization and modernization should match the human resources condition. The government shouldn't set barriers for migration,which will lead to efficiency loss.

[8]
Lu H, Huang H, Deva S, 2009. Unraveling the puzzle of differing rates of FDI and FVCI in India and China. Asian Journal of Comparative Law, 4(1): 207-236.This study seeks to unravel the puzzle underlying China's and India's differing experiences in attracting two types of foreign investment: namely foreign direct investment (090004FDI090005) and foreign venture capital investment (090004FVCI090005). Complementing the law and finance literature, we argue that foreign investors prefer the direct investment mode in China despite its poor governance environment because direct investment provides private means of control over the business, and China's institutional environment provides a more facilitating arena for FDI than India's. In contrast, India's legal infrastructure and related institutional settings prove to be better than China's in accommodating foreign portfolio (indirect) investment especially in the form of venture capital. The conclusion of this article has implications for the two countries' legal reform in the direction of the desired type of foreign investment. It also provides comparative insights into the legal institutions of China and India in fostering national innovative capacity and entrepreneurship.

DOI

[9]
Mukherjee A, Zhang X, 2007. Rural industrialization in China and India: Role of policies and institutions.World Development, 35(10): 1621-1634.The dynamic rural nonfarm sector in China has been a major contributor to the country’s remarkable growth, while in India the growth in output and employment in this sector has been rather stagnant. This paper argues that the observed patterns in the rural nonfarm development are the results of institutional differences between the two countries, especially in their political systems, ownership structure, and credit institutions. A review of the strengths and weaknesses of the rural nonfarm economy in China and India highlights the potentials and challenges of growth in the sector.

DOI

[10]
Shi Bingzhan, 2011. A comparison between China’s and India’s export growth: Based on the decomposition of range, price and quantity.Contemporary Finance & Economics, (4): 94-101. (in Chinese)

[11]
Srinivasan T N, 2006. China, India and the world economy.Economic and Political Weekly, 41(34): 3716-3727.Among countries with at least 10 million people in 2003, China and India have been growing very rapidly since 1980. Their rapid growth has had a significant impact on the world economy. After describing the two basic channels, namely, import demand and export supply, through which the growth of a country influences growth of the rest of the world and vice versa, the paper turns to its theme, namely, the influence of the growth of China and India. China is integrated to a greater extent than India with the world economy. Although India has succeeded in becoming a major destination of global outsourcing and in exports of information technology enabled services, it lags behind China in the competition to become a global manufacturing hub, though it is catching up. India's advantage over China lies in its vibrant democracy and the legal and financial systems. The paper concludes that whether or not India overtakes China in the next two decades, it is clear that both countries will be economic powerhouses in the medium term, and undoubtedly, their growth will have significant impacts on the world economy.

DOI

[12]
Wang Dehua, Wu Yang, 2003. Dragon and Elephant:Comparison Rapid Development between China and India in the 21st Century. Shanghai: Shanghai Academy of Social Sciences Press. (in Chinese)

[13]
Wen Fude, 2016. The differences of urbanization progress in China and India and its reasons.South Asian Studies Quarterly, (2): 48-54. (in Chinese)

[14]
Yang Tianyu, Liu Hehe, 2012. The change of industrial structure and the difference of labor productivity growth between China and India.World Economy, (5): 62-80. (in Chinese)

[15]
Yao Guoyue, Liu Shenghua, 2015. A comparative study of land system between China and India.World Regional Studies, 24(2): 59-67. (in Chinese)India's national conditions are similar to china,but it's land system is different from china. In this paper, the author gives a briefs introduction of land systems of two countries and compare the effect of them. The study found that india's private ownership of land and scattered landmanagement system are not successful. Even the compensation system of land expropriation is relatively perfect, more beneficiaries are landlords and rich peasants. So it not only failed to reduce extreme poverty and wealth gap, failed to promote the healthy development of agriculture and rural areas, but also failed to maintain social stability, improve infrastructure and promote the healthy development of industrialization and urbanization. But, china's public ownership of land which ownership and management of land are separate protect the farmers to get relatively average distribution of agricultural production and land compensation, ensuring the relative stability of society, mobilize the enthusiasm of farmers, reduce a lot of poverty, achieve the life with full food and cloth in whole country, boost the rapid improvement of infrastructure such as roads and railways, and promote the healthy development of industrialization,urbanization and agricultural modernization. Therefore, the author draw a conclusion that china need to insist and improve the public ownership of land and propose some suggestions to improve china's land system by learning from india's useful experiences of land management and land expropriation.

[16]
Yeh A G O, Xu X, 1984. Provincial variation of urbanization and urban primacy in China.The Annals of Regional Science, 18(3): 1-20.Compared to other developing countries, China has a low urbanization level as a result of government policy to control urban development since 1949. However, there is much regional variation in urbanization and urban primacy among its 26 provinces. This paper attempts to analyze the provincial variation in urbanization and urban primacy of China in 1978 by factor analysis and regression techniques. In China, government policy does not only slow down the overall rate of urbanization but also has profound influence on provincial variation in urbanization and urban primacy. Low urban primacy in the eastern provinces is mainly the result of the urbanization policy of controlling the development of large cities that favours the development of small and medium cities. The spatial industrial policy of decentralizing industries from the coastal provinces to interior provinces encouraged high urbanization and urban primacy in the western interior provinces of China.

DOI PMID

[17]
Zhang Minqiu, 2006. Across the Himalayan Gap:A Chinese Quest for Understanding India. Chongqing: Chongqing Press. (in Chinese)

[18]
Zhou Yixing, 1995. Urban Geography. Beijing: The Commercial Press. (in Chinese)

Outlines

/