Research Articles

Spatial distribution and influencing factors of interprovincial terrestrial physical geographical names in China

  • ZHANG Shengrui , 1, 2, 3 ,
  • WANG Yingjie , 1, 2, 3, * ,
  • JU Hongrun 4 ,
  • LI Daichao 1, 2, 3 ,
  • FANG Lei 1, 2, 3 ,
  • QI Junhui 1, 2, 3 ,
  • WANG Yingying 1, 2, 3 ,
  • ZHANG Tongyan 1, 2, 3
Expand
  • 1. Institute of Geographic Sciences and Natural Resources Research, CAS, Beijing 100101, China
  • 2. University of Chinese Academy of Sciences, Beijing 100049, China
  • 3. State Key Laboratory of Resources and Environmental Information Systems, Institute of Geographic and Natural Resources Research, CAS, Beijing 100101, China
  • 4. School of Tourism and Geography Science, Qingdao University, Qingdao 266071, Shandong, China
Corresponding author:Wang Yingjie (1961-), Professor, Email:

Author: Zhang Shengrui (1990-), PhD Candidate, specialized in GIS and geo-visualization. E-mail:

Received date: 2017-05-31

  Accepted date: 2017-10-16

  Online published: 2018-12-20

Supported by

Atlas of the People’s Republic of China (New Century Edition) Research, No.2013FY112800

Copyright

Journal of Geographical Sciences, All Rights Reserved

Abstract

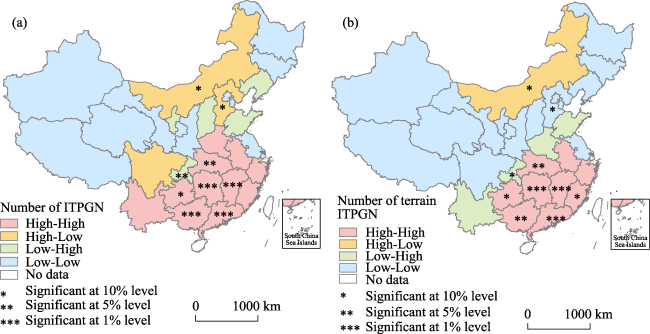
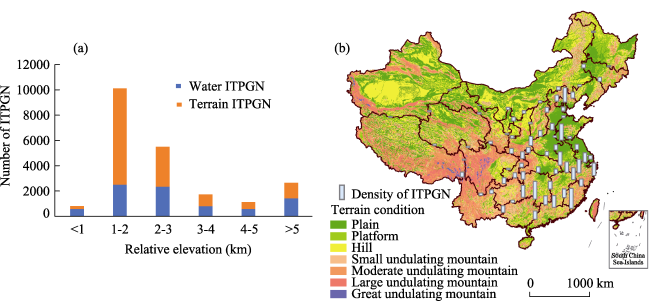
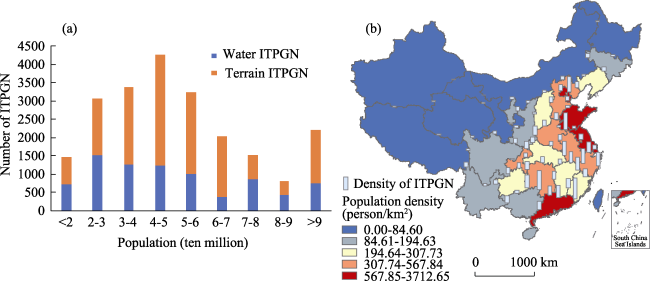
The interprovincial terrestrial physical geographical entities are the key areas of regional integrated management. In this paper, we analyzed the spatial patterns of the interprovincial terrestrial physical geographical names (ITPGN) from three aspects: numerical features, spatial variance and spatial agglomeration. The influencing factors of the distribution of ITPGN and the implications for the regional management were further discussed. GIS technology was used to visualize the distribution of ITPGN, analyze the spatial agglomeration and the influencing factors of ITPGN. A total of 11,325 ITPGN, including 4243 water ITPGN and 7082 terrain ITPGN, were extracted from the database of “China’s Second National Survey of Geographical Names (2014-2018)”, and the mountain geographical names were the largest type in ITPGN. Hunan Province had the largest number of the names in China, and Shanghai had the smallest number of the names. The spatial variance of the terrain ITPGN was larger than that of the water ITPGN, and the ITPGN showed a significant agglomeration phenomenon in the southern part of China. In addition, the relative elevation and the population had an impact on the distribution of the ITPGN. The largest number of the geographical names occurred in the regions where the relative elevation was between 1000-2000 meters, and where the population was between 40-50 million. Based on the analysis, it was suggested that the government should take the ITPGN as management units, optimize management strategies based on the characteristics of different types of ITPGN, strengthen the naming of unnamed interprovincial terrestrial physical geographical entities and balance the interests in the controversial ITPGN. This study demonstrated that GIS and spatial analysis techniques were useful for the research of ITPGN and the results could provide targeted management suggestions to realize coordinated development in the interprovincial regions.

Cite this article

ZHANG Shengrui , WANG Yingjie , JU Hongrun , LI Daichao , FANG Lei , QI Junhui , WANG Yingying , ZHANG Tongyan . Spatial distribution and influencing factors of interprovincial terrestrial physical geographical names in China[J]. Journal of Geographical Sciences, 2018 , 28(12) : 1845 -1859 . DOI: 10.1007/s11442-018-1567-9

1 Introduction

The geographical names are proper names for geographic places and features (Hill et al., 1999), which are not only linguistic forms, but also cultural and societal artefacts that offer insights into the history, habitat and environmental perception of a certain culture (Jett, 1997). The research of geographical names could provide a special perspective for studying the historical and cultural heritage of specific places or large regions (Wang et al., 2012). In addition, the formation and the development of geographical names are closely related with the regional terrain and natural resources, especially for the physical geographical names.
Currently, the research on geographical names is mainly focused on the origin and evolution (Gudde, 1969; Everitt, 1977; Situ, 1993; Read and Wickman, 2003; Mutschmann, 2012; Li and Feng, 2015), the languages and semantics (Hunn, 1996; Li and Situ, 2008; Leidner, 2011), and the classification (Stewart, 1954; Krämer B, 1995; Zhang et al., 2010) of geographical names. With the development of spatial quantitative research, the study of the distribution of geographical names has gradually increased (Sun, 1990; Wang et al., 2006; Brown, 2008; Wang et al., 2013; Chen et al., 2016). The scholars could infer the development of human society or the regional environment by analyzing the change of the spatial distribution of geographical names. In terms of the relationships between geographical names and the environment, scholars have explored the influence of water resources, the regional terrain and the vegetation of surface on the naming of geographical entities (Browne et al., 2004; Luo et al., 2010; Zhan, 2015). In addition, geographical names could reflect many social factors including the social structure, folk culture, political change and religious belief in the regions (Cohen and Kliot, 1994; Huang et al., 2005; Horsman, 2006). Also, the economic conditions are found different between different types of geographical names (Yuan, 2006; Zhang, 2016).
However, the geographical names at large scales are less studied. It is because the data for large-scale geographical names are difficult to access due to their uncoordinated management by different institutes. In terms of human geographical names, the study areas are mostly limited within one administrative unit. For instance, Wang et al. (2012) analyzed and visualized the spatial pattern and the Sinification of Zhuang (the largest minority language in China) geographical names in Guangxi, but Zhuang geographical names were also distributed in several other provinces of China, such as Yunnan and Guangdong. If the spatial pattern of the Zhuang geographical names was analyzed across different provinces, the study above could offer a whole view of the spatial characteristics of Zhuang geographical names. The large-scale physical geographical entities have the natural function to be the boundaries of different administrative units, but these names are rarely studied like the widely distributed human geographical names. It is necessary to obtain and analyze the large-scale geographical names to realize better management and development.
In China, the interprovincial physical geographical entities refer to the physical geographical entities that are located across multiple provinces. These entities are generally in large scale and its different parts are managed by different provinces. Because no institutions are specially designated for the interprovincial physical geographical entities, the management of these entities is usually disorganized. The national poverty-stricken counties of China are closely related with the mountain ranges and hills that are located across the provincial boundaries. For example, the Luoxiao mountain range, the Liupan mountain range, the Dabie mountain range, the Wumeng mountain range and the Yanshan-Taihang mountain range are the main poor areas in China, and all of them are located across multiple provinces. The poverty of these areas may be related with the negligent management by government and the complex terrain which seriously blocked the transportation and the economic activities. Consequently, the survey of the interprovincial physical geographical names will help identify the poverty-stricken areas in China. Furthermore, visualizing the spatial pattern of the geographical entities could offer more objective and clear information about the geographical entities (Sun et al., 2017). According to the official documents submitted by China to the 11th United Nations Conference on the Standardization of Geographical Names, mapping the interprovincial physical geographical names is one of the main tasks of China’s Second National Survey of Geographical Names. Mapping the interprovincial physical geographical names will help the government to detect the problems in the management of these names and improve the efficiency of solving the problems.
In this study, we will first analyze and visualize the spatial patterns of the interprovincial terrestrial physical geographical names (ITPGN) in China from the aspects of the numerical features, spatial variation, and spatial association. Then, we will explore the factors influencing the spatial pattern of the ITPGN. Based on these results, the research will provide helpful information for the management of the interprovincial terrestrial physical geographical entities and guide their development.

2 Data and methods

2.1 Data source

Data of the ITPGN in China were acquired from the database of China’s Second National Survey of Geographical Names (2014-2018), conducted by the Ministry of Civil Affairs of the People’s Republic of China. According to Chinese National Standard Rules for Classification of Geographical Names and Code Representation (GB/T 18521-2001), the geographical names could be divided into two categories: physical geographical names and human geographical names. The physical geographical names were subdivided into ocean physical geographical names, terrestrial waterbody geographical names and terrestrial terrain geographical names. In this study, we only analyzed the latter two kinds of physical geographical names that were located across multiple provinces, i.e., ITPGN. Some typical ITPGN were illustrated in Figure 1. The classification system of ITPGN included two first-level types of water ITPGN (interprovincial terrestrial waterbody geographical names) and terrain ITPGN (interprovincial terrestrial terrain geographical names) and 27 second-level types (Table 1). The study area covered 30 provincial units including 21 provinces (Hebei, Shanxi, Liaoning, Jilin, Heilongjiang, Jiangsu, Zhejiang, Anhui, Fujian, Jiangxi, Shandong, Henan, Hubei, Hunan, Guangdong, Sichuan, Guizhou, Yunnan, Shaanxi, Gansu, and Qinghai), 4 municipalities (Beijing, Tianjin, Shanghai, and Chongqing) and 5 autonomous regions (Inner Mongolia, Guangxi, Tibet, Ningxia and Xinjiang). Hainan and Taiwan were not included because they had no ITPGN. In addition, the number of the physical geographical names crossing the administrative boundaries of Hong Kong and Macao were counted into Guangdong Province for statistical convenience (Figure 2). The population data were from the sixth national population census of China in 2010. The digital elevation model (DEM) was in raster format with a 500-m resolution, provided by the National Fundamental Geographical Information System of China.
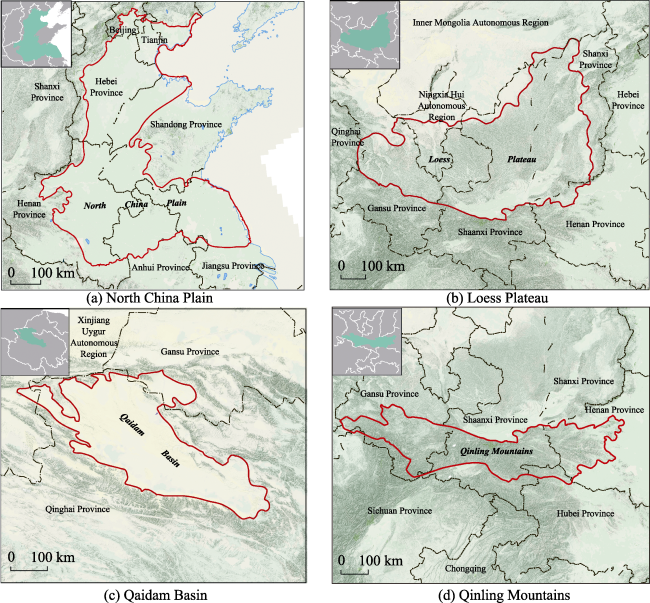
Figure 1 The locations of four typical ITPGN in China
Table 1 Classification system of ITPGN in China
First-level types Second-level types Descriptions
Water
ITPGN
River Flows on the surface
River head A birthplace of a river
River valley An elongated concave ground that the river flows, including gorges
Cove A curved section of a river
Estuary A place that rivers flow into the oceans, lakes and other rivers
Delta A landform in the surrounding of the estuary, formed by the deposition of the sediment in the river
Lake A closed and wide area with water flowing slowly, formed by water accumulation in the depression
Glacier A natural ice body with a certain shape and self-movement, including ice sheet
Waterfall A place where water flows over a vertical drop or a series of drops in the course of a stream or river
Drainage basin Catchment areas of rivers and runoff surrounded by watershed
Water system A system that is constituted by the rivers, lakes, swamps and others
Terrain
ITPGN
Plain A flat open area including low land and depression
Basin An area where the surroundings is higher than the middle section
Plateau An area of highland, usually consisting of relatively flat terrain that is raised significantly above the surrounding area (topographic elevation > 500 m), with one or more sides with steep slopes
Hill A landform that extends above the surrounding terrain with at most 500 m of topographic elevation and at most 200 m of topographic prominence
Col (Pass) A saddle-shaped mouth between mountains
Mountain valley A linearly extending groove-shaped concave between hills or mountains
Mountain peak A summit of a mountain, includes a hilltop and a ridge
Mountain A steep highland with topographic elevation larger than 500 m and topographic prominence larger than 200 m, including volcano
Mountain range Regions with continuous mountain land, hills and relatively rugged plateau
Mountain land Areas with topographic elevation larger than 500 m and topographic prominence larger than 200 m, consisted with many mountains and valleys.
Mire The depression distributed in wet and shallow water areas, with marsh and wet plants growing and soil layer with peat accumulated or latent layer, including wetland
Steppe Areas dominated by temperate zone of herbaceous vegetation types of perennial, low temperature xerophytic, clustered grasses
Forest Ecosystems formed mainly with trees and their symbiotic plants, animals, microorganisms, soils, climate and so on, includes jungle
Desert An area with surface covered with a large area of sand dunes in arid and extreme arid areas, formed by the wind erosion, including sand areas
Gobi An area with surface covered by gravel and rock in arid areas
Platform Uplift flat surface with one or more sides with steep slopes, including loess tableland
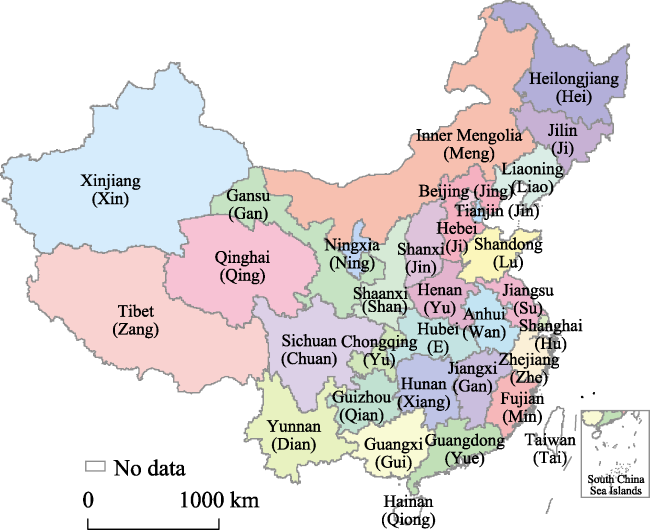
Figure 2 The provincial administrative divisions and their abbreviations in China

2.2 Methods

The spatial patterns of ITPGN are measured from three aspects: the numerical features, the spatial variance and the spatial association. The numerical features include the amount and the structure of the ITPGN. The spatial variance is indicated by the coefficient of variation, while spatial association is detected with global and local Moran’s I indexes.
2.2.1 The numerical features
In order to visualize the distribution of the ITPGN, the number of the ITPGN (including water and terrain types) and its proportion of each type are illustrated at the provincial level. In addition, the density of ITPGN is defined to show its distribution across the interprovincial line:
Dname=Nname /Lborder (1)
where Dname is the density of ITPGN, Nname is the number of ITPGN, and Lborder is the length of the interprovincial border. The larger the Dname is, the denser of the ITPGN distributes across the provincial border.
2.2.2 Spatial variation indicator
The coefficient of variation (CV) is selected to measure the spatial variation of ITPGN of different types. It is a standardized measure of dispersion of a probability distribution of frequency distribution. CV is defined as the ratio of the standard deviation (SD) to the mean (Equations 2 and 3) (Lovie, 2005). In this study, it is considered to be more reasonable to use the CV than the SD, because the SD must always be understood in the context of the mean of the data, which varies between different types of ITPGN in this study. In contrast, CV is independent of the mean in which the measurement is made (Lovie, 2005). Therefore, using the CV allows for a comparison between the spatial variation of different types of ITPGN, which have widely different means.
$SD=\sqrt{\frac{1}{n}{{\sum\nolimits_{i=1}^{n}{\left( {{X}_{i}}-\bar{X} \right)}}^{2}}}$ (2)
$CV=SD/\bar{X}$ (3)
where the CV is the coefficient of variation; SD is the standard deviation; n is the number of studied provinces (n = 30); Xi is the number of ITPGN of the ith province (i = 1, 2, …, n); and $\bar{X}$ is the mean of the number of the ITPGN of the provinces. The larger the CV value is, the more spatial variation in the number of the ITPGN.
2.2.3 Spatial association indicators
Spatial association statistics is used to measure and analyze the degree of associations among divisions in a geographic space. In this study, the global Moran’s I and local Moran’s I are used to analyze the global and local spatial association of ITPGN, respectively. The spatial association analysis needs the geographical relationships of the provinces to be modelled. For both analysis, a matrix of spatial weighting is used to conceptualize the spatial relationships and express how strong the influence is between the provinces. We use a spatial weighting matrix that takes contiguity into consideration. If two spatial units have a common border of non-zero length, they are considered contiguous and a value of 1 is assigned. Otherwise, a value of 0 is assigned. This method is suit to describe the spatial relationship of the provinces in this study, because the interprovincial terrestrial physical geographical entities are located across at least one border between two provinces. At last, the spatial weight matrix is standardized in such a way that the rows sum to one by dividing each value by the row sum of the original matrix.
(1) Global indicators of spatial association
Global indicators of association measure if, and how much, the dataset is associated throughout the study region. One of the principal global indicators of association is the Moran’s I. It estimates the overall level of spatial association for a dataset (Moran, 1948):
Global Moran’s I = $\frac{n}{\sum\limits_{i=1}^{n}{\sum\limits_{j=1}^{n}{{{w}_{ij}}}}}\frac{\sum\limits_{i=1}^{n}{\sum\limits_{j=1}^{n}{{{w}_{ij}}\left( {{x}_{i}}-\bar{x} \right)\left( {{x}_{j}}-\bar{x} \right)}}}{\sum\limits_{i=1}^{n}{{{\left( {{x}_{i}}-\bar{x} \right)}^{2}}}}$ (4)
where n is the number of studied provinces; and xi and xj are the number of ITPGN in province i and j (ij), respectively; $\bar{x}$is the average value; and wij is the matrix of spatial weights. The values of the global Moran’s I range from -1 to +1. Positive values indicate a positive association, i.e., the clustering of similar values across geographic space. In contrast, negative values indicate a negative association, which means that neighboring values are more dissimilar than expected by chance, suggesting a spatial pattern similar to a chess board. Theoretically, if Moran’s I converges to zero, it indicates a random spatial pattern.
(2) Local indicators of spatial association (LISA)
LISA allows us to locate clustered patterns by comparing the values in each specific location with the values in neighboring locations. We use the local Moran’s I index to identify different spatial association patterns, including high-high clusters, low-low clusters, high-low outliers, and low-high outliers (Anselin, 1993). The high-high clusters are areas with more ITPGN that are surrounded by neighboring areas also with more ITPGN, while low-low clusters are areas with less ITPGN that are surrounded by neighboring areas also with less ITPGN. These two patterns are positive spatial associations. In contrast, spatial outliers are identified when the regions with more ITPGN are surrounded by neighboring regions with less ITPGN and vice versa.
Local Moran’s I =$\frac{{{x}_{i}}-\bar{x}}{s_{i}^{2}}\sum\limits_{j=1,j\ne i}^{n}{{{w}_{ij}}({{x}_{j}}-\bar{x})}$ (5)
where $s_{i}^{2}$ is the variance of the ITPGN, and the other symbols are described above. A high positive local Moran’s I value implies that an area has similarly high or low values as its neighbors, while a high negative local Moran’s I value means the location is significantly different from the surrounding areas. The local Moran’s I can be standardized so that its significance level can be tested based on the assumption of a normal distribution (Anselin, 1995; Levine, 2004).

3 Results

3.1 Numerical features of ITPGN

There were 11325 ITPGN in China. The numbers of water ITPGN and terrain ITPGN were 4243 and 7082, respectively. The number of second-level types was extremely uneven. Most types of ITPGN were less than 100, while only a few types of ITPGN were more than 1000. The water ITPGN mainly consisted of river and drainage basin geographical names (92.91%), while the terrain ITPGN were mainly composited of mountain and mountain peak geographical names (83.21%) (Table 2).
Table 2 The number of ITPGN in China
Water ITPGN Number Terrain ITPGN Number
River 1971 Plain 36
River head 19 Basin 19
River valley 73 Plateau 18
Cove 14 Hill 134
Estuary 28 Col (Pass) 465
Delta 5 Mountain valley 174
Lake 89 Mountain peak 1684
Glacier 32 Mountain 4209
Waterfall 3 Mountain range 94
Drainage basin 1971 Mountain land 110
Water system 38 Mire 30
Steppe 21
Forest 43
Desert 19
Gobi 12
Platform 14
The number of ITPGN varied a lot in different provinces. Hunan and Jiangxi had the largest number of ITPGN of 2017 and 1505, respectively. Around the two provinces, the number of ITPGN showed a decreasing trend with the distance to the two provinces increasing. The three municipalities of Shanghai, Tianjin and Beijing all had a small number of ITPGN. In addition, the provinces of Shandong, Ningxia, Liaoning and Heilongjiang also had a low number of ITPGN less than 300 (Figure 3).
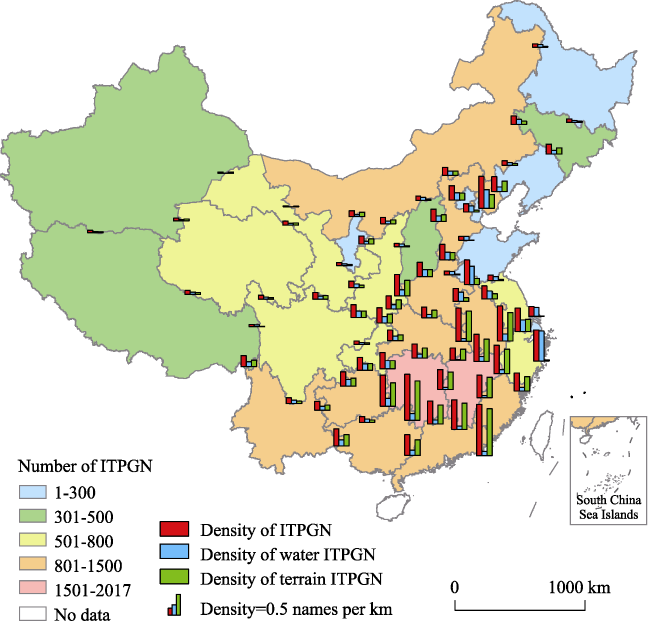
Figure 3 The spatial characteristics of the number of ITPGN and the density of ITPGN in China
The distribution of water ITPGN and terrain ITPGN was different over the country. The largest number of water ITPGN occurred in Yunnan (577), followed by Hebei (510) and Anhui (472), while the least number of water ITPGN occurred in Ningxia (71), Shanghai (86) and Liaoning (113). Meanwhile, Hunan (1642), Jiangxi (1329) and Guangxi (1108) had the largest number of the terrain ITPGN, while Shanghai (3), Shandong (39) and Tianjin (49) had the least number. In most provinces, the number of terrain ITPGN was larger than that of water ITPGN. However, in some provinces, the water ITPGN had a larger proportion in total ITPGN, such as Yunnan, Jiangsu, Heilongjiang, Shandong, Shanghai, Tianjin, Hebei, Tibet, Sichuan, Shanxi, Henan and Jilin. Beijing was the only provincial unit that had the same number of the water and the terrain ITPGN (Figure 4).
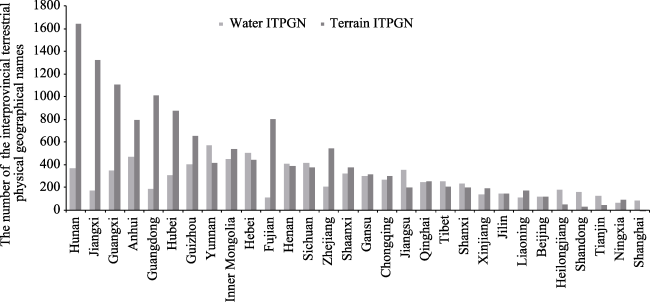
Figure 4 The number of water and terrain ITPGN in different provinces of China (sorted in descending order of the total number of ITPGN)
There was a different spatial pattern of the density of ITPGN (Figure 3). The density of ITPGN in the south and east of China were generally higher than other areas. The highest density of the ITPGN was on Min-Yue (Fujian and Guangdong) line of 0.97 per kilometer, Xiang-Gui (Jiangxi and Guangxi) line of 0.86 per kilometer, and Wan-Zhe (Anhui and Zhejiang) line of 0.67 per kilometer, while the lowest density was on Meng-Gan (Inner Mongolia and Gansu) line of 0.02 per kilometer, Gan-Xin (Gansu and Xinjiang) line of 0.03 per kilometer, and Xin-Zang (Xinjiang and Tibet), line of 0.04 per kilometer.
In terms of water ITPGN, the highest density was on Hu-Zhe line (Shanghai and Zhejiang, 0.56 per kilometer), which was much higher than the second densest Lu-Wan (Shandong and Anhui),line of 0.35 per kilometer. By contrast, Gan-Xin (Gansu and Xinjiang) line had the lowest density, which was nearly zero. Most of these low-density lines were in the north and west of China except Min-Gan (Fujian and Jiangxi) line of 0.04 per kilometer in the southeast. In terms of terrain ITPGN, the highest density was on Min-Yue (Fujian and Guangdong) line, which was 0.89 per kilometer, followed by Xiang-Gui (Jiangxi and Guangxi) line of 0.74 per kilometer. The high-density lines were mainly distributed in the southeastern part of the country. By contrast, Ji-Lu (Hebei and Shandong) line had the lowest density at only 0.003 per kilometer.

3.2 Spatial variance and association of ITPGN

The distribution of ITPGN showed an obvious spatial variance. The CV of the ITPGN was 63.46%, and the CV of terrain ITPGN (87.49%) was much higher than that of the water ITPGN (49.99%). It indicated that the spatial distribution of the terrain ITPGN was more uneven than that of the water ITPGN (Table 3).
Table 3 CV and Moran’s I of ITPGN
Indicator ITPGN Water ITPGN Terrain ITPGN
CV 63.46% 49.99% 87.49%
Moran's I 0.3739* -0.0011 0.5235*

Notes: * indicates the value is significant at the 0.01 level.

The global Moran’s I of ITPGN was 0.3739 and that of the terrain ITPGN was 0.5235, both significant at 0.01 level (Table 3). It meant that the spatial agglomeration phenomenon of the geographical names was positively clustered over the country. By contrast, the global Moran’s I of water ITPGN was not significant, which meant its distribution was more likely to be random. Thus, the local spatial association analysis was only applied to the total ITPGN and the terrain ITPGN (Figure 5). The local spatial associations were mostly positive. A cluster of provinces with more ITPGN, and neighboring provinces with more ITPGN, was apparent in the southern part of China. The Provinces of Hunan, Jiangxi, Guangdong and Guangxi even showed a significant cluster effect at 0.01 level. By contrast, clusters of provinces with less ITPGN, surrounded by neighbors with less ITPGN, were apparent in western China, Northeast China, Jiangsu Province and three municipalities in the east. High-low and low-high outliers were distinct among the clusters, with Chongqing being a significant low-high outlier and Hebei and Inner Mongolia being significant high-low outliers (Figure 5a). The LISA map of terrain ITPGN was similar to that of total ITPGN because the terrain geographical names were the majority of the ITPGN. High-high clusters were gathered in the southeastern part of China, and most provinces were significantly positively associated. The low-low clusters were widely distributed in the western and northern parts of China, with only Inner Mongolia being the high-low outlier among them. Between the high-high clusters and low-low clusters, the provinces of Shandong, Henan, Yunnan and the municipality of Chongqing were the low-high outliers (Figure 5b).
Figure 5 Local indicators of spatial association (LISA) map of ITPGN and terrain ITPGN in China

4 Discussion

4.1 Influencing factors of the distribution of ITPGN

The distribution of ITPGN was influenced by both physical and human factors. The geographical names were created by the human beings, so the geographical names were generally more intensive where more people lived. In addition, the distribution of physical geographical entities was closely related with terrains. The more complex the regional terrain was, the higher the density of the physical geographical entities. However, the complex terrain restricted human activities and fewer people lived there. Thus, there might be many unnamed physical geographical entities in the complex terrain areas, and the number and density of the physical geographical names might not change monotonically with the population and terrain.
The quantitative analysis of ITPGN in different levels of relative elevation of the provinces showed that the number of ITPGN was least in the province with relative elevation below 1000 m. It was because the terrain was relatively flat in these provinces. By contrast, the largest number of ITPGN occurred when the relative elevation of the province was between 1000-2000 m. When the relative elevation was above 2000 meters, there was a negative relationship between the number of ITPGN and the relative elevation. It was possibly because that fewer people lived in these areas and many unnamed physical geographical entities existed in these areas. However, the number of ITPGN increased a bit when the relative elevation was above 5000 m (Figure 6).
Figure 6 The relationship between ITPGN and terrain
The relationship between the density of ITPGN and the terrain showed a similar trend. Hills and mountains were the most complex terrain, so the density of ITPGN in mountainous areas was generally higher than that of other areas, such as Min-Yue (Fujian and Guangdong) line, Xiang-Gui (Hunan and Guangxi) line, Zhe-Gan (Zhejiang and Jiangxi) line and Gan-Yue (Jiangxi and Guangdong) line. These provincial boundaries were all located in the southeastern hilly areas, with the density higher than 0.5 per kilometers (Figure 6). In the areas where the terrain was simple, such as the plain, the density of ITPGN was low. The density of ITPGN in Su-Lu (Jiangsu and Shandong) line was only 0.11 per kilometer, which was located in the North China Plain, and that of the Ji-Hei (Jilin and Heilongjiang) line was only 0.07 per kilometer, which was located in the Northeast China Plain (Figure 6). In the west of China, the terrain was extremely steep and complex, however, the density of ITPGN was low. This phenomenon indicated a large number of unnamed interprovincial terrestrial physical geographical entities might exist in western China.
The population showed a positive effect on the number of ITPGN when the provinces had less than 50 million people. However, when the population was between 50 and 90 million, the number of ITPGN was negatively related with it (Figure 7). It was because a high-density population generally appeared in flat areas, where the terrain was simple. Thus, the number of ITPGN was not necessarily high where people gathered. When the population was higher than 90 million, the number of ITPGN increased sharply. This phenomenon was mainly caused by the special situation in Guangdong Province. As the province with the largest population in China, Guangdong had more complex terrain than the other densely populated province, so its ITPGN number was much higher.
Figure 7 The relationship between ITPGN and population
The density of ITPGN was basically positively related with population density over space. In the east and south of China where population density was high, the density of ITPGN was also higher than that in the sparsely-populated western areas (Figure 7). For example, the density of ITPGN higher than 0.5 per kilometer was gathered in the populous interprovincial lines, such as Jing-Jin (Beijing and Tianjin) line, Hu-Zhe (Shanghai and Zhejiang) line, Su-Zhe (Jiangsu and Zhejiang) line. The density of ITPGN lower than 0.1 per kilometer was mainly located on the sparsely populated boundaries, such as Gan-Ning (Gansu and Ningxia) line, Chuan-Zang (Sichuan and Tibet) line, Qing-Xin (Qinghai and Xinjiang) line, Xin-Zang (Xinjiang and Tibet) line and Meng-Gan (Inner Mongolia and Gansu) line.

4.2 Implication for the management of ITPGN

4.2.1 Taking the ITPGN as managing units
The interprovincial terrestrial physical geographical entities are located across multiple provinces, so the management policies and development levels of the parts in different provinces may vary greatly. This variation may undermine the unity of the geographical entities and influence the effect of resource protection. For example, the Yuntai mountain is located across Henan and Shanxi provinces. The part of the Yuntai mountain in Henan ranks as a AAAAA scenic area, which is the highest rank awarded by the China National Tourism Administration. In contrast, the part in Shanxi is just an ordinary scenic spot, whose reputation and development of tourism is far inferior to the other part. However, the natural scenery of the two parts is almost the same. The differences in the development are caused by the different management policies. Thus, it may be better to take ITPGN as a unit for the management of the interprovincial terrestrial physical geographical entities, especially for the protection of the interprovincial natural resource.
4.2.2 Adjusting developing policies based on the ITPGN types
The management policies should be different for different types of interprovincial terrestrial physical geographical entities. Affected by climate, soil, hydrology and other natural factors, the economic development in different types of geographical entities are very different. The plains and basins are flat and the soil is generally fertile. Consequently, these places are more suitable for urban and agricultural development. The economic level is relatively high in these interprovincial terrestrial physical geographical entities, such as the North China Plain, the Northeast China Plain, the Yangtze Plain and the Pearl River Delta. Over-exploration of the resources and pollution are the biggest problems that threaten the sustainable development in these areas. The government should focus on how to realize the benign development of the human-environment system. In contrast, the economic development in the mountains and hills is relatively backward. In fact, the concentrated contiguous destitute areas of China are all located in the interprovincial terrestrial physical geographical entities except the Lvliang mountain area. In these destitute areas, the natural scenery and the integrity of traditional culture are much better than that of most developed areas. If the local government took advantage of these potential tourism resources, it would be possible to realize a win-win situation of economic development and environmental protection.
4.2.3 Strengthening the naming of the unnamed geographical entities
According to the analysis of the drivers of the spatial pattern of ITPGN, it is found that there may be many unnamed physical geographical entities in the west of China, especially in areas whose relative elevation is higher than 2000 meters. For example, there are many mountain peaks on the Qing-Xin (Qinghai and Xinjiang) line, Xin-Zang (Xinjiang and Tibet) line, Qing-Gan (Qinghai and Gansu) line, Chuan-Qing (Sichuan and Qinghai) line, Zang-Qing (Tibet and Qinghai) line, Xin-Zang (Xinjiang and Tibet) line, Chuan-Zang (Sichuan and Tibet) line and Dian-Zang (Yunnan and Tibet) line, but the number of ITPGN on these lines is relatively small. The main reason for this phenomenon may be that many mountain peaks are not named in these areas. Therefore, the government should strengthen the naming of the unnamed interprovincial terrestrial physical geographical entities, which will significantly improve the efficiency of regional management. What’s more, it can be deduced that there might be many unnamed terrestrial physical geographical entities crossing the national boundaries of China. The naming of these entities is vitally important to declare the national sovereignty and defend the territorial integrity.
4.2.4 Balancing the interests on controversial ITPGN
Due to historical problems, the ownerships of some interprovincial terrestrial physical geographical entities are unclear, and the rights of using, developing and managing these entities are confused. For example, the Weishan Lake, located in the area between Shandong and Jiangsu Province, was an important planting and fishing area for the residents living in the surroundings. In the past, the residents of the two sides of the lake always conflicted with each other over the planting and harvesting rights to the lake. The confliction posed a great threat to the social stability and was harmful to the protection and development of the resource. Therefore, it is suggested that the government should intervene to coordinate different groups to excavate the value of the ITPGN together. Based on the rights and interests of the local residents, the government could establish an interest consultation mechanism to deal with the problems.

5 Conclusions

Based on the data of China’s Second National Survey of Geographical Names, this study analyzed the spatial patterns of ITPGN in China. New knowledge was acquired regarding the numerical features, spatial variation, and spatial association of the ITPGN in China. The effects of terrain and population on the distribution of ITPGN were further discussed. Four suggestions for the management of ITPGN were offered based on the analyses.
The results showed that there were 4243 and 7082 water ITPGN and terrain ITPGN in China, and the mountain was the largest type of ITPGN. Hunan had the largest number of ITPGN in China, while Shanghai had the smallest. The highest density of ITPGN was on Min-Yue (Fujian and Guangdong) line, while the lowest was on Meng-Gan (Inner Mongolia and Gansu) line. In addition, the spatial variance of the terrain ITPGN was larger than that of the water ITPGN. There was a significant spatial association in the total ITPGN and terrain ITPGN, and the significant high-high clusters were gathered in the southern part of China. Population and the terrain interactively exerted significant effects on the distribution of ITPGN. The largest number of ITPGN occurred in the areas where the relative elevation was between 1000-2000 m and where the population was between 40-50 million.
Based on the current problems in the management of ITPGN, this paper suggested that the management of the interprovincial terrestrial physical geographical entities should take ITPGN as managing units, adjust developing strategies based on the ITPGN types, strengthen the naming of the unnamed entities and balance the interests on the controversial ITPGN. This paper only analyzed two important factors of population and terrain due to the limit of the data. Other influencing factors on the spatial pattern of the ITPGN need to be further analyzed. Future studies can also combine the historical information of the ITPGN to better understand the relationships between human and environment at a large scale.

The authors have declared that no competing interests exist.

[1]
Anselin L, 1993. The Moran Scatterplot as an ESDA Tool to Assess Local Instability in Spatial Association. Morgantown, WV: Regional Research Institute, West Virginia University, 111-125.

[2]
Anselin L, 1995. Local indicators of spatial association-LISA. Geographical Analysis, 27(2): 93-115.

[3]
Brown P, 2008. Up, down, and across the land: Landscape terms, place names, and spatial language in Tzeltal.Language Sciences, 30(2): 151-181.The Tzeltal language is spoken in a mountainous region of southern Mexico by some 280,000 Mayan corn farmers. This paper focuses on landscape and place vocabulary in the Tzeltal municipio of Tenejapa, where speakers use an absolute system of spatial reckoning based on the overall uphill (southward)/downhill (northward) slope of the land. The paper examines the formal and functional properties of the Tenejapa Tzeltal vocabulary labelling features of the local landscape and relates it to spatial vocabulary for describing locative relations, including the uphill/downhill axis for spatial reckoning as well as body part terms for specifying parts of locative grounds. I then examine the local place names, discuss their semantic and morphosyntactic properties, and relate them to the landscape vocabulary, to spatial vocabulary, and also to cultural narratives about events associated with particular places. I conclude with some observations on the determinants of landscape and place terminology in Tzeltal, and what this vocabulary and how it is used reveal about the conceptualization of landscape and places.

DOI

[4]
Browne T, Fox R, Funnell D, 2004. The “invisible” mountains: Using GIS to examine the extent of mountain terrain in South Africa.Mountain Research and Development, 24(1): 28-34.

DOI

[5]
Chen Chen, Xiu Chunliang, Chen Wei,et al.2014. Spatial distribution characteristics of place-name landscape based on GIS approach in Beijing and its reasons for the formation. Scientia Geographica Sinica, 34(4): 420-429. (in Chinese)Place-name landscape, which can reflect the natural environment, national rise and fall, social and economic changes both historically and presently, is an important research branch of Human Geography. This research used GIS to discuss the spatial distribution characteristics of place-name landscape in Beijing and explained their reasons. Firstly, by exploring the origins of place-names, the research carred statistical analysis on them, and classified them into two categories. Secondly, through obtaining Kernel density distribution characteristics of every kind of the place-name through Space Smoothing Algorithm based on Kernel Density Estimation, the research discussed the spatial distribution characteristics of place-name landscape in Beijing. Thirdly, the reasons for the spatial distribution were analyzed. Main conclusions made by this research are as follows: 1) Natural landscape place-names were mainly concentrated in the northern and western mountain areas. 2)By contrast, human landscape place-names tend to centralize in the central and southeastern plains. 3) The spatial distribution characteristics of place-names among human landscape place-names is different. Political, economic, garden, architecture and engineering activities prefer to cluster in the central city, the southeast part of Beijing is proved to be economic and hydraulic engineering activities' concentrated area, military activities tend to centralize in the northwestern and eastern areas, garden construction activities, however, are almost found in the northwest and northeast areas. By studying on the spatial distribution characteristics of place-name landscape in Beijing and their reasons, this research can clearly show the functional zoning in Beijing during Yuan, Ming and Qing, and help to explore the development of social and economic conditions during those historical periods. In addition, this article can enrich research methods and empirical studies of place-name studies in human geography.

[6]
Cohen S, Kliot N, 1992. Place-names in Israel’s ideological struggle over the administered territories.Annals of the Association of American Geographers, 82(4): 653-680.This paper deals with the symbolic role of place-names as expressions of ideological values. Names are symbolic elements of landscape that reflect abstract or concrete national and local sentiments and goals. In the case of Israel, the selection of place-names has become a powerful tool for reinforcing competing national Zionist ideologies. Implicit in this competition are two major Israeli placename themes: the message of essentialism or continuity, and epochalism or change. Essentialism is expressed in Hebrew placenames and in a variety of other symbols that project Israel as the sole heir to the Holy Land. In this context, Biblical and Talmudic placenames are reintroduced or reinforce the bonds between the Jewish community in Israel and the land, as emphasized by the Likud party when in power, in alliance with the orthodox religious wing and nationalist parties of the extreme right. Epochalism is expressed through place-names that reflect modern Zionist settlement values and military heroes, or the renewed interaction of Jews with their land through identification with nature. This was the approach of the founders of the State of Israel; it continued while the Labor party was in power, and is likely to be reintroduced with Labor's return to power. We explore the process of naming places as a mechanism for landscape transformation in the territories captured by Israel in the Six Days War of 1967-the Golan, Gaza, and the West Bank. In these regions, the conflict between Jewish and Palestinian/Arab national symbols is most prominent, and the differences within the two Zionist camps over the future relationship of the Territories to the State of Israel are most pronounced.

DOI

[7]
Everitt A, 1977. Reflections on the historical origin of regions and pays.Journal of Historical Geography, 3(1): 1-19.This paper examines the historical origin of two related but distinct types of country-side or pays in England: those based on early-settled river-valleys and those associated with areas of wold. W. G. Hoskins has pointed out that in Devon early places like Tawton and Taviton derived their names from rivers and were associated with outlying stocks or cattle-farms—Tawstock and Tavistock—which originally formed distinct but related parts of the same river-estate. A similar association is found in many areas. Two examples in Kent, where the evidence for early settlement is unusually abundant, are examined in detail: the estates of the Darenth people and the Bourne people. In both cases settlement pressed inland from the river itself, far up into the wooded Downland or wold. As well as their original river communities they thus developed an outlying area of summer pasture based on isolated forest shielings. The former may have originated before the English invasions and were certainly very early. The development of the shielings into permanent farms occurred later, mainly in the middle- or later-Saxon period. The Kentish evidence is significant for three reasons. First, there can be no doubt that in the county as a whole the wold region or Downland originated as the outlying summer pasture of the river-estates. Secondly, as the isolated shielings evolved into permanent farms, the region developed an independent life of its own, with distinct characteristics from those of the parental river-settlements. Thirdly, the word wold occurs widely in the Downland place-names of East Kent, where it definitely denotes woodland or forest, and not simply the “elevated stretch of open country” which it is often said to signify. Did other areas of wold, now largely woodless, such as the Cotswolds and Lincolnshire Wolds, also originate as the outlying wood-pasture of early river-peoples?

DOI

[8]
Gudde E G, 1969.1000 California Place Names:Their Origin and Meaning. Berkeley, US: University of California Press, 11-105.

[9]
Hill L, Frew J, Zheng Q, 1999. Geographic Names. The implementation of a gazetteer in a georeferenced digital library.Digital Library, 5(1): 1-19.The Alexandria Digital Library (ADL) Project has developed a content standard for gazetteer objects and a hierarchical type scheme for geographic features. Both of these developments are based on ADL experience with an earlier gazetteer component for the Library, based on two gazetteers maintained by the U.S. federal government. We define the minimum components of a gazetteer entry as (1) a geographic name, (2) a geographic location represented by coordinates, and (3) a type designation. With these attributes, a gazetteer can function as a tool for indirect spatial location identification through names and types. The ADL Gazetteer Content Standard supports contribution and sharing of gazetteer entries with rich descriptions beyond the minimum requirements. This paper describes the content standard, the feature type thesaurus, and the implementation and research issues.

DOI

[10]
Horsman S, 2006. The politics of toponyms in the Pamir mountains.Area, 38(3): 279-291.This paper is an original study of the relationship between landscape and ideology through an examination of Pamir mountain toponyms. The research analyses traditional, Tsarist, Soviet and post-Soviet Pamiri toponyms. It is the first study to compare mountain toponyms with existing research on the naming processes of urban Soviet and post-Soviet places. It also compares the Soviet political use of landscape with that by other political systems and ideologies, in particular Nazism. The paper finds that over time there are commonalities in the types of names selected for urban places and mountains and the rationale behind these choices. However, it also notes significant differences. These differences suggest that the concept of 'the mountain' did not carry the same political significance as the urban or other landscapes (the steppe and forest) in Russian, Soviet and post-Soviet ideological and nation-building constructions.

DOI

[11]
Huang Quansheng, Yang Guanghua, 2005. The place name of immigration in Sichuan and Huguang people migrate into Sichuan.Journal of Southwest University (Social Sciences Edition), 31(3): 111-118. (in Chinese)The place name of immigration is a reflection of the immigration activity in history. It embodies lots of immigration information. The placename in Sichuan has strongly reflected the history of immigration during Ming and Qing Dynasty. The regular space distribution about the placename of immigration in Sichuan is like this: where the influence of chaos caused by war was drastic, there were fewer native inhabitants survied from the former Dynasty and more placenames of immigration remained. On the contrary, where the influence of chaos caused by war wasn鈥檛 so radial, more native inhabitants survived and fewer placenames of immigration remained. Immigrants chose to live in places where there were convenient conditions, so the number of the placenames of immigration along the larger River and the plain is larger than that of the out-of-there way mountain areas in Sichuan and the number of the placenames of immigration in the former Sichuan is larger than that in cultural background and the distance in space, most of these immigrants came from Huguang province. It have sixty percent. The Way of the distribution was consistent with the legend of huguang people migrate into Sichuan in Sichuan province.

[12]
Hunn E, 1996. Columbia Plateau Indian place names: What can they teach us?Journal of Linguistic Anthropology, 6(1): 3-26.I propose a program for cross-cultural research seeking semantic universals in place鈥搉ame systems. Over 1000 place-names in the Sahaptin Indian language of northwestern North America are analyzed for syntactic, semantic, and distributional regularities. Comparisons are drawn with Dena'ina Athabaskan, Yurok, and local English place-name systems. Binomial place-names are rare in Sahaptin, though common in other languages. Sahaptin place-names very frequently are descriptive of biological and topographic features of sites. Many Sahaptin place-names describe features of land and water as if in motion. Place-names are sacred in origin; thus no places are named for persons. Quantitative analysis of the spatial distribution of place-names unexpectedly reveals a striking correlation between place-name density and population density which holds for a sample of 14 languages. This appears due to a tendency for an individual's repertoire of place-names to be limited to approximately 500.

DOI

[13]
Jett S C, 1997. Place-naming, environment, and perception among the Canyon de Chelly Navajo of Arizona.The Professional Geographer, 49(4): 481-493.Place-names may provide insights into cultures' linguistics, histories, habitats, and spatial and environmental perceptions. To yield such insights, I analyze a comprehensive inventory of 245 Navajo place-names of the Canyon de Chelly system, Arizona. The analysis first identifies positional and directional linguistic elements in place-names. Frequencies of references to natural features such as canyons, prominent rocks, water features, and so forth, as well as cultural features such as trails and prehistoric Anasazi ruins and petrographs, are then tallied. These names reflect interaction between the character of the environment and what the Navajo residents perceive as important within it. Rocks of various kinds constitute the largest category of named natural features, with canyons a close second; plant and animal referents are quite common. Preexisting non-Navajo place-names were not borrowed when Navajos took over the area in the 1600s. The great majority of Navajo place-names are translatable and literally descriptive; relatively few are commemorative, only four including personal names, and none is allusive to other places or to abstract qualities. The place-names appear to have been quite stable over time. The aforementioned onamastic traits, as well as frequent "non-specificity," are also characteristics of Athapaskan place-names elsewhere in the Southwest and in Alaska; however, Navajo practice differs from Alaskan in the former's occasional use of duplicated and alternative place-names.

DOI

[14]
Krämer B, 1995. Classification of generic places: Explorations with implications for evaluation.Journal of Environmental Psychology, 15(1): 3-22.This is an exploratory study, taking on the transactional viewpoint. It provides further research into the notion of place, focusing on the generic nature of places. Metatheoretically, the study is couched into Facet Approach. The main aim was to identify criteria which systematically structure preference for generic places and, on the basis of those criteria, to establish a classification system by which generic places can be compared and related to one another. Fifty-five participants conducted card sort procedure. Multidimensional Scaling Techniques (MSA, SSA) were used to analyse the data. Three relevant criteria could be found: (1) Function of the places, (2) Specificity of function, and (3) Privacy. Implications for future research and practical implications are discussed.

DOI

[15]
Leidner J L, Lieberman M D, 2011. Detecting geographical references in the form of place names and associated spatial natural language.SIGSPATIAL Special, 3(2): 5-11.Recognizing spatial language in text documents, termed geoparsing, is useful for many applications, because together with mapping such language to lat/long values, also known as geocoding, it enables the connection of the unstructured textual realm with the structured realm of Geographic Information Systems (GIS) [11]. For example, news stories about events happening in a particular location can be explored on a map for a spatial understanding of these events, as implemented by applications like the European Media Monitor (EMM) [18] and NewsStand [13, 20]. Web pages, blogs, encyclopedia articles, news stories, tweets and travel reports can all benefit from such interlinking with maps, which requires the recognition of spatial language. Note that geoparsing can be considered as a more specific application of the task of Named Entity Recognition and Classification (NERC): NERC is concerned with automatically recognizing proper nouns of any kind, often meant to include monetary amounts, dates, and other types, while geoparsing is the NERC task applied to locations specifically. Geoparsing is also known by many names in the literature, including geotagging, georecognition, and toponym recognition, but for consistency, here we will refer only to geoparsing. In this paper, we provide an overview of the challenges related to geoparsing, several families of geoparsing methods, existing systems and data collections available for performing geoparsing, and open research questions related to geoparsing.

DOI

[16]
Levine N, 2004. CrimeStat III: A Spatial Statistics Program for the Analysis of Crime Incident Locations (Version 3.0). Houston (TX): Ned Levine & Associates/Washington, DC: National Institute of Justice.

[17]
Li Aijun, Situ Shangji, 2008. The genesis and diffusion of the Yangs’ generals culture and geographical distribution of concerned place-names.Tropical Geography, 28(2): 193-198. (in Chinese)The Yangs’ Generals culture was derived from the historical battles against foreign enemy invasion during the period of the North Song Dynasty.It is diffused gradually by way of drama and fiction,and has become one of Chinese spirit brands.The Yangs’ Generals culture has a deep influence in China,which has brought many correlative place-names from the celebrities and stories of the Yang Family throughout 18 provinces and municipalities,and formed many cultural landscapes with rich connotation.Its causes of formation have a close relation to historical activities of the Yangs’Generals,cultural belief,military affairs encouragement and ancestor worship culture.The spatial distribution of the Yangs’ Generals place-name culture takes on some rules and can be divided into 4 functional areas:historical activity area,diffusion area of military culture,diffusion area of reverence culture and diffusion area of offspring migration.The place-names correlative to the Yangs’ Generals Culture are mainly distributed between the Great Wall and the line from the lower reaches of the Yellow River to the upper reaches of the Hanjiang.

[18]
Li Peng, Feng Dan, 2015. The politics of place naming: Changing place name and reproduction of meaning for Conghua Hot Spring.Human Geography, 30(2): 58-64. (in Chinese)The past 30 years has witnessed a critical reformulation on the study of toponymy as the politics of place naming practices become the focus. Increasing scholars are paying attention to criticize the social fighting and political struggle when analyzing a place name, instead of regarding it only as a substitute of a specific geographical area. In China, the great development of economy has brought various geographical transitions. Among them, the changes of place names have become one of the most significant geographical issues due to the needs of cities marketing strategies or political reasons. Under this context, the traditional methods of Toponymy, which focuses only on classifying and resourcing places names, can neither follow the steps of changes of places names driven by economic development, nor be understood the deeper reasons behind them. Therefore, this paper tries to take the name-changing process of Conghua Hot Spring, as an example to analyze the politics of place naming practices in China. We use qualitative research method, by analyzing the documents, in-depth interview and field observation materials. The findings of the research unravel a complicated political process on place(re)naming practices. Because of the high symbolic value of "Conghua Hot Spring" in China's history, this name becomes a focus of attention from different scales of the actors.

[19]
Lovie P, 2005. Coefficient of variation. Encyclopedia of Statistics in Behavioral Science, 1: 317-318.

[20]
Luo W, Hartmann J F, Wang F, 2010. Terrain characteristics and Tai toponyms: A GIS analysis of Muang, Chiang and Viang.GeoJournal, 75(1): 93-104.

DOI

[21]
Moran P A, 1948. The interpretation of statistical maps. Journal of the Royal Statistical Society: Series B (Methodological), 10(2): 243-251.Perceptions of boundaries between communicative codes and the modalities through which they are produced and perceived are mediated by social actors’ particular communicative repertoires and histories. I focus in particular on how the affordances of SignWriting (SW), a writing system for sign languages that has been adapted in Germany to additionally inscribe the physical movements by which spoken languages are produced, reveal and affect users’ diverse interpretations of the relationship between German Sign Language (DGS) and German. I examine the production and interpretation of DGS SW texts on two different scales: a classroom in Germany and a transnational, multilingual online network of SignWriters with whom classroom participants engage.

DOI

[22]
Mutschmann H, 2012. The Place-names of Nottinghamshire:Their Origin and Development.Cambridge, UK: Cambridge University Press, 164-169.

[23]
Read W A, Wickman P R, 2003. Florida Place-names of Indian Origin and Seminole Personal Names. Tuscaloosa, US: The University of Alabama Press, 78-79.

[24]
Situ Shangji, 1993. The reflection of Lingnan’s Rice cluture in place names.Agricultural History of China, 12(1): 52-54. (in Chinese)

[25]
Stewart G R, 1954. A classification of place names.Names, 2(1): 1-13.Some may prefer the term false etymology to that of folk etymol- ogy, since the processdoes not always occur at what they consider the folk level. Thus Seneca Lake (ororiginally, the Seneca tribe) Page 10. 10 George R. Stewart

DOI

[26]
Sun Baisheng, Guo Cuien, Yang Yitian et al.Yang Yitian , 2017. Spatial distribution characteristics of rural place-name cultural landscape based on GIS approach in Chengde.Scientia Geographica Sinica, 37(2): 244-251. (in Chinese)With the help of statistical analysis of the number of place-name and spatial smoothing analysis in GIS based on the point distance operation of mobile search method, this research objectively and accurately reflects the fact that the cultural landscape of rural place-name in Chengde area is rooted in the unique naturalcultural geographical characteristics of it. At the same time, it also reflects the blendingintegration of diverse cultures of Chengde area in historical period. The research discovered that there are differences in the spatial distribution of cultural landscape place-name of various categories in Chengde area. The cultural landscape place-name of military activities category are distributed in Weichang County, Luanping County,Chengde County and Pingquan County of Chengde. These areas are just the places of battles and border defences in the history of Chengde. The cultural landscape place-name of economic activities are mainly distributed in Weichang County. Since in the reign of Guangxu in Qing Dynasty, paddocks were opened and farmlands were forbidden, a great number of people bought lands for reclamation to develop agricultural economy.The subsequent economic activities such as stores, power houses, crock kilns, brick kilns, distilleries, oil mills,dye-works, sugar mills and Blacksmith furnaces increased. These activities in this area were much more than other areas and place-name named after these activities were common. The spatial distribution of cultural landscape place-name of buildings category is positively correlated with the rural population density of Chengde area. This is demonstrated by the fact that in the southern area of Chengde where the population density is relatively high, the spatial distribution of cultural landscape place-name of buildings category is basically concentrated. As for the spatial distribution state of cultural landscape place-name of commemoration category, there is no obvious concentration area and they are distributed everywhere, which shows that local people all yearn for a beautiful life. Most of the spatial distribution areas of cultural landscape place-name of Manchu language,Mongolian language and dialects are concentrated in Pingquan County. This fully reflects the regional characteristic of Pingquan that it's located at the place where different nationalities depend on and interact with each other. Moreover, this demonstrates the brands of the activities between Manchu people, Mongolian people and the Han people while they live together here. From the angle of the spatial diversity of place-name culture, the in-depth characteristics of the culture in Chengde area were further recognized. In today when the traditional culture is disappearing rapidly, applying new methods for the quantitative identification of the spatial distribution characteristics of the cultural landscape of place-name is the basis of the protectiondevelopment of the intangible cultural heritage of place-name. It also reflects the features of folk custom in this whole area and the deep historical and cultural background. Its researches reflect the blending of diverse cultures of Chengde area in historical period to some extent. It also has reference significance to the exploration of the protection of the intangible cultural heritage of place-name in Chengde area.

[27]
Sun Donghu, 1990. Development and geographical distribution of the colony of town names in the North China Plain.Geographical Research, 9(3): 49-56. (in Chinese)The contemporary colony of town names in the north China Plain is the continuation and progress on its historical foundations, the town names had the form of characters at least in the Shang Dynasty (17th-] ]th century B.C.) In the Qin and Han Dynasty (22lB, C.-A. D220) , the primary geographical pattern of the colony and some principles of naming were found.d, A lot of county names were established during the Sui and Tang Dynast (A.D, 581-907). By the zin Dynasty (A.D 1115-1234), the colony had been enriched and perfected over the past. Dividing, merging, changing and removing of the place names continue from the founding of New China up to now,The growth of economic power and population is the foundation of the development of towns, therefore it is the main factor that influences the capacity and stability of the town names inside the colony. Not only the stability was strenthened, but also some of historical place names reappeared along with the economic development. Replacements of political power and military operations are immediate powers of speeding up the change in the place names. The effect of history and culture on people's minds, hence a lot of place nemes have born emotional colouring.The colony has clear features of district in distribution for it is restricted by the geograprical factors (especially the condition, of communicatiou). At present, along the railway from Beijing to Guangzhou, the Grand Canal and the highway from Beijing to Kaifeng to Huangchuan, the three lengthwise Chains which are formed of the town names have been takeng shape. The two crosswise chains are along the railways from Beijing to Qinhuangado and the other from lanzhou to Lianyungang. They are the important lines to control the geographical distribution of the town names inside the uhole region. By the citilization the towns would be crowded together on the former lines and put the new compositions into the colony. We must pay attention to it at laying down the long-term programme of towns distribution for this region.

DOI

[28]
Wang F, Hartmann J, Luo W et al.Luo W , 2006. GIS-based spatial analysis of Tai place names in southern China: An exploratory study of methodology.Geographic Information Sciences, 12(1): 1-9.This research is part of an ongoing larger project dealing with the historical origins of the Tai in southern China and Southeast Asia. The sinification of ethnic minorities, such as the Tai, has been a long and ongoing historical process in China. One indication of historical change is reflected in geographical place names over time. Many older Tai names can be recognized because they are named after geographical or other physical features in Tai, such as 090008rice field090009, 090008village090009, 090008mouth of a river090009, 090008mountain090009, 090008basin090009, etc. On the other hand, many other older Tai place names have been obliterated or modified in the process of sinification. The objective of the larger project is to reconstruct the historical past settlements of the Tai from place names. This research is an exploratory study demonstrating how modern GIS and spatial analysis techniques can benefit researchers in historical-linguistic-cultural studies who have been less exposed to them. In particular, GIS-based spatial interpolation and clustering methods are used to map the spatial patterns and identify the concentrations of Tai place names; GIS overlays are used to define some spatial variables, which are then fed into a logistic regression in attempt to explain the spatial patterns.

DOI

[29]
Wang F, Wang G, Hartmann J et al.Hartmann J , 2012. Sinification of Zhuang place names in Guangxi, China: A GIS-based spatial analysis approach.Transactions of the Institute of British Geographers, 37(2): 317-333.Zhuang, the largest minority language in China, is the label given to a variety of Tai languages and dialects spoken mostly in Guangxi. As a result of the process known as Sinification or Sinicisation stemming from the influx of Han soldiers and settlers moving in from many directions, but primarily the north, many Zhuang place names (toponyms) were changed to Han or pronounced with a Han accent or spelled in Chinese in such a way as to obscure the original Zhuang form. The objectives of this paper are to (1) construct a GIS database of toponyms in Guangxi at the township, county and prefecture levels from a comprehensive toponymical dictionary series of China; (2) analyse the spatial distribution of Zhuang vs non-Zhuang toponyms and its association with environmental factors; and (3) examine the historical evolution of toponyms to better understand the process of Sinification. Results show that Zhuang toponyms have the highest concentrations in the southwest Twin-Rivers Basin and the western mountainous area, and decline gradually towards the east. Zhuang toponyms are better preserved in areas that are more remote from major transport routes and major cities, and at higher ground level and with a somewhat steeper slope. Analysis of the limited number of toponyms with time stamps reveals that the Zhuang toponyms on contemporary maps are older in the west but more recent in the east. We speculate that in eastern Guangxi, with larger Han settlements for a longer period, older Zhuang toponyms were likely to be obliterated. The centroids of Zhuang and non-Zhuang toponyms converge towards the centre of Guangxi over time, reflecting the impact of increasingly integrated Sino-Zhuang settlement patterns.

DOI

[30]
Wang Fahui, Wang Guanxiong, Li Xiaojuan, 2013. GIS-based spatial analysis of Zhuang place names in Guangxi, China.Geographical Research, 32(3): 487-496. (in Chinese)This research is part of an ongoing larger project on the historical origins of the Tai in southern China and Southeast Asia.The Zhuang language is one of many languages in the Tai language family.By deciphering the authoritative toponymical dictionary series of China,this study,as its foremost purpose,has constructed a GIS database of place names in Guangxi at the township,county,and prefecture levels.Toponyms are classified as Zhuang and non-Zhuang with some(wherever available) marked with the eras when they were first recorded.Geo-visualization techniques help us display the fact that the highest concentrations of Zhuang toponyms are in the southwest Twin-Rivers Basin and the western mountainous area,and that they decline gradually towards the east.Various regression models reveal that places with Zhuang toponyms tend to be located on higher ground with a steeper slope.They are less likely to be found in locations with paddy or irrigated land.They are more remote from major transport routes and major cities.Analysis of the limited number of toponyms with time designations reveals that the Zhuang toponyms on the contemporary map are older in the west but younger in the east.We speculate that in eastern Guangxi,with larger Han settlements for a longer period,older Zhuang toponyms were likely to be obliterated,and only younger Zhuang toponyms in more remote pockets of Zhuang settlements have been preserved.The centroids of Zhuang and non-Zhuang toponyms converge towards the center of Guangxi over time,indicating narrowing difference in their spatial distribution patterns and reflecting the impact of an increasingly integrated Sino-Zhuang settlement pattern.

DOI

[31]
Yuan Qiaoling, 2006. The economic connotation of Chinese and foreign place names based on Linguistic.Economics Journal of Hunan Financial and Economic College, 22(6): 95-96. (in Chinese)

[32]
Zhan Chijia, 2015. Relationship between place names in Maoming and terrain.Tropical Geography, 35(3): 437-442. (in Chinese)The terrain is one of the important geographic features which affects place names in the natural environment. According to the statistics of 88 town names in Maoming City and 1 513 village names in the 88 towns, combined with the source of the place names in gazetteer and other literature information, the author concludes that there is close relationship between the place names in Maoming and its terrain, and the place names in mountain regions are related the most to the terrain, followed by those in hilly areas, and then by those in plain areas. Terrain not only has an impact on the place names, but also reflects people's choice of their residential places, showing the toponymy culture in Maoming City. It is shown that the residents in mountain regions generally build their villages in lower areas of the valleys, and the residents in hilly regions often choose the hillsides or the valleys as their settlement sites. The place names in plains and terraces are normally related to the single hills there.

[33]
Zhang Jinmei, 2016. Viewing the influence of immigrations on the economy of Baotou through the name of Baotou.Yinshan Academic Journal, 29(3): 18-22. (in Chinese)

[34]
Zhang Xueying, Zhang Chunju, Lv Guonian, 2010. Design and analysis of a classification scheme of geographical named entities.Journal of Geo-Information Science, 12(2): 220-227. (in Chinese)With the increasing applications of natural language in geographical information science,resolution of geospatial information in natural language has become one of the hot issues.Geographical named entities are identifiers of geographical location information in natural language,which include a majority of popular geographical reference systems such as geographical names,addresses,postal codes,telephone numbers and other relative location descriptions.A complete classification scheme of geographical named entities may help implement resolution,storage,management,analysis and sharing of geographical information in natural language.Commonly-used classifications,i.e.classifications of geographical features,classifications of place names,and organization classifications are identified such disadvantages as over specificity of class items,without the consideration of the relationship of time and space,and the ability of representation of partial geographical entities in natural language.To overcome these problems,based on the annotation results of geographical named entities in Chinese documents,we design a classification scheme of geographical named entities(GNEC) with the consideration of their location,attributes,geographical features and temporal features.GNEC includes one main classification of geographical feature types and one subdivision classification of Chinese historical dynasties.Finally,the semantic compatibility between our proposed classification and GB/T 18521-2001,GB/T 13923-2006,Feature Type Classification for Chinese Historical Places of Harvard University and Feature Type Thesaurus of Alexandria Digital Library are analyzed qualitatively and quantitatively.It is noted that a unique geographical entity is usually described with diverse words in natural language,and sometimes it represents different physical location.Classification schemes aim to conceptualize geographical named entities.Undoubtedly,construction of ontologies based on classification schemes could solve this kind of problem(i.e.semantic ambiguity of geographical named entities) effectively.

DOI

Outlines

/