Research Articles

Geographical patterns and anti-poverty targeting post-2020 in China

  • GUO Yuanzhi , 1, 2, 3 ,
  • ZHOU Yang 1, 2 ,
  • CAO Zhi , 1, 2, *
Expand
  • 1. Institute of Geographic Sciences and Natural Resources Research, CAS, Beijing 100101, China
  • 2. Center for Assessment and Research on Targeted Poverty Alleviation, CAS, Beijing 100101, China
  • 3. University of Chinese Academy of Sciences, Beijing 100049, China
Corresponding author:Cao Zhi (1989-), PhD, E-mail:

Author: Guo Yuanzhi (1990-), PhD, specialized in urban-rural development and poverty geography. E-mail:

Received date: 2018-05-10

  Accepted date: 2018-08-01

  Online published: 2018-12-20

Supported by

National Key Research and Development Program of China, No.2017YFC0504701; National Natural Science Foundation of China, No.41871183, No.41471143

Copyright

Journal of Geographical Sciences, All Rights Reserved

Abstract

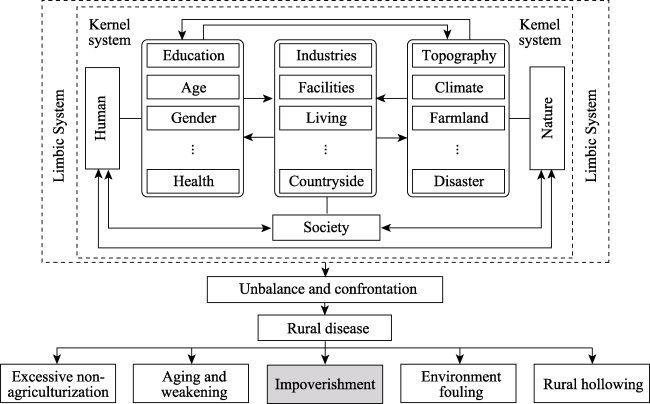
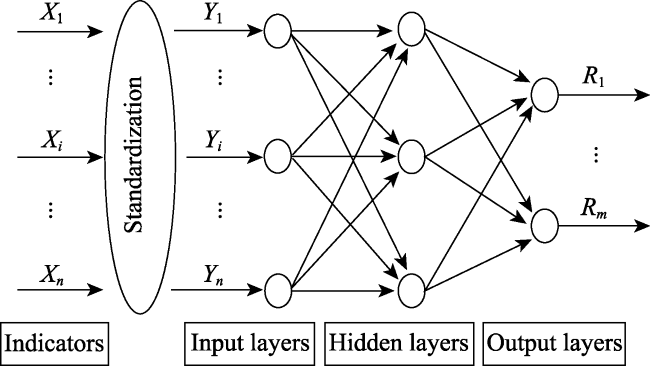
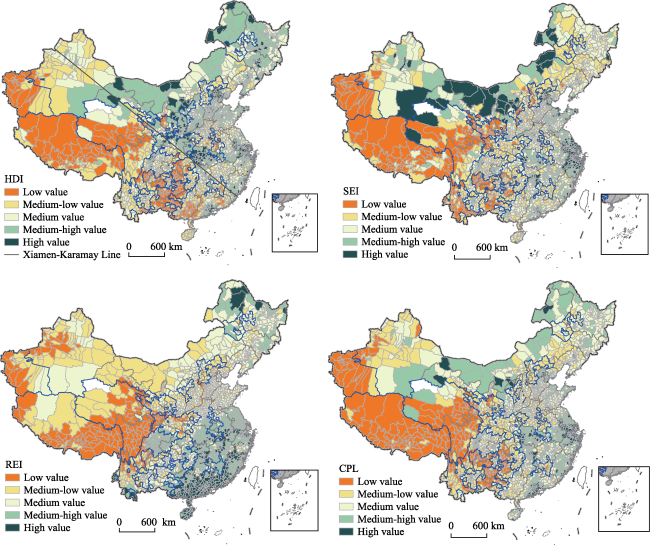
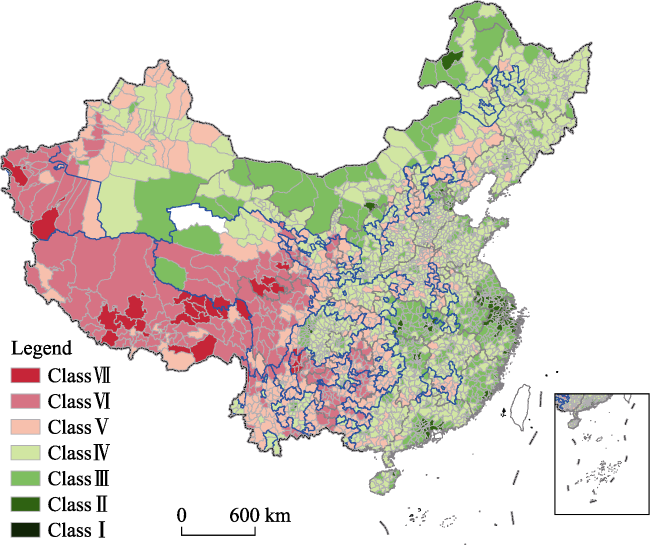
Poverty has been a focus of Chinese government for a long time. It is therefore of great significance to investigate both the mechanisms and spatial patterns of regional impoverishment in order to adequately target Chinese anti-poverty goals. Based on the human-environment relationship and multidimensional poverty theory, this study initially develops a three-dimensional model encompassing human, society, and environmental factors to investigate the mechanisms of rural impoverishment as well as to construct an indicator system to evaluate the comprehensive poverty level (CPL) in rural areas. A back propagation neural network model was then applied to measure CPL, and standard deviation classification was used to identify counties that still require national policy-support (CRNPSs) subsequent to 2020. The results of this study suggest that CPL values conform to a decreasing trend from the southeast coast towards the inland northwest of China. Data also show that 716 CRNPSs will be present after 2020, mainly distributed in high-arid areas of the Tibetan Plateau, the transitional zones of the three-gradient terrain, as well as karst areas of southwest China. Furthermore, CRNPSs can be divided into four types, that is, key aiding counties restricted by multidimensional factors, aiding counties restricted by human development ability, aiding counties restricted by both natural resource endowment and socioeconomic development level, and aiding counties restricted by both human development ability and socioeconomic development level. We therefore propose that China should develop and adopt scientific and targeted strategies to relieve the relative poverty that still exist subsequent to 2020.

Cite this article

GUO Yuanzhi , ZHOU Yang , CAO Zhi . Geographical patterns and anti-poverty targeting post-2020 in China[J]. Journal of Geographical Sciences, 2018 , 28(12) : 1810 -1824 . DOI: 10.1007/s11442-018-1580-z

1 Introduction

Poverty remains a key challenge globally (Barrett and Swallow, 2006). China has been in a state of general poverty for a long time as it is the largest developing country in the world. When the People’s Republic of China (PRC) was founded in 1949, the central government adopted relief-type poverty alleviation in order to meet the needs of the poor around the country (Yan, 2016; Liu et al., 2018). Subsequently, since the reform and opening-up of China, poverty alleviation nationally has passed through the stages of structural reform promoting poverty relief, development-oriented poverty relief, and addressing key problems in poverty relief, followed by both consolidation-oriented comprehensive poverty alleviation and targeted poverty alleviation (Liu et al., 2018; Zhou et al., 2018). As a result of these efforts, China has successfully explored a road of poverty alleviation and development with Chinese characteristics (Du, 2012). The rural poverty-stricken population in China decreased from 250 million in 1978 to 43.35 million in 2016 (NBS, 2017). China was therefore the first country in the world to successfully achieve the target of Millennium Development Goals of having extreme poverty in 20121(1 http://politics.people.com.cn/GB/18264499.html), which was ahead of schedule.
Poverty was originally considered to be an economic phenomenon, a condition under which individual or family incomes were unable to meet social conditions to achieve basic living standards (Hagenaars and van Praag, 1985; Liu et al., 2017). More recently, research scholars have formed a clearer understanding of the definition of poverty from a range of disciplines and have proposed the theories of basic demand (Carter and Barrett, 2006), social exclusion (Harding, 2003), multidimensional poverty (Foster et al., 1984; Alkire and Foster, 2011), and class and rights (Marx and Engels, 1959; Sen, 1976). Poverty therefore not only contains shortage of materials, but also involves missing out on opportunities as well as a lack of access to, or exclusion from, social services (Liu et al., 2017). At the same time, a range of approaches for assessing poverty have been developed, including the income- consumption standard (Tandia and Harvard, 1999) as well as the human development index (HDI) (UNDP, 1990) and multidimensional poverty indexes (MPI) (Alkire and Foster, 2011; Liu and Xu, 2016). Among them, MPI has been widely applied in discussions of national or regional poverty status levels (Ayala et al., 2011; Dehury and Mohanty, 2015).
Anti-poverty targeting is the basic premise of poverty reduction (Park et al., 2002; Wang et al., 2007). Since the founding of the PRC in 1949, anti-poverty targeting has developed from application at regional and county levels to be applied at village and household scales (Jiang et al., 1988; Li et al., 2015). These changes have greatly improved poverty situation in rural areas. However, the poverty-stricken population in rural China still remains large because of sheer numbers of people when compared to other countries. At the same time, the urban-rural dual structure that characterizes China means that the countryside has long been neglected, leading to low-level development (Liu and Li, 2017; Liu, 2018). In order to remedy this shortfall in rural development and promote urban-rural integration, the Chinese government has made it a clear goal to lift all poor people living in rural areas out of poverty and to remove all poverty-stricken counties above the current standard level by 2020. It is important to note, however, that only absolute poverty will be eliminated by 2020 within China; relative poverty will continue to exist for a long time. Thus, subsequent to 2020, rural China will enter a multidimensional poverty stage characterized by regional differences in health status, educational attainment, and access to public services (Ravallion and Chen, 2011). As this will hinder agricultural modernization in rural China, it is also of clear importance to further explore anti-poverty targeting within these areas subsequent to 2020.
As counties in China comprise the most important administrative units nationally for the direct implementation of policies and the management of rural residents, these units play critical roles in poverty alleviation and development. Applying human-environment relationship theory, the goals of this study are to explore the mechanisms of rural impoverishment and to construct an indicator system that can be applied to measure multidimensional poverty. A back propagation (BP) neural network model is then used to analyze spatial patterns in rural poverty across China, and the counties that still require national policy-support (CRNPSs) subsequent to 2020 are identified. Thus, by comparing post-2020 CRNPSs with present-day poverty-stricken counties, the results reveal units that still need serious attention. The outcomes of this analysis provide both a theoretical basis and a decision-making point-of-reference for the formulation and implementation of poverty alleviation and development policies for the period subsequent to 2020 in rural China.

2 Materials and methods

2.1 Theoretical framework

The man-land areal system comprises a complex arrangement with certain structures and functions that form through interactions between the two subsystems of human and environment over a particular time period and spatial area (Wu, 1991; Wang, 1997; Lu and Guo, 1998). Within such a giant open system, man is the main subject for activities while environment refers to the geographical setting formed by the interweaving of natural and human elements on the surface of the earth (Li et al., 2016). These associations mean that human, natural, and socioeconomic factors all make up the man-land areal system, while interactions between these three components and their internal parts promote system evolution (Figure 1). The living and development needs of humans are met through the use of natural resources (Zhou and Wang, 2016). Groups of humans with higher level abilities are able to obtain and utilize more resources. In contrast, natural resources provide the material basis and spatial carrier for socioeconomic development, the social economy in this context is therefore the result of interactions between human and environment in the process of systems evolution. Natural resources are then incorporated into the production system via an input-output relationship and provide the necessities required by humans. In other words, if a system is well structured and its internal components are arranged properly, then it will develop in a benign direction, but if conflicts are presented amongst internal structures and elements within a system, it will gradually decline (Wang et al., 1999).
Figure 1 Rural poverty mechanisms founded on the man-land areal system
Although China is rich in natural resources, these exhibit small per capita availability levels compared with other countries globally. At the same time, Chinese natural resources are also uneven in spatial distribution and poorly matched. For example, the cultivated land and water resources in north China account for 58% and 19% of the national total, respectively, while these resources in south China comprise 42% and 81% (Song et al., 2005; Zhou and Wang, 2016). Increased attention has also been paid to urban areas because of the national urban-rural dual structure and this has caused infrastructure construction in rural areas lagging behind cities. These disadvantages have therefore promoted the rural outflow of young and middle-aged labor, capital, and other development elements, all further aggravating the backward situation in the countryside. Indeed, if problems relating to food and clothing have not been solved, people will be unable to afford higher levels of demands, including education and culture, which results in decreased population quality. In these circumstances, poverty will enter a vicious cycle leading to an intergenerational transmission dilemma. Rural poverty is therefore an external manifestation of the imbalance between human and environment in rural areas and the result from inconsistencies in individual abilities, natural resource endowments, and socioeconomic development levels (Figure 1).

2.2 Indicator system

Accurate measurement is a key issue in poverty research. As studies in this field were initiated, poverty was always measured on the basis of per capita household income. This single indicator is, however, unable to synthetically reflect the vulnerabilities of the poor and so the concept of multidimensional poverty was developed which includes health, education, and living standards (Wang, 2017). As a result of cognitive deviations, however, these methods do not take geographical environment into consideration (Liu et al., 2017). Thus, based on previous theoretical analyses and existing related studies (Liu and Xu, 2016; Liu and Li, 2017; Liu et al., 2017), a multidimensional indicator system is developed here to measure comprehensive poverty level (CPL) in rural areas at county level. This approach encapsulates human development ability (HDA), socio-economic development (SED), and natural resources endowment (NRE) (Table 1).
Table 1 An indicator system for comprehensive poverty level in rural China
Dimension Indicator Description
HDA A1: Educational attainment Average educational attainment of people aged six and above
A2: Labor force Proportion of population aged 15-64 / Total population
A3: Minority nationality Proportion of the population of national minorities / Total population
SED B1: Per capita gross domestic product (GDP) GDP / Total population
B2: Per capita public budget revenue General public budget revenue / Total population
B3: Per capita disposable income of rural residents Income of rural households after initial distribution and redistribution
B4: Number of beds in health institutions Including individually-run clinics
B5: Child survival Number of live babies / Total live births
B6: Urbanization rate Urban population / Total population
B7: Per capita living space The average residential area owned by each person
B8: Road density Total road length / Total area
NRE C1: Altitude The average raster value in each county
C2: Slope Proportion of areas at more than 15 degrees of slope
C3: Degree of fragmentation Standard deviation (SD) of county raster value
C4: Annual rainfall Annual rainfall across counties in 2015
C5: Per capita arable land Including paddy fields and dryland
C6: Net primary productivity (NPP) Obtained using a GLO_PEM model (Prince and Goward, 1995)
C7: Farmland production potential (FPP) Calculated using a GAEZ model (Liu et al., 2015)
In general, HDA refers to the abilities of people utilizing natural resources to meet their needs and is therefore closely related to population quantity and quality, represented by education level and the size of work-aged population, respectively. However, due to the socioeconomic gap between ethnic minorities and the dominant Han nationality in China, the proportion of ethnic minority population versus total population was also included to measure HDA. The concept of SED is more comprehensive, however, and includes urbanization, economy, public service, transportation and housing conditions. As a result, per capita GDP, public budget revenue, and disposable income of rural residents were all chosen to represent economic development level, while the number of beds in health institutions and child survival were selected to characterize medical service supply. Similarly, per capita living space and road density were respectively used to reflect housing and transportation conditions. NRE reflects development foundations. Altitude, slope, and degree of fragmentation are all major topographic features. Annual rainfall, per capita arable land, NPP, and FPP all describe the basic conditions of agricultural production within a region which plays a significant role in poverty reduction and development (Christiaensen et al., 2011).

2.3 Indicator recognition

The incidence of poverty refers to the proportion of population living below a certain poverty standard relative to the total within a region. The relationship between the indicators selected in this study and the incidence of poverty was therefore investigated using a Pearson correlation coefficient analysis. Results show that minority nationality (A3), altitude (C1), slope (C2), and degree of fragmentation (C3) are all positively correlated to the incidence of poverty, which means that they all contribute to poverty (Table 2). The remainder of indicators are negatively correlated, which means that they contribute to anti-poverty. When significant levels of per capita public budget revenue (B2) and annual rainfall (C4) are both greater than 0.01, 0.069 and 0.150, respectively, all the other indicators considered here are less than 0.01. This result means that the indicators utilized in this study are all closely related to the incidence of poverty.
Table 2 Pearson correlation coefficient analysis of selected indicators and incidence of poverty
Indicator Correlation Sig. Indicator Correlation Sig. Indicator Correlation Sig.
A1 -0.194 0.000 B4 -0.277 0.000 C2 0.261 0.000
A2 -0.173 0.006 B5 -0.158 0.000 C3 0.230 0.000
A3 0.227 0.000 B6 -0.345 0.000 C4 -0.059 0.150
B1 -0.362 0.000 B7 -0.226 0.000 C5 -0.124 0.003
B2 -0.075 0.069 B8 -0.149 0.000 C6 -0.131 0.001
B3 -0.644 0.000 C1 0.272 0.000 C7 -0.359 0.000

Notes: The indexes used here refer to the indicators in Table 1, respectively.

2.4 Data sources

The data on Chinese county boundaries and road network utilized here were derived from the National Geomatics Center of China (http://www.ngcc.cn/). A total of 2731 county-level units were therefore obtained for this analysis, excluding those that lack rural population as well as Hong Kong, Macao, and Taiwan. A digital elevation model (DEM) at a resolution of 90 by 90 m was downloaded from WebGIS (http://www.webgis.com/index.html), and data about rainfall, land use, NPP, and FPP were obtained from the Resource and Environment Data Cloud Platform (http://www.resdc.cn). Data on social and economic development level were sourced from the Statistical Yearbook of Provinces (2016) and the Statistics Bulletin of National Economy and Social Development of Counties (2015). Data on urbanization, educational attainment, labor force, minority population, and per capita housing area were extracted from tables published in 2010 population census of the PRC by county. Missing values were replaced by substituting variable mean values for upper administrative units.

2.5 Methods

Rural poverty is the undesirable manifestation of interactions between a range of factors, including individual abilities, natural resources, and social economy. Due to the interactions within each dimension and its components, a complex nonlinear relationship is therefore presented between dependent and independent variables. Because of the unique advantages inherent to arbitrary complex pattern classification, excellent multidimensional function mapping, strong self-learning, and searches for optimal solutions at high-speeds, BP neural networks can be used to reveal rural poverty (Xu, 2002). This method is a multilayer feedforward network which is trained by an error back propagation algorithm, including input, hidden, and output layers (Figure 2). And the training procedure is comprised of both forward propagation and backward feedback (Du et al., 2014). In the former, information is developed from the input to the hidden layer and then to the output layer. As part of this process, if expected results are not attained, then error singles will return along their original paths and are minimized by modifying the weights of neurons in each layer. Theoretically, the three-layer BP neural network model used in this study is able to achieve arbitrary multidimensional continuous mapping (Kitahara et al., 1992).
Figure 2 BP neural network model topology diagram
In BP neural network model, the indicators that characterize HDA, SED, and NRE are respectively used as input neurons, while corresponding outputs are human development index (HDI), socioeconomic index (SEI), and resource endowment index (REI). On this basis, a model for CPL can be constructed as follows:
$CPL=HDI+SEI+REI$ (1)
This expression describes a relationship such that the smaller the CPL, the deeper the poverty, and vice versa. Natural breaks (Jenks) were then applied to divide the standardized values of each indicator into 20 categories. Comparing the results output from different functions enabled us to select TRAINLM, LEARNGDM, and TANSIG as training, adaption learning, and transfer functions, respectively. The numbers of nodes within hidden layers in the training model were three, six, and seven, respectively, which were obtained by cross validation. The training batch was set as 10,000, and system defaults were used for all other parameters.

3 Results and analysis

3.1 Spatial patterns of CPL

The data collected in this study were input into the BP neural network model based on previous analysis to measure HDI, SEI, and REI values. Formula (1) was then used to calculate CPL, and spatial patterns in these variables were obtained via an ArcGIS spatial analysis.
Figure 3 shows that there is an obvious regional difference in CPL, which decreases from the southeast coast towards the inland northwest of China. These values can be divided into three areas based on three terrain ladders, where the first ladder and its peripheries are dominated by low values, the second is dominated by medium-low values, and the third is dominated by medium-high and high values. Spatial patterns of REI and SEI are similar to that of CPL, while the HDI exhibits its own characteristics. Figure 3 also shows that HDI values are subdivided into two regions by the Xiamen-Karamay Line; values tend to be low to the southwest of this line and are dominated by low and medium-low figures while high and medium-high values characterize the northeast side.
Figure 3 Maps showing the spatial pattern of CPL values in rural China
The data presented in this study show that a total of 288 counties can be characterized by low CPL values. Most of these regions are on the Tibetan Plateau as well as three prefectures in southern Xinjiang (TPSX), Wumeng mountain area (WMMA), and rocky desertified areas of Yunnan-Guangxi-Guizhou (RDA). These regions, which are characterized by formidable natural conditions, are short of resources and tend to be gathering points for minorities. In contrast, 613 counties are characterized by medium-low CPL values. These regions are concentrated within central Xinjiang and contiguous poor areas with difficulties (CPADs), including Liupan mountain area (LPMA), border mountain area in western Yunnan (BMA), Wuling mountain area (WLMA), Qinba mountain area (QBMA), Dabie mountain area (DBMA), Luoxiao mountain area (LXMA), and Southern Greater Khingan Range area (SGKR). Although extremely restrictive conditions for development are seen within these areas, they nevertheless do possess some advantages in terms of water and land resources or transportation condition. Data show that 902 counties are characterized by medium CPL values; these areas are mainly located within traditional agricultural regions and include zones with obvious abundances of mineral and land resources, such as the Loess Plateau, central Inner Mongolia, and northern Xinjiang. Some of this kind of areas are also scattered in the mountainous and hilly areas of south China. A total of 645 counties are characterized by medium-high CPL values. Most of these are located in the western part of Inner Mongolia and Ordos Plateau where resources are abundant, as well as in the Chengdu Plain, the middle-to-lower reaches of the Yangtze River, and eastern coastal areas, where development foundations are good or counties are close to developed areas. The remainder of the counties assessed here, 283, are dominated by high CPL values. These characterize the developed areas in China, including the Yangtze River and Pearl River deltas, the Beijing-Tianjin and Changsha-Zhuzhou-Xiangtan urban agglomerations, and the Wuhan metropolitan area.
We also analyzed CPL values within CPADs2(2 Lenghu, Da Qaidam, Mangya and Shuanghu are not included, so the total number is 676, similarly hereinafter.) as part of this study (Table 3). Resultant statistics show that both CPLs and their sub-dimensions are all lower than the national average, especially HDIs and SEIs. The lowest CPL value recorded here is in Tibet, with TPSX and WMMA values being very close to this level, while the top three areas are DBMA, SGKR, and LLMA. We also show that SEI values for each area are lower than the national average; only HDIs for SGKR, LLMA and QBMA, and REIs for DBMA, RDA, LXMA, and WLMA are higher than the national average.
Table 3 CPLs in contiguous poor areas with difficulties
DBMA SGKR RDA BMA LPMA LXMA LLMA QBMA
HDI 8.96 11.8 3.52 7.78 9.95 8.24 13.02 11.68
REI 11.23 9.06 9.74 7.87 7.22 10.52 8.16 6.82
SEI 8.43 7.45 6.50 5.19 5.38 8.14 6.52 7.76
CPL 28.62 28.31 19.76 20.84 22.55 26.89 27.7 26.26
TAFP TPSX YTMA WMMA WLMA Tibet CPADs China
HDI 5.96 4.39 10.75 4.66 5.57 4.87 7.38 11.04
REI 4.00 5.76 7.76 6.66 9.72 3.78 7.39 9.56
SEI 6.85 3.83 6.83 5.04 7.84 5.18 6.48 10.07
CPL 16.81 13.98 25.33 16.36 23.13 13.83 21.24 30.68

Notes: DBMA, SGKR, RDA, BMA, LPMA, LXMA, LLMA, QBMA, TAFP, TPSX, YTMA, WMMA, and WLMA refers to Dabie mountain area, southern Greater Khingan Range mountain area, rocky desertified areas of Yunnan-Guangxi-Guizhou, border mountain area in western Yunnan, Liupan mountain area, Luoxiao mountain area, Lvliang mountain area, Qinba mountain area, Tibetan area in Qinghai-Sichuan-Yunnan-Gansu, three prefectures of southern Xinjiang, Yanshan-Taihang mountain area, Wumeng mountain area, and Wuling mountain area, respectively.

3.2 Anti-poverty targeting

Because of the continuity of rural poverty and limitations on resources for poverty alleviation, identifying national key counties for poverty alleviation and development (NKCs) is a key initial step (Park et al., 2002; Wang et al., 2007). As a result, the Chinese government firstly designated 331 NKCs in 1986, and increased this number to 592 in 1994. Subsequently, in spite of two revisions in 2001 and 2011, the total number of NKCs has remained unchanged at 592 (Figure 4). Targeting at these counties has allowed the Chinese government to actively promote anti-poverty policy innovations and infrastructural construction, greatly alleviating poverty in rural areas. Indeed, the aim of the PRC central government is to lift all rural residents living below the current poverty standard above this level and to remove caps from all counties designated as poverty-stricken. This process is, however, limited by both natural and social conditions, as some counties do not have long-term, stable development abilities. This means that a certain number of poor people will always remain with the improvements of poverty standard. It is therefore necessary to study anti-poverty targeting in rural China after 2020 because this will provide benchmarks for the formulation of subsequent anti-poverty policies.
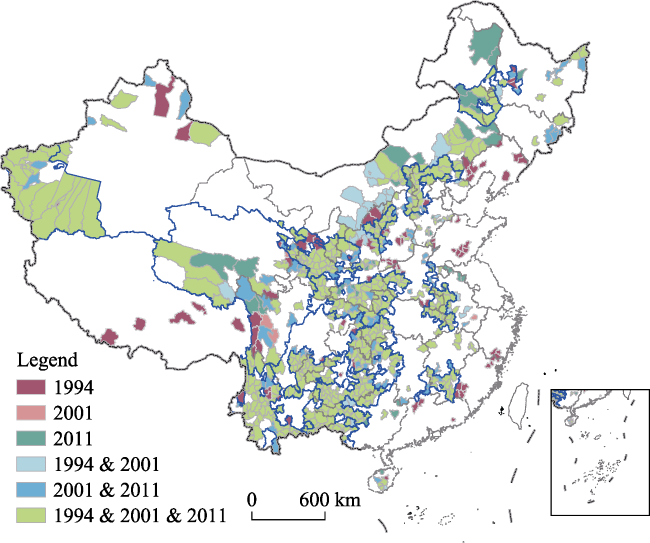
Figure 4 Map showing the evolution of national key counties for poverty alleviation and development in China
SD classification is often used to illustrate the differences between the attribute and average values of elements. In order to meet the need of this research, we applied an SD level to divide Chinese counties into seven categories (Figure 5). We therefore recognize counties with CPL values of VII, VI, and V as CRNPSs, and identify 31, 213, and 472 counties in these classes, respectively. Due to disadvantages in personal abilities, socioeconomic development, and natural endowments, development in these regions remains difficult and unsustainable, facing different degrees of pressure to return to poverty.
Figure 5 Map showing the classification of CPLs in rural China
We compare the 832 national poverty-stricken counties (Figure 6), which contain NKCs and all counties in contiguous poor areas with difficulties (CCPADs). It is clear that 149 counties are newly identified by this analysis, accounting for 20.81% of total number of CRNPSs. The bulks of these newly identified areas are mainly distributed in central Xinjiang, the peripheries of CPADs in southwest China, and the border area of Shandong-Henan-Anhui. It is also clear that 567 counties will still require policy-support after 2020. Of these, 387 counties are NKCs and 509 counties are CCPADs. Specifically, 329 counties belonging to both NKCs and CCPADs are distributed within CPADs with the exception of Tibet and SGKR. A total of 58 are just NKCs, scattered in the peripheries of CPADs and northern Xinjiang, while 180 are just CCPADs, distributed across the Tibetan Plateau. Besides, we show that 261 counties have managed to overcome poverty, which are mainly distributed in transitional zones of the three-gradient terrain, central China, and the east of northeast China. A total of 111 counties are classified as both NKCs and CCPADs, while 94 counties are just NKCs, and 56 counties are just CCPADs. Our data suggest that post-2020 CRNPSs are mainly distributed in high-arid areas of the Tibetan Plateau, transitional zones of the three-gradient terrain, and karst areas of southwest China, where ecosystems are extremely fragile and farmland is exceedingly limited. The bulks of these regions are deeply poverty-stricken at present and have been in poverty for a long time. Our CPL data suggest that only the SEI of CRNPSs is higher than that of CCPADs, and that all other indexes are lower than the case for NKCs and CCPADs and large gaps remain in both HDIs and CPLs (Table 4).
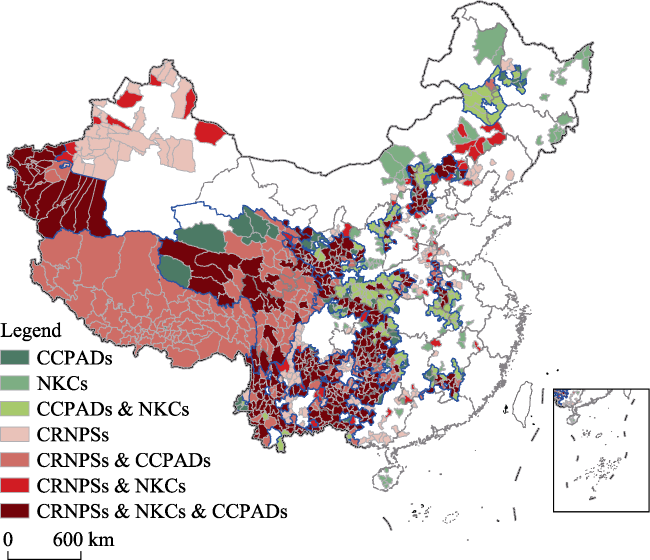
Figure 6 A spatial comparison of CRNPSs after 2020 and present-day poor counties
Table 4 Comparison of CPL values between CRNPSs after 2020 and present-day poor counties
HDI REI SEI CPL
CRNPSs 6.37 7.17 6.62 20.06
CCPADs 7.38 7.39 6.48 21.24
NKCs 8.22 8.27 6.69 23.18

3.3 CSNPSs classification after 2020

We applied Ward’s cluster analysis to divide the CRNPSs identified here into different categories. However, as we still have no clear understanding of the similarities between these groups, the number of clusters was set according to the hierarchical clustering diagram and four were eventually selected. The four types of aiding counties were then classified following the principle of leading factors consistency as key aiding counties restricted by multidimensional factors (Type I), aiding counties restricted by human development ability (Type II), aiding counties restricted by both natural resource endowments and socioeconomic development level (Type III), and aiding counties restricted by both human development abilities and socioeconomic development level (Type IV) (Figure 7). These categories respectively encompass 29.05%, 12.15%, 19.83%, and 38.97% of the total CRNPSs (Table 5).
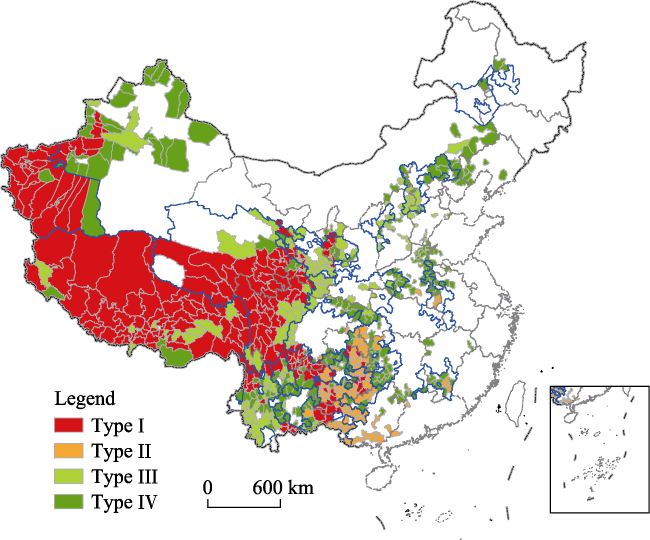
Figure 7 The spatial distribution of different CRNPSs types subsequent to 2020
Table 5 Classification and characteristics of CRNPSs
Type Number Main features
Type I 208 HDI, SEI, and REI values are 4.00, 5.00, and 4.41, respectively. They are deeply poverty-stricken counties distributed within high-arid and remote areas, including the Tibetan Plateau, TPSX, and WMMA. These areas are mainly ethnic enclaves and encapsulate numerous restrictive conditions and extremely fragile ecosystems.
Type II 87 HDI, SEI, and REI values are 2.48, 10.73, and 7.28, respectively. These counties are distributed in karst areas of southwest China. The development level of these areas is low due to low population quality caused by backward education and cultural differences of minorities.
Type III 142 HDI, SEI, and REI values are 10.16, 5.74, and 6.65, respectively. These countries are concentrated on the eastern side of the Tibetan Plateau as well as in the BMA and Taihang mountainous area. Educational attainment in these regions is relatively high, but they are nevertheless influenced by fragile ecosystems, complex terrain, and inadequate infrastructure. The development levels of these counties are therefore backward.
Type IV 279 HDI, SEI, and REI values are 7.42, 8.41, and 7.79, respectively. These counties are distributed in Xinjiang and southwest China, exhibiting shortcomings in personal abilities and social economy, but have better social and natural conditions, which create a foundation for development.

4 Discussion

The building of moderately prosperous society in all respects by 2020 means the ending of absolute poverty in rural China. However, relative poverty cannot be eliminated, but can only be alleviated (Duclos et al., 2006; Liu et al., 2017). Thus, combining with the implementation of rural vitalization strategy, new strategies are required to enhance the efficiency of anti-poverty resources and promote sustainable development in poverty-stricken areas (Liu et al., 2018; Zhou et al., 2018). Targeted measures should be taken due to locational differences and in light of local conditions in order to alleviate poverty and aid development (Park et al., 2002).
Poverty is one representation of the imbalance between humans and environment. As the alleviation of poverty is a complex system engineering in light of a holistic approach and the use of measures that are effective in local conditions (Liu et al., 2018; Zhou et al., 2018). Increasing attention should therefore be paid to education to improve comprehensive population quality in type I counties. Additional resources should also be used to enhance ecosystem resilience and reduce poverty due to disasters. If an area is not suitable for human inhabitation then poverty alleviation resettlement is a necessary choice. It is urgent to improve individual abilities in type II counties to release limitations due to the natural environment on human development. These counties should also be encouraged to develop specific industries to slow down population outflow and enhance self-development. Transfer of labor-intensive industries from eastern coastal areas will prove conducive if type III counties are to make full use of human capital advantages. At the same time, combined poverty alleviation and improvements in knowledge should be strengthened in type IV counties to develop the skills of poor people and block intergenerational transmission of poverty. Finally, more attention should be paid to urbanization within CSNPSs in order to realize the harmony between human and environment in rural areas through non-agriculturization process.
Comprehensive evaluation can be utilized to understand the poverty situation in rural areas (Reardon and Taylor, 1996). At the same time, it is important to note that the indicators used in this analysis remain dependent on data availability, especially those reflecting the supply of public service facilities in rural areas. Indeed, as poverty is essentially a dynamic process (Devicienti and Poggi, 2011) and the data used here are cross-sectional, we remain unable to comprehensively illustrate the extent of impoverishment in rural areas. More attention should therefore be afforded to infrastructure and research on the dynamic evolution of rural poverty should be strengthened.

5 Conclusions

As poverty is one manifestation of the imbalance between humans and environment, CPL can be estimated via human development ability, socioeconomic development and natural resource endowments. Disadvantages in natural resources remain the main causes of regional poverty across China, while socioeconomic development and improvements in agricultural production conditions all help to alleviate poverty. The analyses of a BP neural network and the spatial visualization presented in this study reveal that CPL decreases from the southeast coast towards the inland northwest of China and can be divided into three areas by the three-gradient terrain. Thus, high-arid regions of the Tibetan Plateau and its peripheries as well as arid areas in the west of south Xinjiang comprise low-value CPL areas. Eastern coastal areas, the Sichuan Basin, and the middle and lower reaches of the Yangtze River all comprise medium-high and high-value CPL areas, where natural conditions are good and socioeconomic development levels are also high. Our data reveal that 716 counties will still require direct assistance from national policies after 2020. These counties are all currently deeply poverty-stricken counties and are mainly distributed in high-arid areas of the Tibetan Plateau, transitional zones of the three-gradient terrain, and karst areas of southwest China. These counties can be further divided into four types which all required targeted antipoverty measures because of regional differences. The future poverty situation in rural China calls for innovative and targeted alleviation measures. To this end, it will be necessary to strengthen multidisciplinary integrative studies as these provide new opportunities and challenges for poverty geography.

The authors have declared that no competing interests exist.

[1]
Alkire S, Foster J, 2011. Counting and multidimensional poverty measurement.Journal of Public Economics, 95(7): 476-487.78 This paper proposes a new methodology for multidimensional poverty measurement, M ka = ( ρ k,M a). 78 Our identification step ρ k uses dual cutoffs to identify a) dimensional deprivations and b) poverty. 78 Our aggregate measure adjusts FGT measures to account for multidimensionality. 78 Our first measure M k0 = ( ρ k, M 0) can be used with ordinal or categorical data. 78 Our methodology M ka = ( ρ k, M a) satisfies many desirable properties including decomposability.

DOI

[2]
Ayala L, Jurado A, Pérez-Mayo J, 2011. Income poverty and multidimensional deprivation: lessons from cross-regional analysis.Review of Income & Wealth, 57(1): 40-60.Abstract The study of multidimensional deprivation has become one of the most relevant lines of research in the analysis of low-income households. The search for significant relationships between multidimensional deprivation and income poverty has been a central issue and most empirical studies have found a very weak link. This paper aims at examining the possibility of an aggregation bias in national-level studies, which could conceal disparities between regions. As regional differences and decentralization processes stand out in Spain as compared to other OECD countries, we focus the analysis on this country. Latent class models are used to define deprivation indices using the Spanish EU-SILC. The results seem to show that the absence of significant relationships between both phenomena still holds at a regional level. The decomposition methods used in the paper show that it might be due to some regional singularities in some determining factors of income and multidimensional poverty.

DOI

[3]
Barrett C B, Swallow B M, 2006. Fractal poverty traps.World Development, 34(1): 1-15.

DOI

[4]
Carter M R, Barrett C B, 2006 The economics of poverty traps and persistent poverty: An asset-based approach.The Journal of Development Studies, 42(2): 178-199.Longitudinal data on household living standards open the way to a deeper analysis of the nature and extent of poverty. While a number of studies have exploited this type of data to distinguish transitory from more chronic forms of income or expenditure poverty, this paper develops an asset-based approach to poverty analysis that makes it possible to distinguish deep-rooted, persistent structural poverty from poverty that passes naturally with time due to systemic growth processes. Drawing on the economic theory of poverty traps and bifurcated accumulation strategies, this paper briefly discusses some feasible estimation strategies for empirically identifying poverty traps and long-term, persistent structural poverty, as well as relevant extensions of the popular Foster-Greer-Thorbecke class of poverty measures. The paper closes with reflections on how asset-based poverty can be used to underwrite the design of persistent poverty reduction strategies.

DOI

[5]
Christiaensen L, Demery L, Kuhl J, 2011. The (evolving) role of agriculture in poverty reduction: An empirical perspective.Journal of Development Economics, 96(2): 239-254.The role of agriculture in development remains much debated. This paper takes an empirical perspective and focuses on poverty, as opposed to growth alone. The contribution of a sector to poverty reduction is shown to depend on its own growth performance, its indirect impact on growth in other sectors, the extent to which poor people participate in the sector, and the size of the sector in the overall economy. Bringing together these different effects using cross-country econometric evidence indicates that agriculture is significantly more effective in reducing poverty among the poorest of the poor (as reflected in the $1-day squared poverty gap). It is also up to 3.2 times better at reducing $1-day headcount poverty in low-income and resource rich countries (including those in Sub-Saharan Africa), at least when societies are not fundamentally unequal. However, when it comes to the better off poor (reflected in the $2-day measure), non-agriculture has the edge. These results are driven by the much larger participation of poorer households in growth from agriculture and the lower poverty reducing effect of non-agriculture in the presence of extractive industries.

DOI

[6]
Dehury B, Mohanty S K, 2015. Regional estimates of multidimensional poverty in India. Economics Discussion Papers, No.2015-34.

[7]
Devicienti F, Poggi A, 2011. Poverty and social exclusion: Two sides of the same coin or dynamically interrelated processes?Applied Economics, 43(25): 3549-3571.There is growing interest in the analysis and measurement of social exclusion, to complement the static and dynamic literature on income poverty. On theoretical grounds, social exclusion and income poverty are seen as different processes, but with closely interrelated dynamics. However, our empirical understanding of the way these two processes dynamically interact at the individual level is still very limited. To shed some light on the issue, we use a dynamic bivariate probit model, controlling for unobserved heterogeneity and Wooldridge (2005)-type initial conditions. Both the first- and second-order Markov dynamics are examined. We estimate the model using the Italian sample of the European Community Household Panel (ECHP), waves 1–8, and find a sizable extent of state dependence in both poverty and social exclusion. Moreover, there are dynamic cross-effects implying that poverty and social exclusion are mutually reinforcing. Social policies aimed at eradicating poverty and avoiding individuals’ social and economic marginalization should take these interaction effects explicitly into account.

DOI

[8]
Du Y, 2012. Taking the road of poverty alleviation and development with Chinese characteristics.China Venture Capital, (17): 5-6. (in Chinese)

[9]
Duclos J Y, Sahn D E, Younger S D, 2006. Robust multidimensional poverty comparisons.The Economic Journal, 116(514): 943-968.

DOI

[10]
Foster J, Greer J, Thorbecke E, 1984. A class of decomposable poverty measures.Econometrica, 52(3): 761-766.No abstract is available for this item.

DOI

[11]
Hagenaars A J M, van Praag B M S, 1985. A synthesis of poverty line definitions.Review of Income and Wealth, 31(2): 139-154.A fundamental point of discussion in poverty research is whether poverty is an absolute or a relative concept. If poverty is seen to be a situation of absolute deprivation, a poverty line will usually be defined to be independent of the general style of living in society. If poverty is considered to be a situation of relative deprivation, a poverty line will be defined in relation to the general style of living in society. The choice for one of these two approaches has important consequences for social policy, as absolute poverty may be reduced by economic growth, while relative poverty will only decrease when income inequality decreases. This paper suggests a poverty line definition that is not a priori meant to be either absolute or relative, but depends on the perception of poverty in society. If the poverty line is higher in countries with higher median income (as an indicator of "general style of living") the poverty line is said to be relative; if the poverty line does not vary with median income, it is said to be absolute. The poverty line definition suggested appears to be a generalization of almost all well-known poverty line definitions. Poverty lines thus defined are estimated for eight European countries on the basis of a 1979 survey. The resulting lines appear to have an elasticity with respect to median income of 0.51, and hence can be said to be halfway on the scale between absolute and relative.

DOI

[12]
Harding D J, 2003. Counterfactual models of neighborhood effects: The effect of neighborhood poverty on dropping out and teenage pregnancy.American Journal of Sociology, 109(3): 676-719.This article investigates the causal effects of neighborhood on high school dropping out and teenage pregnancy within a counterfactual framework. It shows that when two groups of children, identical at age 10 on observed factors, experience different neighborhoods during adolescence, those in high‐poverty neighborhoods are more likely to drop out of high school and have a teenage pregnancy than those in low‐poverty neighborhoods. Causal inferences from such associations have been plagued by the possibility of selection bias. Using a new method for sensitivity analysis, these effects are shown to be robust to selection bias. Unobserved factors would have to be unreasonably strong to account for the associations between neighborhood and the outcomes.

DOI

[13]
Jiang D H, Zhang Y G, Yang L et al.Yang L , 1988. Researches on the classification and development of poor area in China.Geographical Research, 7(3): 1-16. (in Chinese)Poverty and development are serious challenges the world faces now.Because of the natural condition, original base and the diffirent situation of the implementation of polices, disequilibrium situation of the country's economy still exists.Some areas have not yet lifted out of poverty.People's eating and wearing problem has not been completely solved.More than 40 million people are very poor in the country.According to the latesi information, there are all together 664 poor counties in China, excluding Tibet which still Jacks material, about 32 percent of the national total.Most of these areas are revolutionary base areas, areas of minorities, border regions, or mountain areas.The counties are classified in terms of the similarity of physical, social, and economic conditions; the similarity of critical obstacles physical, social, or economic to economic development, and development policies implemented. Six divisions and twenty-one subdivisions can be made as follows. ( 1 ) Loess Plateau Poor Areas; (2) Border Zone Between Eastern Plain and Western Mountain Areas. ( 3 ) Southwest Karst Mountain Areas; (4) Eastern Hill and Mountain Areas. ( 5 ) Qinghai-Tibet Mountain Areas; ( 6 ) Inner Mongolian-Xing Jiang Dry Areas.

DOI

[14]
Kitahara M, Achenbach J D, Guo Q C et al., 1992. Neural network for crack-depth determination from ultrasonic backscattering data. In: Thompson D O, Chimenti D E (eds). Review of Progress in Quantitative Nondestructive Evalution, Advances in Cryogenic Engineering, Springer, Boston, MA.A neural network approach has been developed to determine the depth of a surface breaking crack in a steel plate from ultrasonic backscattering data. The network is trained by the use of a feedforward three-layered network together with a back-propagation algorithm for error corrections[1,2]. The signal used for crack insonification is a mode converted 45 transverse wave. The plate containing a surface breaking crack is immersed in water and the crack is insonified from the opposite uncracked side of the plate. A numerical analysis of the backscattered field is carried out based on elastic wave theory, by the use of the boundary element method. The numerical data are calibrated by comparison with experimental data. The computed backscattered field provides synthetic data for the training of the network. The training data have been calculated for cracks with specified increments of the crack depth. The performance of the network has been tested on experimental data for cracks of different depths than used for network training.

DOI

[15]
Li X Y, Tang L X, Xu H Z, 2015. Poverty alleviation and governance in China: Analysis of targeting and transfer of anti-poverty resources.Jilin University Journal Social Sciences Edition, 55(4): 90-98. (in Chinese)China has changed the targeting unit of its poverty alleviation programs,from counties to villages and then to households,with an attempt to improve targeting accuracy. Nevertheless,China has not effectively resolved the problem that anti-poverty resources have been deviating from the targeting poor. The paper attributes two reasons to the governance dilemma of the anti-poverty targeting mechanism in China. On the one hand,the political management mechanism behind the targeting and transfer of anti-poverty resources can easily lead to disconnections between the use of the resources and the actual needs of the poor; on the other hand,changes in social stratification and local social governance structure have resulted in "elite capture". The paper concludes with a set of policy recommendations including changing poverty recognition mechanism,reforming the project system framework of poverty alleviation fund,and supporting the participation of non-governmental organizations.

[16]
Li X Y, Yang Y, Liu Y, 2017. Research progress in man-land relationship evolution and its resource-environment base in China.Journal of Geographical Sciences, 27(8): 899-924.Man-land relationship research,as the core of geographical research,runs through each development stage of Geography.Based on extensive literature review,this paper systematically generalizes the connotations,research development and contents of man-land relationship in China.(1) It explores the connotations and evolvement rules of man-land relationship in different social development stages in China,and finds that the core role of man-land relationship in geographical research has been strengthened continuously.Changing with times,its connotations have been considerably enriched by sustainable development and other notions,and so does its theoretical system.(2) It applies the bibliometric method to sketch out the basic research status of man-land relationship in China.Specifically,it quantitatively identifies the funding sources,major research teams and journals for publication.It finds that the funding sources show a diversification trend with national funding being the primary source of research grants.The most competitive research teams are mainly concentrated in the Institute of Geographic Sciences and Natural Resources Research,Chinese Academy of Sciences (CAS) and normal universities.Journals sponsored by The Geographical Society of China are most influential in publishing man-land relationship research.(3) As resources and environment are the fundamental carriers of man-land relationship,this study focuses further on the research on resource-environmental base of man-land relationship,and finds that the resource-environmental base research in China has gone through an evolution process from single factor perspective research to comprehensive multiple perspective research gradually.Research themes have also experienced similar changes from land,water,energy minerals or other single factor research to comprehensive factor research of resources and environment.Empirical study on national and regional development strategies is the feature of man-land relationship in China.More emphasis should be put on considering and following the changes in features of \"man\" and \"land\" and research on the impacts of new factors on man-land relationship in a developing and dynamic manner in the future.Particularly,we should pay more attention to research on the impacts of spatio-temporal changes in resource-environment absolute location on modes of man-land interaction,and to strengthening interdisciplinary research and systematic research on comprehensive techniques so as to advance the development of application of man-land relationship theories and practices.

DOI

[17]
Liu L, Xu X L, Chen X, 2015. Assessing the impact of urban expansion on potential crop yield in China during 1990-2010.Food Security, 7(1): 33-43.Rapid urbanization in China has raised great concerns regarding food security caused by conversion of limited cultivated land to urban use. In this study, the loss of potential crop yield due to urban expansion in China during 1990–2010 was calculated by the Global Agro-Ecological Zones (GAEZ) model. Over this period, potential yield decreased by approximately 34.90 million tons due to urban expansion, accounting for 6.5202% of China’s total actual production. The decrease was 13.07 and 21.83 million tons during the first and second decade, respectively. Key areas of lost potential yield were primarily in the Middle-lower Yangtze Plain and the Huang-Huai-Hai Plain. However, South China became a new key area of lost potential yield during the second decade. These findings provide useful information for the development of land use policy, protection of suitable arable land resources and urban development plans in China.

DOI

[18]
Liu X P, Li Y H, Wang Y Jet al., 2017. Geographical identification of spatial poverty at county scale.Acta Geographica Sinica, 72(3): 545-557. (in Chinese)

[19]
Liu Y H, Xu Y, 2016. A geographic identification of multidimensional poverty in rural China under the framework of sustainable livelihoods analysis.Applied Geography, 73: 62-76.61A method for identification of multidimensional poverty was established.61The method better reflects the impact of multiple factors on people's livelihood.61The method targets at counties both in economic and multidimensional poverty.61Natural basis is still the key determination for China's multidimensional poverty.61The method can improve the effectiveness and sustainability of poverty reduction.

DOI

[20]
Liu Y S, 2018. Research on the urban-rural integration and rural revitalization in the new era in China.Acta Geographica Sinica, 73(4): 637-650. (in Chinese)Cities and villages are components of a specific organism.Only the sustainable development of two parts can support the prosperous development as a whole.According to the theory of man-earth areal system,urban-rural integrated system and rural regional system are the theoretical bases for entirely recognizing and understanding urban-rural relationship.To handle the increasingly severe problems of "rural disease" in rapid urbanization,accelerating rural revitalization in an all-round way is not only a major strategic plan for promoting the urban-rural integration and rural sustainable development,but also a necessary requirement for solving the issues related to agriculture,rural areas,and rural people in the new era and securing a decisive victory in building a moderately prosperous society in all respects.This study explores the basic theories of urban-rural integration and rural revitalization and analyzes the main problems and causes of rural development in the new era,proposing problem-oriented scientific approaches and frontier research fields of urban-rural integration and rural revitalization in China.Results show that the objects of urban-rural integration and rural revitalization is a regional multi-body system,which mainly includes urban-rural integration,rural complex,village-town organism,and housing-industry symbiosis.Rural revitalization focuses on promoting the reconstruction of urban-rural integration system and constructs a multi-level goal system including urban-rural infrastructure networks,zones of rural development,fields of village-town space and poles of rural revitalization.Currently,the rural development is facing the five problems:high-speed non-agricultural transformation of agriculture production factors,over-fast aging and weakening of rural subjects,increasingly hollowing and abandoning of rural construction land,severe fouling of rural soil and water environment and deep pauperization of rural poverty-stricken areas.The countryside is an important basis for the socioeconomic development in China,and the strategies of urban-rural integration and rural revitalization are complementary.The rural revitalization focuses on establishing the institutional mechanism for integrated urban-rural development and constructs the comprehensive development system of rural regional system,which includes transformation,reconstruction and innovation in accordance with the requirements of thriving businesses,pleasant living environments,social etiquette and civility,effective governance,and prosperity.Geographical research on rural revitalization should focus on the complexity and dynamics of rural regional system and explore new schemes,models and scientific approaches for the construction of villages and towns,which are guided by radical cure of "rural disease",implement the strategy of rural revitalization polarization,construct the evaluation index system and planning system of rural revitalization,thus providing advanced theoretical references for realizing the revitalization of China's rural areas in the new era.

[21]
Liu Y S, Guo Y Z, Zhou Y, 2018. Poverty alleviation in rural China: policy changes, future challenges and policy implications.China Agricultural Economic Review, 10(2): 241-259.

DOI

[22]
Liu Y S, Li J T, 2017. Geographic detection and optimizing decision of the differentiation mechanism of rural poverty in China.Acta Geographica Sinica, 72(1): 161-173. (in Chinese)Rural poverty has long aroused attention from countries around the world, and eliminating poverty and achieving realize common prosperity is an important mission to build the well- off society in an all- round way. Scientifically revealing the regional differentiation mechanism of rural poverty has become an important issue of implementation of national poverty alleviation strategy. This paper, taking Fuping County of Hebei Province as a typical case, diagnoses the dominant factors of differentiation of rural poverty and reveals the dynamic mechanism of rural poverty differentiation by using the Geodetector model and multiple linear regressions, and puts forward the poverty alleviation policies and models for different poverty regions. The result shows that the dominant factors affecting rural poverty differentiation include slope, elevation, per capita arable land resources, distance to the main roads and distance to the center of county, and their power determinant value to poverty incidence differentiation are 0.14, 0.15, 0.15, and 0.17. These factors affect the occurrence of poverty from different aspects and their dynamic mechanism is also different. Among various factors, the slope and per capita arable land resources affect the structure and mode of agricultural production, while distance to the main roads and distance to the center of county have influence on the relationship between the interior and exterior of the region. There are significant differences in the four types identified of regional rural poverty, namely,environment constrained region mainly affected by slope(seven towns), resource oriented region mainly affected by per capita arable land(seven towns), area dominated by traffic location affected by distance to the main roads(three towns), and economic development leading area mainly affected by distance to the center of county(four towns). Then, Fuping County is divided into single core, dual core and multi- core area according to the number of core elements of the township. The county has shown a multi differentiation of rural poverty with a horizontal center of dual core area, and both sides have a single core and multi- core,which are affected by different dominant factors. Finally, this paper suggests that policy of targeted poverty alleviation should take science and technology as the foundation and form innovation of targeted poverty alleviation according to the core dominant factors of the differentiation mechanism of rural poverty. The county's poverty alleviation and development under different driving mechanisms need orderly promotion of poverty alleviation and integration of urban and rural development strategy with adjusting measures to local conditions, respecting for science, and stressing practical results.

DOI

[23]
Liu Y S, Li Y H, 2017. Revitalize the world’s countryside.Nature, 548(7667): 275-277.

DOI

[24]
Liu Y S, Liu J L, Zhou Y, 2017. Spatio-temporal patterns of rural poverty in China and targeted poverty alleviation strategies.Journal of Rural Studies, 52: 66-75.

DOI

[25]
Lu D D, Guo L X, 1998. Man-earth areal system: The core of geographical study: On the geographical thoughts and academic contributions of Academician Wu Chuanjun.Acta Geographica Sinica, 52(2): 97-105. (in Chinese)Academician Wu Chuanjun is an outstanding geographer of China, well known home and abroad. In his academic career of 60 odd years, Professor Wu has made significant contributions to the development of geographical study and national construction in China, and has been taking a leading role in the process of increasing international recognition of Chinese geography and enhancing international communication of China's geographical circle with foreign colleagues through his continuous hard efforts and serious commitment. This paper elaborates briefly the profound geographical thoughts of Professor Wu, and gives a concise introduction to his remarkable contributions to the overall development of geography in China, with focus on his significant achievements in the aspects of strengthening agriculture geography and land use study, defining the development orientations of China's economic geography, opening up new research fields such as territorial planning and sustainable development, initiating and organizing the renewal of China's human geography, organizing the internal cooperation in China's geographical society, promoting international academic communication, etc.. This paper also gives insight discussions on the theory of man-earth areal system, the essence of geographical thoughts of Professor Wu, mainly referring to the background, conceptions and its relationship with sustainable development of the theory. Professor Wu creatively put forward the theoretical term of an earth areal system , and stresses that man earth relationship remains as the core of geographical study in all developmental stages of the discipline. He proposed that the major contents of geographical study should include following issues: general theories about the formation, functional structure and development of man earth areal system; study on the relationship among sub systems of man earth areal system, such as interaction intensity analysis, potential assessment, effect evaluation and risk analysis; study on the basic rules concerning the material and energy flow and convey in man earth areal system and approaches of overall systematic control; analysis of areal capacity of population; study on the dynamic models; analysis of areal differences and areal categorizing; study on the improved monitoring and modeling of coordinated man earth relationship of various types of regions of different spatial levels and scopes, and so on. Professor Wu has long been paying great efforts in training qualified personnel for the long term prosperity of China's geographical career, with remarkable results concerning various fields and levels. With his most respected age of eighty approaching, Professor Wu is still on his important career mission with full energy and wisdom, providing strategic support to the development of China's geographical study towards the 21st century.

DOI

[26]
Marx K, Engels F, 1959. The Communist Manifesto.New York Labor News, 12: 151-174.

[27]
National Bureau of Statistical of China(NBS), 2017. China Statistical Yearbook 2017. Beijing: China Statistics Press.

[28]
Park A, Wang S, Wu G, 2002. Regional poverty targeting in China.Journal of Public Economics, 86(1): 123-153.We evaluate the effectiveness of regional targeting in China’s large-scale poverty alleviation program begun in 1986 by analyzing a panel data set of all counties in China for the period 1981–1995. Estimates of models of poor county designation and poverty fund allocation and newly defined targeting gap and targeting error measures show that political factors have affected targeting and that leakage has increased while coverage has improved. Only one of the three main programs is progressive. Growth model estimates find that poor county designation increased incomes per capita by 2.28% per year during 1985–1992 and 0.91% during 1992–1995. These results are relatively robust to redefining control groups using propensity-score matching methods.

DOI

[29]
Prince S D, Goward S J, 1995. Global primary production: A remote sensing approach.Journal of Biogeography, 22: 316-336.A new model of global primary production (GLObal Production Efficiency Model, GLO-PEM), based on the production efficiency concept, is decribed. GLO-PEM is the first attempt to model both global net and gross primary production using the production efficiency approach and is unique in that it uses satellite data to measure both absorption of photosynthetically active radiation (APAR) and also the environmrntal variables that affect the utilization of APAR in primary production. The use of satellite measurements gives global, repetitive, spatially contiguous and time specific observations of the actual vegetation. GLO-PEM is based on physiological principles, in particular the amount of carbon fixed per unit absorbed photosynthetically active radiation ( ) is modelled rather than fitted using field observations. GLO-PEM is illustrated with the first available year (1987) of the 8 8 km resolution NOAA/NASA AVHRR land Pathfinder data set. The global net primary production, respiration and values obtained indicate that even the rather simple AVHRR provides a wealth of information relevant to biospheric monitoring. The algorithms and results presented indicate that there are significant possibilities of inferring biological and environmental variables using multispectral techniques that need to be explored if the new generation of satellite remote sensing systems is to be exploited productively.

DOI

[30]
Ravallion M, Chen S, 2011. Weakly relative poverty.Review of Economics and Statistics, 93(4): 1251-1261.

DOI

[31]
Reardon T, Taylor J E, 1996. Agroclimatic shock, income inequality, and poverty: Evidence from Burkina Faso.World Development, 24(5): 901-914.No abstract is available for this item.

DOI

[32]
Sen A, 1976. Poverty: An ordinal approach to measurement.Econometrica, 44(2): 219-231.The primary aim of this paper is to propose a new measure of poverty, which should avoid some of the shortcomings of the measures currently in use. An axiomatic approach is used to derive the measure. The conception of welfare in the axiom set is ordinal. The information requirement for the new measure is quite limited, permitting practical use.

DOI

[33]
Song X D, Shi P J, Jin R, 2005. Analysis on the contradiction between supply and demand of water resources in China owing to uneven regional distribution.Arid Zone Research, 22(2): 162-166. (in Chinese)Per capita volume of available water resources in China, ranking 121st in the world, is very low although the total volume of water resources in China is as high as 2.812 4 10 12 m 3, ranking 6th in the world. Water resources in China are characterized by uneven regional and seasonal distribution. Regional distribution of water resources does not match that of cultivated land resources, population and GDP. There are more population, land resources and GDP but less water resources in north China. However, there are more population, water resources and GDP but less land resources in south China. The imbalance between water demand and supply has become more serious. Moreover, owing to continuous deterioration of aqueous environment, the problems of water resources have become more important and restrained the social and economic development in China. Based on the analysis of the ill-matched regional distribution of water and land resources, population and GDP, this paper discusses the uneven regional distribution of water resources in China, and some measures for sustainable utilization of water resources are put forward, they are to develop the water-saving social and economic systems based on the precedence of water-saving principle, implement the projects of multi-watershed water diversion so as to achieve the rational redistribution of water resources in China, enhance the unified planning and management of water resources, develop the circulated economy, implement the cleanly production, strengthen the conservation of water resources, etc.

[34]
Tandia D, Havard M, 1999. The evolution of thinking about poverty: Exploring the interactions.General Information, 55(6): 957-963.This paper considers the evolution ofthinking about poverty since Rowntree's classic study ofpoverty in England at the turn ofthe last century. It highlights the progressive broadening ofthe definition and measurement ofpoverty, from command over market-purchased goods (income) to other dimensions ofliving standards such as longevity, literacy and healthiness, and , most recently, to concerns with risk and vulnerability, and powerlessness and lack ofvoice. The paper argues that while there is a correlation between these different dimensions, this broadening changes significantly our thinking about strategies to reduce poverty. A broader definition expands the set ofpolicies that are relevant to the reduction of poverty. But the broadening also emphasizes that poverty reducing strategies must recognize the interactions among the policies--the impact of appropriately designed combinations will be greater than the sum ofthe individual parts.

DOI PMID

[35]
UNDP, 1990. Human Development Report 1990:Concept and Measurement of Human Development. New York and Oxford: Oxford University Press.

[36]
Wang A M, Fan S Y, Liu J Let al., 1999. Research on the theory of man-earth relationship.Human Geography, 27(2): 43-47. (in Chinese)Referred to various theories of manearth relationship studies, especially based on the theories of coordinated and sustainable development, the article analyses on the connotation and basic principle of manearth relationship. It also probes into the trend and law of the manearth relationship.

[37]
Wang L M, 1997. A theoretical and methodological study on the PRED-oriented medelling of man-land relationship system.Geographical Research, 16(2): 38-44. (in Chinese)anland relationship system is so complicated that the scientists usually forcus on the main problems of it. After discussing various kinds of modelling theories and methodologies of manland relationship system, this article advances regional PREDoriented modelling theory and methodology.Regional population problem, resource problem, environment problem and development problem ( PRED problems) which indicate the uncoordinated situation of regional manland relationship are being attached much importance to by people all over the world. Being interrelated and interacting to each other,all the facters causing regional PRED problems construct a complicated system which is called PRED system. Obviously, the study on PRED system is a practical way to reserch the mechanisms of the areal system of manland relaionship (ASMLR), which is the core of geographical studies.In this article, the author generlizes the main characteristics of the PREDoriented modelling, points out the importance of problemoriented modelling to resovle the main problems of regional sustainable development at present day. Then a method framework of PREDoriented modelling is put forward, which is divided into four steps: analysis of PRED system, establishment of the integrated model system, simulation and assessment. The integrated model system consists of three parts: 1. system dynamic simulating model as the core; 2. department models including population models, resource models, environment models and socieconomic development models; 3. auxiliary models containning econometrics models, mathematical statistics models, etc. Especially, the author emphasizes that metasymthetical engineering is an important methodology in PRED model system building. As the main contents of regional policies, the regional PRED coordinating paterns and PRED regionalizaion are suggested in this article.

DOI

[38]
Wang S G, Park A, Chaudhuri S et al.Chaudhuri S , 2007. Rural poverty-reduction and village-level poverty targeting of new period in China.Management World, (1): 56-64. (in Chinese)

[39]
Wang X L, 2017. The measurement of poverty:Theories and Methods. 2nd ed. Beijing: Social Sciences Academic Press. (in Chinese)

[40]
Wu C J, 1991. The study core of Geography: Man-earth areal system.Economic Geography, 11(3): 7-12. (in Chinese)

[41]
Xing C J, 2015. Analysis of “involution” to poverty alleviation project target deviation from perspective of village.Jianghan Academic, 34(5): 18-26. (in Chinese)since entering the new century,the poverty alleviation work taking village as the basic unit has been closely related to the rural governance. The poverty alleviation analysis of the micro level of the village has not only focused on the contents and mechanisms of poverty alleviation work,but also on the changes of rural society. In a village,the social relationship structure,power structure,social differentiation and information transmission,elite capture,the self nterest needs of village cadres and lack of collective action have become important reasons of poverty alleviation work target deviation. Poverty alleviation project target deviation will result in the poverty alleviation work involution,and poverty alleviation involution not only affects the public welfare and legitimacy of poverty alleviation projects,but also leads to the decrease of the poor's confidence to the government,the more likely will lead to the growing gap between the rich and the poor and reproduce of social inequality structure. To reverse this situation,we need not only to change the macro structure of the work,to eliminate the threshold and the system not conducive to the poor,but also to pay more attention to the interaction between the poor alleviation and the local community,to the characteristics of the local community,to the objective reality of the differentiation of farmers,and to the psychological vulnerability of the poor,and to the cultivation of collective action.

[42]
Xu J H, 2002. Mathematical Methods in Contemporary Geography. Beijing: China Higher Education Press. (in Chinese)

[43]
Yan K, 2016. Poverty Alleviation in China. Springer Berlin Heidelberg.

[44]
Zhou K, Wang C S, 2016. Spatial-temporal pattern of poverty-stricken areas and its differential policies for poverty alleviation in China.Bulletin of Chinese Academy of Sciences, 31(1): 101-111. (in Chinese)In 2020, shaking off poverty in rural areas under current standards and tackling the regional overall poverty is the most difficult challenge to build a well-off society in an all-round way in China.In this paper, based on the analysis of the status quo of poverty alleviation and development in China, and the characteristics analysis of resources and environment carrying capacity inpoverty-stricken areas, we attempt to identify and classify the regional types of state-level poverty counties, andput forward the differential policies for poverty alleviation and development in China's 13 th Five-Year Plan. The result shows the followings.Firstly, since the reform and opening policy in 1978, adhering to government-dominant and development-oriented guiding principles, China has conducted organized, well-planned, and large-scale poverty alleviation program which resulted in remarkable success.The number of people living in absolute povertyhas significantly decreased in China, poor rural population dropped from 94.22 million at the end of 2000 to 26.88 million in 2010, and poverty incidence rate decreased from 10.2% to 2.8%.Meanwhile, the relative poverty populationaccording to the estimation results of international standards remains more than 200 million people for a long time.Both the gap between rural per-capita net income and urban per-capita disposable income, andthe income gap among rural areas were widened as well. Secondly, the nationwide poverty has been basically eliminated in China, but the contiguous and concentrated distribution of poverty-stricken areas has not changed significantly. The classification result of types of resource and environmental constraints instate-level povertycounties shows that, there are 456 poverty countiesrestricted by the resources and environment in China, accounting for 77% of all state-level poverty counties(592), and the proportions of resource-constrained types, environmentconstrained types, and comprehensive-constrained types are 33%, 23%, and 21% respectively.In poverty-stricken areas, the overall resources and environment carrying capacityis proved to be relatively weak, the resource and environmental burden is chronically overloading,especially in ethnic areas and mountain areas ofcentral and western China, and the potential to enhance capacity is greatly limited, moreover,the recovery cost is tremendous once the local carrying capacity is overloaded.Consequently,toaimat providing the decision-making evidence for innovations inpoverty alleviationof systems and mechanismsand implementing accurate poverty alleviationin accordance with local conditions, we suggest thatpoverty-stricken areas should make differential policies to get rid of poverty based on regional carrying capacity and development potential.On the one hand,the policies for poverty alleviationin the poverty-stricken areas faced with vulnerable ecological environment, poor living environment, and frequent natural disasters,should focus on alleviating burdens onlocal overload population, at the same time, enhance the level of basic public services and ecological quality. On the other hand,n the poverty-stricken areaswith strong resources and environment carrying capacity, the policies for poverty alleviationshould deepen institutional innovation in the respects of policy improvement and measures intensificationso as to realize the transformation of resource advantages into industrial advantages.

[45]
Zhou Y, Guo Y Z, Liu Y S et al.Liu Y S , 2018. Targeted poverty alleviation and land policy innovation: Some practice and policy implications from China.Land Use Policy, 74: 53-65.Poverty is the common challenge faced by the international community. The human society has never ceased to struggle against poverty. China was once the developing country with the largest rural poor population in the world. Facing the decreasing effect of economic input to poverty reduction, land policy innovations could contribute to promoting poverty alleviation, particularly in China, where the defects in policy making is regarded as a major factor in rural poverty. This study explores the institutional innovation of China poverty alleviation since 2013 and further reveals the mechanism behind land policy innovation promoting the targeted poverty alleviation based on a case study of Songjiagou village of Fuping county, Hebei province. We found that the Chinese central government has innovated the mechanism for the TPA to lift the remaining rural poor out of poverty by 2020 as scheduled. Implementing the TPA could confront the labor, capital and land dilemmas. Combined land policy innovations and land engineering with the ex situ poverty alleviation relocation (ESPAR) can help to break the institutional barriers. We argue that land policy innovations and the ESPAR not only contributes to poverty reduction and improve living conditions of the poor, but also needs to guard against its potential risk. These findings can provide policymakers with a sound scientific basis for poverty reduction planning and decisions in China and other poor countries.

DOI

Outlines

/