
Journal of Geographical Sciences >
Hierarchy, clusters, and spatial differences in Chinese inter-city networks constructed by scientific collaborators
Author: Ma Haitao (1979-), PhD and Associate Professor, specialized in urban network and innovation. E-mail: maht@igsnrr.ac.cn
Received date: 2017-09-17
Accepted date: 2018-01-10
Online published: 2018-12-20
Supported by
National Natural Science Foundation of China, No.41571151, No.41590842, No.71433008
Copyright
The Chinese urban system is currently experiencing a fundamental shift, as it moves from a size-based hierarchy to a network-based system. Contemporary studies of city networks have tended to focus on economic interactions without paying sufficient attention to the issue of knowledge flow. Using data on co-authored papers obtained from China Academic Journal Network Publishing Database (CAJNPD) during 2014-2016, this study explores several features of the scientific collaboration network between Chinese mainland cities. The study concludes that: (1) the spatial organization of scientific cooperation amongst Chinese cities is shifting from a jurisdiction-based hierarchical system to a networked system; and (2) several highly intra-connected city regions were found to exist in the network of knowledge, and such regions had more average internal linkages (14.21) than external linkages (8.69), and higher average internal linkage degrees (14.43) than external linkage degrees (10.43); and (3) differences existed in terms of inter-region connectivity between the Western, Eastern, and Central China regional networks (the average INCD of the three regional networks were 109.65, 95.81, and 71.88). We suggest that China should engage in the development of regional and sub-regional scientific centers to achieve the goal of building an innovative country. Whilst findings reveal a high degree of concentration in those networks - a characteristic which reflects the hierarchical nature of China’s urban economic structure - the actual spatial distribution of city networks of knowledge flow was found to be different from that of city networks based on economic outputs or population.
MA Haitao , FANG Chuanglin , LIN Sainan , HUANG Xiaodong , XU Chengdong . Hierarchy, clusters, and spatial differences in Chinese inter-city networks constructed by scientific collaborators[J]. Journal of Geographical Sciences, 2018 , 28(12) : 1793 -1809 . DOI: 10.1007/s11442-018-1579-5
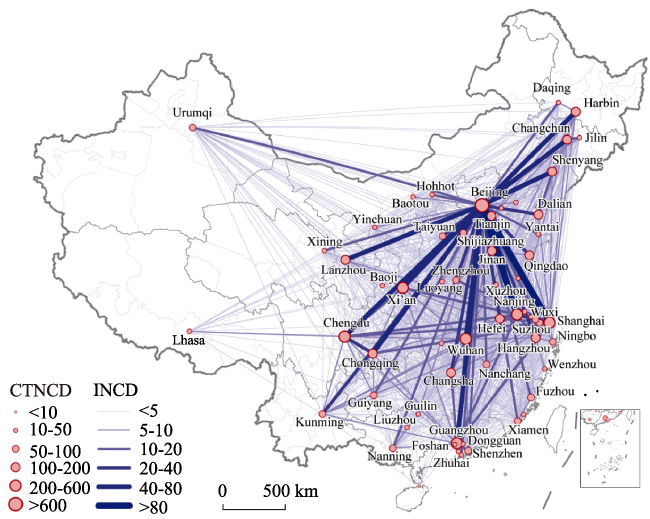
Figure 1 The Chinese city network constructed by scientific collaborators during 2014-2016 |
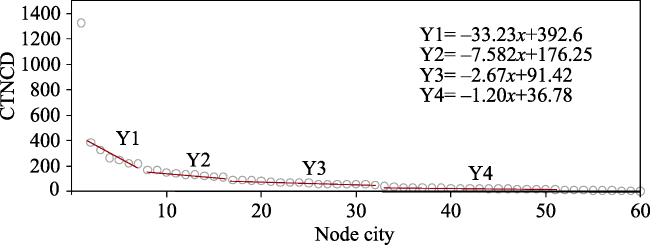
Figure 2 The hierarchical analysis of Chinese city network constructed by scientific collaborators during 2014-2016 |
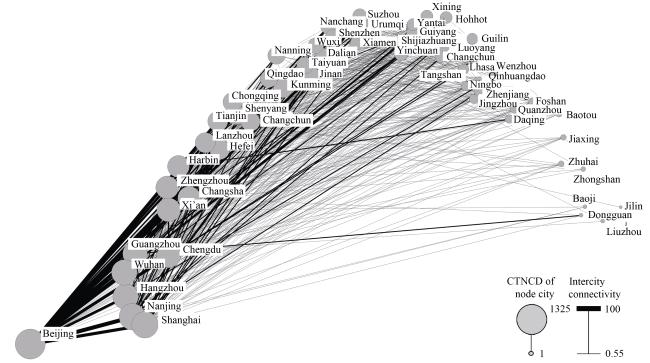
Figure 3 Group map by continuous attribute based on CTNCD and INCD of Chinese city network constructed by scientific collaborators during 2014-2016 |
Table 1 Urban hierarchy distribution of Chinese city network constructed by scientific collaborators during 2014-2016 |
| Urban Hierarchy | Distribution based on CTNCD | Distribution based on CTNCD and INCD | |
|---|---|---|---|
| CTNCD | List of cities | List of cities | |
| National network center | >600 | Beijing | Beijing |
| Sub-national network center | 200-600 | Shanghai, Nanjing, Guangzhou, Wuhan, Hangzhou, Chengdu | Shanghai, Nanjing, Hangzhou, Wuhan, Guangzhou, Chengdu |
| Regional network center | 100-200 | Xi'an, Chongqing, Tianjin, Changchun, Changsha, Lanzhou, Zhengzhou, Shenyang, Harbin | Xi'an, Zhengzhou, Changsha, Harbin, Lanzhou, Hefei, Tianjin, Chongqing, Shenyang, Changchun |
| Sub-regional network center | 50-100 | Jinan, Kunming, Nanchang, Hefei, Qingdao, Dalian, Suzhou, Urumqi, Nanning, Taiyuan, Shenzhen, Xiamen, Shijiazhuang, Wuxi, Hohhot, Guiyang | Qingdao, Kunming, Nanning, Taiyuan, Jinan, Wuxi, Dalian, Nanchang, Shenzhen, Xiamen, Suzhou, Urumqi |
| Local network center | 10-50 | Fuzhou, Yinchuan, Xuzhou, Yantai, Ningbo, Tangshan, Changzhou, Guilin, Xining, Daqing, Zhenjiang, Haikou, Luoyang, Qinhuangdao, Jingzhou, Lhasa, Lianyungang, Wenzhou, Baotou, Foshan, Dongguan | Shijiazhuang, Yinchuan, Guiyang, Yantai, Xining, Hohhot, Xuzhou, Fuzhou, Luoyang, Changzhou, Guilin, Haikou, Lhasa, Tangshan, Ningbo, Zhenjiang, Qinhuangdao, Jingzhou, Lianyungang, Wenzhou, Daqing, Quanzhou, Foshan, Baotou |
| Local network node | <10 | Zhongshan, Quanzhou, Jiaxing, Zhuhai, Baoji, Liuzhou, Jilin | Jiaxing, Zhuhai, Zhongshan, Baoji, Dongguan, Jilin, Liuzhou |
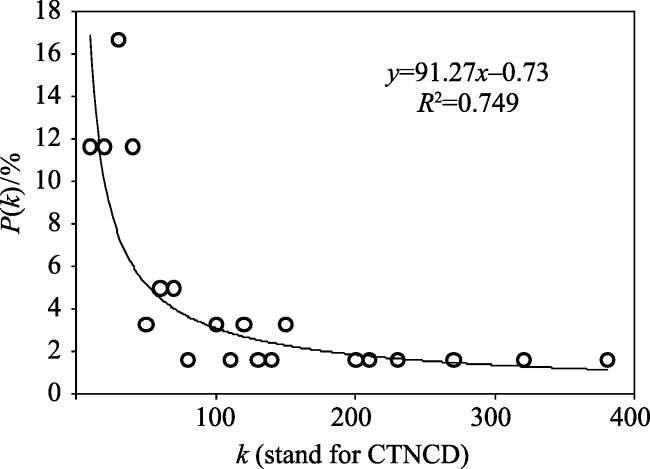
Figure 4 Probability distribution of nodal CTNCD of Chinese city network constructed by scientific collaborators during 2014-2016 |
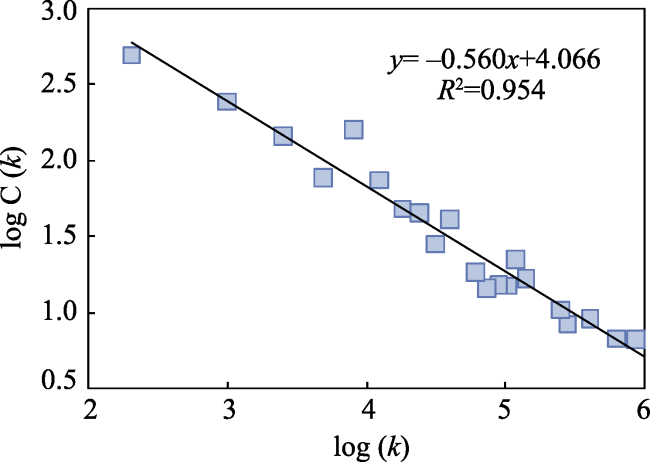
Figure 5 Distribution of clustering coefficient-CTNCD correlation of Chinese city network constructed by scientific collaborators during 2014-2016 |
Table 2 Node cities in seven regional cohesive subgroups of Chinese city network constructed by scientific collaborators during 2014-2016 |
| Region | Node cities |
|---|---|
| Beijing-Tianjin-Hebei region (BTHR) | Beijing, Tianjin, Shijiazhuang, Tangshan, Qinhuangdao |
| Yangzi River Delta region (YRDR) | Shanghai, Nanjing, Hangzhou, Suzhou, Wuxi, Ningbo, Changzhou, Zhenjiang |
| Pearl River Delta region (PRDR) | Guangzhou, Shenzhen, Foshan, Dongguan |
| Chinese Central Triangle region (CCTR) | Wuhan, Changsha, Nanchang, Jinzhou |
| Southwest region (SWR) | Chengdu, Chongqing, Kunming, Guiyang |
| Northeast region (NER) | Changchun, Shenyang, Harbin, Dalian, Daqing |
| Northwest region (NWR) | Xi’an, Lanzhou, Yinchuan, Xining |
Table 3 Comparative analysis of the seven regional cohesion subgroups of Chinese city network constructed by scientific collaborators during 2014-2016 |
| Region | Extra Region (ER) | Intra-Region (IR) | Gap (IR minus ER) | |||
|---|---|---|---|---|---|---|
| Line | INCD | Line | INCD | line | INCD | |
| Beijing-Tianjin-Hebei region | 14.69 | 28.91 | 15.60 | 25.32 | 0.91 | -3.59 |
| Yangzi River Delta region | 16.77 | 15.07 | 22.75 | 28.74 | 5.98 | 13.67 |
| Pearl River Delta region | 5.07 | 5.03 | 9.75 | 8.08 | 4.68 | 3.05 |
| Chinese Central Triangle region | 7.02 | 7.22 | 9.75 | 5.77 | 2.73 | -1.45 |
| Southwest region | 6.76 | 6.58 | 16.25 | 16.15 | 9.49 | 9.58 |
| Northeast region | 4.94 | 5.33 | 15.60 | 11.21 | 10.66 | 5.88 |
| Northwest region | 5.59 | 4.86 | 9.75 | 5.77 | 4.16 | 0.91 |
| Average Value | 8.69 | 10.43 | 14.21 | 14.43 | 5.52 | 4.00 |
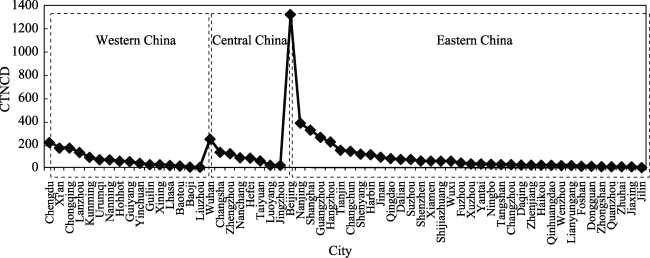
Figure 6 City hierarchy distribution ranks in Western, Central, and Eastern China of Chinese city network constructed by scientific collaborators during 2014-2016 |
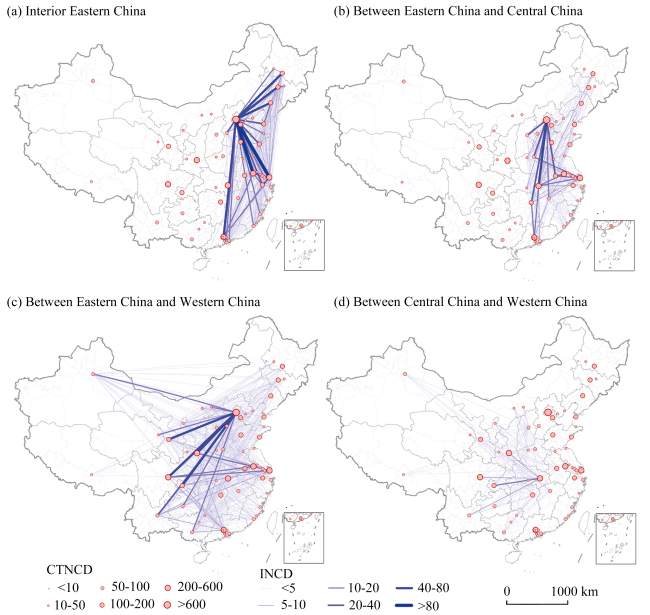
Figure 7 The network connections between Western, Central, and Eastern China of Chinese city network constructed by scientific collaborators during 2014-2016 |
The authors have declared that no competing interests exist.
| [1] |
|
| [2] |
|
| [3] |
|
| [4] |
|
| [5] |
|
| [6] |
|
| [7] |
|
| [8] |
|
| [9] |
|
| [10] |
|
| [11] |
|
| [12] |
|
| [13] |
|
| [14] |
|
| [15] |
|
| [16] |
|
| [17] |
|
| [18] |
|
| [19] |
|
| [20] |
|
| [21] |
|
| [22] |
|
| [23] |
|
| [24] |
|
| [25] |
|
| [26] |
|
| [27] |
|
| [28] |
|
| [29] |
|
| [30] |
|
| [31] |
|
| [32] |
|
| [33] |
|
| [34] |
|
| [35] |
|
| [36] |
|
| [37] |
|
| [38] |
|
| [39] |
|
| [40] |
|
| [41] |
|
| [42] |
|
| [43] |
|
| [44] |
|
| [45] |
|
| [46] |
|
| [47] |
|
| [48] |
|
| [49] |
|
| [50] |
|
| [51] |
|
| [52] |
|
| [53] |
|
| [54] |
|
| [55] |
|
| [56] |
|
| [57] |
|
| [58] |
|
| [59] |
|
/
| 〈 |
|
〉 |