Research Articles

Are Chinese resource-exhausted cities in remote locations?

  • SUN Wei , 1, 2 ,
  • MAO Lingxiao 1, 2
Expand
  • 1. Institute of Geographic Sciences and Natural Resources Research, CAS, Beijing 100101, China
  • 2. College of Resources and Environment, University of Chinese Academy of Sciences, Beijing 100049, China

Author: Sun Wei (1975-), PhD and Associate Professor, specialized in regional sustainable development and spatial planning. E-mail:

Received date: 2017-08-30

  Accepted date: 2017-10-28

  Online published: 2018-12-20

Supported by

National Natural Science Foundation of China, No.40701044

Copyright

Journal of Geographical Sciences, All Rights Reserved

Abstract

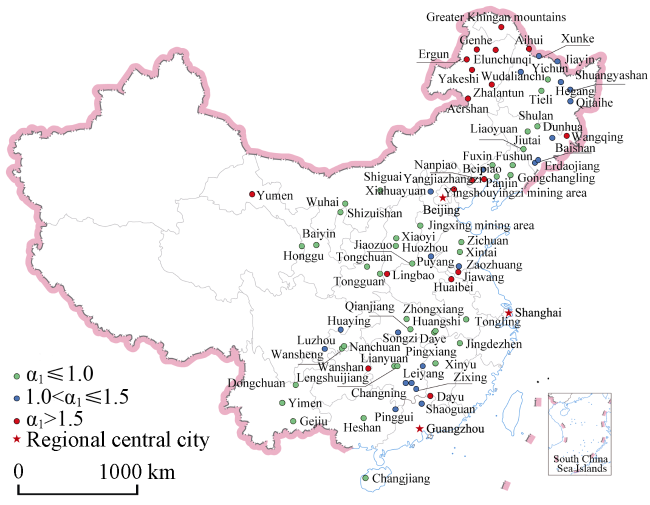
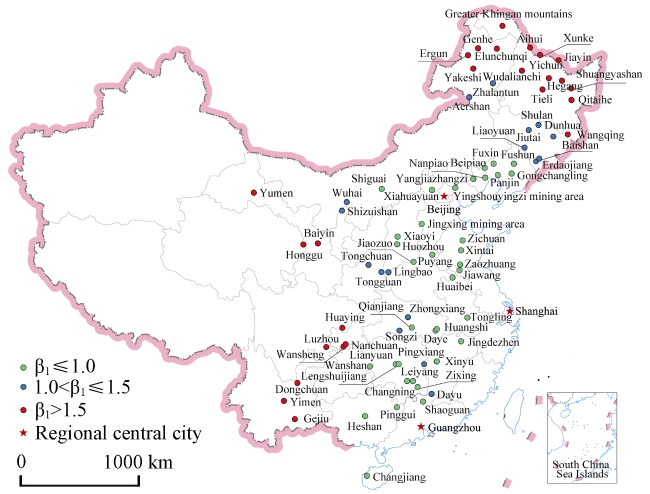
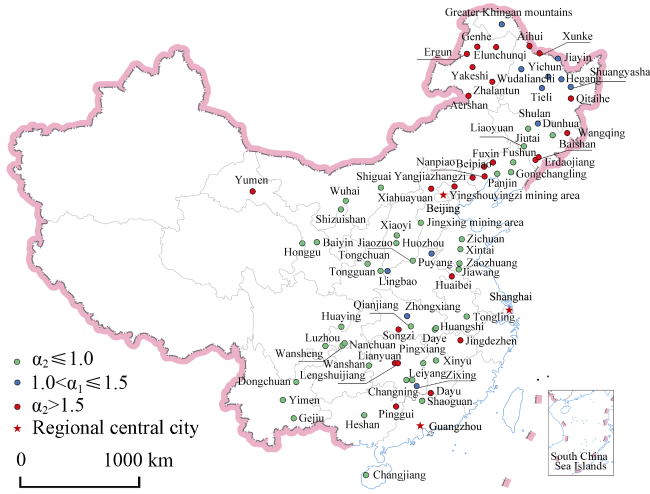
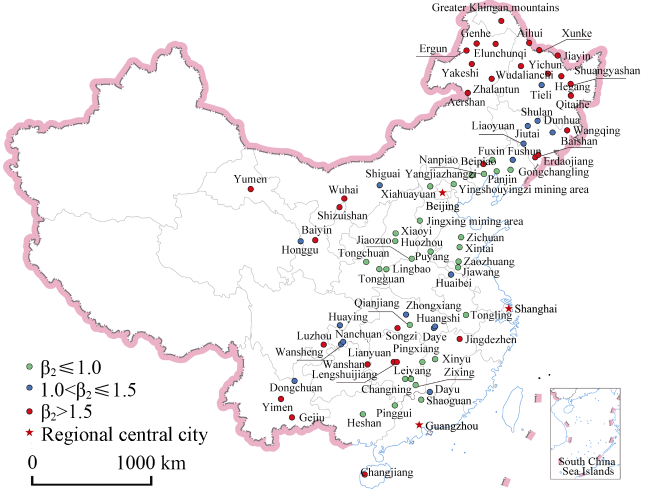
Numerous domestic scholars have argued that a remote location is the major factor preventing the transformation and sustainable development of resource-exhausted cities. Research to date, however, has not presented relevant evidence to support this hypothesis or explained how to identify the concept of ‘remoteness’. Resource-exhausted cities designated by the State Council of China were examined in this study alongside the provincial capital cities that contain such entities and three regional central cities that are closely connected to this phenomenon: Beijing, Shanghai, and Guangzhou. Spatial and temporal distances are used to calculate and evaluate the location remoteness degrees (LRDs) of resource-exhausted cities, in terms of both resource types and regions. The results indicate that resource-exhausted cities are indeed remote from the overall samples. Based on spatial distances, the LRDs are α1 = 1.36 (i.e., distance to provincial capital city) and β1 = 1.14 (i.e., distance to regional central city), but when based on temporal distances, α2 = 2.02 (i.e., distance to provincial capital city) and β2 = 1.44 (i.e., distance to regional central city). Clear differences are found in the LRDs between different regions and resource types, with those in western China and forest industrial cities the most obviously remote. Finally, the numbers of very remote resource-exhausted cities based on spatial and temporal distances (i.e., α > 1.5 ∩ β > 1.5) are 14 and 19, respectively, encompassing 17.9% and 24.4% of the total sampled. Similarly, 25 and 30 not remote resource-exhausted cities based on spatial and temporal distances (i.e., α ≤1.0 ∩ β ≤ 1.0) encompass 32.1% and 38.5% of the total, respectively. This study provided supporting information for the future development and policy making for resource-exhausted cities given different LRDs.

Cite this article

SUN Wei , MAO Lingxiao . Are Chinese resource-exhausted cities in remote locations?[J]. Journal of Geographical Sciences, 2018 , 28(12) : 1781 -1792 . DOI: 10.1007/s11442-018-1565-y

1 Introduction

Resource-based cities are those that have developed because of the exploitation of one or more resources, and generate both products and processing within a country. China, for example, boasts numerous resource-based cities, including Daqing, Karamay, Baiyin, Shizuishan, and Wuhai, distributed at locations that are heavily dependent on resource locations. However, determinants of resource distribution, such as strata, lithofacies, paleogeographic, and geologic conditions, are not entirely coupled with economic, social, and traffic-related factors that influence the positions of urban centers. Within academia, a consensus has been reached that such resource-based cities are generally located far away from economically central cities (Liu et al., 1996; Zhang, 1999; Zhou and Long, 2001; Li and Hu, 2003; Jiang et al., 2004; Long, 2004; Zhao et al., 2004; Zhu, 2004; Wan and Shen, 2005; Zhou, 2006). Zhu (2004) suggested, for example, that as resource-based cities are usually located in remote areas, they are consequently disadvantaged. In comparison, Liu et al. (1996) noted that such cities are most often located in inland or remote desert regions characterized by inaccessible environments, far away from removed from trunk transportation lines, developed areas of industry and commerce, and domestic and international markets. However, research to date has not been able to address whether, or not, such resource-based cities are remote, nor has a mechanism for quantifying the concept of ‘remoteness’ been proposed.
Location reflects the spatial relationship between one entity and others (Li, 2011). Thus, two common indicators are used to measure the relationship, spatial distance (i.e., the straight-line distance between two places in Euclidean space) and temporal distance (i.e., an estimate of the travel time to travel from one place to another using a particular mode of transportation). Both of these approaches are common in current research. Wu et al. (2009) applied a number of indicators in this context, including spatial and temporal distances, to analyze patterns of railway network accessibility within China. Guo and Wang (2009) estimated the transport accessibility of 18 cities within the Sichuan Basin Urban Agglomeration by applying minimum duration and integrated accessibility models, and building a minimum duration distance matrix to illustrate the spatial association strengths between different entities. In a similar and slightly earlier study, Zhang and Lu (2006) evaluated the current and future internal and external accessibilities of 16 prefectural-level cities based on temporal distance, by considering the land transportation network within the Yangtze River Delta. In foreign countries, scholars analyzed the impacts of high-speed railway and highway construction on the accessibility of different scale regions (Murayama, 1994; Gutierrez and Gonzalez et al., 1996; Gutierrez and Urbano, 1996).
A review of the current literature reveals that research tends to share a number of characteristics. First, researchers have tended to apply qualitative rather than quantitative analyses to this issue, which means that this question has so far not attracted enough attention. Second, a larger number of empirical studies have selected a single city as a study case, but research based on both resource types and regional perspectives has been largely ignored. Finally, most research in this area has focused on mining cities rather than on industrial cities within forests and the other types of resource-based cities. To remedy these shortcomings, a total of 78 resource-exhausted cities designated by the State Council of China, the capital cities of provinces containing the resource-exhausted cities, and three regional central cities, Beijing, Shanghai, and Guangzhou, which are closely connected with this phenomenon, are considered in this study. Spatial and temporal distances are utilized to quantitatively evaluate the location remoteness degrees (LRDs) for resource-exhausted cities from the perspectives of both resource types and regions. This approach is meaningful for correctly recognizing developmental conditions of resource-based cities, to determine the objective of their urban transformation and development direction, and to adjust policy-making strategies. It is noteworthy that the concept of location in a wider context refers to both geographical and economic positions; here, this concept is used to refer specifically to geographical position.

2 Data and methods

2.1 Research methods

Spatial distance (Dij) is defined as the straight-line trajectory between two nodes in kilometer (km) units; thus, the larger Dij values indicate more distanct between nodes. Dij is generally calculated using the longitude and latitude of two arbitrary points on the surface of the Earth. Because the fundamental formula applied in this approach is relatively complicated and available simplification cannot guarantee precision, an equidistant map projection was applied in this study by extrapolating points on a sphere onto a defined surface. Thus, the straight-line distance between two points was calculated in Euclidean space by adopting aspects of the equidistant conic method applicable to China. The central meridian applied was therefore 110ºE, while the standard parallels were 25ºN and 47ºN, respectively, and the 10ºN latitude was regarded as the origin. Subsequent to projecting onto Euclidean space, the formula for calculating spatial distance between A (xi, yi) and B (xj, yj) is as follows:
${{D}_{ij}}=\sqrt{{{\left( {{x}_{i}}-{{x}_{j}} \right)}^{2}}+{{\left( {{y}_{i}}-{{y}_{j}} \right)}^{2}}}$ (1)
Temporal distance (Tij) is defined as the minimum duration by train (h) from one city to the provincial capital city or regional central city; thus, larger distances imply longer times, with Tij denoting the minimum duration as follows:
${{T}_{ij}}=\min \left\{ T_{ij}^{0},\text{ }\left( {{T}_{ik}}+{{T}_{kj}} \right) \right\}$ (2)
where $T_{ij}^{0}$ denotes the minimum time duration required to travel between two points by train, Tik + Tkj is also the minimum time including a transfer, including a transfer, and Tik and Tkj denote the duration from points i and j to the transfer station k, respectively.
In accordance with previous research on traffic accessibility, economic relationships, population migration, economic divisions, and national demands for regional development strategies, ten provincial-unit areas (hereafter ‘provinces’) were utilized to define the direction of urban contacts (Zhou and Zhang, 2003; Shi et al., 2006; Yan, 2007; Meng et al., 2010). Those closely related to Beijing are Hebei, Shanxi, Inner Mongolia, Liaoning, Jilin, Heilongjiang, Shaanxi, Gansu, Shandong, and Henan, while six provinces are closely related to Shanghai, Anhui, Jiangxi, Jiangsu, Hubei, Sichuan, and Chongqing, and a further six provinces are closely related to Guangzhou, Hunan, Guangdong, Guangxi, Hainan, Guizhou, and Yunnan.
To determine if resource-exhausted cities are remote (the ‘LRDs’ concept), we initially determined reference objects. Three regional central cities, Beijing, Shanghai, and Guangzhou, and the capital cities of the provinces where resource-exhausted cities located were selected as reference objects, as they are closely related to resource-exhausted cities. Two additional parameters that denote the LRDs of resource-exhausted cities within a province or a region, respectively, α and β, are calculated as follows:
${{\alpha }_{\text{1}}}={{{D}_{i}}}/{\frac{1}{n}\sum\limits_{j=1}^{n}{{{D}_{j}}}}\;$ (3)
${{\alpha }_{\text{2}}}={{{T}_{i}}}/{\frac{1}{n}\sum\limits_{j=1}^{n}{{{T}_{j}}}}\;$ (4)
${{\beta }_{\text{1}}}={{{D}_{i}}}/{\frac{1}{m}\sum\limits_{j=1}^{m}{{{D}_{j}}}}\;$ (5)
${{\beta }_{\text{2}}}={{{T}_{i}}}/{\frac{1}{m}\sum\limits_{j=1}^{m}{{{T}_{j}}}}\;$ (6)
We used α1 to denote remoteness in terms of spatial distance to the provincial capital city in each case, while α2 denotes temporal distance remoteness. Similarly, β1 denotes the spatial distance remoteness to the regional central cities, while β2 is the temporal distance remoteness to regional central cities, and Di is the spatial distance between the ith resource-exhausted city and its capital city or regional center. Consequently, Ti is the distance in time between the ith resource-exhausted city and its capital city or regional center, Dj is spatial distance between the jth prefectural-level city in the province where the resource-exhausted city located and its capital city or regional center, and Tj is the distance in time between the jth prefectural level city in the same province and its capital city or regional center. n and m denote the numbers of prefectural-level cities in this analysis. Notably, when calculating the distance between prefectural-level and capital cities, n was set equal to 246, while different values were employed when calculating similar distances between prefectural-level cities and their corresponding regional centers; thus, the values of m for Beijing, Shanghai, and Guangdong were 130, 70, and 68, respectively. Values of n and m are not equal because 22 capital cities related to the resource-exhausted agglomerations considered in this study were not included when we calculated the distance between prefectural-level cities and their corresponding capitals.
We also assume for this analysis that values of α or β greater than 1.0 correspond to resource-exhausted cities in remote locations, while values less than, or equal to, 1.0 imply the opposite. We used 1.0 as the threshold value in this study because it is more intuitive and preferable to using quantile or natural breaks. In other words, when the distance (either spatial or temporal) between a resource-exhausted city and its capital or regional center is larger than that of all the prefectural-level cities in the same province and the average distance to both reference points, it is clear that the location is remote, and vice versa. Thus, using our calculations and conclusions from other workers, clearly values of α and β greater than 1.5 denote very remote locations. We also tried to balance the hypothesis being tested in this study via the intersection between temporal and spatial distances and conclude that our value selection is practical for China.

2.2 Data sources

To calculate spatial distances between cities it was first necessary to determine their relative positions with accuracy within a uniform spatial reference frame. We utilized basic 1:4,000,000 geographic map data, which are freely available to the public via the National Administration of Surveying, Mapping, and Geoinformation, and encompass many of the longitude and latitude ordinates of prefectural, municipal, and resource-exhausted cities. However, as these map data have not been updated for many years and administrative divisions within China have changed frequently, no geographic coordinates were available for this research for some districts, including Xiahuayuan, Erdaojiang, and Aihui. At the same time, some districts defined as special administrative divisions, i.e., Yingshouyingzi Mining District, Da Hinggan Forest District, and Pinggui Management District, were not included in the analyzed dataset, so a geographical coding technique was applied to manage missing data. We utilized the geographical coding service in Google Earth and assigned longitude and latitude coordinates based on names of resource-exhausted cities to complete the dataset prior to analysis.
To calculate temporal distances between cities we searched the national train schedule and online booking system that comprises 4,341 train lines as of September 2017. We used railways to measure the temporal distances between cities for several reasons. The Chinese national railway network is gradually becoming more and more mature and has significantly expanded over the last 100 years. Following the completion of the Yuehai (Guangdong-Hainan) and Qinghai-Tibet railways in the 21st century, for example, the spatial service scope of the national network is now much larger and incorporates improved structures. Railway transportation is also more suitable for long-distance transport of large amounts of low value goods, and this mode of transportation is fast, second only to air within the five basic methods. Finally, the effects of weather and other natural conditions on railway transportation are relatively small, so this mode of transportation also has an obvious advantage (Wu et al., 2009; Jin and Wang, 2004).
To ensure universal coverage, we utilized 78 resource-exhausted cities in this study; nine are located in the Da Hinggan and Xiao Hinggan mountains, i.e., Yakeshi City, Ergun City, Genhe City, Oroqen Banner, Zhalantun City, Xunke County, Aihui District, Jiayin County, and Tieli City, have been the subject of preferential policies.

3 Results

The geographic areas where resource-exhausted cities are located can be divided into four regions: eastern, northeastern, central, and western. Further, these cities can be divided into coal mining, iron and steel, petroleum, non-ferrous metal, industrial and mineral, and forest industrial centers. We calculated the LRDs of these different agglomerations.

3.1 Analysis of spatial distance

Results show that the average distance between resource-exhausted cities and an adjacent capital is 290.11 km, while the average distance between all prefectural-level cities in a province containing such a city and the capital is 214.10 km. As expected, resource-exhausted cities can be identified as remote (i.e., α1 = 1.36, greater than 1), while the average distance between resource-exhausted cities and their regional centers is 827.12 km. The average distance between all prefectural level cities in provinces that contain such resource-exhausted cities and their regional centers is 726.18 km. This result also shows that resource-exhausted cities tend to be remote, with β1 = 1.14 greater than 1. Thus, applying the method described above, we utilized values of 1.0 and 1.5 as thresholds to divide these resource-exhausted cities into three types: ‘not remote’, ‘remote’, and ‘very remote’ (Figures 1 and 2).
Figure 1 LRDs for each resource-exhausted city based on the spatial distance relative to the provincial capital city
Figure 2 LRDs for each resource-exhausted city based on the spatial distance relative to the regional central city
3.1.1 LRDs variations between different provinces
The results show that Inner Mongolia is characterized by the highest LRDs relative to the provincial capital city, while Chongqing has the lowest (Figure 3). The relative remoteness of Inner Mongolia is mainly because a large proportion of its industrial cities are dependent on forests and mainly located in the northeastern part of the province, far from the capital city. In contrast, Chongqing includes just two resource-exhausted cities, the districts of Wansheng and Nanchuan, which are both located close to the central city, at distances of just 77.12 km and 71.88 km, respectively. Similarly, relative to regional centers, Heilongjiang Province is characterized by the highest LRDs, while Hebei Province exhibits the lowest value in our sample. The high LRDs in the case of the former is mainly because most of its resource-exhausted cities are located in the central and northern parts of the province, far from the regional center, Beijing. At the same time, the three resource-exhausted cities in Hebei Province, Xiahuayuan District and the Yingshouyingzi and Jingxing mining districts, are all located close to Beijing. Distances in this case range between 111.43 km and 283.69 km, respectively.
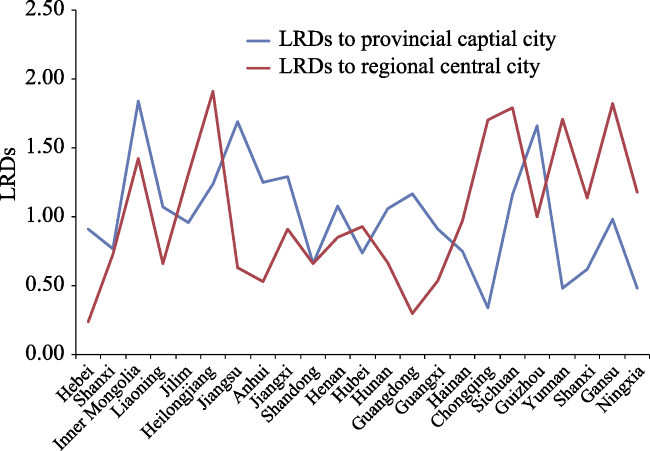
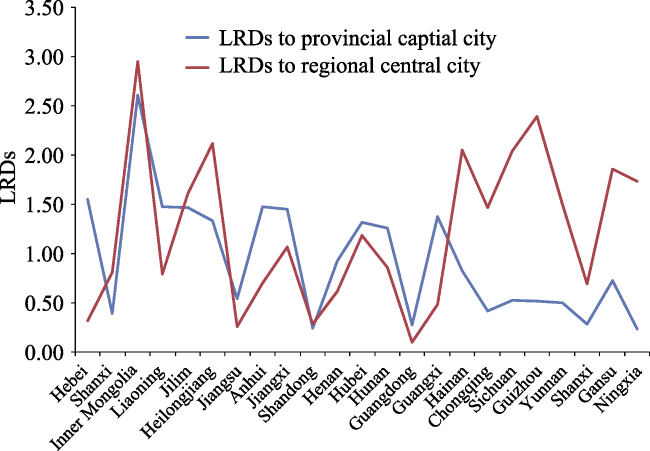
Figure 3 Contrasting LRDs values based on spatial distance between different provinces
3.1.2 LRDs variations between different resource types
Calculated results show that, relative to provincial capital cities, LRDs can be ordered from highest to lowest for forest industrial, petroleum, non-ferrous metal, industrial minerals, coal mining, and iron and steel type (Table 1). Similarly, relative to regional central cities, LRDs can be ordered from highest to lowest for forest industrial, petroleum, coal mining, non-ferrous metal, industrial and mineral, and iron and steel type. Data show that the LRDs for forest industrial cities are the most remote irrespective of distance to provincial capital or regional central city. This relationship results from the locations of forest industrial cities in the central and northern parts of Heilongjiang Province and in the eastern part of Inner Mongolia, both traditionally viewed as in the Da Hinggan and Xiao Hinggan mountains forested areas. The northernmost land boundary of China is also found in these regions, far away from removed from provincial capitals, i.e., Harbin, Changchun, and Hohhot, and the regional central city, Beijing. In contrast, iron and steel cities tend to be located closer to raw materials and consumption centers, which explains the less remote locations for these agglomerations. The iron and steel industries also require raw materials of different types, e.g., iron ore, coke, limestone, and fireproofing, in large volumes, as well as fuel and water, and they produce heavy ingots and steels. Therefore, to reduce transportation costs and enhance economic benefits, iron and steel industries tend to be located near raw materials or consumption centers. The Gongchangling Mining District and Daye City are located close to raw materials and their main consumption centers, the cities of Shenyang and Wuhan.
Table 1 LRDs for different types of resource-exhausted cities
Type of city Relative to provincial capital cities Relative to regional central cities
Average Minimum Maximum Standard deviation (SD) Average Minimum Maximum SD
Iron and steel 0.79 0.43 1.52 0.64 0.73 0.18 0.97 0.53
Industrial and
mineral
0.97 0.76 1.25 0.56 0.91 0.58 1.13 0.19
Coal mining 0.82 0.12 1.69 0.64 1.01 0.15 1.95 0.54
Forest industrial 1.63 0.55 2.64 0.69 1.68 1.19 2.10 0.51
Petroleum 1.22 0.85 2.35 0.57 1.29 0.67 2.20 0.52
Non-ferrous metal 1.04 0.26 2.28 0.53 0.95 0.30 1.80 0.53
3.1.3 LRDs variations between different regions
The data reveal clear differences in LRDs for resource-exhausted cities among the four regions in China (Table 2). Cities in the western and northeastern regions have relatively high LRDs, irrespective of their relationship to either provincial capitals or regional central cities. This difference is primarily because all Chinese forest industrial cities are located in these regions. In the west, for example, 35.3% of these industrial cities are located in Inner Mon-golia, while the remainder, 64.7%, are located in the northeast, in Heilongjiang and Jilin. LRDs for most of these cities are higher than 1.5. The data also highlight clear differences in LRDs in western and northeastern regions, indicating that the types of resource-exhausted cities in these areas are relatively simple and distinctly polarized. Coal mining, non-ferrous metals, and forest industrial cities dominate the western region, for example, while relative to provincial capitals, 88.9% of coal mining and 71.4% of non-ferrous metal cities exhibit low LRDs, not higher than 1.0. In contrast, LRDs for all forest industrial cities in our sample are greater than 1.5 (Table 2).
Table 2 Contrasting LRDs between the four regions in China
Type Relative to provincial capital cities Relative to regional central cities
Average Minimum Maximum SD Average Minimum Maximum SD
Northeastern 1.11 0.20 2.33 0.53 1.37 0.40 2.10 0.54
Eastern 0.93 0.12 1.69 0.64 0.51 0.15 0.97 0.54
Western 1.14 0.22 2.64 0.65 1.44 0.37 2.20 0.52
Central 1.02 0.43 2.28 0.62 0.80 0.42 1.16 0.51

3.2 Analysis of temporal distance

Data extracted from the national train schedule search engine and online booking system shows that the average time required to travel between resource-exhausted cities and their respective provincial capital cities is 5.70 hours, while this time for prefectural-level and provincial capital cities is 2.82 hours. Thus, as α2 = 2.02 (i.e., greater than 1), we conclude that Chinese resource-exhausted cities can be considered remote. In contrast, the average travel time between resource-exhausted cities and their corresponding regional centers is 11.34 hours, while this time for prefectural-level entities within provinces that contain resource-exhausted cities to their regional centers is 7.87 hours. Thus, as β2 = 1.44 (i.e., greater than 1), we again conclude that these cities can be considered remote, and utilized this approach to divide resource-exhausted Chinese cities into ‘not remote’, ‘remote’, and ‘very remote’ classes (Figures 4 and 5) using values of 1.0 and 1.5 as thresholds.
Figure 4 LRDs based on temporal distance relative to provincial capitals
Figure 5 LRDs based on temporal distance relative to regional centers
3.2.1 LRDs variations between different provinces
The results show that cities within Inner Mongolia exhibit the largest LRDs relative to their corresponding provincial capital cities, while those within Ningxia have the lowest LRDs (Figure 6). The large LRDs within Inner Mongolia are due to the locations of these agglomerations mostly in the northeastern region of this province, and there is no direct railway connection to the provincial capital. Trains must first pass Qiqihar, Ulanhot, Baotou, Manzhouli, and other cities. In contrast, the low LRDs in Ningxia is because of the presence of just one resource-exhausted city, Shizuishan, located in close proximity (62.46 km) to the downtown area of the provincial capital, Yinchuan. Relative to regional central cities, the highest LRDs are observed in Inner Mongolia, while the lowest LRDs are found in Guangdong Province. Inner Mongolia exhibits the highest LRDs because it is necessary to travel through other agglomerations, such as Shenyang, Baotou, and Hailar, when travelling away from the forest industrial cities in this region. Guangdong, in contrast, contains just a resource-exhausted city, Shaoguan, and a high-speed railway facilitates travel. The travel time between the two cities is now just 0.65 hours, a significant reduction in temporal distance.
Figure 6 Contrasting LRDs based on temporal distance between different provinces
3.2.2 LRDs variations between different resource types
The data show that LRDs for resource-exhausted cities relative to their corresponding provincial capitals can be placed in sequence from highest to lowest for industrial and mineral, forest industrial, iron and steel, non-ferrous metal, coal mining, and petroleum cities (Table 3). Similarly, relative to regional centers, LRDs can be placed in the same sequence order: forest industrial, industrial and mineral, petroleum, coal mining, non-ferrous metal, and iron and steel cities. Results show that forest industrial cities tend to be the most remote because they are located far from their provincial capital and regional central cities. The infrastructure serving these locations, such as railways, also tend to be underdeveloped and so travel via other intermediate cities is required and increases the travel time. Non-ferrous metal cities, in contrast, tend to be characterized by low LRDs for two reasons. First, higher abundances of lower quality ores are known across China, while richer deposits tend to be rarer, raising complicated development, utilization, and extraction issues. Non-ferrous metal cities need to be close to regional centers that possess strong technical attributes, have intensive human resources, and a relatively strong processing and manufacturing capacity. Second, significant emphasis has been placed on developing non-ferrous metals since the founding of new China; therefore, railway construction has led to clear improvements in the accessibility of these cities.
Table 3 Contrasting LRDs between different resource-exhausted cities in China
City Relative to provincial capital cities Relative to regional central cities
Average Minimum Maximum SD Average Minimum Maximum SD
Iron and steel 0.98 0.32 2.41 1.06 0.95 0.38 2.05 0.95
Industrial and
mineral
2.49 1.44 2.56 1.11 1.58 1.16 1.97 0.51
Coal mining 0.89 0.11 3.76 1.04 1.05 0.22 2.31 0.96
Forest industrial 2.14 0.44 4.06 1.12 2.46 1.02 4.67 1.01
Petroleum 0.86 0.38 1.50 0.87 1.36 0.39 2.59 0.75
Non-ferrous metal 0.95 0.22 2.37 0.77 1.05 0.10 2.39 0.75
3.2.3 LRDs variations between different regions
LRDs for resource-exhausted cities vary significantly between the four regions in China (Table 4). Data show that, relative to provincial capitals and regional centers, LRDs are high in both western and northeastern regions, although differences are apparent. This result is consistent with our spatial distance calculations.
Table 4 Contrasting LRDs for different resource-exhausted cities between the four regions in China
Region Relative to provincial capital cities Relative to regional central cities
Average Minimum Maximum SD Average Minimum Maximum SD
Northeastern 1.42 0.17 3.76 0.79 1.58 0.36 2.54 0.69
Eastern 0.78 0.11 2.41 1.06 0.47 0.10 2.05 0.96
Western 1.27 0.19 4.06 1.05 1.96 0.23 4.67 0.94
Central 1.20 0.32 3.47 1.02 0.92 0.24 1.97 0.95

3.3 Comprehensive evaluation

The comprehensive spatial and temporal distance results presented in this study reveal that, relative to corresponding provincial capitals, very remote resource-exhausted cities (i.e., α1 > 1.5 ∩ α2 > 1.5) include Yingshouyingzi Mining District, Arxan City, and Yakeshi City, with 11 other examples that together comprise 17.9% of the national total (Table 5). In contrast, there are 30 examples of resource-exhausted cities that are not remote (i.e., α1 ≤ 1.0 ∩ α2 ≤ 1.0), including Jingxing Mining District, Xiaoyi City, and Huozhou City. This class makes up 38.5% of the national total (Table 5).
Table 5 Comprehensive evaluation classification of resource-exhausted cities based on LRDs
Grade Cities
Relative to provincial capital cities Relative to regional central cities
Not remote Jingxing Mining District, Xiaoyi City, Huozhou City, Wuhai City, Shiguai District, Panjin City, Fushun City, Gongchangling District, Liaoyuan City, Jiutai City, Tongchuan City, Tongguan County, Baiyin City, Honggu District, Shizuishan City, Xintai City, Zichuan District, Jiaozuo City, Tongling City, Xinyu City, Daye City, Huangshi City, Qianjiang City, Wansheng District, Nanchuan District, Heshan City, Changjiang County, Gejiu City, Dongchuan District, and Yimen County Jingxing Mining Area, Xiahuayuan District, Yingshouyingzi Mining District, Xiaoyi City, Huozhou City, Fuxin City, Panjin City, Gongchangling District, Yangjiazhangzi Mining District, Nanpiao District, Zaozhuang City, Xintai City, Zichuan District, Jiaozuo City, Puyang City, Tongling City, Xinyu City, Jiawang City, Qianjiang City, Changning City, Leiyang City, Zixing City, Shaoguan City, Heshan City, and Pinggui Management District
Very remote Yingshouyingzi Mining District, Aershan City, Yakeshi City, Ergun City, Genhe City, Oroqen City, Zhalantun City, Yangjiazhangzi Mining District, Nanpiao District, Wangqing County, Aihui District, Yumen City, Huaibei City, and Dayu County Yakeshi City, Ergun City, Oreqen City, Genhe City, Wangqing County, Hegang City, Shuangyashan City, Yichun City, Jiayin County, Qitaihe City, Wudalianchi City, Xunke County, Aihui District, Da Hinggan Forest District, Baiyin City, Yumen City, Luzhou City, Yimen County, and Gejiu City
Relative to corresponding regional centers, 19 resource-exhausted cities, including Yakeshi City, Ergun City, and Orequn City, can be classified as very remote (i.e., β1 > 1.5 ∩ β2 > 1.5), comprising 24.4% of the national total. In contrast, resource-exhausted cities that are not remote (i.e., β1 ≤1.0 ∩ β2 ≤ 1.0) include Jingxing Mining District, Xiahuayuan District, and Yingshouyingzi Mining District with 22 others, which comprise 32.1% of the national total.

4 Conclusions

(1) In general, Chinese resource-exhausted cities tend to be remotely located based on both spatial and temporal distances. The spatial distance analysis shows that LRDs for resource-exhausted cities compared to corresponding provincial capitals and regional centers can be quantified with values of 1.36 and 1.14, respectively. In comparison, temporal analysis reveals corresponding values of 2.02 and 1.44, respectively.
(2) This study highlights clear differences between different resource types and regions. Forest industrial cities tend to have the highest LRDs because they are primarily distributed in the central and northern regions of Heilongjiang Province and northeastern Inner Mongolia, far from provincial capitals and regional centers. The railway infrastructure in these regions is also relatively poor, so temporal distances between cities tend to be high from point-to-point. The data also reveal clear differences between different regions. LRDs are high, for example, in the western and northeastern parts of China, which results from the resource-exhausted cities in these regions tending to be relatively simple and distinctly polarized.
(3) Analysis of both spatial and temporal distance data reveals that the number of very remote resource-exhausted cities (i.e., α > 1.5 ∩ β > 1.5) across China is between 14 and 19, encompassing between 17.9% and 24.4% of the national total. In contrast, the number of resource-exhausted cities that are not remote (i.e., α ≤1.0 ∩ β ≤ 1.0) is between 25 and 30, encompassing between 32.1% and 38.5% of the national total.
There are a number of clear implications of this study. First, it is necessary to develop transportation infrastructure, such as railways, to improve external linkages to remote resource-exhausted cities. Forest industrial cities, for example, would benefit from additional construction of the Wudalianchi-Bei’an Railway, to reduce transfer times and increase transportation speed between centers. Second, resource-exhausted cities that are not remote should take full advantage of their locations and develop relationships with provincial capitals and regional centers. The development of universities and other scientific research institutions should be encouraged in Huangshi City, for example, as this agglomeration is located close to Wuhan (HMPG, 2009), while establishing an underlying industrial base should also be encouraged. A strong manufacturing base will attract other enterprises, e.g., textiles and garments, automobile parts, machine manufacturing, and agricultural products, to Huangshi City, and will further promote the development of modern industry.

The authors have declared that no competing interests exist.

[1]
Guo L J, Wang R Y, 2009. Study on accessibility and spatial connecting among the cities in Sichuan Basin Urban Agglomeration.Human Geography, 24(3): 42-48. (in Chinese)The researches on the spatial connection among the cities in the urban agglomeration are the foundation to select region or sub-regional central city and make urban agglomeration planning reasonably.All the methods measuring spatial connection of cities,the gravitation model and urban flow model are being widely used.And accessibility denotes the ease with which activities may be reached from a given location using a particular transportation system,and reflects the opportunities and potentialities of a particular region to exchange with others.In this paper,the authors calculate the railway and highway comparative accessibility of 18 cities in Sichuan Basin Urban Agglomeration(SBUA) by the Shortest Time Distance Model(STDM).Considering various transportations,the authors establish Integrated Accessibility Model to measure integration accessibility of cities.Also,the Shortest Time Distance Matrix is established to analyze the spatial contact intensity among the 18 cities.The research shows that the accessibility of Chengdu is the best while that of Chongqing ranks on the thirteenth,and Panzhihua is the worst among all of the cities in terms of STDM.However,the result by the Integrated Accessibility Model indicates that accessibility of Chongqing is the best,Chengdu follows behind,and that of cities in northeast Sichuan is at the fore.Spatial Contact Intensity Matrix also shows that most of cities in SBUC have the tightest connecting with Chengdu,but low connecting with Chongqing,concluding that the Spatial-Deviation between Chongqing and other cities has been formed.The ranks of some cities in SBUA will be changed greatly in future.Specifically,as to the accessibility,Chongqing will rank first and become the most important transportation hinge in SBUA,and the accessibility of Nanchong,Suining,Guangan,Dazhou would become much better,but the tendency is that the changes of accessibility to the cities outside the agglomeration would be better than the cities inside the agglomeration.Therefore,it is imperative to strengthen spatial connecting between Chongqing and the other cities in SBUA,to advance regional cooperation and develop Cheng-Yu economic zone.

[2]
Gutierrez J, Gonzalez R, Gomez G, 1996. The European high speed train network: Predicted effects on accessibility patterns.Journal of Transport Geography, 4(4): 227-238.

DOI

[3]
Gutierrez J, Urbano P, 1996. Accessibility in the European Union: The impact of the trans-European road network.Journal of Transport Geography, 4(1): 15-25.The aim of this paper is to assess the impact of the future Trans-European Road Network as far as accessibility is concerned. Accessibility analysis and presentation of results is undertaken using a vector geographic information system (GIS). In accordance with the results of the study, the new planned links appreciably modify levels of accessibility to economic activity centres, thus reducing distances and bringing the peripheral regions closer to the central ones. In accordance with the analyses carried out, the benefits of these new infrastructures will affect the whole of the territory of the European Union, albeit particularly so in the peripheral regions.

DOI

[4]
Huangshi Municipal People’s Government (HMPG), 2009. Transformation of Resource-based City and Sustainable Development Planning in Huangshi (2009-2020). (in Chinese)

[5]
Jiang N, Gu S Z, Shen Let al., 2004. National security positioning of mining cities in China.Mining Research and D, 24(5): 1-5, 12. (in Chinese)Mining city is one type of special cities. It holds important positions not only in city system but also in economic and social development for a country. In China, there are many mining cities, which once contributed much to the national economy construction and development, but now are confronted with new challenges in development. In this paper, the point of view of national security integrated with the characteristics of mining city itself is chose to discuss the effect of mining city development on national security, so as to provide reference grounds at national security level by positioning the development of mining city strategically.

[6]
Jin F J, Wang J E, 2004. Railway network expansion and spatial accessibility analysis in China: 1906-2000.Acta Geographica Sinica, 59(2): 293-302. (in Chinese)In this paper, the indexes and models are used to measure the accessibility of transport network, such as total transport distance Di and accessibility coefficient. On the basis of "The Shortest Route Model", the evolution of railway network, changes of the spatial structure in accessibility, the relationship between railway network distribution and spatial economic growth in the past several hundred years in China are analyzed. The results show that the evolution of railway network in China experienced 4 stages, i.e., initial stage, constructing stage, extending stage and optimizing stage, but the speed of spatial expanding is relatively slow. One hundred years' construction of railway leads to "time-space convergence". The spatial structure of accessibility displays "different circles with one core", and radiates from North China to the surroundings. The area, higher than the national average level in accessibility, expands from North China to East China and Central China, and the center of accessibility moved from Tianjin to Zhengzhou gradually.

DOI

[7]
Li S H, Hu D S, 2003. Study on the industrial structural adjustment of mining cities: Taking Ruhr as the example.China Population, Resources and Environment, (4): 26-28. (in Chinese)It becomes common for a mining city to sink into predicament and that there is no way but to adjust the industry structure so as to get a boom, but the city adjustment meets some obstacles. This paper analyze s these obstacles, taking the industry structural adjustment of Ruhr as the exam ple, and gives some appropriate suggestions.

[8]
Li X J, 2011. Economic Geography. 2nd ed. Beijing: Higher Education Press. (in Chinese)

[9]
Liu S C, Yuan G H, Hu X P, 1996. A study on the development of mining cities and mineral prospecting industry. China Geology & Mining Economics, (5): 16-20. (in Chinese)The authors think that the research on the development of mining citys in China should be attached importance to as well as strengthened. The Position and role of the mining cities in the national economy, the problems in thier sustainable development and the development approaches are described in detail in the article.

[10]
Long R Y, 2004. To implement the strategy of transforming the resource-based economies by using the experience of developed countries for reference.Science & Technology Review, (10): 10-12. (in Chinese)The development of mining cities is a topic of general interest both in theory and in practice. However, China's minimg cities are confronted with serious problems that restrain the progress of their sustainable development. The occidental developed countries have accumulated abundant successful experiences in pattern changes of the mining cities, which will have important enlightening functions on sustainable development of China's mining cities . In this thesis, the author analyzed the experiences and then advanced some suggestions on the sustainable development of China's mining cities.

[11]
Meng D Y, Fan K S, Lu Y Qet al., 2010. Level and spatial pattern of interprovincial accessibility before and after train-speed upgrading.Progress in Geography, 29(6): 709-715. (in Chinese)Rail transportation has been considered to be one of the most importment modes of transportation at present.And,the promotion of accessibility of railway can play an importment role in imporving interprovincial social-economic communications.In the paper,provincial capital cities are assumed to be the nodes in the railway network,and taking weighted average shortest travel time between provincial capital cities in 2003 and 2007 as target,the evolution and spatial pattern of interprovincial accessibility are measured and contrasted before and after the 5th and 6th train-speed network upgrading.Results show that,through fifth and sixth upgrading,the accessibility level has been greatly improved all over the country,and particularly,the accessibility promotion are higher in west provinces than the others.The stepped spatial pattern of the accessibiliy level that reduces gradually from the east coastal provinces to the northwest provinces in China has appeared.The scope of the accessibility central zone is expanding gradually,and the primary railway line are becoming stronger and stronger.On the contrary,the accessibility variation are increasing from the east coastal provinces to the northwest provinces,and the zone along the railway from the Lanzhou to the Urumchi is becoming the zone with the maximum accessibility variation.The significance and function of railway upgrading to the promotion of accessibility and the strengtherning of regional social-economic communication are confirmed objectively by analyzing the evolution and spatial pattern of railway accessibility.

DOI

[12]
Murayama Y, 1994. The impact of railways on accessibility in the Japanese urban system.Journal of Transport Geography, 2(2): 87-101.

DOI

[13]
Shi M J, Jin F J, Li Net al., 2006. Interregional economic linkage and regional development driving forces based on an interregional input-output analysis of China.Acta Geographica Sinica, 61(6): 593-603. (in Chinese)

[14]
The State Council of China, 2010. Planning of ecological protection and economic transition in Da-Xiao Hinggan Mountain forest area (2010-2020). (in Chinese)

[15]
Wan H, Shen L, 2005. Major determinates and countermeasures for sustainable development of mining cities.Resources Science, 27(1): 20-25. (in Chinese)Depending on exploitation of mineral resources, mining cities develop on the track that mineral industry goes by. As common cities, mining cities develop under mutual functions of both drive and resistance. All kinds of drives that push mining cities forward and resistances that stop mining cities from developing make up a resultant force, which is crucial to mining cities in their development course and determines urbanization level. Mining cities develop when the resultant force above zero and opposite phenomenon occur as the resultant force below zero. Depending on non-renewable resources, mining cities will undergo recession inevitably when mineral resources are depleted. It means that only carry out economy transition effectively in time can keep mining cities from recession and keep on developing. On one hand, it analyzes driving factors, such as mineral resources exploitation, capitals, talents, technology, etc. On the other hand, it analyzes resistant factors deeply, such as mineral resources depletion, industry structure, environment pollution and disasters, and mal-management etc. Finally, on both sides of increasing drives and decreasing resistances, authors put forward some counter-measures and hold the view that superlative juncture between drive and resistance should be ascertained to make sure that mining cities develop continually, rapidly and healthily.

DOI

[16]
Wu W, Cao Y H, Liang S Bet al., 2009. Spatial structure and evolution of highway accessibility in the Yangtze River Delta.Geographical Research, 28(5): 1389-1400. (in Chinese)Based on the highway network map in 1986, 1994 and 2005, choosing weighted mean travel time as indicator, the spatial structure and evolution of major cities highway accessibility in the Yangtze River Delta (YRD) are elaborated in this paper. Considering the characteristics of highway transportation, the impact of accessibility level on city development is also analyzed preliminarily. Some conclusions are drawn as follows. In the 20 years, the spatial structure of accessibility in the YRD has little change; Shanghai, Suzhou and Jiaxing are the center with the lowest accessibility value, and the value increases from the center to the surrounding. The improvement of highway system upgrades the accessibility of major cities in this region, but the evolution takes on different characteristics in the two research stages, and the accessibility upgrade in the second stage (1994-2005) is greater than that in the first stage (1986-1994). The changing extent of accessibility value is related to the initial value, and changing rate of accessibility value decreases from the northern part to the southern at the first stage, but takes on multi-core pattern at the second stage. With the improvement of highway system, the accessibility optimizes from the center to the surrounding. Most cities in this region are above the average level in accessibility, and the city relative accessibility has changed less at the first stage but more at the second stage. Standard deviation analysis of accessibility coefficient shows that the equilibrium of the accessibility distribution descends at the first stage and ascends at the second stage. Considering the highway freight local quotient, the impact of accessibility level on the city development is classified into three categories: promotion, restriction and adaptation. With these results, some suggestions about the development of highway system in this region and some foci for further study are proposed.

DOI

[17]
Yan S P, 2007. Inter-provincial migration and its determinants in the 1990’s China.Chinese Journal of Population Science, (1): 71-77. (in Chinese)

[18]
Zhang L, Lu Y Q, 2006. Assessment on regional accessibility based on land transportation network: A case study of the Yangtze River Delta.Acta Geographica Sinica, 61(12): 1235-1246. (in Chinese)For a given region, internal accessibility and external accessibility should be considered to assess accessibility of each point in the region. Using MapX component and Delphi programming tool, regional accessibility calculation and analysis information system based on minimal pass-time is developed, with which mark diffusing figure could be generated. From the view of time-distance, the present and approaching regional internal accessibility and regional external accessibility of 16 major cities in the Yangtze River Delta are analyzed according to land traffic network. The result shows that, the regional accessibility of the Yangtze River Delta radiates a fan-shaped pattern with Shanghai as the core. The top two cities are Shanghai and Jiaxing. The bottom two cities are Taizhou and Nantong. With the completion of Sutong Bridge, Hangzhouwan Bridge and Zhoushan Bridge, the regional internal accessibility of all cities in the Yangtze River Delta will be improved. Especially for Shaoxing, Ningbo and Taizhou, the regional internal accessibility will be one hour decrease. At the same time, the regional internal accessibility of other cities will be about 25 minutes decrease averagely. As the accomplishment of the Yangkou seaport in Nantong, regional external accessibility with the node of seaport of cities in Jiangsu province will be increased with an average decrease in accessibility by about one hour.

DOI

[19]
Zhang Y C, 1999. Status and countermeasures to sustainable development of mining cities in China.Journal of China University of Mining and Technology (Social Science), (1): 75-80. (in Chinese)

[20]
Zhao H Y, Li Z X, Zhang Y C, 2004. Study on the sustainable development index and evaluating of sustainable development of the mining city.China Mining Magazine, 13(12): 14-19, 35. (in Chinese)Based on the questionnaire investigations , the sustainable development index set of mining city is brought forward, which analytic hierarchy structure is established to calculate and evaluate the sustainable development focusing on the social 、economic、resource、environment question, then Analytic Hierarchy Process is used to analyze the 22 index set from all questionnaire of 52 mining cities, main results is as follows: Comprehensive mining city are strongly sustainable for the dependence weak on the resource exploitation; 15 mining cities are basically sustainable, for example HuaiAn ; 27 mining cities are weakly sustainable , such as PanJin, other 5 mining cites are imperatively needing economic transformation, such as FuXin.

[21]
Zhou D Q, 2006. Structural crisis and transition in a mining city.Western Forum, (3): 25-29. (in Chinese)Key Words】:

[22]
Zhou D Q, Long R Y, 2001. Study on the sustainable development of mining cities in China.Journal of China University of Mining and Technology (Social Sciences), (3): 76-82. (in Chinese)Mining cities rise along with mining development. They are important parts in city system. Up to now, there are more than 300 mining cities in our country. Developing and producing of mine resources is dominant industry of mining cities. Because of the exhaustibility of mine resources, mining cities find it difficult to avoid declining when resources are used up. So to evade risk and overcome crisis is not only necessary for the mining cities' development, but is also a natural choice for the sustainable development strategy carried out in our country. In this paper, some of relevant research achievements about mining cities are introduced and commented involving the concept and the classification of mining cities, current situations and problems of mining cities, causes of structure crisis of mining cities and the way of mining cities' sustainable development.

[23]
Zhou Y X, Zhang L, 2003. China’s urban economic region in the open context.Acta Geographica Sinica, 58(2): 271-284. (in Chinese)

[24]
Zhu X, 2004. The sustainable development of the mining city as the basis to vigorously develop old industrial base in Northeast China.Resources & Industries, 6(5): 1-4. (in Chinese)The mining city is an important composition of old industrial base in northeast China, so it is necessary to vigorously develop the mining city for old industrial base in northeast China. The mining city has made a huge contribution to development and economic construction for a long time. However, the mining city is also facing a serial difficulties and problems, such as the short of verified minable resources, the simplification of industrial construction, the difficulty of employability, the seriousness of environmental problems, the difficulty of local finance and the function inversion between mining industry and city government, etc. According to the science development opinion, the sustainable development of the mining city should be taken as an important mission for vigorously developing the old industrial base in northeast China by taking a series of necessary policy measures.

Outlines

/