
Journal of Geographical Sciences >
Investigating long-term trends of climate change and their spatial variations caused by regional and local environments through data mining
Author: Xie Yichun (1956-), PhD and Professor, specialized in urban modelling, ecological modelling and environmental modelling. E-mail: yxie@emich.edu
Received date: 2017-08-23
Accepted date: 2017-12-10
Online published: 2018-06-20
Supported by
Guangdong Innovative and Entrepreneurial Research Team Program, No.2016ZT06D336
GDAS Special Project of Science and Technology Development, No.2017GDASCX-0101
Copyright
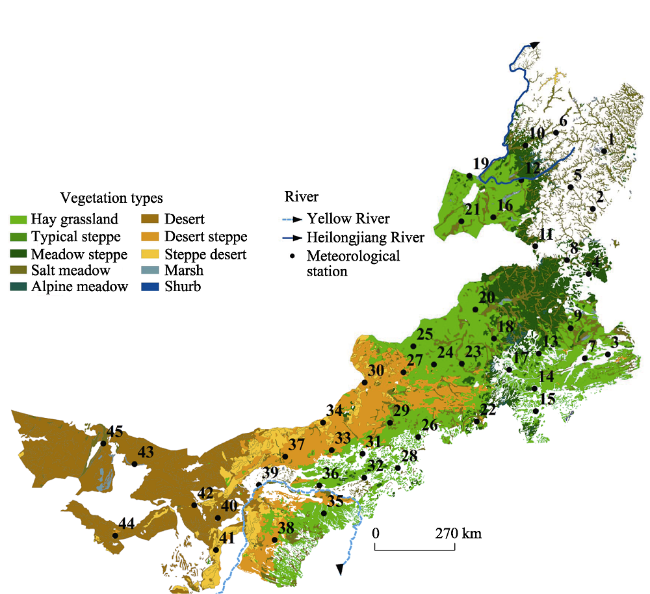
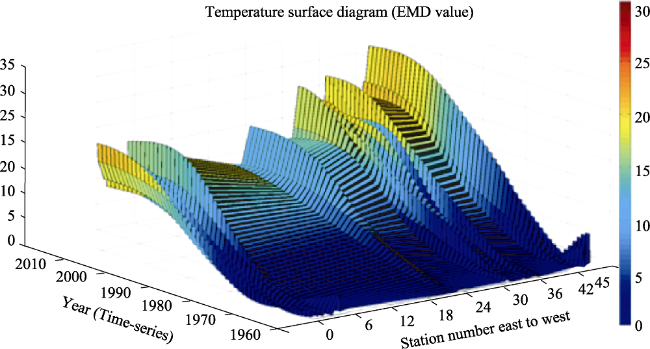
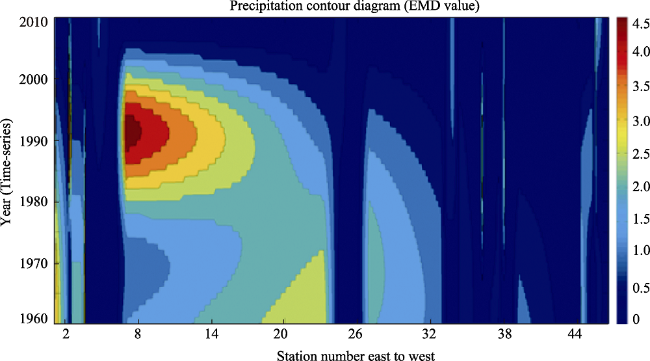
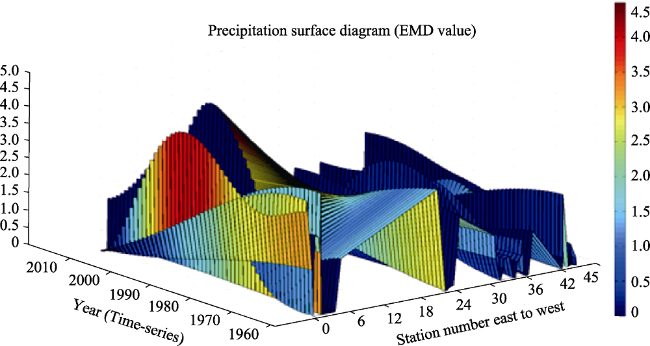
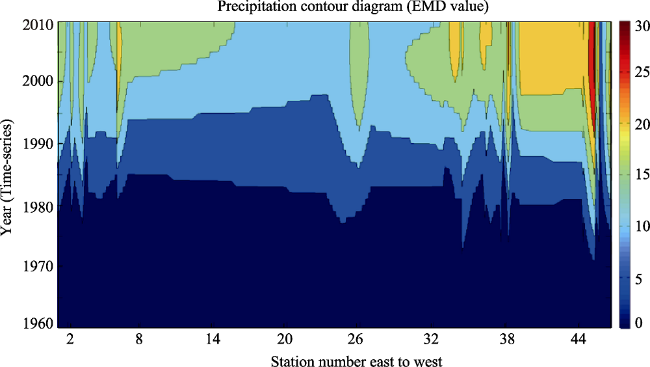
Climate change is a global phenomenon but is modified by regional and local environmental conditions. Moreover, climate change exhibits remarkable cyclical oscillations and disturbances, which often mask and distort the long-term trends of climate change we would like to identify. Inspired by recent advancements in data mining, we experimented with empirical mode decomposition (EMD) technique to extract long-term change trends from climate data. We applied GIS elevation model to construct 3D EMD trend surface to visualize spatial variations of climate change over regions and biomes. We then computed various time-series similarity measures and plot them to examine spatial patterns across meteorological stations. We conducted a case study in Inner Mongolia based on daily records of precipitation and temperature at 45 meteorological stations from 1959 to 2010. The EMD curves effectively illustrated the long-term trends of climate change. The EMD 3D surfaces revealed regional variations of climate change, while the EMD similarity plots disclosed cross-station deviations. In brief, the change trends of temperature were significantly different from those of precipitation. Noticeable regional patterns and local disturbances of the changes in both temperature and precipitation were identified. The trends of change were modified by regional and local topographies and land covers.
XIE Yichun , ZHANG Yang , LAN Hai , MAO Lishen , ZENG Shi , CHEN Yulu . Investigating long-term trends of climate change and their spatial variations caused by regional and local environments through data mining[J]. Journal of Geographical Sciences, 2018 , 28(6) : 802 -818 . DOI: 10.1007/s11442-018-1506-9
Figure 1 The map of the study area (Meteorological stations are numbered from east to west) |
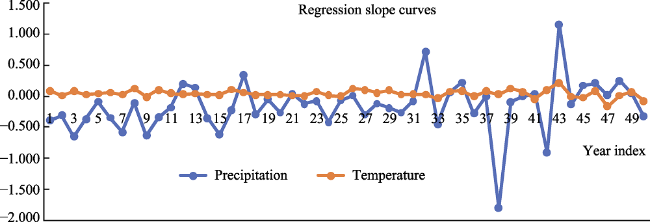
Figure 2 Regression slopes of precipitation and temperature, 1959-2010, at meteorological stations |
Figure 3 Temperature EMD surface diagram |
Figure 4 Temperature 2D contour diagram |
Figure 5 Precipitation surface diagram |
Figure 6 Precipitation contour diagram |
Table 1 Seven similarity measures: Root Mean Square Errors (RMSE) |
| Precipitation | RMSE | Temperature | RMSE |
|---|---|---|---|
| Chebyshev | 0.4249 | Chebyshev | 0.3008 |
| City block | 0.3870 | City block | 0.2600 |
| Correlation | 0.5956 | Correlation | 0.2896 |
| Cosine | 0.3898 | Cosine | 0.2264 |
| Euclidean distance (E.D.) | 0.4170 | Euclidean distance (E.D.) | 0.2654 |
| Spearman | 0.5912 | Spearman | 0.2805 |
| Standardized E.D. | 0.4413 | Standardized E.D. | 0.3042 |
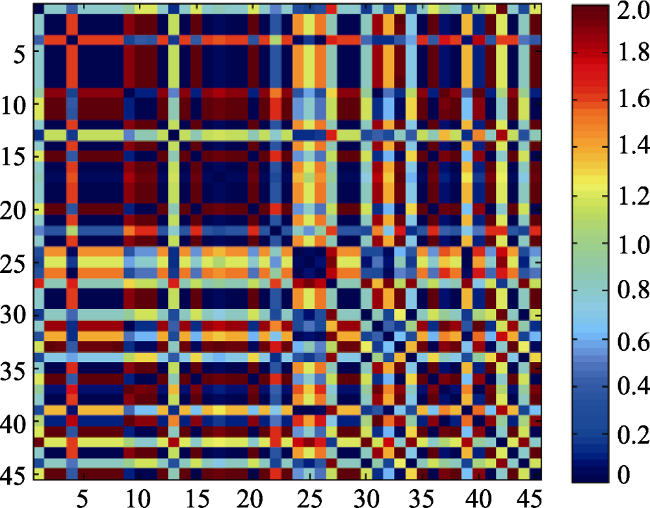
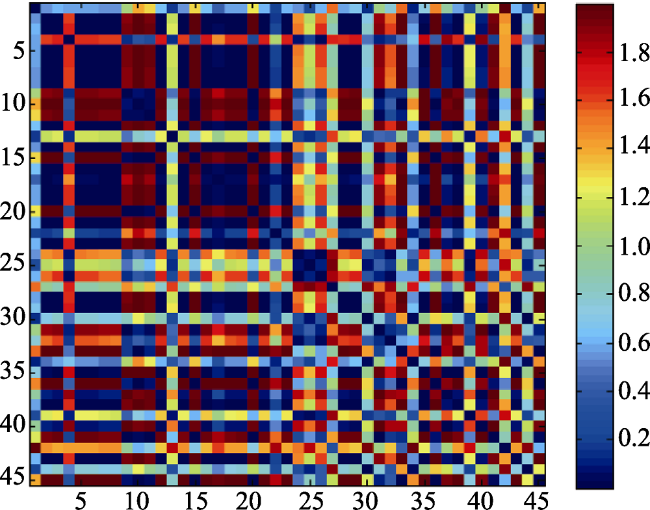
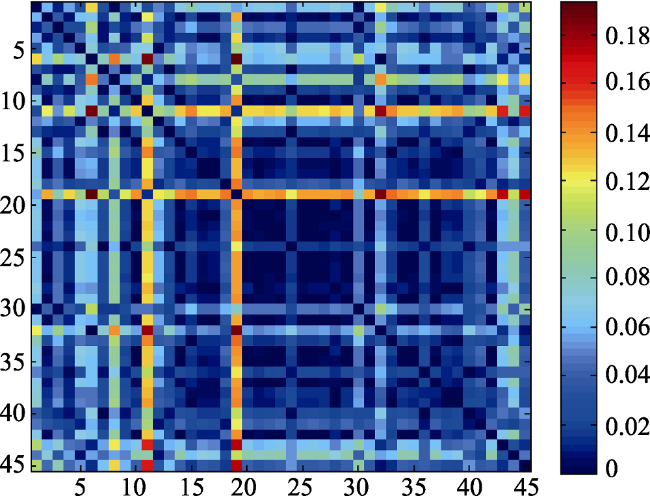
Figure 7 Cross-station plot of Spearman distance for precipitation |
Figure 8 Cross-station plot of correlation distance for precipitation |
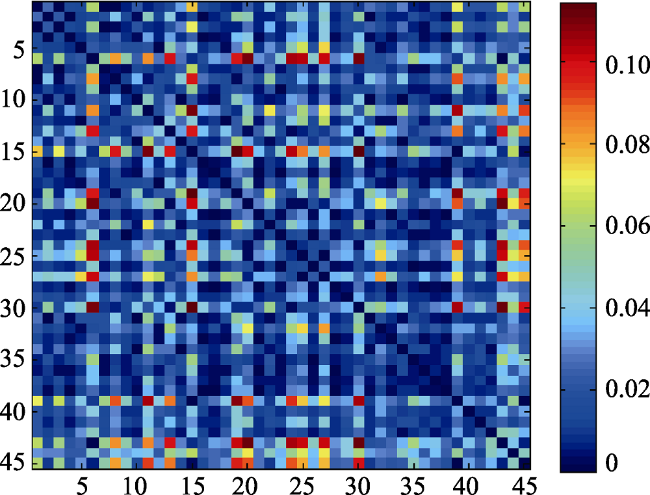
Figure 9 Cross-station plot of Spearman distance for temperature |
Figure 10 Cross-station plot of correlation distance for temperature |
The authors have declared that no competing interests exist.
| [1] |
|
| [2] |
|
| [3] |
|
| [4] |
|
| [5] |
|
| [6] |
|
| [7] |
|
| [8] |
|
| [9] |
|
| [10] |
|
| [11] |
|
| [12] |
|
| [13] |
CMDC (China Meteorological Data Service Center), 2013. Inner Mongolian Meteorological Stations and Data. https://data.cma.cn/en (the data was acquired in 2013).
|
| [14] |
|
| [15] |
|
| [16] |
|
| [17] |
|
| [18] |
|
| [19] |
|
| [20] |
|
| [21] |
|
| [22] |
|
| [23] |
|
| [24] |
|
| [25] |
|
| [26] |
|
| [27] |
|
| [28] |
|
| [29] |
|
| [30] |
|
| [31] |
|
| [32] |
|
| [33] |
|
| [34] |
|
| [35] |
|
| [36] |
|
| [37] |
|
| [38] |
|
| [39] |
|
| [40] |
|
| [41] |
|
| [42] |
|
| [43] |
|
| [44] |
|
| [45] |
|
| [46] |
|
| [47] |
|
| [48] |
|
| [49] |
|
| [50] |
|
| [51] |
|
| [52] |
|
| [53] |
|
| [54] |
|
| [55] |
|
| [56] |
|
| [57] |
|
| [58] |
|
| [59] |
|
| [60] |
|
| [61] |
|
| [62] |
|
| [63] |
|
| [64] |
|
| [65] |
|
| [66] |
|
| [67] |
|
| [68] |
|
| [69] |
|
| [70] |
|
| [71] |
|
| [72] |
|
| [73] |
|
| [74] |
|
| [75] |
|
/
| 〈 |
|
〉 |