Research Articles

Spatial patterns and environmental factors influencing leaf carbon content in the forests and shrublands of China

  • ZHAO Hang , 1, 2 ,
  • XU Li 1, 2 ,
  • WANG Qiufeng 1, 2 ,
  • TIAN Jing 1, 2 ,
  • TANG Xuli 3 ,
  • TANG Zhiyao 4 ,
  • XIE Zongqiang 5 ,
  • HE Nianpeng 1, 2 ,
  • YU Guirui , 1, 2, *
Expand
  • 1. Key Laboratory of Ecosystem Network Observation and Modeling, Institute of Geographic Sciences and Natural Resources Research, CAS, Beijing 100101, China
  • 2. University of Chinese Academy of Sciences, Beijing 100049, China
  • 3. South China Botanical Garden, CAS, Guangzhou 510650, China
  • 4. Department of Ecology, College of Urban and Environmental Sciences, Peking University, Beijing 100871, China
  • 5. State Key Laboratory of Vegetation and Environmental Change, Institute of Botany, CAS, Beijing 100093, China
*Corresponding author: Yu Guirui, Professor, E-mail:

Author: Zhao Hang (1991-), PhD, specialized in plant carbon and nitrogen storage. E-mail:

Received date: 2017-05-31

  Accepted date: 2017-10-17

  Online published: 2018-06-20

Supported by

National Key R&D Program of China, No.2016YFA0600103, No.2017YFA0604803

Youth Innovation Research Team Project, No.LENOM2016Q0005

Copyright

Journal of Geographical Sciences, All Rights Reserved

Abstract

Leaf carbon content (LCC) is widely used as an important parameter in estimating ecosystem carbon (C) storage, as well as for investigating the adaptation strategies of vegetation to their environment at a large scale. In this study, we used a dataset collected from forests (5119 plots) and shrublands (2564 plots) in China, 2011-2015. The plots were sampled following a consistent protocol, and we used the data to explore the spatial patterns of LCC at three scales: plot scale, eco-region scale (n = 24), and eco-region scale (n = 8). The average LCC of forests and shrublands combined was 45.3%, with the LCC of forests (45.5%) being slightly higher than that of shrublands (44.9%). Forest LCC ranged from 40.2% to 51.2% throughout the 24 eco-regions, while that of shrublands ranged from 35% to 50.1%. Forest LCC decreased with increasing latitude and longitude, whereas shrubland LCC decreased with increasing latitude, but increased with increasing longitude. The LCC increased, to some extent, with increasing temperature and precipitation. These results demonstrate the spatial patterns of LCC in the forests and shrublands at different scales based on field-measured data, providing a reference (or standard) for estimating carbon storage in vegetation at a regional scale.

Cite this article

ZHAO Hang , XU Li , WANG Qiufeng , TIAN Jing , TANG Xuli , TANG Zhiyao , XIE Zongqiang , HE Nianpeng , YU Guirui . Spatial patterns and environmental factors influencing leaf carbon content in the forests and shrublands of China[J]. Journal of Geographical Sciences, 2018 , 28(6) : 791 -801 . DOI: 10.1007/s11442-018-1505-x

1 Introduction

Leaves are a plant’s main interface with the environment for photosynthesis and transpiration. Therefore, leaves have a large influence on the carbon (C) and water cycle (Chapin et al., 2002; Ehleringer and Field, 1993). To some extent, leaf carbon content (LCC) reflects the adaption strategies of plants to their environment at a large scale (Wang and Yu, 2008). Furthermore, the leaf is an important organ that stores C in plants. To estimate vegetation C storage in terrestrial ecosystems accurately, it is necessary to measure LCC.
Many studies have explored regional variation in LCC with different research aims. Overall, the C content of different plant organs (e.g., leaves, stems, and roots) differs significantly, and tends to exceed 50% (Bert and Danjon, 2006; Tolunay, 2009). Moreover, LCC noticeably varies among different plant species or plant functional groups (Jagodzinski, et al., 2012; Yerena-Yamallel et al., 2011). Han et al. (2009) reported an average LCC of 45.1% for 358 plants in Beijing, China. Yu et al. (2012) reported an average LCC of 44.5% (41.6%-47%) for northeast China’s forests. Furthermore, Ma et al. (2002) found an average LCC of 49.4% for 10 shrub species in north China, and an average LCC of 50% for eight dominant tree species. Cheng et al. (2008) obtained an average LCC of 43% for 14 shrub species from Mt. Xiaolongshan in Gansu Province, China. Overall, these results indicate that LCC varies widely across regions and between trees and shrubs. Unfortunately, only a few studies have addressed this problem at different spatial scales, leaving a gap in our knowledge on how exactly LCC varies with the environment.
Understanding how LCC varies spatially and across vegetation types would facilitate better estimates of C storage in leaves, which is an important component of terrestrial ecosystems. In general, two approaches can estimate C storage in ecosystems by using LCC. The first approach involves conducting direct measurements of LCC, while the second uses an empirical average as a substitute. Many estimates of leaf C storage at the regional scale have used an LCC of 45% or 50% when employing the substitution method (Fang et al., 2001; Houghton et al., 2000; Liu et al., 2000; Navar, 2009; Sykes and Prentice, 1996; Wang et al., 2001; Zhou et al., 2000). However, LCC is influenced by vegetation type, climate, topography, and other factors. Therefore, although the substitution method is simple and economic, high uncertainty due to the spatial variation in LCC is unavoidable. Other studies have measured the LCC of specific plant species or regions directly (Birdsey, 1992; Cheng et al., 2008; Du et al., 2009; Ren et al., 2012; Shvidenko et al., 1996; Turner et al., 1995; Yang et al., 2014; Zhao et al., 2014). However, direct measurements are very costly and time-consuming, especially at large scales. Therefore, it is necessary to improve our understanding on the spatial variation of LCC to update estimates of global C storage.
Overall, there is a need to explore the large-scale spatial variation of LCC, and to develop a series of more accurate standards for LCC at different regional scales. In this study, we compiled the LCC data of 7683 Chinese sampling plots from forests and shrublands. We subsequently analyzed the statistical characteristics, spatial patterns, and correlations of these two vegetation types with temperature and precipitation at three different scales (plot [7683 plots], eco-region [24 groupings], and larger eco-region [8 groupings]). All data were derived from the Ecosystem Carbon Sequestration Project of the Chinese Academy of Sciences (XDA05050000). The main objectives of this study were to: 1) analyze the statistical characteristics and spatial distribution of LCC in the forests and shrublands of China; 2) explore regional differences in LCC at different scales; and 3) develop a series of accurate LCC standards at different scales for future studies.

2 Data and methods

2.1 Data source

All of the LCC data from the 7683 plots (5119 forest plots and 2564 shrubland plots) originated from the Ecosystem Carbon Sequestration Project (2011-2015), which was part of the strategic priority research program “Climate Change: Carbon Budget and Related Issues” of the Chinese Academy of Sciences (XDA05050000). The meteorological data were obtained from the National Data Sharing Infrastructure of Earth System Science (http://www.geodata.cn/).
Before measuring the C content of different components of the terrestrial ecosystems (e.g., leaf, stem, root, and soil), we developed a protocol to make the operational procedures consistent with the various (regional) investigators. This protocol included instructions on how to set up the sampling plots, how to collect and store the samples, and how to conduct the chemical analyses (Xie et al., 2015; Zhou et al., 2015). In brief, we set up the plots using meshed and normalized sampling, based on the spatial distribution of the forests and shrublands at regional, site, and plot scales in China. This practice ensured that all plots used in our study were representative. For example, the forests in China were first divided into six main types or regions, based on the forest type, climate, and geographical and administrative areas. We subsequently meshed each type into different forests with a more complex and higher resolution (or higher mesh density). Study sites were selected from these meshes at a sampling standard of 3%-5%. At each selected site, we set up three 10 m × 10 m plots to conduct the field measurements and sampling. A similar procedure was used to select the shrubland study plots in China, even though plot size was different (5 m × 5 m). In total, there were 7683 plots, including 5119 forest plots and 2564 shrubland plots. The spatial distribution of these plots is shown in Figure 1.
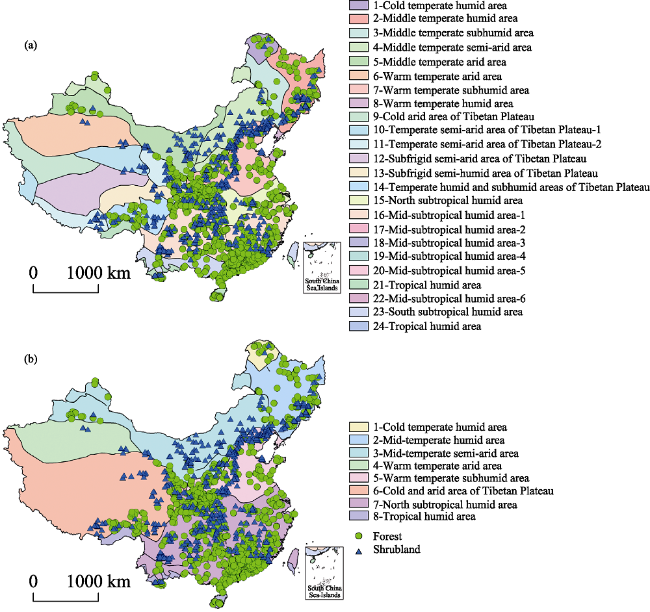
Figure 1 Sampling sites of forests and shrublands in China divided into 24 eco-regions (a) and 8 eco-regions (b)
In each plot, we collected a mixed leaf sample (about 300 g fresh weight), which contained more than five dominant plant species. The dominant tree and shrub species were determined based on their overall basal area at the site. Subsequently, forest LCC was measured using the wet combustion method (potassium dichromate-sulfuric acid oxidation process) (Fu and Sun, 2013). Shrub LCC was measured using the dry combustion method (PE-2400 II, USA).

2.2 Analysis and statistics

We first obtained the distribution and statistical properties of the data through a descriptive analysis. All data were subsequently classified into different eco-regions. For this process, we adopted the regional classification of Fu et al. (2001), who separated the terrestrial ecosystems of China into 24 eco-regions, and eight larger eco-regions. Regression analyses were performed to explore the relationships between LCC and their corresponding longitude and latitude, in addition to the relationships of LCC with environmental variables (mean annual temperature [MAT] and mean annual precipitation [MAP]). These regression analyses were conducted at a plot scale, the eco-region scale, and the larger eco-region scale. Furthermore, a one-way analysis of variance (ANOVA) was performed to identify differences in LCC among different regions, with a post-hoc LSD test.
All maps were made in Arcgis 10.2, the graphs in Sigmaplot 12.5, and the statistical analyses in SPSS 19. For the statistical analyses, the significance level was set at α = 0.05.

3 Results

3.1 Changes in forest and shrubland LCC at different scales

3.1.1 Plot scale
LCC ranged from 27.62% to 62.67% for the forests and shrublands of China, with a mean of 45.30% (Figure 2), and this range showed a normal distribution. Mean forest LCC was 45.51%, while that of shrublands was 44.91%. LCC was, to some extent, higher in forests than in shrublands.
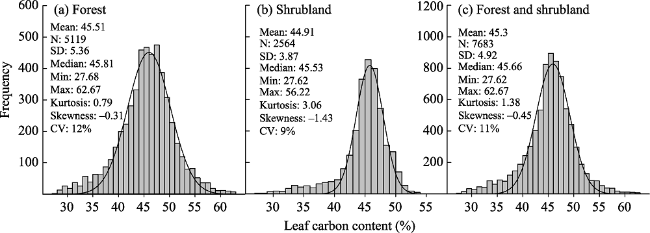
Figure 2 Frequency distribution of leaf carbon content (LCC, %) in the forests and shrublands of China (N, sample number; SD, standard deviation; Min, minimum value; Max, maximum value; CV, coefficient of variation)
3.1.2 Eco-region scale
At the scale of the 24 eco-regions, forest LCC was the highest in the mid-subtropical humid area-5 (51.24%), and the lowest in the mid-temperate humid region (40.18%), with some regions differing significantly from one another (Table 1). Shrubland LCC also significantly differed among the various regions, being the highest in the tropical humid area (50.12%) and the lowest in the temperate semi-arid area of the Tibetan Plateau (34.99%).
Table 1 Changes in leaf carbon content (LCC, %) of forests and shrublands in the 24 eco-regions of China
Region LCC of forests LCC of shrublands LCC of forests and shrublands
Mean (%) N SD Mean (%) N SD Mean (%) N SD
1 42.73Ag§ 29 7.44 46.10Abcde 6 3.18 43.31g 35 6.98
2 40.18Ah 541 6.96 44.13Be 299 2.35 41.59h 840 6.06
3 41.56Ag 51 5.95 45.8Bbcd 19 1.29 42.71g 70 5.45
4 46.84Ade 197 4.85 45.19Bcd 245 2.32 45.93d 442 3.76
5 45.71Aef 44 4.38 39.84Bf 230 5.34 40.78i 274 5.62
6 - - - 36.96g 24 3.87 36.96j 24 3.87
7 45.17Af 645 4.54 45.47Ac 458 2.00 45.30ef 1103 3.70
8 49.18bcd 27 2.22 - - - 49.18ab 27 2.22
9 - - - - - - - - -
10 - - - 34.99h 54 4.38 34.99j 54 4.38
11 49.02Abc 45 4.03 46.14Bb 148 4.08 46.81cd 193 4.24
12 - - 43.85e 3 0.71 43.85fghi 3 0.71
13 - - - 45.77bc 64 3.15 45.77def 64 3.15
14 48.21Ac 266 3.73 48.06Aa 81 3.15 48.17b 347 3.60
15 45.52Aef 651 3.46 44.78Bd 118 1.96 45.41e 769 3.28
16 46.02Ae 199 3.40 45.47Acd 96 1.81 45.84de 295 2.98
17 42.62Ag 265 5.14 45.66Bbc 157 2.68 43.75g 422 4.62
18 46.73Ade 297 4.14 45.92Bbc 149 2.32 46.46d 446 3.65
19 44.79Af 661 4.10 47.01Bab 46 2.28 44.94f 707 4.05
20 51.24Aa 76 3.44 48.03Ba 257 1.92 48.77b 333 2.71
21 49.26Abc 44 2.93 50.12Aa 3 0.62 49.32ab 47 2.84
22 49.69Ab 342 5.78 45.52Bbcde 17 1.48 49.49a 359 5.72
23 47.38Ad 478 4.58 46.48Ab 40 2.85 47.31c 518 4.47
24 45.28Aef 261 4.36 44.67Ade 50 1.85 45.18ef 311 4.07

Eco-region number corresponding with Figure 1a

N = number of sampling sites; SD = standard deviation

§ Different uppercase letters indicate significant differences between forests and shrublands within specific rows at P < 0.05; Different lowercase letters indicate significant differences among the 24 eco-regions within each column at P < 0.05

3.1.3 Larger eco-region scale
At the scale of the eight eco-regions, forest LCC was the lowest in the mid-temperate humid area (40.30%), and the highest in the cold and arid area of the Tibetan Plateau (48.32%) (Table 2). Shrubland LCC was the lowest in the warm temperate arid area (36.96%), and the highest in the tropical humid area (46.70%).
Table 2 Leaf carbon content (LCC, %) of forests and shrublands in the eight larger eco-regions of China
Area LCC of forests LCC of shrublands LCC of forests and shrublands
Mean (%) N SD Mean (%) N SD Mean (%) N SD
1 42.73Ae§ 29 7.44 46.10Aabcd 6 3.18 43.31d 35 6.98
2 40.30Af 592 6.89 44.23Bd 318 2.33 41.67e 910 6.02
3 46.63Ab 241 4.78 42.60Be 475 4.87 43.96d 716 5.20
4 - - - 36.96f 24 3.87 36.96f 24 3.87
5 45.33Ad 672 4.53 45.47Ab 458 2.00 45.39c 1130 3.72
6 48.32Aa 311 3.78 44.78Bc 350 5.68 46.44a 661 5.19
7 45.95Ac 2491 4.77 46.36Ba 840 2.47 46.05b 3331 4.31
8 46.65Ab 743 4.61 46.70Aa 133 3.18 46.66a 876 4.42

Eco-region number corresponding with Figure 1b

N = number of sampling sites; SD = standard deviation

§ Different uppercase letters indicate significant differences between forests and shrublands within specific rows at P < 0.05; Different lowercase letters indicate significant differences among the 8 larger eco-regions within each column at P < 0.05.

3.2 Spatial patterns of LCC

Forest LCC exhibited a significant spatial pattern with longitude and latitude (P < 0.001).
More specifically, forest LCC decreased with increasing longitude and latitude (Figures 3a and 3d). Furthermore, shrubland LCC was significantly related to latitude (P < 0.001) and longitude (P = 0.0057). Shrubland LCC decreased with increasing latitude (Figure 3b), but increased with increasing longitude (Figure 3e). For forests and shrublands combined, LCC showed a significant pattern with longitude and latitude (P < 0.001), with LCC decreasing with increasing longitude and latitude (Figures 3c and 3f). Furthermore, the LCC regressions with latitude did not differ significantly for forests, shrublands, or the two combined (slope: P = 0.513, intercept: P = 0.610). In contrast, the LCC regressions with longitude differed significantly for forests, shrublands, and the combined data (slope: P < 0.001, intercept: P < 0.001).
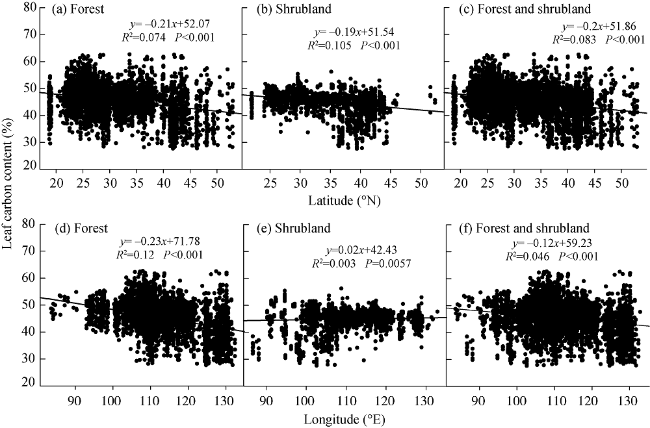
Figure 3 Changes in leaf carbon content (LCC, %) with latitude and longitude in the forests and shrublands of China at the plot scale

3.3 Environmental factors influencing LCC

3.3.1 Plot scale
Forest and shrubland LCC was significantly related to MAT and MAP at the plot scale (P < 0.001). In general, LCC increased gradually with increasing MAT and MAP. Furthermore, the regressions of LCC with MAT did not differ significantly among forests and shrublands in terms of both their slopes and intercepts. However, for the relationships between MAP and LCC, the slopes differed significantly (P < 0.001) (Figure 4).
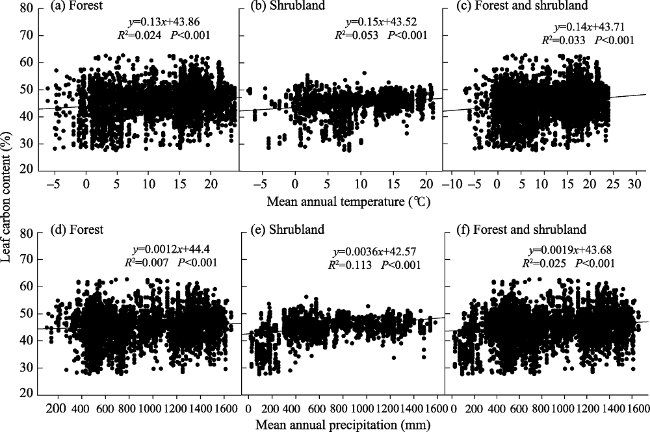
Figure 4 Changes in leaf carbon content (LCC, %) in the forests and shrublands of China with climate at the plot scale
3.3.2 Eco-region scale and larger eco-region scale
At the 24 eco-region (Figure 5) and eight eco-region (Figure 6) scales, LCC was not significantly related to MAT for forests or shrublands. The LCC of shrubs and their combined values with forests increased significantly with MAP at the scale of the 24 eco-regions, while shrub LCC increased significantly with MAP at the larger eco-region scale.
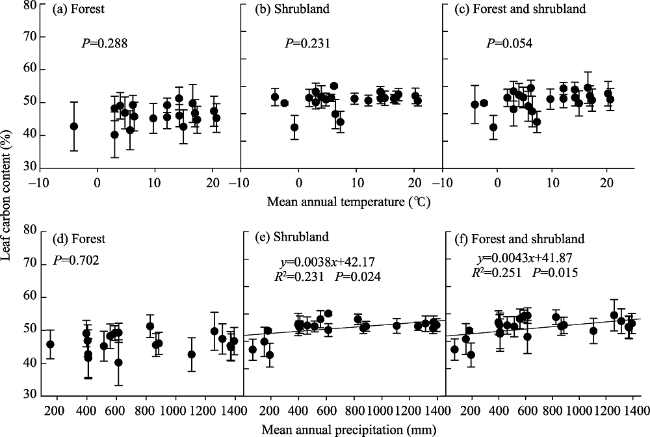
Figure 5 Changes in leaf carbon content (LCC %) in the forests and shrublands of China with climate at the scale of the 24 eco-regions
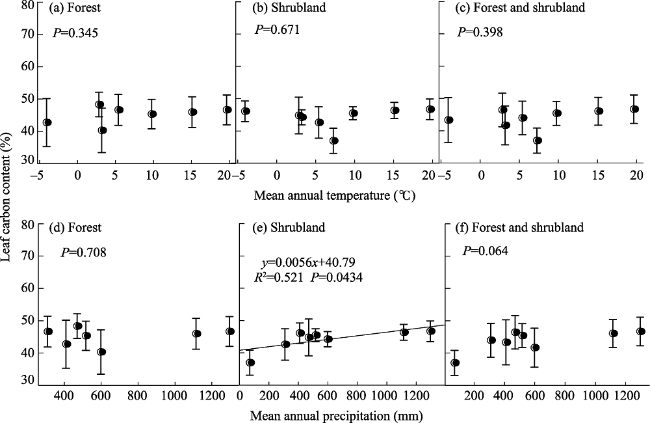
Figure 6 Changes in leaf carbon content (LCC, %) in the forests and shrublands of China with climate at the scale of the eight eco-regions

4 Discussion

4.1 Regional differences in LCC

In this study, forest LCC was 45.51%, which was slightly higher than that of shrublands (44.91%), and their combined average was 45.30%. As expected, there were obvious regional differences for both forest and shrubland LCC. Forest LCC ranged from 40.18% to 51.24% among the regions, whereas shrub LCC ranged from 34.99% to 50.12%. These different ranges might be attributed to the climatic conditions that limit the distribution of plants and plant physiological characteristics. To adapt to the changing environment, plants adjust their composition, such as the C content, in different organs (Yang, 2001; Yu et al., 2016; Zheng et al., 2007). For example, regions with higher latitude have longer winters that are colder with less rainfall; consequently, the dominant vegetation is boreal forest, the physiological characteristics of which leads to high LCC content. In arid areas, the dominant plants are xerophytes that are adapted to less precipitation, which is an essential characteristic for the survival of plants in these regions, but results in high numbers of organic compounds with lower LCC content (Yang, 2001).
The investigation of 102 dominant plant species by Ren et al. (2012) showed that the LCC along a north-south transect in eastern China ranged from 37.4% to 64.7%. This finding differed from our results, possibly because we measured mixed leaf samples from a number of dominant species at the community level. Thus, our results might better represent LCC characteristics at a community scale. Zheng et al. (2007) reported global LCC characteristics by deriving LCC data from publicly available datasets; consequently, this previous study combined different sampling methods and different measurement methods. The authors calculated an average of 44.9% for forest LCC, ranging from 30.5% to 55.4%, and an average of 47.5% for shrubland LCC, ranging from 35.5% to 59.4%. Overall, these reports were consistent with each other.
Han et al. (2009) studied the stoichiometry of 358 plant leaves in Beijing and the surrounding areas. The authors reported an average LCC of 45.1%, based on species level measurements. In addition, Yu et al. (2012) showed that the LCC in the northeast forest region (including Da Hinggan, Xiao Hinggan mountains, Zhangguangcai Mountain, and Changbai Mountain) was 44.5%, using the data from a standard survey. These LCC values were comparable to those obtained in the cold temperate humid areas of the current study, which was 42.7% for forests, 46.1% for shrublands, and 43.3% for the two combined.
Furthermore, the average LCC of 10 shrub species from northern China was 49.4%, while the average LCC of eight forest species in northern China was 50% (Ma et al., 2002). These results were similar to those obtained for forest LCC in the current study for warm temperate sub-humid areas (45.2%) and the shrublands (45.5%). The average LCC of four dominant tree species in the northwest of Yunnan Province was 51% (Wang et al., 2012), which corresponded to the forest LCC obtained in the mid subtropical humid area-5 (51.2%) and its shrubland LCC (48%) in the current study. In addition, in Gansu Province, the average LCC of 14 shrub species was previously reported as 43% (Cheng et al., 2008). In this study, the corresponding region was located in the temperate semi-arid area of the Tibetan Plateau-2, in which forest LCC was 49% and shrubland LCC was 46.1%. Overall, forest and shrubland LCC varied among different regions, which should be incorporated in future studies to obtain more accurate LCC estimates per region.

4.2 Implication of forest and shrubland LCC in carbon storage assessments

Leaves are an important component of vegetation C storage. Vegetation C storage is generally estimated by multiplying the biomass of different plant components and their corresponding C content (Yu et al., 2012). However, measuring LCC from different plant species is time-consuming and costly at a large scale. Therefore, many studies prefer to use an empirical average (Fang et al., 2001; Navar, 2009; Sykes and Prentice, 1996; Wang et al., 2001). However, LCC is influenced by vegetation type, climate, topography, and other factors. Therefore, understanding large-scale spatial LCC patterns and their variations is essential to develop realistic models.
Our findings showed that LCC exhibited clear regional differences for both forests and shrublands. Therefore, it is not appropriate to use a uniform value of LCC for an entire country, such as China, as this would result in higher uncertainties of C estimates. Because our large dataset covered all of the many forest and shrubland types in China, we provided a series of LCC standards at different scales for use in future studies (Tables 1 and 2). These findings are expected to help by providing low-cost estimates of C storage in leaves, which is one of the most important components of C in terrestrial ecosystems.
Nonetheless, the LCC reported here is not sufficient for evaluating overall vegetation C storage alone. Some studies have demonstrated that C content differs among plant organs, and is modified by forest age and phenology. For example, Yang et al. (2014) reported that the C content of Pinus tabulaeformis plantations was ordered as branch (46%) > leaf (44.8%) > root (42.5%). Furthermore, the C content of northeast China’s forests significantly differ among different plant organs, with leaf (44.5%) > branch (44.2%) > bark (44%) > trunk (43.5%) (Yu et al., 2012). Overall, to determine the C storage in all vegetation types combined, further studies on the C content of the plant litter, roots, stems, branches, and other plant organs are required at a large scale.

5 Conclusions

The average LCC of forests and shrublands was 45.51% and 44.91%, respectively, and was 45.30% for the two combined. LCC significantly differed across regions for both forests and shrublands. There were clear spatial patterns in forest and shrubland LCC. Forest LCC decreased with increasing latitude and longitude. In comparison, shrubland LCC decreased with increasing latitude, but increased with increasing longitude. Forest and shrubland LCC were significantly correlated with MAP and MAT, which both gradually increased with increasing MAT and MAP. In conclusion, our study is the first to explore spatial variation in the LCC of forests and shrublands at a national scale. Our findings provide a new reference and standard values for estimating large-scale foliage C.

The authors have declared that no competing interests exist.

[1]
Bert D, Danjon F, 2006. Carbon concentration variations in the roots, stem and crown of mature Pinus pinaster (Ait.).Forest Ecology & Management, 222(1-3): 279-295.Stands of maritime pine ( Pinus pinaster Ait.) cover about one million hectares of land in south-western France and produce 19% of all French timber, thanks to the intensive management methods employed. Evaluations of carbon fixation and storage in this forest are facilitated by its general homogeneity with respect to soil, climate and tree genetics. However, initial assessments were based on basic values for expansion factors and carbon concentration in the biomass, and more accurate results could be obtained. The aim of the present study was to estimate the carbon concentration in the 13 main compartments of mature P. pinaster shoots and roots, describing sources of variation within these compartments and quantifying precisely the corresponding carbon contents. The biomass distribution per compartment in the shoots and roots of 12 trees with a range of social status is given. It was obtained by joint architecture and dry weight measurements. The root systems were uprooted with a mechanical shovel and measured by 3D digitizing. Biomass allometric prediction equations per compartment according to girth at breast height were developed. The carbon concentration was analysed in 300 samples from four trees, taking into account their architecture. The carbon concentration varied largely between compartments and showed a quadratic relationship with relative height in the four stem compartments and in branches and buds. It showed a negative exponential relation with root diameter. The carbon concentration of needles was not related to their age or their relative height in the crown. Carbon concentration variations were in accordance with the tissue chemical composition found in literature. The biochemical concentration of softwoods organs is extensively reviewed in the paper. The weighted mean carbon concentration reached 53.6% in the shoots and 51.7% in the roots. This resulted to 53.2% at tree level. The carbon content in the pine stand was 74 t C per hectare. Between and within compartment variations in carbon concentration should be considered in carbon content evaluations and in structural unctional models. The underestimation of carbon storage in mature P. pinaster stands and sawnwood products reaches 6% when the usual 50% conversion factor is used.

DOI

[2]
Birdsey R A, 1992. Carbon storage and accumulation in United States forest ecosystems. In: General Technical Report. Washington D.C, U.S.: Department of Agriculture, Forest Service, Washington Office.Historically, assessments of the forest resource situation have focused on timber supply, and the data used to support the assessments came from traditional forest inventories designed to provide reliable estimates of timber volume, growth, removals, and mortality (U.S. Department of Agriculture, Forest Service 1982). The most recent assessment included data and analysis of forest resources other than timber, including wildlife, range, water, recreation, and other resources associated with the Nation's forest lands (U.S. Department of Agriculture, Forest Service 1989). Future forest resource assessments will include expanded analyses of environmental issues such as the effects of acid deposition on forest health, the prospective effects of global warming on forests, and the impacts of prospective strategies to mitigate or adapt to changing environmental conditions.

[3]
Chapin F S, Matson P A, Mooney H A, 2002. Principles of Terrestrial Ecosystem Ecology. New York, USA: Springer.The ecosystem approach to ecology treats organisms and the physical elements of their environment as components of a single, integrated system. This comprehensive textbook outlines the central processes that characterize terrestrial ecosystems, tracing the flow of water, carbon, and nutrients from their abiotic origins to their cycles through plants, animals, and decomposer organisms. As human activity becomes an increasingly dominant factor in natural processes around the globe, landscape dynamics over time and space have become the focus of recent attention. This book synthesizes current advances in ecology with established theory to offer a complete survey of ecosystem pattern and process in the terrestrial environment. Featuring review questions at the end of each chapter, suggestions for recommended reading, and a glossary of ecological terms, Principles of Terrestrial Ecosystem Ecology will be an important text suitable for use in all courses on ecosystem ecology. Resource managers, land use managers, and researchers will also welcome its thorough presentation of ecosystem essentials. About the Authors F. Stuart Chapin, III is Professor of Ecology at the Institute for Arctic Biology, University of Alaska at Fairbanks. Pamela Matson is Professor in the Department of Geological and Environmental Sciences and the Institute of International Studies, Stanford University; Director of the Earth Systems Degree Program and co-director of the Center for Environmental Science and Policy, Stanford University; and currently serves as president of the Ecological Society of America. Harold A. Mooney is Professor of Environmental Biology at Stanford University.

DOI

[4]
Cheng T R, Feng J, Ma Q Y.et al, 2008. Carbon pool and allocation of forest vegetation in Xiaolong Mountains, Gansu Province.Acta Ecologica Sinica, 28(1): 33-44. (in Chinese)In order to accurately estimate the size of carbon pool in the forest region of Xiaolong Mountains(Gansu Province,China),carbon content rates(CCRs) of dominant forest vegetations(13 tree species,14 shrub species,10 herbaceous plants) and the forest litters of 7 stand types were measured with dry combustion method.Based on the biomass data from sample plots,the average CCR of tree layer,carbon storage density and carbon storage of forest vegetation were calculated,as well as the carbon storage allocation of each component in 8 forest stands.The average CCR of the 13 tree species,Quercus Aliena var.Acuteserrata,Pinus tabulaeformis,Quercus variabilis,Betula platyphylla,Betula albo-sinensis,Larix kaempferi,Pinus armandii,Picea asperata,Abies chensiensis,Fraxinus mandschurica,Cornus macrophylla,Acer mono,and Quercus liaotungensis ranges from 0.4501 to 0.5049.The mean CCR of shrubs(14),herbaceous plants(10) and forest litters(7 stands) are 0.4446,0.3270 and 0.4221,respectively.In this region,the average CCR of tree layer in the 8 stands varies between 0.4676 and 0.4976.Results show that the carbon storage density of forest vegetation in Xiaolong Mountains is 39.4254 t hm-2,and carbon storage is 13.3579 Tg.In the tested 8 stands,carbon storage allocations of tree layer,shrub layer,herb layer and forest litters are 98.07%卤0.73%,1.38%卤0.43%,0.17%卤0.08% and 0.37% 0.37%,respectively.We conclude that the estimated tree layer carbon storage density in Xiaolong Mountains is similar to the reported value in other areas of China and around the world.

[5]
Du H M, Wang C, Gao H Z, 2009. Carbon-sink function of artificial Larix principis-rupprechtii plantation.Chinese Journal of Eco-Agriculture, 17(4): 756-759. (in Chinese)Plantations of 14~59-year old Larix principis-rupprechtii in Mulan Forest Farm of Hebei Province were selected and both biomass and carbon storage in the tree organs and the components of the plantation analyzed. Carbon storage in the stem of L. principis-rupprechtii forms the highest proportion of the plant total carbon storage. The proportions of carbon storage of soil and trees are highest in the plantation. L. principis-rupprechtii carbon density is 206.02 t·hm-2, while those of the trees and soils are 27.58 t·hm-2 and 157.14 t·hm-2 respectively. The fitted equations for carbon storage (C) and forest biomass (W) at growth stock (M) are W = 10.210 1 + 0.732 1M, C = 5.188 4+0.373 6M. That for soil carbon density (Soc) at forest age (A) and dominant tree average height (H) is Soc = -24.635 6-5.606 1A + 14.936 0H + 0.439 8AH. Accordingly, total carbon storage in Mulan Forest farm is 571.43×10⁴ t, basic tree biomass and carbon storage are 150.00×10⁴ t and 76.49×10⁴ t respectively, while soil carbon storage is 435.85×10⁴ t.

DOI

[6]
Ehleringer J R, Field C B, 1993. Scaling Physiological Processes: Leaf to Globe. Vol. 261. San Diego: Academic Press.

[7]
Fang J Y, Chen A P, Peng C H.et al, 2001. Changes in forest biomass carbon storage in China between 1949 and 1998.Science, 292(5525): 2320-2322.

DOI

[8]
Fu B J, Liu G H, Chen L D.et al, 2001. Scheme of ecological regionalization in China.Acta Ecologica Sinica, 21(1): 1-6. (in Chinese)Ecological regionalization is a base for rational management and sustainable utilization of ecosystems and natural resources It can provide scientific basis for constructing healthy ecological environments and making policies of environmental management In this paper, based on synthetical analysis of the characteristics of ecological environments of China, the principles of ecological regionalization are discussed, and indices and nomenclature of ecological regionalization are proposed, The ecoregions in national scale are divided The results show that there are 3 domains, 13 ecoregions and 57 ecodistricts

[9]
Fu Y, Sun Y J, 2013. A study of the determination of organic carbon of vegetation. World Forestry Research, 26(1): 24-30. (in Chinese)Organic carbon concentration of plants is one of the key factors for the research on forest carbon sink.This paper summarized the research progress of forest vegetation carbon concentration in the last 20 years and the existing problems and development trend as well as.It was the pointed out that the studies of Chinese vegetation carbon concentration mainly focused on Northeastern China,East China and some areas in the northwest and southwest of China.Now,the main approaches to determine the organic carbon concentration of plants are wet burning and dry burning,while the H2SO4-K2Cr2O7 and the elemental analyzer are also used.The former research revealed that the carbon concentration of different species,organs,and the same organs in different species has significant differences.In addition,many factors have the significant effect on carbon concentration,such as woody composition,the relative position of organs,the dry temperature,the regional difference,provenance,climate and site,etc.The study of undergrowth is an important part of the forest carbon storage research.Based on the above key issues,the future research directions were pointed out as: 1) the stability of carbon concentration of the same species at the different regions;2) to refine the influencing factors and increase the accuracy of the carbon sink estimation;3) the differences of carbon concentration in different areas;4) to strengthen the study of the undergrowth carbon concentration.

[10]
Han W X, Wu Y, Tang L Y.et al, 2009. Leaf carbon, nitrogen and phosphorus stoichiometry across plant species in Beijing and its periphery.Acta Scientiarum Naturalium Universitatis Pekinensis, 45(5): 855-860. (in Chinese)Based on a systematic field sampling and lab measurements of 358 native species,the regional stoichiometric patterns of leaf C,N and P in Beijing and its periphery were investigated.The geometric means of leaf C,N and P are 45.1%,2.61% and 0.20%(dry weight),respectively.The content ratios of lamina C,N and P to their petiole counterparts are 1.1,2.4 and 1.8 for C,N and P,respectively,as reflects the stoichiometric relationship between lamina and petiole.Herbs have higher leaf N and P and lower C than woody plants;conifers are significantly lower in leaf N(or higher in leaf C),compared with broadleaves,but there is no significant difference in leaf P between the two growth-forms.Leaf C,N and P are correlated significantly between each other across all species or within growth-forms,with positive relationship between N and P,and negative between C and N(P).The geometric mean mass ratios of leaf C∶N,C∶P and N∶P are 17.3,242 and 13.9,respectively.

[11]
Houghton R A, Skole D L, Nobre C A.et al, 2000. Annual uxes of carbon from deforestation and regrowth in the Brazilian Amazon.Nature, 403(6767): 301-304.The distribution of sources and sinks of carbon among the world's ecosystems is uncertain. Some analyses show northern mid-latitude lands to be a large sink, whereas the tropics are a net source; other analyses show the tropics to be nearly neutral, whereas northern mid-latitudes are a small sink. Here we show that the annual flux of carbon from deforestation and abandonment of agricultural lands in the Brazilian Amazon was a source of about 0.2 Pg Cyr(-1) over the period 1989-1998 (1 Pg is 10(15) g). This estimate is based on annual rates of deforestation and spatially detailed estimates of deforestation, regrowing forests and biomass. Logging may add another 5-10% to this estimate, and fires may double the magnitude of the source in years following a drought. The annual source of carbon from land-use change and fire approximately offsets the sink calculated for natural ecosystems in the region. Thus this large area of tropical forest is nearly balanced with respect to carbon, but has an interannual variability of +/- 0.2 PgC yr(-1).

DOI PMID

[12]
Jagodzinski A M, Jarosiewicz G, Karolewski P.et al, 2012. Carbon concentration in the biomass of common species of understory shrubs.Sylwan, 156(9): 650-662.

[13]
Liu G H, Fu B J, Fang J Y, 2000. Carbon dynamics of Chinese forests and its contribution to global carbon balance.Acta Ecologica Sinica, 20(5): 733-740. (in Chinese)Using the national foreset inventory data that surveyed by the Forestry Ministry of P.R.China from 1973 to 1993,carbon storage of Chinese forest are estimated with the method of regression equation between stand biomass and volume in different forest types.The results show that total carbon storage of Chinese forest in the four periods(1973~1976,1977~1981,1985~1988,1989~1993)were 3.75,4.12, 4.06 and 4.20 Pg C,respectively.Although the results of different periods are fluctuating,their trends are increasing with the time.From 1977 to 1993,the total carbon of Chinese forests had increased 0.45 Pg C and accumulated about 26.5 Tg C per year.It means that Chinese forests played a role as a little sink of atmospheric carbon dioxide in that period.However,mean forest carbon density is decreased with time(The four periods are 39.1、43 1、39 7 and 38.7 Mg C/hm 2,respectively)and far below to the average of global forest.This means that the quality of Chinese forests is very poor,the young forests make up large proportion of Chiese forests.On the other hand,it also reflects that Chinese forests is a huge potential carbon sink in the future if current forests is fostered and managed well.Therefore,foster and management of current forests is very important.

[14]
Ma Q Y, Chen X L, Wang J.et al, 2002. Carbon content rate in constructive species of main forest types in northern China.Journal of Beijing Forestry University, 24(Suppl.1): 96-100. (in Chinese)The tissues' carbon content rates were measured on eight constructive arbor species and ten shrub species in northern China by using the combustion method, and the mean tissues' carbon content rates of these species were 0 475 0, 0 512 5,0 488 0,0 476 4,0 510 5,0 501 0,0 515 8,0 511 8,0 489 7 respectively in Quercus liaotungensis, Betulla platyphylla, Populus davidiana, Tilia mongolica, Pinus tabulaeformis, Platycladus orientalis, Larix principis rupprechtii, Picea koraiensis and ten shrub species(they were Corylus hrterophylla, Ostryopsis davidiana, Lespedeza bicolor, Spiraea pubescens, Rosa xanthina, Syringa oblata, Eleagnaceae umbellate, Lonicera maackii, Acer ginnala and Hippophae rhamnoides ). Based on the biomass data of stand sample plot, the mean carbon content rates of seven stands had been calculated, the results were 0 476 1 in Quercus liaotungensis ,0 500 8 in Betulla platyphylla ,0 485 9 in Populus davidiana ,0 503 0 in Pinus tabulaeformis ,0 505 3 in Platycladus orientalis ,509 7 in Larix principis rupprechtii and 0 511 1 in Picea koraiensis . The variance ratio of the tissues' carbon content rate ranged from 1 49% to 6 32% inner species, and 2 15% to 7 48% between species. The mean tissues' carbon content rates of conifer species were higher than broadleaf species by 1 6% 3 4%, and the carbon content rates of conifer stands were also higher than the broadleaf stands.

DOI

[15]
Navar J, 2009. Allometric equations for tree species and carbon stocks for forests of northwestern Mexico.Forest Ecology and Management, 257(2): 427-434.Allometric equations were developed and applied to forest inventory data to estimate biomass and carbon stocks for temperate species and forests of Durango and Chihuahua and for tropical dry forests of Sinaloa, Mexico. A total of 872 trees were harvested and dissected into their component parts: leaves and branches, boles, and coarse roots. Coarse roots of 40 temperate trees ranging in diameter at breast height (DBH) from 6.0 to 52.9 cm were excavated in their entirety (i.e., >0.5 cm diameter). The species sampled (number of trees) in tropical dry forests (39) were Lysiloma divaricata (Jacq) Macbr. (10), Haematoxylon brasiletto Karst. (10), Cochlospermum vitifolium (Wild.) (5), Ceiba acuminata (S. Watson) Rose (5), Bursera penicillata ( B. inopinnata) (5), and Jatropha angustifolia Mull. Arg. (4) and in temperate forests (833) were Quercus spp. (118) ( Q. rugosa Neé, 15, Quercus sideroxylla Humb. & Bonpl, 51, Quercus spp., 52), Pinus herrerae Martinez 1940 (19), Pinus oocarpa Schiede ex Schlectendal 1838 (31), Pinus engelmannii Carriere 1854 (7), Psudotsuga menziesii (Mirb.) Franco (19), Pinus leiophylla Schiede ex Schlectendal et Chamisso 1831 (27), Pinus teocote Schiede ex Schlectendal et Chamisso (55), Pinus ayacahuite Ehrenb. ex Schltdl. (58), Pinus cooperi Blanco (48), Pinus durangensis Martinez 1942 (385), and Pinus arizonica Engelmann 1879 (66). Allometric equations having only DBH as an independent variable were developed for each component of each species. Since Pinus herrerae, Pinus engelmannii, Pinus oocarpa and Pseudotsuga menziensii had a small number of trees, an individual allometric equation was developed for these species. We used non-linear regression to fit parameters of the typical allometric power equation. The resulting 31 equations (10 species or groups of species, three biomass components; bole, branch and leaves, and total aerial; and the generalized equation for coarse roots) fit the data well and enable the user to predict biomass by component for each of the 10 different groups of species or each of six temperate species. A single allometric equation that incorporates the basic specific gravity for aboveground biomass of all temperate tree species also fit the data well, and this equation provides both the detail and the accuracy supplied by species-specific, plant-part-specific equations. Biomass equations coupled with forest inventory data for temperate (637 circular, 1/10 ha plots) and tropical dry forests (166 20 m × 20 m-quadrats) of northwestern Mexico predict a mean (confidence intervals) of 130 Mg ha 611 (4.2 Mg ha 611) and 73 Mg ha 611 (7.1 Mg ha 611) for total tree and total aboveground biomass, respectively. Large sample sizes and the economic and ecological importance of the species studied make this data set uniquely useful for biomass estimations and for understanding the inherent heterogeneity of tree structure in dynamic tropical and temperate environments of northwestern Mexico.

DOI

[16]
Ren S J, Yu G R, Jiang C M.et al, 2012. Stoichiometric characteristics of leaf carbon, nitrogen, and phosphorus of 102 dominant species in forest ecosystems along the North-South Transect of East China.Chinese Journal of Applied Ecology, 23(3): 581-586. (in Chinese)One hundred and twelve sampling sites in the forest ecosystems along the North-South Transect of Eastern China(NSTEC) were selected to study the stoichiometric characteristics and variability of leaf carbon(C),nitrogen(N),and phosphorous(P) of 102 dominant species.The contents of leaf C(Cmass),leaf N(Nmass),and leaf P(Pmass) ranged in 374.1-646.5 mg·g-1,8.4-30.5 mg·g-1,and 0.6-6.2 mg·g-1,with the arithmetic mean(AM) being 480.1,18.3 and 2.0 mg·g-1,and the variation coefficient(CV) being 11.1%,27.5%,and 56.4%,respectively.The leaf C/N,C/P and N/P ranged from 14.1 to 64.1,from 70.9 to 838.6,and from 1.5 to 21.2,with the AM being 29.1,313.9 and 11.5,and the CV being 32.8%,48.3% and 44.1%,respectively.The mass ratio of C:N:P was 313.9:11.5:1,and the atom ratio was 810.9:25.4:1.As compared with those at global scale,the tree leaf Cmass and C/N in the study area were significantly higher,Nmass and N/P were significantly lower,while Pmass and C/P had less differences.

DOI PMID

[17]
Shvidenko A Z, Nilsson S, Rojkov V A.et al, 1996. Carbon budget of the Russian boreal forests: A systems analysis approach to uncertainty. Apps M J, Price D T. Vol.40. Berlin 33: Springer-Verlag Berlin.The total land area of the Russian boreal zone is 1527.6 Mha, including 1143.0 Mha of Forest Fund areas and 735.8 Mha of forested areas. These estimates are based on Forest State Account data (Goscomles SSSR 1990, 1991). Forest Fund areas include forest land and nonforest land. Forest land is in turn divided into forested areas, covered by closed forests, and unforested areas, designated for forests but temporarily without a forest (sparse forests, burnt areas and dead stands, grassy glades). Non-forest land is represented by unproductive land, such as bogs, rocks, sand, and glaciers, and by land with special uses (forest roads, water reservoirs, and relatively small areas of arable lands, pastures farms, etc., situated on Forest Fund areas). For a more detailed description see, e.g., Nilsson et al. (1992). Nearly 95% of all Russian closed forests are considered boreal. Thus, the Russian boreal forests play an important role in the global carbon (C) cycle

DOI

[18]
Sykes M T, Prentice I C, 1996. Carbon storage and climate change in Swedish forests: A comparison of static and dynamic modelling approaches. Apps M J, Price D T. Vol. 40. Berlin 33: Springer-Verlag Berlin.Changes in the global carbon (C) cycle caused by human activities have focused the attention of environmental scientists on where and how C is distributed through the terrestrial biosphere. Forests are the largest land reservoir for C (e.g., see Kellom ki and Karjalainen, Chapter 5). They also have the potential to be a C sink in the future. However, their future role in this respect depends not only on present and future management practices, but also on how the vegetation responds to climate changes that may already be underway.

DOI

[19]
Tolunay D, 2009. Carbon concentrations of tree components, forest floor and understorey in young Pinus sylvestris stands in north-western Turkey.Scandinavian Journal of Forest Research, 24(5): 394-402.

DOI

[20]
Turner D P, Koerper G J, Harmon M E.et al, 1995. A carbon budget for forests of the conterminous United States.Ecological Applications, 5(2): 421-436.

DOI

[21]
Wang J L, Wang X H, Yue C R.et al, 2012. Carbon content rate in dominant species of four forest types in Shangrila, northwest Yunnan province.Ecology and Environmental Sciences, 21(4): 613-619. (in Chinese)The biomass and carbon content rate of trees of forest communities are two key factors in research on forest vegetation carbon storage.Their measurement is the basis for estimating forest carbon storage at both regional and country levels.The carbon content of four main tree species in northwest Yunnan(Shangri-la) were measured based on the standard solution of potassium dichromate method,and the carbon content rate in different tree species,different aged stands and different organs were analyzed.The results indicated that the carbon content rates of these tree species were 51.48%,51.31%,50.79% and 48.71% respectively in Pinus yunnanensis,Pinus densata,Abies georgei and Quercus aquifolioides.The carbon content varied slightly among different aged stands of the same tree species,but the differences were slight and not exceed 3%.Also the carbon content rate varied with different organs in the same tree species and the same organs in different tree species,but these differences were also small and did not exceed 6%.The experimental results also showed that the carbon content rates in conifer stands were higher than that of the broadleaf stands.

DOI

[22]
Wang S Q, Yu G R, 2008. Ecological stoichiometry characteristics of ecosystem carbon, nitrogen and phosphorus elements.Acta Ecologica Sinica, 28(8): 3937-3947. (in Chinese)

[23]
Wang X K, Feng Z W, Ouyang Z Y, 2001. Vegetation carbon storage and density of forest ecosystems in China.Chinese Journal of Applied Ecology, 12(1): 13-16. (in Chinese)To improve the estimatation of carbon pool of forest ecosystems is very important in studying their CO 2 emission and uptake. The estimation of vegetation carbon pool in China has just begun. There is a significant difference among estimates from different methods applied. Based on forest inventory recorded by age class, the vegetation carbon storage of forest ecosystems in China was estimated to be 3.26~3.73Pg, accounting for 0.6~0.7% of the global pool. The carbon densities were difference among forest types and provinces, in range of 6.47~118.14Mg·hm -2 .There is an incremental tendency from southeast to north and west. This trend is negatively related with the change in population density in logarithmic mode, which indicates that the actual forest carbon density is prominently determined by human activities.

PMID

[24]
Xie Z Q, Tang Z Y, Zhao C M. et al, 2015. Observation and Investigation for Carbon Sequestration in Shrub Ecosystemss. Beijing: Science Press. (in Chinese)

[25]
Yang C H, 2001. Plant Geography. Beijing: Science Press. (in Chinese)

[26]
Yang Y J, Chen Y M, Cao Y, 2014. Carbon density and distribution ofPinus tabulaeformis plantation ecosystem in hilly Loess Plateau. Acta Ecologica Sinica, 34(8): 2128-2136. (in Chinese)Currently,most studies related to carbon storage focus on the arbor layer; however,few in-depth studies have analyzed the variations in carbon storage allocation of different layers of plant communities with different stand ages. To estimate carbon density of Pinus tabulaeformis plantation ecosystems for different stand ages more accurately,we tracked 9-, 23-,33- and 47-year-old P. tabulaeformis plantations in the Hilly Loess Plateau region of China and studied the carbon content in plant organs,litter and soil,as well as the carbon storage and its allocation in different layers. By analyzing carbon sequestration characteristics of P. tabulaeformis plantations at different age stages,this paper provides a theoretical basis of evaluating the function of carbon sinks in P. tabulaeformis plantations during forest management. In addition,thecarbon density of the forest ecosystems was measured and evaluated based on "The Research Norms of Chinese Forest Ecosystem Carbon Sequestration,Rate and Potential",which provides a basis for comparative study of cross-regional forest types. The main results were as follows.( 1) Average biomass in the different components of the studied forest ecosystems were in the order of: arbor layer( 76. 12 t / hm2) litter layer( 14. 56 t/hm2) undergrowth vegetation layer( combined herb and shrub layer vegetation; 3. 66 t / hm2). The biomass of the arbor layer of P. tabulaeformis increased with stand age. The Pinus arbor organ biomass was as follows: stem accounted for the largest share,followed by leaves and roots,the contribution of branches and bark were minimal. Undergrowth biomass first increased then decreased with increasing tree age,while litterfall biomass increased with tree age. The biomasses of shrub organs were markedly different,which showed that biomass of branches roots leaves. In the herb layer,the above-ground portion of biomass was significantly greater than the underground portion.( 2) The average carbon content was 50. 2% for P. tabulaeformis and for different organs the order was leaves( 53. 3%) branches( 51. 4%) bark( 50. 6%) stems( 49. 8%) roots( 47. 3%). The amount of carbon stored in the shrub,herb and litter layers was 44. 5%,43. 8% and 40. 6%,respectively. Shrub carbon content of various organs was in the order of branches( 46. 0%) leaves( 44. 8%) roots( 42. 5%). The carbon content of herbs was greater in the above-ground portion( 45. 2%) than in the underground portion( 40. 2%). Forest age had no significant effect on the carbon content of arbor organs. The carbon content of different shrub organs was significantly different for each herb species. The carbon content of soil( 0 100 cm) was between 0. 3 and 2. 7% and had an obvious vertical distribution characteristic: the surface soil layer had a higher carbon content and carbon content gradually decreased as soil depth increased.( 3) Forest age was a dominant factor affecting the carbon density of the P. tabulaeformis forest community. The carbon density of 9-,23-,33- and 47-year-old P. tabulaeformis forests was 70. 49,100. 94,167. 09 and 144. 93 t / hm2, respectively. Carbon density in different components of the studied forest ecosystems was in the order of: soil layer vegetation layer litter layer. The proportion of vegetation carbon density increased with increasing tree age continually, whereas that of soil carbon density had the opposite pattern. 9-,23-,33- and 47-year-old P. tabulaeformis forest arbor layer carbon densities increased with stand age( 0. 90,26. 56,59. 73 and 60. 20 t / hm2,respectively),as did carbon density in the litter layer. The vegetation layer and soil layer carbon density first increased and then decreased with increasing stand age.

DOI

[27]
Yerena-Yamallel J I, J Jiménez-Pérez, O A Aguirre-Calderón.et al, 2011. ConcentraciÓn De Carbono En La Biomasa AÉrea Del Matorral Espinoso Tamaulipeco.Revista Chapingo Serie Ciencias Forestales Y Del Ambiente, XVII(2): 283-291.

DOI

[28]
Yu G R, Ren W, Chen Z.et al, 2016. Construction and progress of Chinese terrestrial ecosystem carbon, nitrogen and water fluxes coordinated observation.Journal of Geograhical Sciences, 26(7): 803-826.Eddy Covariance technique(EC) achieves the direct measurement on ecosystem carbon, nitrogen and water fluxes, and it provides scientific data for accurately assessing ecosystem functions in mitigating global climate change. This paper briefly reviewed the construction and development of Chinese terrestrial ecosystem flux observation and research network(China FLUX), and systematically introduced the design principle and technology of the terrestrial ecosystem carbon, nitrogen and water fluxes coordinated observation system of China FLUX. In addition, this paper summarized the main progress of China FLUX in the ecosystem carbon, nitrogen and water exchange and environmental controlling mechanisms, the spatial pattern of carbon, nitrogen and water fluxes and biogeographical mechanisms, and the regional terrestrial ecosystem carbon budget assessment. Finally, the prospects and emphases of the terrestrial ecosystem carbon, nitrogen and water fluxes coordinated observation of China FLUX are put forward to provide theoretical references for the development of flux observation and research in China.

DOI

[29]
Yu Y, Fan W Y, Li M Z, 2012. Forest carbon rates at different scales in Northeast China forest area.Chinese Journal of Applied Ecology, 23(2): 341-346. (in Chinese)To accurately estimate forest carbon storage is of significance in researching terrestrial ecosystem carbon cycle and global change.Based on the survey data from the representative plots in Northeast China forest area (Da Xing'an Mountains,Xiao Xing'an Mountains,Zhangguangcai Mountains and Changbai Mountains) in 2007 and 2008 and the inventory data in the same period,and by using the models for estimating ground tree biomass,shrub biomass,and grass biomass and the Multi N/C 3000 for measuring forest carbon rate in laboratory,this paper calculated the forest biomass and carbon storage in the forest area,and analyzed the variation and stability of the forest carbon rates at different scales.There was an obvious difference in the carbon rates among tree organs,being the highest in leaf (0.4448),followed by in branch (0.4422),bark (0.4398),and trunk (0.4351).In Changbai and Zhangguangcai Mountains,coniferous forest had a higher carbon rate than broad-leaved forest;whereas in Daxing'an and Xiaoxing'an mountains,it was in adverse.In Northeast China forest area,the forest carbon rates were relatively stable,with a total value of 0.44.

DOI PMID

[30]
Zhao M, Yue T, Na Z.et al, 2014. Combining LPJ-GUESS and HASM to simulate the spatial distribution of forest vegetation carbon stock in China.Journal of Geographical Sciences, 24(2): 249-268.It is very important in accurately estimating the forests' carbon stock and spatial distribution in the regional scale because they possess a great rate in the carbon stock of the terrestrial ecosystem. Yet the current estimation of forest carbon stock in the regional scale mainly depends on the forest inventory data,and the whole process consumes too much labor,money and time. And meanwhile it has many negative influences on the forest carbon storage updating. In order to figure out these problems,this paper,based on High Accuracy Surface Modeling (HASM),proposes a forest vegetation carbon storage simulation method. This new method employs the output of LPJ-GUESS model as initial values of HASM and uses the inventory data as sample points of HASM to simulate the distribution of forest carbon storage in China. This study also adopts the seventh forest resources statistics of China as the data source to generate sample points,and it also works as the simulation accuracy test. The HASM simulation shows that the total forest carbon storage of China is 9.2405 Pg,while the calculated value based on forest resources statistics are 7.8115 Pg. The forest resources statistics is taken based on a forest canopy closure,and the result of HASM is much more suitable to the real forest carbon storage. The simulation result also indicates that the southwestern mountain region and the northeastern forests are the important forest carbon reservoirs in China,and they account for 39.82% and 20.46% of the country's total forest vegetation carbon stock respectively. Compared with the former value (1975-1995),it manifests that the carbon storage of the two regions do increase clearly. The results of this research show that the large-scale reforestation in the last decades in China attains a significant carbon sink.

DOI

[31]
Zheng W J, Bao W K, Gu B.et al, 2007. Carbon concentration and its characteristics in terrestrial higher plants.Chinese Journal of Ecology, 26(3): 307-313. (in Chinese)A precise estimation of vegetation carbon storage is the key of illustrating the effects of vegetative restoration on the carbon balance in terrestrial ecosystem.In common,this carbon storage is estimated by carbon concentration coefficient and biomass.This paper collected the actual data of various plants carbon concentration,and analyzed the characteristics of the carbon concentration in different plant life types,plant tissues,and different areas.The results showed that plant carbon concentration was in the range of 24.95%-55.44%,with an average of(43.63卤0.14)%.The average carbon concentration of different life types was arbor(46.22%)shrub(45.93%)bryophyte(41.64%)herbage(37.13%),and that of different tissues was flower(48.52%)fruit(47.19%)branch(45.42%)stem(44.48%)leaf(43.36%)root(42.88%).As for different geographical areas,the average carbon concentration was high latitude area(50.30%)low latitude area(45.30%)middle latitude area(39.68%),and there were significant differences among different climatic types.As a result,error always existed when fixed coefficients were used to estimate the carbon storage.

[32]
Zhou G Y, Wen D Z, Tang X L. et al, 2015. Observation and Investigation for Carbon Sequestration in Forest Ecosystemss. Beijing: Science Press. (in Chinese)

[33]
Zhou Y R, Yu Z L, Zhao S D, 2000. Carbon storage and budget of major Chinese forest types.Acta Phytoecologica Sinica, 24(5): 518-522. (in Chinese)The regional characteristics of carbon storage and carbon dioxide fluxes of major Chinese forest ecosystems were studied from the points of internal biological cycle, based on published data regarding forest biomass, productivity, the organic carbon content of soil profile, stand and annual weight of the litter, soil respiration etc. The results are as follows: the average carbon density of Chinese forest ecosystem is 258. 83 t .hm-2, showing a generally increasing trend with increasing latitude; carbon density of the vegetation, soil and litter is 57. 07 t hm-2, 193. 55 t .hm-2, and 8. 21 t.hm-2, respectively ; the characteristics of the carbon density of these three fractions (vegetation, soil, lit-ter) were also analyzed ; from the recent areal data provided by the Ministry of Forestry of China in 1989-1993 the total carbon storage of Chinese forests was estimated to be 281. 16 X 108 t, in which the vegetation, soil and litter were 62. 00X 108 t, 210. 23 X 108 t, 8. 92 X 108 t, making up 22. 2%, 74. 6%, 3. 2%, respectively of the total, the carbon storage of deciduous broad-leaved forests, warmer temperate coniferous forests, evergreen / evergreen- deciduous broad-leaved forests, Picea-Abies forests, and Larix forests were the major carbon pool of the forest, making up 87 % of the total; in China the net flux between the forest ecosystem and the atmosphere is 4. 80 X 108 t .a-1, and the forest ecosystem acts as a carbon sink when exchanged with the atmosphere, absorbing 48. 7% of the carbon dioxide from burning of biomass, fossil fuel and human respiration (9. 87 X 108 t .a-1 ). Generally, the carbon dioxide fixing capacity of the deciduous forest is higher than the coniferous forests, decreasing with increasing latitude.

Outlines

/