Research Articles

Dynamic changes of habitats in China’s typical national nature reserves on spatial and temporal scales

  • ZHU Ping , 1, 2 ,
  • HUANG Lin , 1, * ,
  • XIAO Tong 3 ,
  • WANG Junbang 4
Expand
  • 1. Key Laboratory of Land Surface Pattern and Simulation, Institute of Geographic Sciences and Natural Resources Research, CAS, Beijing 100101, China
  • 2. University of Chinese Academy of Sciences, Beijing 100049, China
  • 3. Satellite Environment Center, Ministry of Environmental Protection, Beijing 100094, China
  • 4. Key Laboratory of Ecosystem Network Observation and Modeling, Institute of Geographic Sciences and Natural Resources Research, CAS, Beijing 100101, China
*Corresponding author: Huang Lin, PhD and Associate Professor, specialized in land use change and its ecological effects. E-mail:

Author: Zhu Ping, Master Student, specialized in remote sensing of ecology. E-mail:

Received date: 2017-10-27

  Accepted date: 2017-12-30

  Online published: 2018-06-20

Supported by

The National Key Research and Development Program, No.2017YFC0506404

The Key Programs for Frontier Science of the Chinese Academy of Sciences, No.QYZDB-SSW-DQC005

The National Science & Technology Pillar Program, No.2013BAC03B00

Copyright

Journal of Geographical Sciences, All Rights Reserved

Abstract

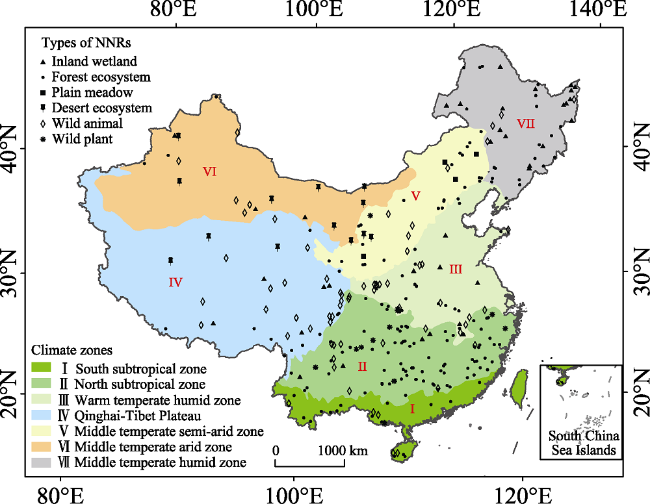
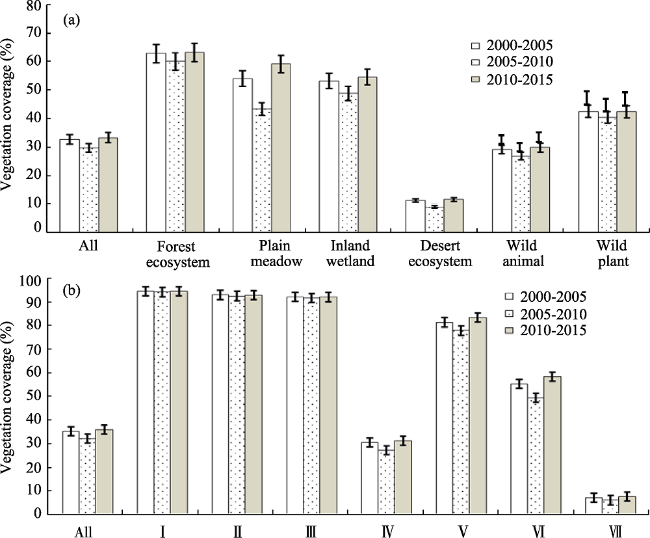
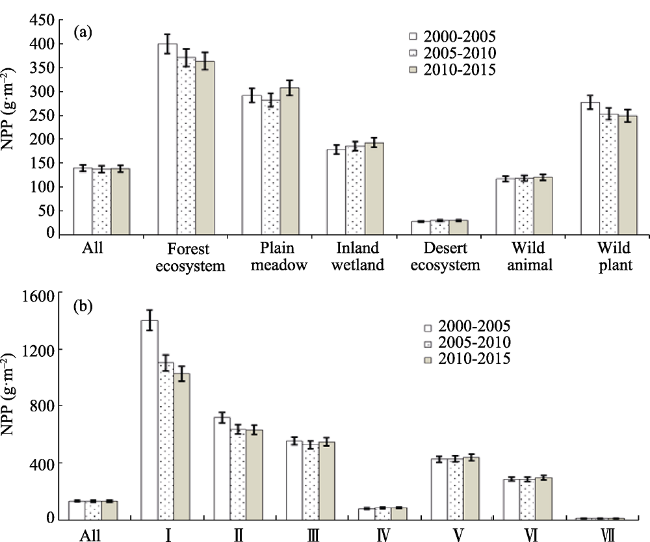
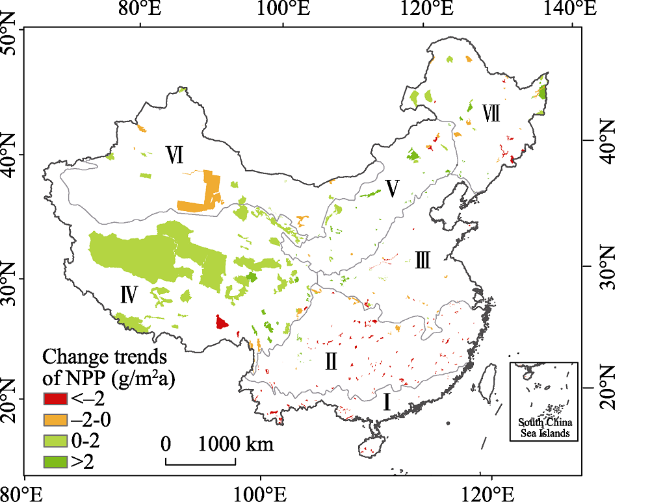
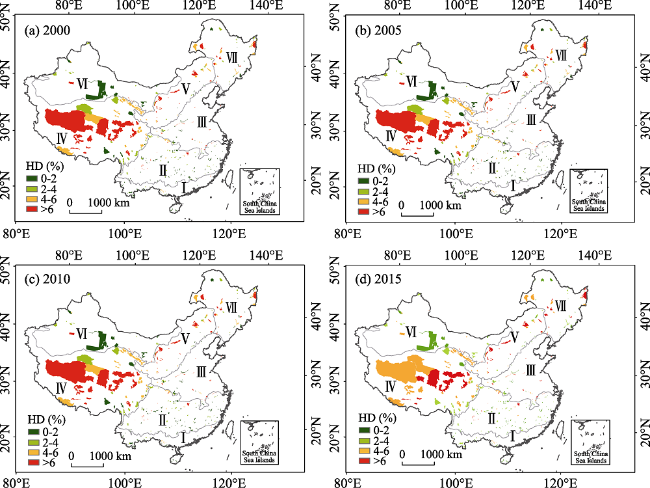
Until 2015, China had established 2740 nature reserves with a total area of 1.47 million km2, covering 14.8% of China’s terrestrial land surface. Based on remote sensing inversion, ecological model simulation and spatial analysis methods, we analyzed the spatial and temporal variations of fractional vegetation coverage (FVC), net primary production (NPP), and human disturbance (HD) in habitats of typical national nature reserves (NNRs) during the first 15 years of the 21st century from 2000 to 2015. And then the three indicators were compared between different NNR types and varied climate zones. The results showed that (1) the average 5-year FVC of NNRs increased from 36.3% to 37.1%, and it improved in all types of NNRs to some extent. The annual average FVC increased by 0.11%, 0.84%, 0.21%, 0.09%, 0.11% and 0.08% in NNRs of forest ecosystem, plain meadow, inland wetland, desert ecosystem, wild animal and wild plant, respectively. (2) The NPP annually increased by 2.06 g·m-2, 1.23 g·m-2, 0.28 g·m-2 and 0.4 g·m-2 in NNRs of plain meadow, inland wetland, desert ecosystem and wild animal, respectively. However, it decreased by 3.45 g·m-2 and 2.35 g·m-2 in NNRs of forest ecosystem and wild plant respectively. (3) In the past 15 years, besides the slight decreases in the NNRs located at the Qinghai-Tibet Plateau and the south subtropical zone, HD enhanced in most of NNRs, especially HD in the warm temperate humid zone increased from 4.7% to 5.35%.

Cite this article

ZHU Ping , HUANG Lin , XIAO Tong , WANG Junbang . Dynamic changes of habitats in China’s typical national nature reserves on spatial and temporal scales[J]. Journal of Geographical Sciences, 2018 , 28(6) : 778 -790 . DOI: 10.1007/s11442-018-1504-y

1 Introduction

“Nature reserve” refers to certain areas (land, waters or sea area) with special legal protection and management that aims to protect the representative nature ecosystem, rare and endangered wildlife species with natural concentrated distribution, and natural relics with special significance. Establishment of protected areas (PAs) is one of the most important approaches for biodiversity conservation (Howard et al., 2000; MEA, 2003; Radeloff et al., 2010; Stein et al., 2008) and is a cultural response to the perceived threats to nature (McNeely, 1994). PAs are recognized as the most important core units for in situ conservation (Maiorano et al., 2008). The value of nature reserves and what they are established to conserve are changing because society is constantly changing (Chape et al., 2005). The International Union for Conservation of Nature (IUCN) classified PAs into nature reserves, national parks, natural monuments, habitat/species management areas, protected landscape/seascapes and managed resource protected areas (Anon, 1994; Wang et al., 2004). Different types of PAs offer different levels of protection. China has their own classification of PAs, which is quite different from the IUCN management categories. In China, nature reserves are the most strictly managed type of PAs, and are classified into natural ecosystems (forest ecosystem, plain meadow, inland wetland, desert ecosystem), wildlife (wild animal, wild plant) and natural monuments (geological relics, archaeological remains), based on the main objectives of protection and the management goal to a certain extent (Xue et al., 1994).
With increasing human pressure on the natural resources, effective PAs system is of great significance for conserving biodiversity or slowing the rate of biodiversity loss (Chape et al., 2005). Held in Bali Island in 1982, the World Parks Congress recommended that all nations should strive to cover 10% of its terrestrial lands under protection (Naughton-Treves et al., 2005). As of 2014, more than 0.2 million PAs had been established worldwide, which accounted for approximately 15.4% of the terrestrial area of the earth (Juffe-Bignoli et al., 2014). The Ministry of Environmental Protection of the People’s Republic of China announced that China had established 2740 nature reserves with a total area of 1.47 million km2 as of 2015, covering 14.8% of China’s terrestrial land surface and including 428 NNRs of all nature reserves. With the growth of the area under protection, research on PAs has become more significant (Soutullo, 2010). In recent years, some debates related to the effectiveness of PAs were discussed between academia and management departments (Liu et al., 2003; Quan et al., 2010; Thomas et al., 2012). The importance of PAs under the background of climate change became the academic hotspot, because climate change may shift the distribution of species (Liu et al., 2003).
Previous studies of nature reserves mainly focused on the setting rationality, the management effectiveness, the influencing factors of the nature reserves, the impact of nature reserves on the regional economy and society. However, due to the data qualities of species, the spatial precision of nature reserves’ boundaries and other factors, the controversy occurred regarding the relative importance as to which areas need priority conservation. Under the background of climate change, the benefits of PAs for biodiversity have been questioned, because PAs are static, whereas the distributions of species are dynamic (Thomas et al., 2012). The effectiveness of nature reserves depends on many local factors such as politics and economy, and there are many effectiveness evaluation methods (Hockings, 2003; Maiorano et al., 2008). However, a unified standard has not yet been formed (Chape et al., 2005). On the one hand, the effectiveness of PAs is increasingly threatened by climate change and human activities, although the degree of this threat is unknown. Urbanization, real estate development and road construction seriously affected the nature reserves as a “Noah’s ark” protection and reduced the effective size of the nature reserves (Foley et al., 2005; McDonald et al., 2008). Global degradation of biodiversity is closely tied to the current and future urbanization (McDonald et al., 2008). On the other hand, PAs have impact on the ecosystem by maintaining traditional livelihoods, keeping energy balance, regulating local climate, preventing forest fires, etc. (Walker et al., 2009).
Most nature reserves are located in high-poverty areas. There is a contradiction between achieving ecosystem conservation goals by limiting resource exploitation and reducing or eliminating poverty (Naughton-Treves et al., 2005). In developing countries, limiting the exploitation of natural resources may generate new poverty or reinforce existing poverty. Research also found that the establishment of nature reserves can reduce poverty because there is no correlation between poverty and reduced deforestation (Ferraro et al., 2011). Some studies evaluated the effectiveness of reserves by comparing the inside and outside of PAs (Bruner et al., 2001; Naughton-Treves et al., 2005; Oliveira et al., 2007), especially in rich, biodiverse tropical forest regions, such as the Amazon and the Congo (Joppa et al., 2008; Walker et al., 2009). Combined with different resolution levels of satellite images and field survey data, the effectiveness of nature reserves was evaluated by forest decrease or deforestation reduction (Radeloff et al., 2010; Ferraro et al., 2011). Intensive human activities were found in adjacent areas of nature reserves became hotspot areas (Barbier et al., 2001; Andam et al., 2008; Foley et al., 2005). A large amount of forest set aside as a “green barrier” in the Brazilian Amazon region to eliminate spillover effects (Soares-Filho et al., 2010).
Although the rapidly increasing quantity of nature reserves, many doubts have arisen that some reserves may be ‘‘paper parks’’ rather than achieving sustainable conservation outcomes (Liu et al., 2003; Quan et al., 2010). In China, the past research studying the rationality of the reserve setting, the effectiveness of reserve management, the influencing factors of reserves, and the regional social and economic impacts of reserves mainly concentrated on a single area or the individual index (Fan et al., 2012; Zhang et al., 2016; Zheng et al., 2012). The incomplete datasets of biodiversity and habitat, the unclear boundaries of the nature reserves and the varied background of the ecosystem led to difficulties in evaluating the effectiveness of the nature reserves and understanding whether the nature reserves are achieving biodiversity conservation. In this paper, NPP and FVC were selected to respond to the condition and trends of ecosystem, and the dynamic changes of habitats and human disturbance (HD) were analyzed to illustrate the intensity of human activities. We chose typical NNRs as study areas. The spatial and temporal patterns of FVC, NPP and HD were analyzed, and dynamic changes of habitats in different NNR types and located in varied climate zones were evaluated.

2 Materials and methods

2.1 Study areas

In addition to sea coast and aquatic animal NNRs, we selected 299 typical NNRs established after the year 2000 as the study area. The typical NNRs consist of 167 forest ecosystem NNRs, 4 plain meadow NNRs, 36 inland wetland NNRs, 13 desert ecosystem NNRs, 67 wild plant NNRs, and 13 wild animal NNRs. The boundaries of the NNRs were collected from the website of the Ministry of Environmental Protection (http://www.zhb.gov.cn/stbh/ zrbhq/gjjzrbhqps/) and digitalized by referring to topography and high-resolution satellite images. Terrestrial China was divided into seven climate zones according to China’s new climatic scheme, proposed by Zheng et al. (2010), and combined with the regional geographic differences and the spatial distribution of the NNRs. Among them, 22 NNRs were located in the south subtropical zone, 102 NNRs in the north subtropical zone, 42 NNRs in the warm temperate humid zone, 38 NNRs in the Qinghai-Tibet Plateau, 42 NNRs in the middle temperate humid zone, 35 NNRs in the middle temperate semi- arid zone, and 19 NNRs in the middle temperate arid zone (Figure 1).
Figure 1 Spatial distribution of 299 typical NNRs in China

2.2 Estimation of fractional vegetation coverage

The MODIS NDVI products from 2000 to 2015 with 1 km spatial resolution and 16-day temporal resolution were collected and processed by S-G filtering methods. The fractional vegetation coverage was calculated by using the dimidiate pixel model based on the assumption that a pixel of NDVI mixed the information of green vegetation and non-vegetation. Therefore, FVC could be calculated by the following equation, where FVC is calculated with a 5% confidence interval. NDVImax is the NDVI value of pure green vegetation pixels, and NDVImin is the NDVI value of pure non-vegetation pixels.
$FVC=\frac{NDVI-NDV{{I}_{min}}}{NDV{{I}_{max}}-NDV{{I}_{min}}}$ (1)
The general change trends (slo) were analyzed by the least squares method as follows, where i is the serial number from the year of 2000 to 2015, i=1, 2, 3, …, n. If the slo is positive, the FVC change trend of that pixel is increased. Conversely, the FVC is decreased.
$slo=\frac{n\times \sum\limits_{i=1}^{n}{(i\times FVC)-\sum\limits_{i=1}^{n}{i}\sum\limits_{i=1}^{n}{FVC}}}{n\times \sum\limits_{i=1}^{n}{{{i}^{2}}-{{\left( \sum\limits_{i=1}^{n}{i} \right)}^{2}}}}$ (2)

2.3 The model simulation of net primary production

The ecological model applied to simulate NPP can be classified into statistical model, processing model, mechanism model and remote sensing model, with typical representatives such as the Carnegie Ames Stanford Approach (CASA), Global Production Efficiency Mod- el (GLOPEM), Photosynthesis (PSN) and Vegetation Photosynthesis Model (VPM). Theremote sensing model has the advantages of less input parameters, and the driving variables can be obtained from remote sensing data directly. Due to the uncertainties of model simu- lation, accurate simulations need various kinds of full evaluation by flux observation data at the ecosystem scale. GLOPEM was established based on the theory of physiological ecology, and it had been evaluated to achieve ideal outputs based on the validation of the forest ecosystem and the plain meadow after parameter localization (Wang et al., 2009).
In this study, the GLOPEM model was applied to simulate NPP, which is calculated by the difference between gross primary production (GPP) and autotrophic respiration (Ra).
$NPP=GPP-{{R}_{a}}$ (3)
GPP is calculated by modeling efficiency for solar energy utilization (εg), fraction of photosynthetically active radiation (FPAR), and modeling absorbed photosynthetically active radiation (APAR).
$GPP=APAR\cdot {{\varepsilon }_{g}}$ (4)
$APAR=PAR\cdot FPAR$ (5)
where PAR is photosynthetically active radiation, determined by the radiation calculation method in climatology.
Ra was calculated as follows,where Rm is the maintenance respiration, and Rg is the growing respiration.
${{R}_{a}}=f({{R}_{m}})+{{R}_{g}}$ (6)
Finally, NPP is simulated from 2000 to 2015 with a spatial resolution of 1 km for each typical NNR, and the NPP change trends are analyzed by the least squares method.

2.4 Quantification of human activities

The land use and land cover datasets for the years 2000, 2005, 2010 and 2015 were collected from Liu et al. (2014) with a 100 m spatial resolution, including 6 aggregated classes and 25 hierarchical classes. The datasets were evaluated by using the field investigation of Zhang et al. (2012). According to evaluation verification in 10% of the counties in China, the comprehensive evaluation accuracy was 94.3% (Liu et al., 2014).
Based on the land use and land cover datasets, human disturbance is defined as the degree of utilization, transformation, and exploitation of the land surface in a certain region (Xu et al., 2015). We analyzed the area changes of artificial land use types (cropland, built-up areas) in NNRs, and then calculated human disturbance with a spatial resolution of 100 m. Human disturbance is calculated by the following equations, where HD is an index of human disturbance; SC is the equivalent area of construction; S is total area of study area; i is the type of land use and land cover change; SLi is the real area of i; CIi is a conversion factor for land use and land cover transformed to built-up areas, according to the strength of the human activities on the land surface.
$HD=\frac{{{S}_{c}}}{S}\times 100%$ (7)
${{S}_{C}}=\sum\limits_{i=1}^{n}{S{{L}_{i}}\cdot C{{I}_{i}}}$ (8)
Based on the attributes of the land surface, the values of CIi (Table 1) were defined by referring to Xu et al. (2015).
Table 1 Conversion factor of different land use and land cover types
Land use and land cover Cropland Artificial forest Reservoir Built-up areas Others
Conversion factor 0.2 0.133 0.6 1 0

3 Results and analysis

3.1 The spatial and temporal variations of FVC in NNRs

From 2000 to 2015, the annual average FVC of NNRs increased by 0.8% from 36.3% to 37.1%, with an annual growth of 0.13% for the 15 years (Figure 2a). Of all types of NNRs, the FVC in forest ecosystem NNRs increased by 0.5% from 69.4% to 69.9%, with an annual growth of 0.11%. FVC in plain meadow NNRs increased by 5.6% from 59.8% to 65.4%, with an annual growth of 0.84%. In inland wetland NNRs, FVC increased by 1.5% from 58.9% to 60.4%, with an annual growth of 0.21%. In desert ecosystem NNRs, it increased by 0.5% from 12.8% to 13.3%, with an annual growth of 0.09%. FVC in wild animal NNRs increased by 0.7% from 32.6% to 33.3%, with an annual growth of 0.11%. Conversely, FVC in wild plant NNRs decreased by 0.2% from 47.2% to 47% (Figure 2a).
Figure 2 The average FVC in typical NNRs (a) with different types and (b) located in varied climate zones
Of all climate zones (Figure 2b), the FVC of NNRs in the middle temperate humid zone increased by 2.1%, from 83.9% to 86%, with an annual growth of 0.27%. The FVC of NNRs in the middle temperate semi-arid zone increased by 3.2%, from 57% to 60.2%, with an annual growth of 0.51%. The FVC of NNRs in the middle temperate arid zone increased by 0.5%, from 7.3% to 7.8%, with an annual growth of 0.07%. The FVC of NNRs in the Qinghai-Tibet Plateau increased by 0.6%, from 31.5% to 32.1%, with an annual growth of 0.12%. The FVC of NNRs in south subtropical zone increased by only 0.1%. The FVC of NNRs in north subtropical zone decreased from 95.9% to 95.8% and has maintained 94.9% in warm temperate humid zone.
From the spatial variations of FVC in typical NNRs from 2000 to 2015 (Figure 3), we can see that the increasing trends occurred in the northern Qinghai-Tibet Plateau, middle temperate arid and semi-arid zones, and parts of the middle temperate humid zone. Especially, the increasing trends of FVC were obvious in the NNRs of Sanjiangyuan, Qiangtang, Mount Qomolangma, Hoh Xil, Altun Mountain, Qilian Mountain, Lop Nor, Xilingol League, Erdos, and Hongze Lake Wetland. The annual average FVC showed slight increases in NNRs of Greater Khingan Range, West Lake of Dunhuang, Zoige Wetland, Haizi Mountain, and Aden. However, FVC evidently decreased in NNRs of Selin Co, the middle reaches of the Yarlung Zangbo River, Wolong, Taibai Mountain, Eastern Dongting Lake, Nanling Mountains, Wuyi Mountains, and Changbai Mountain.
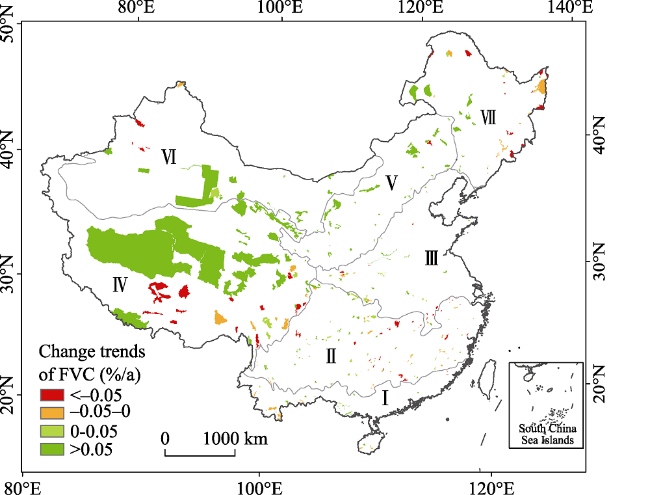
Figure 3 Spatial variations of FVC in typical NNRs from 2000 to 2015

3.2 The spatial and temporal variations of NPP in NNRs

From 2000 to 2015, the annual average NPP of NNRs decreased from 140.49 g·m‒2 to 139.77 g·m‒2 with an annual decline of 0.04 g·m‒2·a‒1 for the 15 years (Figure 4a). Of all types of NNRs, NPP in forest ecosystem NNRs decreased by 35.9 g·m‒2, from 398.2 g·m‒2 to 362.3 g·m‒2, with an annual decline of 3.45 g·m‒2·a‒1. NPP in wild plant NNRs decreased by 28.3 g·m‒2, from 277.2 g·m‒2 to 248.9 g·m‒2, with an annual decline of 2.35 g·m‒2·a‒1. Meanwhile, NPP in plain meadow, inland wetland, desert ecosystem, and wild animal NNRs increased by 15.4 g·m‒2, 14.1 g·m‒2, 1.9 g·m‒2, and 1.4 g·m‒2, respectively.
Figure 4 The average NPP in typical NNRs (a) with different types and (b) located in varied climate zones
From the spatial variations of NPP in NNRs from 2000 to 2015 (Figure 5), we can see that increasing trends occurred in the Qinghai-Tibet Plateau, middle temperate semi-arid zone and partly middle temperate humid zone. Especially, the increasing trends of NPP were obvious in NNRs of Zoige Wetland, Haizi Mountain, Aden, Zhouzhi, Taibai Mountain, Daqing Mountain, Xilingol League, and Wutai Mountain. The annual average NPP showed a slight increase in NNRs of Sanjiangyuan, Qiangtang, Mount Qomolangma, Hoh Xil, Altun Mountains, Qilian Mountain, Selin Co, Gongga Mountain, West Erdos, Helan Mountains in Inner Mongolia, Horqin, and the Greater Khingan Range. However, NPP evidently decreased in NNRs of Yarlung Zangbo Grand Canyon, Xishuangbanna, Leigong Mountain, Nanling Mountains, Wuyi Mountains, Changbai Mountain, and the Songhua River.
Figure 5 Spatial variations of NPP in typical NNRs from 2000 to 2015

3.3 Dynamics of human activities in the past 15 years

From 2000 to 2015, the area of cropland increased in 44 typical NNRs and decreased in 125 typical NNRs. The built-up areas increased in 111 typical NNRs and decreased in 15 typical NNRs. In different types of NNRs, we can see that the area of cropland increased the most in inland wetland NNRs (Figure 6a), a response to the enhanced disturbance of agricultural activities. The decreased cropland area in forest ecosystem NNRs means that agricultural activities were well limited. The built-up areas increased the most in the middle temperate semi-arid zone and the least in the middle temperate humid zone (Figure 6b).
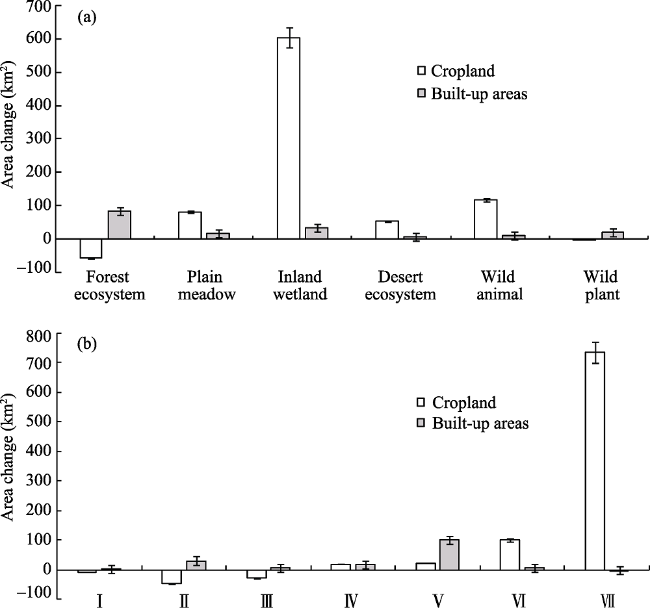
Figure 6 The area changes of cropland and built-up areas in typical NNRs (a) with different types and (b) located in varied climate zones
The average HD in typical NNRs decreased from 5.72% to 4.83% in the past 15 years. Of all types of NNRs, HD decreased from 6.93% to 4.49% in desert ecosystem NNRs and decreased from 4.04% to 3.47% in wild animal NNRs. In contrast, HD increased from 3.61% to 3.93% in forest ecosystem NNRs, increased from 7.22% to 7.44% in plain meadow NNRs, dramatically increased from 6.69% to 7.37% in inland wetland NNRs, and increased from 5.5% to 6.02% in wild plant NNRs.
In all climate zones, HD dramatically decreased from 6.46% to 5.32% in NNRs of the Qinghai-Tibet Plateau, especially in the NNRs of Qiangtang, Altun Mountains, Selin Co, and Haizi Mountain. However, the slight increasing trend of HD in the entire Qinghai-Tibet Plateau (Xu et al., 2015; Zhao et al., 2015) showed the effectiveness of NNRs. HD in the NNRs of the middle temperate arid zone decreased dramatically from 2.16% to 1.44%, which was especially obvious in the NNR of the Tarim Populus Euphratica. The obvious decreasing trend of HD in the middle temperate arid zone may be affected by the Grain for Green Program (Liu et al., 2014; Xu et al., 2015; Zhao et al., 2015). Conversely, HD evidently increased in typical NNRs located in other zones. The HD of NNRs increased from 1.54% to 2.06% in the south subtropical zone, from 2.99% to 3.24% in the north subtropical zone, from 4.7% to 5.35% in the warm temperate humid zone, from 4.61% to 4.93% in the middle temperate humid zone, and from 6.31% to 6.63% in the middle temperate semi-arid zone. In eastern China, HD occurred at a higher level and strengthened in recent years due to high population density and urbanization (Xu et al., 2015; Zhao et al., 2015). By contrast, the HD of NNRs in those regions showed a lower level and enhanced slightly (Figure 7).
Figure 7 Spatial distribution of HD in typical NNRs for the years of 2000, 2005, 2010 and 2015

4 Conclusions and discussion

From 2000 to 2015, FVC of typical NNRs with different types and located in varied climate zones have an increasing trend generally. In addition to decreased NPP in forest ecosystem and wild plant NNRs due to deforestation, NPP in other types of NNRs increased in recent 15 years. The weakening trends of HD in typical NNRs in recent 15 years could be partly contributed to the effectiveness of limiting human activities in NNRs, especially in the middle temperate arid zone, the Qinghai-Tibet Plateau and parts of the middle temperate humid zone. However, increasing HD occurred in NNRs located in the North China Plain, hilly area of East China, and Loess Plateau, due to urban expansion and increasing population. Located in the East Asian monsoon region, China responds to global climate change sensitively. Climate change has huge impacts on ecosystems and is expected to be the main factors of species extinction in the 21st century (Thomas et al., 2004; Pereira et al., 2010). The impact of climate change on ecosystems has evoked a lot of discussion in recent years. Studies have shown that the impacts of climate change on species are mainly reflected in the composition and interaction of population, the range and distribution of the species, NPP, and the structure and changes of ecosystems (Beaumont et al., 2011). Both climate change and human activity play important roles in biodiversity and ecosystem services (Pereira et al., 2012; Titeux et al., 2016; Struebig et al., 2015). Many studies on the impact of climate change on biodiversity (Bellard et al., 2012; Staudinger et al., 2013; Pacifici et al., 2015) showed that future climate change is predicted to generate latitudinal or altitudinal shifts in species ranges (Maes et al., 2010; Barbet-Massin et al., 2015), reduce the effectiveness of conservation areas (Araújo et al., 2011), or increase the risks of species extinction (Thomas et al., 2004; Urban, 2015).
In the Qinghai-Tibet Plateau, climate change directly influences the starting date of the vegetation growing season, and it may expand the length of the plant growing season, which is closely related to NPP (Zhang et al., 2013; Shen et al., 2015). The degradation of biodiversity and ecosystems is concurrently impacted by human activities. Studies showed that the interior of some nature reserves are still under the influence of human activities, especially in coastal areas, with the growth of population density and the expansion of urbanization. Human activities in NNRs mainly include the construction of roads and other facilities, and unreasonable exploitation activities such as rock excavation, sand excavation and mining. As the most strictly managed types of PAs, nature reserves should have limited or even forbidden human activities within their areas.
Although the protection from human activities continues to increase, the habitats of NNRs are influenced both by climate change and human activities, and it is difficult for us to judge the contribution of NNRs to the habitat changes. Distinguishing the contribution rate of climate change and human activities will be the key step toward assessing the effectiveness of PAs and will be also the further research focus. Our research is incomplete, because it used only three indicators of FVC, NPP and HD to evaluate the habitat changes of nature reserves. Different types of nature reserves have different protection purposes, it is insufficient to evaluate them with these few indicators. In view of the shortcomings, we should establish a corresponding index system for different types of nature reserves to assess habitat change properly, identify the function of nature reserves under the background of climate change, and evaluate habitat change and ecosystem vulnerability under future climate scenarios. In addition, we should further explore how to reduce the impacts of human activities and improve the effectiveness of NNRs under the background of rapid urbanization and increasing population. Furthermore, it is necessary to compare the conditions inside and outside of the NNRs.

The authors have declared that no competing interests exist.

[1]
Andam K S, Ferraro P J, Pfaff A.et al, 2008. Measuring the effectiveness of protected area networks in reducing deforestation.Proceedings of the National Academy of Sciences USA, 105(42): 16089-16094.Global efforts to reduce tropical deforestation rely heavily on the establishment of protected areas. Measuring the effectiveness of these areas is difficult because the amount of deforestation that would have occurred in the absence of legal protection cannot be directly observed. Conventional methods of evaluating the effectiveness of protected areas can be biased because protection is not randomly assigned and because protection can induce deforestation spillovers (displacement) to neighboring forests. We demonstrate that estimates of effectiveness can be substantially improved by controlling for biases along dimensions that are observable, measuring spatial spillovers, and testing the sensitivity of estimates to potential hidden biases. We apply matching methods to evaluate the impact on deforestation of Costa Rica's renowned protected-area system between 1960 and 1997. We find that protection reduced deforestation: approximately 10% of the protected forests would have been deforested had they not been protected. Conventional approaches to evaluating conservation impact, which fail to control for observable covariates correlated with both protection and deforestation, substantially overestimate avoided deforestation (by over 65%, based on our estimates). We also find that deforestation spillovers from protected to unprotected forests are negligible. Our conclusions are robust to potential hidden bias, as well as to changes in modeling assumptions. Our results show that, with appropriate empirical methods, conservation scientists and policy makers can better understand the relationships between human and natural systems and can use this to guide their attempts to protect critical ecosystem services.

DOI PMID

[2]
Anon A, 1994. Guidelines for protected area management categories. IUCN and the World Conservation Monitoring Centre, Gland, Switzerland and Cambridge, UK.

[3]
Araújo M B, Alagador D, Cabeza M.et al, 2011. Climate change threatens European conservation areas.Ecology Letters, 14(5): 484-492.lt;P>Europe has the world’s most extensive network of conservation areas. Conservation areas are selected without taking into account the effects of climate change. How effectively would such areas conserve biodiversity under climate change? We assess the effectiveness of protected areas and the Natura 2000 network in conserving a large proportion of European plant and terrestrial vertebrate species under climate change. We found that by 2080, 58 ± 2.6% of the species would lose suitable climate in protected areas, whereas losses affected 63 ± 2.1% of the species of European concern occurring in Natura 2000 areas. Protected areas are expected to retain climatic suitability for species better than unprotected areas (P < 0.001), but Natura 2000 areas retain climate suitability for species no better and sometimes less effectively than unprotected areas. The risk is high that ongoing efforts to conserve Europe’s biodiversity are jeopardized by climate change. New policies are required to avert this risk.</P>

DOI PMID

[4]
Barbet-Massin M, Jetz W, 2015. The effect of range changes on the functional turnover, structure and diversity of bird assemblages under future climate scenarios.Global Change Biology, 21(8): 2917-2928.Abstract Animal assemblages fulfill a critical set of ecological functions for ecosystems that may be altered substantially as climate change-induced distribution changes lead to community disaggregation and reassembly. We combine species and community perspectives to assess the consequences of projected geographic range changes for the diverse functional attributes of avian assemblages worldwide. Assemblage functional structure is projected to change highly unevenly across space. These differences arise from both changes in the number of species and changes in species relative local functional redundancy or distinctness. They sometimes result in substantial losses of functional diversity that could have severe consequences for ecosystem health. Range expansions may counter functional losses in high-latitude regions, but offer little compensation in many tropical and subtropical biomes. Future management of local community function and ecosystem services thus relies on understanding the global dynamics of species distributions and multiscale approaches that include the biogeographic context of species traits.

DOI PMID

[5]
Barbier E B, Burgess J C, 2001. The economics of tropical deforestation.Journal of Economic Surveys, 15: 413-433.

[6]
Beaumont L J, Pitman A, Perkins S.et al, 2011. Impacts of climate change on the world’s most exceptional ecoregions.Proceedings of the National Academy of Sciences USA, 108(6): 2306-2311.The current rate of warming due to increases in greenhouse gas (GHG) emissions is very likely unprecedented over the last 10,000 y. Although the majority of countries have adopted the view that global warming must be limited to < 2 C, current GHG emission rates and nonagreement at Copenhagen in December 2009 increase the likelihood of this limit being exceeded by 2100. Extensive evidence has linked major changes in biological systems to 20th century warming. The "Global 200" comprises 238 ecoregions of exceptional biodiversity [Olson DM, Dinerstein E (2002) Ann Mo Bot Gard 89:199-224]. We assess the likelihood that by 2070, these iconic ecoregions will regularly experience monthly climatic conditions that were extreme in 1961-1990. Using > 600 realizations from climate model ensembles, we show that up to 86% of terrestrial and 83% of freshwater ecoregions will be exposed to average monthly temperature patterns > 2 SDs (2) of the 1961-1990 baseline, including 82% of critically endangered ecoregions. The entire range of 89 ecoregions will experience extreme monthly temperatures with a local warming of < 2 C. Tropical and subtropical ecoregions, and mangroves, face extreme conditions earliest, some with < 1 C warming. In contrast, few ecoregions within Boreal Forests and Tundra biomes will experience such extremes this century. On average, precipitation regimes do not exceed 2 of the baseline period, although considerable variability exists across the climate realizations. Further, the strength of the correlation between seasonal temperature and precipitation changes over numerous ecoregions. These results suggest many Global 200 ecoregions may be under substantial climatic stress by 2100.

DOI PMID

[7]
Bellard C, Bertelsmeier C, Leadley P.et al, 2012. Impacts of climate change on the future of biodiversity.Ecology Letters, 15(4): 365-377.

DOI

[8]
Bruner A G, Gullison R E, Rice R E.et al, 2001. Effectiveness of parks in protecting tropical biodiversity.Science, 291(5501): 125-128.

DOI

[9]
Chape S, Harrison J, Spalding M.et al, 2005. Measuring the extent and effectiveness of protected areas as an indicator for meeting global biodiversity targets.Philosophical Transactions of the Royal Society B: Biological Sciences, 360(1454): 443-455.There are now over 100 000 protected areas worldwide, covering over 12% of the Earth's land surface. These areas represent one of the most significant human resource use allocations on the planet. The importance of protected areas is reflected in their widely accepted role as an indicator for global targets and environmental assessments. However, measuring the number and extent of protected areas only provides a unidimensional indicator of political commitment to biodiversity conservation. Data on the geographic location and spatial extent of protected areas will not provide information on a key determinant for meeting global biodiversity targets: 'effectiveness' in conserving biodiversity. Although tools are being devised to assess management effectiveness, there is no globally accepted metric. Nevertheless, the numerical, spatial and geographic attributes of protected areas can be further enhanced by investigation of the biodiversity coverage of these protected areas, using species, habitats or biogeographic classifications. This paper reviews the current global extent of protected areas in terms of geopolitical and habitat coverage, and considers their value as a global indicator of conservation action or response. The paper discusses the role of the World Database on Protected Areas and collection and quality control issues, and identifies areas for improvement, including how conservation effectiveness indicators may be included in the database to improve the value of protected areas data as an indicator for meeting global biodiversity targets.

DOI PMID

[10]
Fan Zemeng, Zhang Xuan, Li Jing.et al, 2012. Transition trends of land-cover in national nature reserves of China.Acta Geographica Sinica, 67(12): 1623-1633. (in Chinese)A large number of nature reserves have been established in China aiming to prevent ecosystem degradation,protect natural habitats and conserve the biodiversity within the habitats.By the end of 2010,a total of 2588 nature reserves has been established in China and their total area was 149.44 million hectares,covering over 15% of China's total land area.As the primary driver of biodiversity change,land-cover change has direct effect on ecosystem structures and functions.Thus,a quantitative analysis of changes in the land-cover of nature reserves is a critical step for evaluating the effectiveness and improving the management policies of nature reserves.In terms of the ecosystem characteristics and its major protected objects,180 National Nature Reserves(NNRs)are chosen and classified into 7 types in this paper.A Land-cover Transform Direction Index(LTDI)is developed on the basis of the contribution of each land-cover type to maintaining the ecosystem stability.In Northeast China,North China,East China,South China,Central-southern China,Northwest and Southwest China,LTDI is used to calculate the transition trend of land-cover in the core zone,buffer zone and experimental zone of each NNRs type during the period from the late 1980s to 2005.The results show that the mean transition rate of all selected NNRs types has become lower during the two decades.The land-cover transform rate of Southwest China was the largest,while that of East China was the smallest among the six regions.The mean positive and negative transform rates of land-cover in all core zones decreased by 0.69% and 0.16% respectively.The landscape pattern of land-cover in the core zones was more stable than that in the buffer zones and the experimental zones.The land-cover transformed rate of NNRs was less than that of Non-NNRs in general.Furthermore,the ecological diversity and patch connectivity of land-cover in the whole selected area increased generally during the period 1995-2005.In summary,the land-cover of NNRs in China has a beneficial change trend after the NNRs were established,especially during the period from 1995 to 2005.

DOI

[11]
Ferraro P J, Hanauer M M, Sims K R, 2011. Conditions associated with protected area success in conservation and poverty reduction.Proceedings of the National Academy of Sciences USA, 108(34): 13913-13918.

DOI

[12]
Foley J A, DeFries R, Asner G P.et al, 2005. Global consequences of land use.Science, 309(5734): 570-574.

DOI

[13]
Hockings M, 2003. Systems for assessing the effectiveness of management in protected areas.BioScience, 53(9): 823-832.

DOI

[14]
Howard P C, Davenport T R B, Kigenyi F W.et al, 2000. Protected area planning in the tropics: Uganda’s national system of forest nature reserves.Conservation Biology, 14(3): 858-875.Uganda is one of the most biologically diverse countries in Africa, with much of its biodiversity represented in a system of 10 national parks, 10 wildlife reserves, and 710 forest reserves, covering 33,000 km2and the other half to environmental protection (with 20% as nature reserves). To select suitable sites, a 5-year, US$1-million program of biodiversity and resource assessment was undertaken, focusing on five biological indicator species groups and covering all the major forest reserves. Based on data generated by the field studies, we ranked each forest in terms of various criteria-(species richness rarity, value for nonconsumptive uses, timber production, and importance to local communities)-and used an iterative site selection procedure to choose the most suitable combination of forests for nature reserve establishment. Our procedure maximized complementarity in representing species and habitats in reserves across the whole protected-area system. We initially selected sites using purely biological criteria but later modified our procedure to ensure that opportunity costs and potential land-use conflicts were minimized. Our preferred network of sites included 14 forests that, in combination with the existing national parks, would account for 96% of species represented in the country's protected areas. These 14 forests were classified as "prime" and "core" sites and were selected for the establishment of large nature reserves (averaging 100 km2). The addition of 25 smaller "secondary" forest nature reserves (averaging 32 km2) would protect more than 99% of the indicator species.

DOI

[15]
Quan Jia, Ouyang Zhiyun, Xu Weihua.et al, 2010. Comparison and applications of methodologies for management effectiveness assessment of protected areas.Biodiversity Science, 18(1): 90-99. (in Chinese)Establishment of protected areas is one of the most important approaches for biodiversity conservation.Assessment of management effectiveness of protected areas is critical to understand the management situation,to improve the management level,and to achieve the management targets.Based on the World Commission on Protected Areas(WCPA) of IUCN framework for assessing management effectiveness of protected areas and protected area systems,specific assessment methodologies have been developed and implemented in many countries according to their own situations.The assessment methodologies are generally generalized into four types,including in-depth evidence-based assessments,comprehensive system-wide peer-based assess-ments,rapid expert-based scorecard,and categorical assumption-based assessments.In the present paper,we compare the four types in terms of application scales,targets,objectives,assessment forms,advantages,disadvantages and adaptable situations.Eight categories of methodologies are summarized in terms of the assessment indicators and current application status.On the basis of this analysis,applications and problems of the assessment methodologies in China are further discussed and a proper assessment indicator system is proposed.

DOI

[16]
Joppa L N, Loarie S R, Pimm S L, 2008. On the protection of “protected areas”.Proceedings of the National Academy of Sciences USA, 105(18): 6673-6678.Tropical moist forests contain the majority of terrestrial species. Human actions destroy between 1 and 2 million km of such forests per decade, with concomitant carbon release into the atmosphere. Within these forests, protected areas are the principle defense against forest loss and species extinctions. Four regions-the Amazon, Congo, South American Atlantic Coast, and West Africa-once constituted about half the world's tropical moist forest. We measure forest cover at progressively larger distances inside and outside of protected areas within these four regions, using datasets on protected areas and land-cover. We find important geographical differences. In the Amazon and Congo, protected areas are generally large and retain high levels of forest cover, as do their surroundings. These areas are protected de facto by being inaccessible and will likely remain protected if they continue to be so. Deciding whether they are also protected de jure-that is, whether effective laws also protect them-is statistically difficult, for there are few controls. In contrast, protected areas in the Atlantic Coast forest and West Africa show sharp boundaries in forest cover at their edges. This effective protection of forest cover is partially offset by their very small size: little area is deep inside protected area boundaries. Lands outside protected areas in the Atlantic Coast forest are unusually fragmented. Finally, we ask whether global databases on protected areas are biased toward highly protected areas and ignore "paper parks." Analysis of a Brazilian database does not support this presumption.

DOI PMID

[17]
Juffe-Bignoli D, Burgess N D, Bingham H.et al, 2014. Protected Planet Report 2014. UNEP-WCMC: Cambridge, UK.

[18]
Liu J Y, Kuang W H, Zhang Z X.et al, 2014. Spatiotemporal characteristics, patterns, and causes of land-use changes in China since the late 1980s.Journal of Geographical Sciences, 24(2): 195-210.Land-use/land-cover changes (LUCCs) have links to both human and nature interactions. China's Land-Use/cover Datasets (CLUDs) were updated regularly at 5-year intervals from the late 1980s to 2010,with standard procedures based on Landsat TM\ETM+ images. A land-use dynamic regionalization method was proposed to analyze major land-use conversions. The spatiotemporal characteristics,differences,and causes of land-use changes at a national scale were then examined. The main findings are summarized as follows. Land-use changes (LUCs) across China indicated a significant variation in spatial and temporal characteristics in the last 20 years (1990-2010). The area of cropland change decreased in the south and increased in the north,but the total area remained almost unchanged. The reclaimed cropland was shifted from the northeast to the northwest. The built-up lands expanded rapidly,were mainly distributed in the east,and gradually spread out to central and western China. Woodland decreased first,and then increased,but desert area was the opposite. Grassland continued decreasing. Different spatial patterns of LUC in China were found between the late 20th century and the early 21st century. The original 13 LUC zones were replaced by 15 units with changes of boundaries in some zones. The main spatial characteristics of these changes included (1) an accelerated expansion of built-up land in the Huang-Huai-Hai region,the southeastern coastal areas,the midstream area of the Yangtze River,and the Sichuan Basin;(2) shifted land reclamation in the north from northeast China and eastern Inner Mongolia to the oasis agricultural areas in northwest China;(3) continuous transformation from rain-fed farmlands in northeast China to paddy fields;and (4) effectiveness of the "Grain for Green" project in the southern agricultural-pastoral ecotones of Inner Mongolia,the Loess Plateau,and southwestern mountainous areas. In the last two decades,although climate change in the north affected the change in cropland,policy regulation and economic driving forces were still the primary causes of LUC across China. During the first decade of the 21st century,the anthropogenic factors that drove variations in land-use patterns have shifted the emphasis from one-way land development to both development and conservation.The "dynamic regionalization method" was used to analyze changes in the spatial patterns of zoning boundaries,the internal characteristics of zones,and the growth and decrease of units. The results revealed "the pattern of the change process," namely the process of LUC and regional differences in characteristics at different stages. The growth and decrease of zones during this dynamic LUC zoning,variations in unit boundaries,and the characteristics of change intensities between the former and latter decades were examined. The patterns of alternative transformation between the "pattern" and "process" of land use and the causes for changes in different types and different regions of land use were explored.

DOI

[19]
Liu J G, Ouyang Z Y, Pimm S L.et al, 2003. Protecting China’s biodiversity.Science, 300(5623): 1240-1241.

DOI

[20]
Maes D, Titeux N, Hortal J.et al, 2010. Predicted insect diversity declines under climate change in an already impoverished region.Journal of Insect Conservation, 14(5): 485-498.Being ectotherms, insects are predicted to suffer more severely from climate change than warm-blooded animals. We forecast possible changes in diversity and composition of butterflies, grasshoppers and dragonflies in Belgium under increasingly severe climate change scenarios for the year 2100. Two species distribution modelling techniques (Generalised Linear Models and Generalised Additive Models), were combined via a conservative version of the ensemble forecasting strategy to predict present-day and future species distributions, considering the species as potentially present only if both modelling techniques made such a prediction. All models applied were fair to good, according to the AUC (area under the curve of the receiver operating characteristic plot), sensitivity and specificity model performance measures based on model evaluation data. Butterfly and grasshopper diversity were predicted to decrease significantly in all scenarios and species-rich locations were predicted to move towards higher altitudes. Dragonfly diversity was predicted to decrease significantly in all scenarios, but dragonfly-rich locations were predicted to move upwards only in the less severe scenarios. The largest turnover rates were predicted to occur at higher altitudes for butterflies and grasshoppers, but at intermediate altitudes for dragonflies. Our results highlight the challenge of building conservation strategies under climate change, because the changes in the sites important for different groups will not overlap, increasing the area needed for protection. We advocate that possible conservation and policy measures to mitigate the potentially strong impacts of climate change on insect diversity in Belgium should be much more pro-active and flexible than is the case presently.

DOI

[21]
Maiorano L, Falcucci A, Boitani L, 2008. Size-dependent resistance of protected areas to land-use change.Proceedings of the Royal Society B: Biological Sciences, 275(1640): 1297-1304.One of the major threats facing protected areas (PAs) is land-use change and habitat loss. We assessed the impact of land-use change on PAs. The majority of parks have been effective at protecting the ecosystems within their borders, even in areas with significant land-use pressures. More in particular, the capacity of PAs to slow down habitat degradation and to favour habitat restoration is clearly related to their size, with smaller areas that on average follow the dominant land-use change pattern into which they are embedded. Our results suggest that small parks are not going to be viable in the long term if they are considered as islands surrounded by a 'human-dominated ocean'. However, small PAs are, in many cases, the only option available, implying that we need to devote much more attention to the non-protected matrix in which PAs must survive.

DOI PMID

[22]
McDonald R I, Kareiva P, Forman R T, 2008. The implications of current and future urbanization for global protected areas and biodiversity conservation.Biological Conservation, 141(6): 1695-1703.Due to human population growth and migration, there will be nearly 2 billion new urban residents by 2030, yet the consequences of both current and future urbanization for biodiversity conservation are poorly known. Here we show that urban growth will have impacts on ecoregions, rare species, and protected areas that are localized but cumulatively significant. Currently, 29 of the world 825 ecoregions have over one-third of their area urbanized, and these 29 ecoregions are the only home of 213 endemic terrestrial vertebrate species. Our analyses suggest that 8% of terrestrial vertebrate species on the IUCN Red List are imperiled largely because of urban development. By 2030, 15 additional ecoregions are expected to lose more than 5% of their remaining undeveloped area, and they contain 118 vertebrate species found nowhere else. Of the 779 rare species with only one known population globally, 24 are expected to be impacted by urban growth. In addition, the distance between protected areas and cities is predicted to shrink dramatically in some regions: for example, the median distance from a protected area to a city in Eastern Asia is predicted to fall from 43 km to 23 km by 2030. Most protected areas likely to be impacted by new urban growth (88%) are in countries of low to moderate income, potentially limiting institutional capacity to adapt to new anthropogenic stresses on protected areas. In short, trends in global ecoregions, rare species, and protected areas suggest localized but significant biodiversity degradation associated with current and upcoming urbanization.

DOI

[23]
McNeely J A, 1994. Protected areas for the 21st century: Working to provide benefits to society.Biodiversity & Conservation, 3(5): 390-405.Since the first national park was created at Yellowstone in the USA in 1872, over 8500 protected areas have been established worldwide. Virtually all countries have seen the wisdom of protecting areas of outstanding importance to society, and such sites now cover over 5% of Earth's land surface. However, many of these protected areas exist only on paper, not on the ground. Most are suffering from a combination of threats, including pollution, over-exploitation, encroachment, poaching, and many others. In a period of growing demands on resources and shrinking government budgets, new approaches are required to ensure that protected areas can continue to make their contributions to society. First and foremost, protected areas must be designed and managed in order to provide tangible and intangible benefits to society. This will involve integrating protected areas into larger planning and management frameworks, linking protected areas to biodiversity and climate change, promoting greater financial support for protected areas, and expanding international cooperation in the finance, development and management of protected areas.

DOI

[24]
Millennium Ecosystem Assessment Board, 2003. Ecosystems and human well-being. Washington,DC: Island Press.

[25]
Naughton-Treves L, Holland M, Brandon K, 2005. The role of protected areas in conserving biodiversity and sustaining local livelihoods.Annual Review of Environment and Resources, 30: 219-252.The world's system of protected areas has grown exponentially over the past 25 years, particularly in developing countries where biodiversity is greatest. Concurrently, the mission of protected areas has expanded from biodiversity conservation to improving human welfare. The result is a shift in favor of protected areas allowing local resource use. Given the multiple purposes of many protected areas, measuring effectiveness is difficult. Our review of 49 tropical protected areas shows that parks are generally effective at curtailing deforestation within their boundaries. But deforestation in surrounding areas is isolating protected areas. Many initiatives now aim to link protected areas to local socioeconomic development. Some of these initiatives have been successful, but in general expectations need to be tempered regarding the capacity of protected areas to alleviate poverty. Greater attention must also be paid to the broader policy context of biodiversity loss, poverty, and unsustainable land use in developing countries.

DOI

[26]
Oliveira P J C, Asner G P, Knapp D E.et al, 2007. Land-use allocation protects the Peruvian Amazon.Science, 317(5842): 1233-1236.

DOI

[27]
Pacifici M, Foden W B, Visconti P.et al, 2015. Assessing species vulnerability to climate change.Nature Climate Change, 5(3): 215-224.The effects of climate change on biodiversity are increasingly well documented, and many methods have been developed to assess species' vulnerability to climatic changes, both ongoing and projected in the coming decades. To minimize global biodiversity losses, conservationists need to identify those species that are likely to be most vulnerable to the impacts of climate change. In this Review, we summarize different currencies used for assessing species' climate change vulnerability. We describe three main approaches used to derive these currencies (correlative, mechanistic and trait-based), and their associated data requirements, spatial and temporal scales of application and modelling methods. We identify strengths and weaknesses of the approaches and highlight the sources of uncertainty inherent in each method that limit projection reliability. Finally, we provide guidance for conservation practitioners in selecting the most appropriate approach(es) for their planning needs and highlight priority areas for further assessments.

DOI

[28]
Pereira H M, Leadley P W, Proença V.et al, 2010. Scenarios for global biodiversity in the 21st century.Science, 330: 1496-1501.

DOI

[29]
Pereira H M, Navarro L M, Martins I S, 2012. Global biodiversity change: The bad, the good, and the unknown.Annual Review of Environment and Resources, 37(1): 25-50.Global biodiversity change is one of the most pressing environmental issues of our time. Here, we review current scientific knowledge on global biodiversity change and identify the main knowledge gaps. We discuss two components of biodiversity change—biodiversity alterations and biodiversity loss—across four dimensions of biodiversity: species extinctions, species abundances, species distributions, and genetic diversity. We briefly review the impacts that modern humans and their ancestors have had on biodiversity and discuss the recent declines and alterations in biodiversity. We analyze the direct pressures on biodiversity change: habitat change, overexploitation, exotic species, pollution, and climate change. We discuss the underlying causes, such as demographic growth and resource use, and review existing scenario projections. We identify successes and impending opportunities in biodiversity policy and management, and highlight gaps in biodiversity monitoring and models. Finally, we discuss how the eco...

DOI

[30]
Radeloff V C, Stewart S I, Hawbaker T J.et al, 2010. Housing growth in and near United States protected areas limits their conservation value.Proceedings of the National Academy of Sciences USA, 107(2): 940-945.Protected areas are crucial for biodiversity conservation because they provide safe havens for species threatened by land-use change and resulting habitat loss. However, protected areas are only effective when they stop habitat loss within their boundaries, and are connected via corridors to other wild areas. The effectiveness of protected areas is threatened by development; however, the extent of this threat is unknown. We compiled spatially-detailed housing growth data from 1940 to 2030, and quantified growth for each wilderness area, national park, and national forest in the conterminous United States. Our findings show that housing development in the United States may severely limit the ability of protected areas to function as a modern "Noah's Ark." Between 1940 and 2000, 28 million housing units were built within 50 km of protected areas, and 940,000 were built within national forests. Housing growth rates during the 1990s within 1 km of protected areas (20% per decade) outpaced the national average (13%). If long-term trends continue, another 17 million housing units will be built within 50 km of protected areas by 2030 (1 million within 1 km), greatly diminishing their conservation value. US protected areas are increasingly isolated, housing development in their surroundings is decreasing their effective size, and national forests are even threatened by habitat loss within their administrative boundaries. Protected areas in the United States are thus threatened similarly to those in developing countries. However, housing growth poses the main threat to protected areas in the United States whereas deforestation is the main threat in developing countries.

DOI PMID

[31]
Shen M G, Piao S L, Cong N.et al, 2015. Precipitation impacts on vegetation spring phenology on the Tibetan Plateau.Global Change Biology, 21(10): 3647-3656.Abstract The ongoing changes in vegetation spring phenology in temperate/cold regions are widely attributed to temperature. However, in arid/semiarid ecosystems, the correlation between spring temperature and phenology is much less clear. We test the hypothesis that precipitation plays an important role in the temperature dependency of phenology in arid/semiarid regions. We therefore investigated the influence of preseason precipitation on satellite-derived estimates of starting date of vegetation growing season (SOS) across the Tibetan Plateau (TP). We observed two clear patterns linking precipitation to SOS. First, SOS is more sensitive to interannual variations in preseason precipitation in more arid than in wetter areas. Spatially, an increase in long-term averaged preseason precipitation of 1002mm corresponds to a decrease in the precipitation sensitivity of SOS by about 0.0102day02mm611. Second, SOS is more sensitive to variations in preseason temperature in wetter than in dryer areas of the plateau. A spatial increase in precipitation of 1002mm corresponds to an increase in temperature sensitivity of SOS of 0.2502day02°C611 (0.25 day SOS advance per 102°C temperature increase). Those two patterns indicate both direct and indirect impacts of precipitation on SOS on TP. This study suggests a balance between maximizing benefit from the limiting climatic resource and minimizing the risk imposed by other factors. In wetter areas, the lower risk of drought allows greater temperature sensitivity of SOS to maximize the thermal benefit, which is further supported by the weaker interannual partial correlation between growing degree days and preseason precipitation. In more arid areas, maximizing the benefit of water requires greater sensitivity of SOS to precipitation, with reduced sensitivity to temperature. This study highlights the impacts of precipitation on SOS in a large cold and arid/semiarid region and suggests that influences of water should be included in SOS module of terrestrial ecosystem models for drylands.

DOI PMID

[32]
Soares-Filho B, Moutinho P, Nepstad D.et al, 2010. Role of Brazilian Amazon protected areas in climate change mitigation.Proceedings of the National Academy of Sciences USA, 107(24): 10821-10826.Protected areas (PAs) now shelter 54% of the remaining forests of the Brazilian Amazon and contain 56% of its forest carbon. However, the role of these PAs in reducing carbon fluxes to the atmosphere from deforestation and their associated costs are still uncertain. To fill this gap, we analyzed the effect of each of 595 Brazilian Amazon PAs on deforestation using a metric that accounts for differences in probability of deforestation in areas of pairwise comparison. We found that the three major categories of PA (indigenous land, strictly protected, and sustainable use) showed an inhibitory effect, on average, between 1997 and 2008. Of 206 PAs created after the year 1999, 115 showed increased effectiveness after their designation as protected. The recent expansion of PAs in the Brazilian Amazon was responsible for 37% of the region's total reduction in deforestation between 2004 and 2006 without provoking leakage. All PAs, if fully implemented, have the potential to avoid 8.0 2.8 Pg of carbon emissions by 2050. Effectively implementing PAs in zones under high current or future anthropogenic threat offers high payoffs for reducing carbon emissions, and as a result should receive special attention in planning investments for regional conservation. Nevertheless, this strategy demands prompt and predictable resource streams. The Amazon PA network represents a cost of US$147 53 billion (net present value) for Brazil in terms of forgone profits and investments needed for their consolidation. These costs could be partially compensated by an international climate accord that includes economic incentives for tropical countries that reduce their carbon emissions from deforestation and forest degradation.

DOI PMID

[33]
Soutullo A, 2010. Extent of the global network of terrestrial protected areas.Conservation Biology, 24: 362-363.

DOI

[34]
Staudinger M D, Carter S L, Cross M S.et al, 2013. Biodiversity in a changing climate: A synthesis of current and projected trends in the US.Frontiers in Ecology and the Environment, 11(9): 465-473.This paper provides a synthesis of the recent literature describing how global biodiversity is being affected by climate change and is projected to respond in the future. Current studies reinforce earlier findings of major climate-change-related impacts on biological systems and document new, more subtle after-effects. For example, many species are shifting their distributions and phenologies at faster rates than were recorded just a few years ago; however, responses are not uniform across species. Shifts have been idiosyncratic and in some cases counterintuitive, promoting new community compositions and altering biotic interactions. Although genetic diversity enhances species' potential to respond to variable conditions, climate change may outpace intrinsic adaptive capacities and increase the relative vulnerabilities of many organisms. Developing effective adaptation strategies for biodiversity conservation will not only require flexible decision-making and management approaches that account for uncertainties in climate projections and ecological responses but will also necessitate coordinated monitoring efforts.

DOI

[35]
Stein B A, Scott C, Benton N, 2008. Federal lands and endangered species: The role of military and other federal lands in sustaining biodiversity.Bioscience, 58: 339-347.The US government has multiple responsibilities for the protection of endangered species, many of them stemming from its role as the nation's largest landowner. To explore how endangered and imperiled species are distributed across the federal estate, we carried out a geographic information system (GIS)-based analysis using natural heritage species occurrence data. In this 10-year update of a previous analysis, we found that the Department of Defense and the USDA Forest Service harbor more species with formal status under the Endangered Species Act (ESA) than other US agencies. The densities of ESA status species and imperiled species are at least three times higher on military lands—2.92 and 3.77, respectively, per 100,000 hectares—than on any other agency's lands. Defense installations in Hawaii are especially significant; more than one-third of all ESA status species on military lands are Hawaiian. These findings highlight the continued importance of public lands for the survival of America's plant and animal species.

DOI

[36]
Struebig M J, Fischer M, Gaveau D L A.et al, 2015. Anticipated climate and land-cover changes reveal refuge areas for Borneo’s Orang-Utans.Global Change Biology, 21(8): 2891-2904.Abstract Habitat loss and climate change pose a double jeopardy for many threatened taxa, making the identification of optimal habitat for the future a conservation priority. Using a case study of the endangered Bornean orang-utan, we identify environmental refuges by integrating bioclimatic models with projected deforestation and oil-palm agriculture suitability from the 1950s to 2080s. We coupled a maximum entropy algorithm with information on habitat needs to predict suitable habitat for the present day and 1950s. We then projected to the 2020s, 2050s and 2080s in models incorporating only land-cover change, climate change or both processes combined. For future climate, we incorporated projections from four model and emission scenario combinations. For future land cover, we developed spatial deforestation predictions from 1002years of satellite data. Refuges were delineated as suitable forested habitats identified by all models that were also unsuitable for oil palm – a major threat to tropical biodiversity. Our analyses indicate that in 2010 up to 2600200002km2 of Borneo was suitable habitat within the core orang-utan range; an 18–24% reduction since the 1950s. Land-cover models predicted further decline of 15–30% by the 2080s. Although habitat extent under future climate conditions varied among projections, there was majority consensus, particularly in north-eastern and western regions. Across projections habitat loss due to climate change alone averaged 63% by 2080, but 74% when also considering land-cover change. Refuge areas amounted to 2000–420200002km2 depending on thresholds used, with 900–170200002km2 outside the current species range. We demonstrate that efforts to halt deforestation could mediate some orang-utan habitat loss, but further decline of the most suitable areas is to be expected given projected changes to climate. Protected refuge areas could therefore become increasingly important for ongoing translocation efforts. We present an approach to help identify such areas for highly threatened species given environmental changes expected this century.

DOI PMID

[37]
Thomas C D, Cameron A, Green R E.et al, 2004. Extinction risk from climate change.Nature, 427: 145-148.

DOI

[38]
Thomas C D, Gillingham P K, Bradbury R B.et al, 2012. Protected areas facilitate species’ range expansions.Proceedings of the National Academy of Sciences USA, 109(35): 14063-14068.

DOI

[39]
Titeux N, Henle K, Mihoub J B.et al, 2016. Biodiversity scenarios neglect future land-use changes.Global Change Biology, 22(7): 2505-2515.Abstract Efficient management of biodiversity requires a forward-looking approach based on scenarios that explore biodiversity changes under future environmental conditions. A number of ecological models have been proposed over the last decades to develop these biodiversity scenarios. Novel modelling approaches with strong theoretical foundation now offer the possibility to integrate key ecological and evolutionary processes that shape species distribution and community structure. Although biodiversity is affected by multiple threats, most studies addressing the effects of future environmental changes on biodiversity focus on a single threat only. We examined the studies published during the last 25 years that developed scenarios to predict future biodiversity changes based on climate, land-use and land-cover change projections. We found that biodiversity scenarios mostly focus on the future impacts of climate change and largely neglect changes in land use and land cover. The emphasis on climate change impacts has increased over time and has now reached a maximum. Yet, the direct destruction and degradation of habitats through land-use and land-cover changes are among the most significant and immediate threats to biodiversity. We argue that the current state of integration between ecological and land system sciences is leading to biased estimation of actual risks and therefore constrains the implementation of forward-looking policy responses to biodiversity decline. We suggest research directions at the crossroads between ecological and environmental sciences to face the challenge of developing interoperable and plausible projections of future environmental changes and to anticipate the full range of their potential impacts on biodiversity. An intergovernmental platform is needed to stimulate such collaborative research efforts and to emphasize the societal and political relevance of taking up this challenge.

DOI PMID

[40]
Urban M C, 2015. Accelerating extinction risk from climate change.Science, 348(6234): 571-573.Current predictions of extinction risks from climate change vary widely depending on the specific assumptions and geographic and taxonomic focus of each study. I synthesized published studies in order to estimate a global mean extinction rate and determine which factors contribute the greatest uncertainty to climate change nduced extinction risks. Results suggest that extinction risks will accelerate with future global temperatures, threatening up to one in six species under current policies. Extinction risks were highest in South America, Australia, and New Zealand, and risks did not vary by taxonomic group. Realistic assumptions about extinction debt and dispersal capacity substantially increased extinction risks. We urgently need to adopt strategies that limit further climate change if we are to avoid an acceleration of global extinctions. Author: Mark C. Urban

DOI

[41]
Walker R, Moore N J, Arima E.et al, 2009. Protecting the Amazon with protected areas.Proceedings of the National Academy of Sciences USA, 106(26): 10582-10586.This article addresses climate-tipping points in the Amazon Basin resulting from deforestation. It applies a regional climate model to assess whether the system of protected areas in Brazil is able to avoid such tipping points, with massive conversion to semiarid vegetation, particularly along the south and southeastern margins of the basin. The regional climate model produces spatially distributed annual rainfall under a variety of external forcing conditions, assuming that all land outside protected areas is deforested. It translates these results into dry season impacts on resident ecosystems and shows that Amazonian dry ecosystems in the southern and southeastern basin do not desiccate appreciably and that extensive areas experience an increase in precipitation. Nor do the moist forests dry out to an excessive amount. Evidently, Brazilian environmental policy has created a sustainable core of protected areas in the Amazon that buffers against potential climate-tipping points and protects the drier ecosystems of the basin. Thus, all efforts should be made to manage them effectively.

DOI PMID

[42]
Wang Junbang, Liu Jiyuan, Shao Quanqin.et al, 2009. Spatial-temporal patterns of net primary productivity for 1988-2004 based on Glopem-Cevsa model in the “Three-river Headwaters” region of Qinghai Province, China.Journal of Plant Ecology, 33(2): 254-269. (in Chinese)

[43]
Wang Zhi, Jiang Mingkang, Zhu Guangqing.et al, 2004. Comparison of Chinese nature reserve classification with IUCN protected area categories.Rural Eco-Environment, 20(2): 72-76. (in Chinese)Based on comparison of Chinese nature reserve classification with IUCN protected area catagories,it is recommended that a new nature reserve classification system of China should be established in light of the status quo of the conservation of biodiversity,natural and cultural resources in China,and by referring to IUCN protected area categories.The new system should adopt major management targets of each reserve as its basic principle for the sorting and meanwhile take into account comprehensively characteristics of protected objects and extent of human disturbance,so as to realize the dual targets of conservation and sustainable development of nature reserves.

[44]
Xu Y, Xu X R, Tang Q, 2016. Human activity intensity of land surface: Concept, methods and application in China.Journal of Geographical Sciences, 26(9): 1349-1361.Human activity intensity is a synthesis index for describing the effects and influences of human activities on land surface. This paper presents the concept of human activity intensity of land surface and construction land equivalent, builds an algorithm model for human activity intensity, and establishes a method for converting different land use/cover types into construction land equivalent as well. An application in China based on the land use data from 1984 to 2008 is also included. The results show that China’s human activity intensity rose slowly before 2000, while rapidly after 2000. It experienced an increase from 7.63% in 1984 to 8.54% in 2008. It could be generally divided into five levels: Very High, High, Medium, Low, and Very Low, according to the human activity intensity at county level in 2008, which is rated by above 27%, 16%–27%, 10%–16%, 6%–10%, and below 6%. China’s human activity intensity was spatially split into eastern and western parts by the line of Helan Mountains- Longmen Mountains-Jinghong. The eastern part was characterized by the levels of Very High, High, and Medium, and the levels of Low and Very Low were zonally distributed in the mountainous and hilly areas. In contrast, the western part was featured by the Low and Very Low levels, and the levels of Medium and High were scattered in Gansu Hexi Corridor, the east of Qinghai, and the northern and southern slopes of Tianshan Mountains in Xinjiang.

DOI

[45]
Xue Dayuan, Jiang Mingkang, 1994. A study on categoring standard of nature reserves in China.China Environmental Science, 14(4): 246-251. (in Chinese)Based on the knowledge of categoring research development at home and abroad of protected areas and on the present status of the construction and management of nature reserves in China,the basic principles for categoring were put forward and a categoring standard system,according to the principles,was developed and presented in the paper.In the system,the nature reserves in China were defined and divided into three categories including nine types.They are: (1)The category of nature ecosystems,with five ecosystem reserve types of forest, grassland, desert, terrestrial wetland and fresh waters, and ocean and coast; (2)the category of wildlife,with two reserve types of wild animal and wild plant; and (3)the category of nature relics,including two reserve types of geological structure relics sites and paleontological fossils sites.Meanwhile,the structure of the categoring standard system,the concept of nature reserves, the feasibility of the standard and other issues concerned were described and discussed in detail.

[46]
Zhang G L, Zhang Y J, Dong J W.et al, 2013. Green-up dates in the Tibetan Plateau have continuously advanced from 1982 to 2011.Proceedings of the National Academy of Sciences USA, 110(11): 4309-4314.As the Earth's third pole, the Tibetan Plateau has experienced a pronounced warming in the past decades. Recent studies reported that the start of the vegetation growing season (SOS) in the Plateau showed an advancing trend from 1982 to the late 1990s and a delay from the late 1990s to 2006. However, the findings regarding the SOS delay in the later period have been questioned, and the reasons causing the delay remain unknown. Here we explored the alpine vegetation SOS in the Plateau from 1982 to 2011 by integrating three long-term time-series datasets of Normalized Difference Vegetation Index (NDVI): Global Inventory Modeling and Mapping Studies (GIMMS, 1982-2006), SPOT VEGETATION (SPOT-VGT, 1998-2011), and Moderate Resolution Imaging Spectroradiometer (MODIS, 2000-2011). We found GIMMS NDVI in 2001-2006 differed substantially from SPOT-VGT and MODIS NDVIs and may have severe data quality issues in most parts of the western Plateau. By merging GIMMS-based SOSs from 1982 to 2000 with SPOT-VGT-based SOSs from 2001 to 2011 we found the alpine vegetation SOS in the Plateau experienced a continuous advancing trend at a rate of similar to 1.04 d.y(-1) from 1982 to 2011, which was consistent with observed warming in springs and winters. The satellite-derived SOSs were proven to be reliable with observed phenology data at 18 sites from 2003 to 2011; however, comparison of their trends was inconclusive due to the limited temporal coverage of the observed data. Longer-term observed data are still needed to validate the phenology trend in the future.

DOI PMID

[47]
Zhang Y L, Hu Z J, Qi W.et al, 2016. Assessment of effectiveness of nature reserves on the Tibetan Plateau based on net primary production and the large sample comparison method.Journal of Geographical Sciences, 26(1): 27-44.Twenty-one typical coupled large samples were chosen from areas within and surrounding nature reserves on the Tibetan Plateau using the large sample comparison method (LSCM). To evaluate the effectiveness of the nature reserves in protecting the ecological environment, the alpine grassland net primary production (NPP) of these coupled samples were compared and the differences between them before and after their establishment as protected areas were analyzed. The results showed that: (1) With respect to the alpine grassland NPP, the ecological and environmental conditions of most nature reserves were more fragile than those of the surrounding areas and also lower than the average values for the Tibetan Plateau. (2) Of the 11 typical nature reserves selected, the positive trend in the NPP for Manzetang was the most significant, whereas there was no obvious trend in Taxkorgan. With the exception of Selincuo, the annual NPP growth rate in the nature reserves covered by alpine meadow and wetland was higher than that in nature reserves consisting of alpine steppe and alpine desert. (3) There were notable findings in 21 typical coupled samples: (a) After the establishment of the nature reserves, the annual rate of increase in the NPP in 76% of samples inside nature reserves and 82% of samples inside national nature reserves was higher than that of the corresponding samples outside nature reserves. (b) The effectiveness of ecological protection of the Mid-Kunlun, Changshagongma, Zoige and Selincuo (Selin Co) nature reserves was significant; the effectiveness of protection was relatively significant in most parts of the Sanjiangyuan and Qiangtang nature reserves, whereas in south-east Manzetang and north Taxkorgan the protection effectiveness was not obvious. (c) The ecological protection effectiveness was significant in nature reserves consisting of alpine meadow, but was weak in nature reserves covered by alpine steppe. This study also shows that the advantage of large sample comparison method in evaluating regional ecology change. Careful design of the samples used, to ensure comparability between the samples, is crucial to the success of this LSCM.

DOI

[48]
Zhang Zengxiang, Zhao Xiaoli, Wang Xiao .et al, 2012. Land Use Remote Sensing Monitoring in China. Beijing: Star Map Press, 62-80. (in Chinese)

[49]
Zhao G S, Liu J Y, Kuang W H.et al, 2015. Disturbance impacts of land use change on biodiversity conservation priority areas across China: 1990-2010.Journal of Geographical Sciences, 25(5): 515-529.中国科学院机构知识库(CAS IR GRID)以发展机构知识能力和知识管理能力为目标,快速实现对本机构知识资产的收集、长期保存、合理传播利用,积极建设对知识内容进行捕获、转化、传播、利用和审计的能力,逐步建设包括知识内容分析、关系分析和能力审计在内的知识服务能力,开展综合知识管理。

DOI

[50]
Zheng Jingyun, Yin Yunhe, Li Bingyuan, 2010. A new scheme for climate regionalization in China.Acta Geographica Sinica, 65(1): 3-12. (in Chinese)

[51]
Zheng Y M, Zhang H Y, Niu Z G.et al, 2012. Protection efficacy of national wetland reserves in China.Chinese Science Bulletin, 57(10): 1116-1134.Wetlands have the most abundant biodiversity, the highest carbon sequestration capacity, and the highest values for ecological services per unit area, of all the world’s ecosystems. Practice has shown that establishing reserves is the most effective way of protecting typical ecosystems and their biodiversity, and saving rare or endangered wildlife. The Chinese government’s policy is to protect wetland systems by establishing reserves that encompass a massive network of wetlands, including wetland nature reserves, internationally important wetlands, and wetland parks. Many are already established. The effect of protecting wetland nature reserves at the national level has not yet been reported. We used the latest database evaluating the protection value of wetland reserves, and remotely sensed wetland maps (1978–2008), developed by the same mapping specialists and based on the same classification system, and related environmental data, to evaluate the effects of protecting China’s national wetland reserves over the last 30 years. We conclude that (i) the total area of wetland in the national wetland reserves has decreased over the last 30 years to 8152.47 km, and just 8% of China’s net decrease in wetlands; (ii) about 79% of the 91 national wetland reserves are in a poor condition. These are generally located around the Yangtze River, Eastern Coast, the Three Rivers Source, and Southwest China. Protection measures should be undertaken urgently in these areas. Only 15% of national wetland reserves are under sound protection, and these are generally located in the upper reaches of the Songhua River; (iii) although 88% of national wetland reserves are primitive (relatively natural), implying that the site selection has been scientific, a high percentage of national wetland reserves show early warning signs of decline and require urgent attention; (iv) based on our evaluation of protection effects and pressures on ecology, we have made a priority list of national wetland reserves, and propose several protection strategies.

DOI

Outlines

/