Research Articles

Regional differences in the health status of Chinese residents: 2003-2013

  • ZHAO Xueyan ,
  • WANG Weijun ,
  • WAN Wenyu
Expand
  • College of Geography and Environment Science, Northwest Normal University, Lanzhou 730070, China

Author: Zhao Xueyan (1971-), Professor, specialized in ecological economics. E-mail:

Received date: 2017-06-12

  Accepted date: 2017-08-02

  Online published: 2018-06-20

Supported by

National Natural Science Foundation of China, No.41661115, No.41361106

The Open Fund of Key Laboratory of Ecohydrology of Inland River Basin, Chinese Academy of Sciences, No.KLEIRB-2S-16-03

Copyright

Journal of Geographical Sciences, All Rights Reserved

Abstract

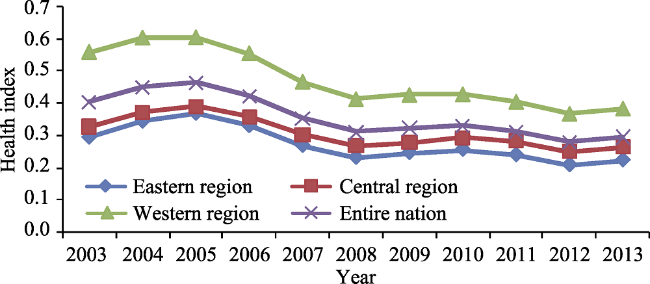
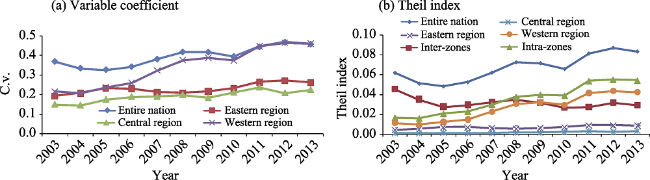
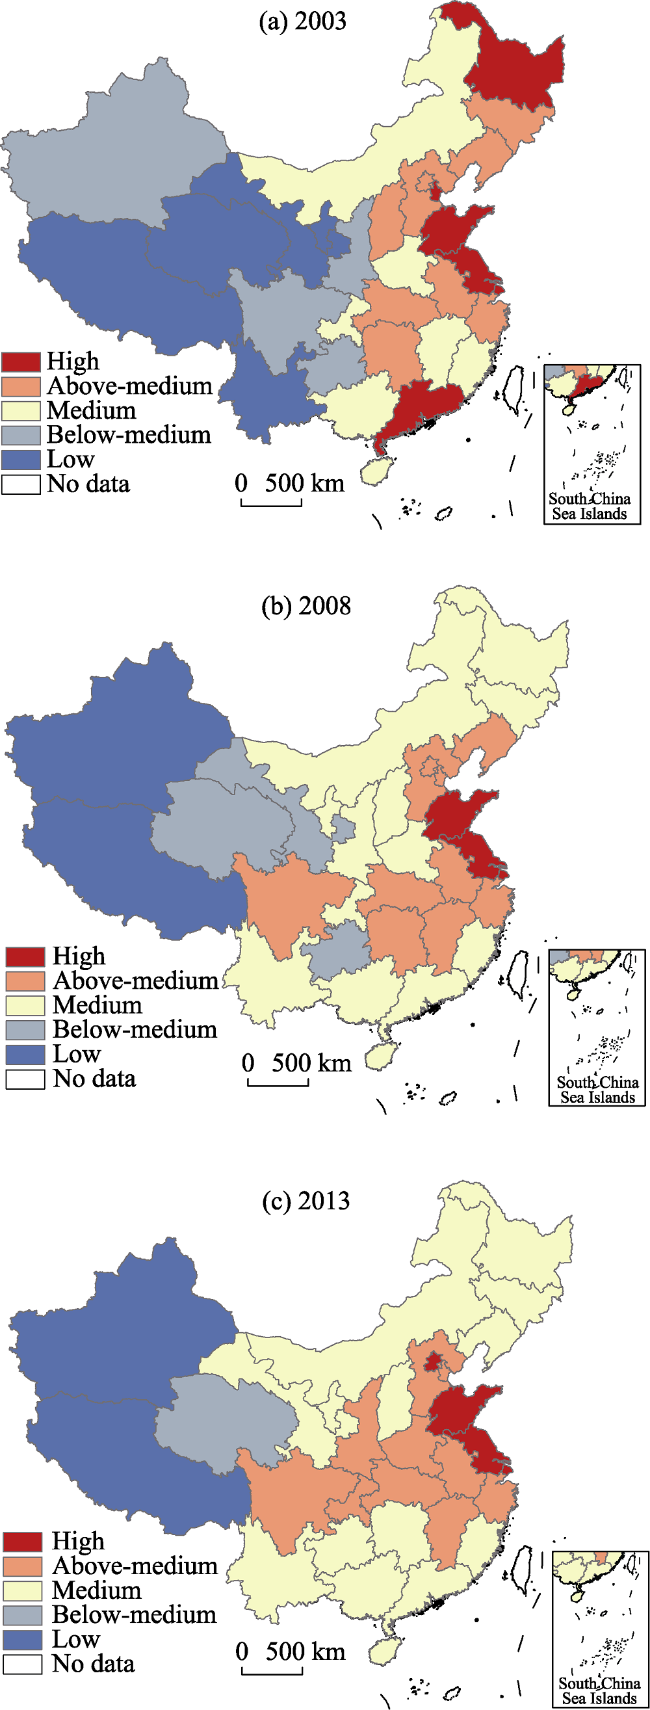
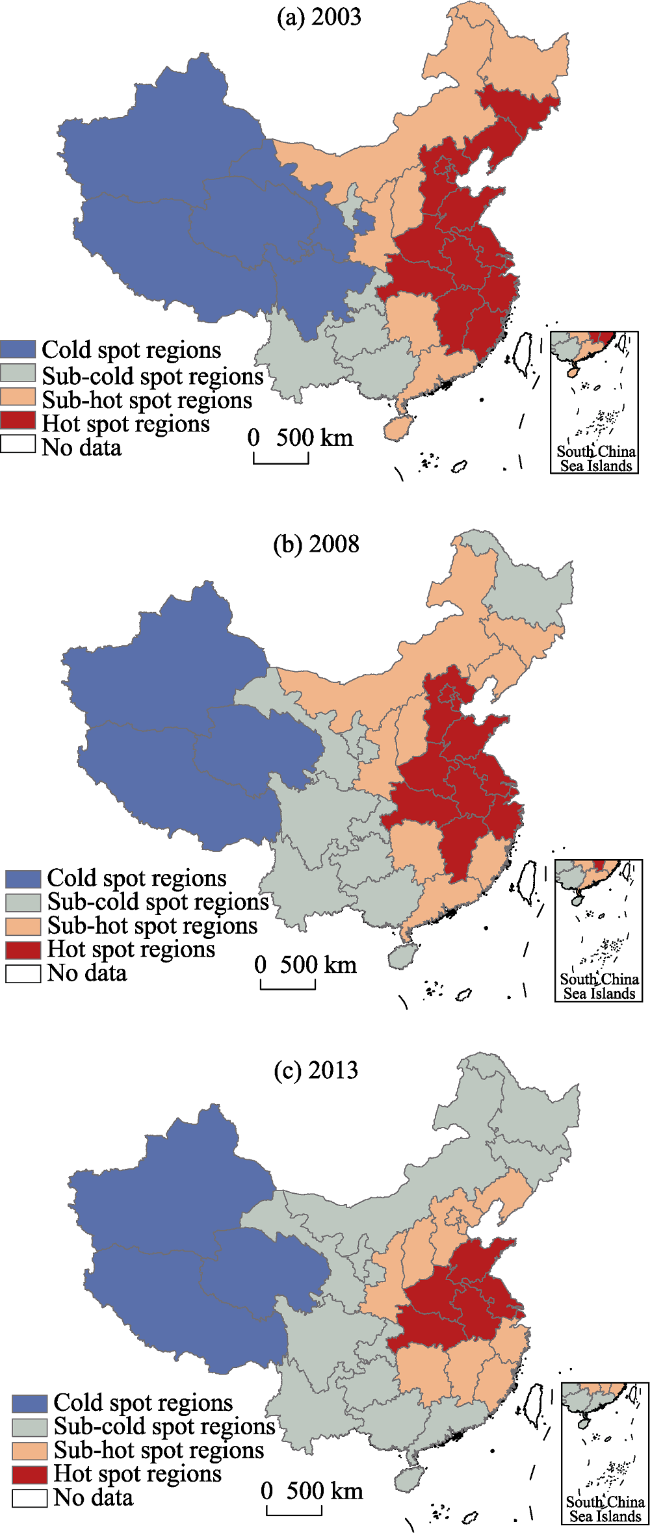
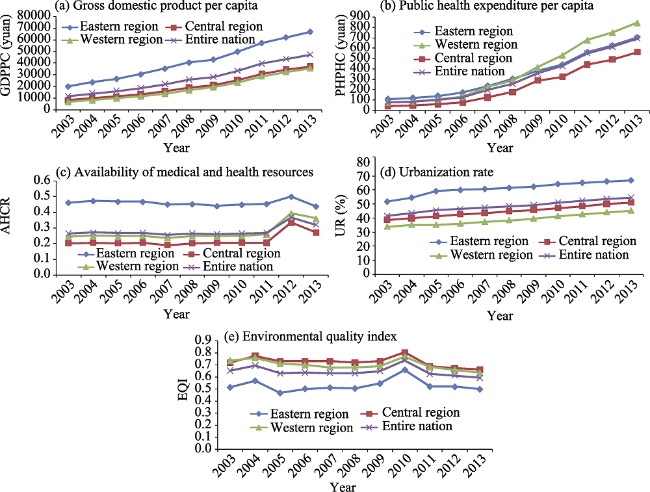
Health inequality is an increasing concern worldwide. Using the coefficient of variation, Theil index, exploratory spatial data analysis, and spatial panel econometric model, we examined the regional inequality, spatio-temporal dynamic patterns, and key factors in the health status of Chinese residents from 2003 to 2013. We found that China’s residential health index (RHI) decreased from 0.404 to 0.295 in 2003-2013 at an annual rate of 2.698%. Spatially, resident health status, based on the RHI, has improved faster in the western region than in the eastern and central regions. Inequality in resident health status continued to increase between 2003 and 2013; inequality between regions decreased, but health status inequality expanded within regions. Furthermore, disparities in health status grew faster in western regions than in the eastern and central regions. The spatial distribution of resident health status formed a “T-shaped” pattern across China, decreasing from east to center then to the west with a symmetric decrease north and south. Using the change in Moran’s I from 2003 to 2008 and 2013, we found that the distribution of resident health status across China has narrowed. All the hot spots and cold spots have decreased, but they are also stable. Resident health status formed a stable cold spot in the western regions, while the east coastal area formed a stable hot spot. Selected explanatory variables have significant direct impacts on resident health status in China: increasing per capita GDP, per capita spending on health, and urbanization, and improving environmental quality all lead to better resident health status. Finally, we highlight the need for additional research on regional inequality of resident health status across multiple time, spatial, and factor domains.

Cite this article

ZHAO Xueyan , WANG Weijun , WAN Wenyu . Regional differences in the health status of Chinese residents: 2003-2013[J]. Journal of Geographical Sciences, 2018 , 28(6) : 741 -758 . DOI: 10.1007/s11442-018-1502-0

1 Introduction

Health, the basis of human survival and development, is related to quality of life, national security, and social stability. As the socio-economy and medical technology have developed, the national health status of different countries has all improved. However, upper-class populations have gained greater benefits from this improvement, which has resulted in health inequities between and within countries (Smyth, 2008; Yang et al., 2010; Brinda et al., 2016). Currently, health inequity has become a central issue affecting human development (Kirby, 2005; Braveman, 2006). The World Health Organization (WHO) has strongly urged nations to narrow the gap in health disparities between different groups of people and different regions within a country. Enjoying good health should be a main social goal of governments worldwide.
Since the reform and opening up, access to health care services in China has been significantly enhanced, and resident health status has improved significantly. Particularly in recent years, reforms in the health care system and continuous increases in health resources have rapidly changed the status of resident health, which is clear from the following data. Life expectancy has been extended from 69 years in 1990 to 75 years in 2010, mortality of children under 5 years fell from 53.9 per thousand in 1990 to 11.7 per thousand in 2014 and the maternal mortality rate dropped from 80 per 100,000 in 1990 to 21.7 per 100,000 persons in 2014 (NHFPC, 2015). However, there are still significant regional differences in health status, which pose severe challenges to building a harmonious society in China. To address this disparity, the Ministry of Health pointed out in 2008 that “the health equity of people should be set as an indicator to measure social justice and fairness” in the “Healthy China 2020” report. Moreover, in the fifth plenary session of the 18th Central Committee, the construction of “Healthy China” was proposed as a national strategy, which stressed the necessity of integrating health into all policies, changing the pattern of health development, and promoting and protecting the health of the entire nation. Therefore, understanding regional differences in the status of resident health has important significance for achieving the “Healthy China” objective.
International research on health equity began in the 1970s. In 1977, the British government set up a “Health Inequity” research group and released “The Black Report” in August 1980. The report documented social health inequities, and attributed the health disparities between different social classes to the differences in socio-economic environment. The report has attracted widespread attention about health equity. Published research has shown that health inequities are closely related to socio-economic status and that the health status of groups with higher socio-economic status is significantly superior to those with lower socio-economic status, and this trend has not changed spatially or temporally (Mackenbach et al., 2008). For example, Acheson (1998) found that life expectancy remains unequal between social classes, even in countries with generally high health status. Zatonski (2007) pointed out that the biggest challenge to the continued socio-economic development of Europe was the health gap between the east and the west. Pearce et al. (2006) claimed that health inequities between different regions in New Zealand had become more extreme in the early 21st century and the gap was growing. Furthermore, Hong and Ahn (2011) found that socio-economic inequalities between regions in South Korea worsened the health inequities between regions. Therefore, narrowing the gap in health inequities between different regions requires a more equitable distribution of income and higher average incomes. Since the 1990s, the coupled growing gaps between social classes and improving health has highlighted the issue of health equity in China. Health inequity between diverse groups (e.g., between ethnic, social, and class groups) and between urban and rural areas has been studied; however large-scale regional differences in health inequity are less well understood. Previous studies have concentrated on measuring regional health inequity based on indicators such as the infant mortality rate (Ming, 2007), self-assessment health index (Xie and Tu, 2011), and compound health index (Fang et al., 2010) using the coefficient of variation, extreme rate, Theil index, and concentration index. These scholars found significant differences in the status of resident health in different regions of China, with better status in economically developed areas than in underdeveloped areas (Xie, 2011; Du and Wang, 2013; Li and Xu, 2015; Zhou et al., 2017).
In general, two problems can be found in previous studies. First, many studies have been based on static and single-year cross-section data on resident health status; this lacks sufficient study on the spatio-temporal changes in health status. Second, most studies apply descriptive statistics and clustering analysis to describe regional health inequity, but lack in-depth data on regional differences, spatial-temporal changes, and factors influencing health status. A major turning point in China’s medical and health work since the reform and opening up was the year 2003. In that year, the government started constructing and began to conduct activities within the “new rural cooperative medical system.” Consequently, the health of many Chinese residents began to change. Taking this turning point into consideration, this study set 2003 to 2013 as the research period and selected 2003, 2008 and 2013 three time nodes. Thirty-one Chinese provincial administrative units were set as the basic space units. We used the coefficient of variation and Theil index to analyze characteristic changes in the status of resident health and general variability. We also examined the spatial-temporal patterns of resident health status using the spatial autocorrelation method, and then determined the primary influencing factors on health status with the Spatial Econometric Model. The breadth and depth of analysis should provide an important reference to evaluate the successful implementation of the “Healthy China” strategy.

2 Data sources and methods

2.1 Data sources

The space units were the 31 provinces in China, including municipalities and autonomous regions. Perinatal mortality, maternal mortality, and incidence of infectious diseases, which reflect the health status of residents, were obtained from the 2004-2014 China Health Statistics Yearbook. Accessibility to health care resources, such as the number of beds in medical institutions per 1000 persons, the number of technical health workers per 1000 persons, and the number of hospitals per 10,000 persons and GDPPC (Gross Domestic Product Per Capita) of the provincial economic development level and urbanization rate (the proportion of urban population to total population) were acquired from the 2004-2014 China Statistical Yearbook. Provincial environmental quality metrics, such as quantity of discharged industrial wastewater and domestic sewage and industrial emissions, were obtained from the 2004-2014 China Environment Statistical Yearbook.

2.2 Methods

2.2.1 Measuring the health status of residents
The United Nations Millennium Development Goals proposed “to reduce child mortality, improve maternal health, and fight against HIV and other diseases.” Some data was limited, for example, the absence of provincial data on child mortality under age 5, which is a commonly used indicator. Therefore, we only selected perinatal mortality, maternal mortality, and incidence of infectious diseases to reflect resident health status. Among them, the incidence of infectious diseases was represented by the incidence rate of A or B class notifiable infectious diseases. Perinatal mortality, maternal mortality, and incidence of infectious diseases are negative indicators; greater values indicate worse health status. To comprehensively evaluate the resident health status in different regions, these described indicators were first normalized using the extreme value normalization method. Then, the weight of the index was determined using the entropy method (Chen et al., 2009). Finally, the weighted average method was applied to calculate the residents’ health index in different provinces.
${{H}_{ij}}=\sum\limits_{j=1}^{3}{{{Z}_{ij}}}\cdot {{w}_{ij}}$ (1)
where Hij is the residents’ health index (RHI) in i province, Zij is the normalized value of the jth indicator in i province, and wij is the weight of the jth indicator. The weights of perinatal mortality, maternal mortality, and incidence of infectious diseases are 0.34, 0.31, and 0.35, respectively. Therefore, smaller values of Hij indicate better health status.
2.2.2 Measuring regional differences in resident health status
The coefficient of variation and Theil index were used to measure the regional differences in resident health status.
${{C}_{v}}=\frac{1}{\overline{h}}\sqrt{\sum\limits_{i=1}^{n}{\frac{({{h}_{i}}-\overline{h})}{(n-1)}}} $ (2)
where Cv is the coefficient of variation, n is the number of provinces, hi is the residents’ health index in i province and $\bar{h}$ is the average value of all hi. Larger coefficients of variation indicate greater differences.
The Theil index can resolve the overall differences in the health status into the differences within regions and the ones between regions.
$Theil=\sum\limits_{i=1}^{n}{{{T}_{i}}}\text{ln}(n{{T}_{i}})={{T}_{WR}}+{{T}_{BR}}$ (3)
${{T}_{WR}}=\sum\limits_{i=1}^{{{n}_{d}}}{{{T}_{i}}}\text{ln}({{n}_{d}}\frac{T{}_{i}}{{{T}_{d}}})+\sum\limits_{i=1}^{{{n}_{z}}}{{{T}_{i}}}\text{ln}({{n}_{z}}\frac{{{T}_{i}}}{{{T}_{z}}})+\sum\limits_{i=1}^{{{n}_{x}}}{{{T}_{i}}}\text{ln}({{n}_{x}}\frac{{{T}_{i}}}{{{T}_{x}}})$ (4)
${{T}_{BR}}={{T}_{d}}\text{ln}({{T}_{d}}\frac{n}{{{n}_{d}}})+{{T}_{z}}\text{ln}({{T}_{z}}\frac{n}{{{n}_{z}}})+{{T}_{x}}\text{ln}({{T}_{x}}\frac{n}{{{n}_{x}}})$ (5)
where TWR is the differences within regions, TBR is the differences between regions, and n is the number of provinces; nd, nz, and nx are the number of eastern, central, and western provinces, respectively; Ti is the ratio of residents’ health index to the national average index; Td, Tz, and Tx are the ratios of residents’ health index in the eastern, central, and western regions to the national average index.
2.2.3 Measuring spatial patterns of resident health status
Exploratory Spatial Data Analysis (ESDA) was applied to analyze the distribution patterns of the resident health status in China. The global spatial Moran’s I was used to determine whether the resident health status distributions were clustered, dispersed, or random (Wang and Xu, 2017). The formula is as follows:
Moran’s $I=\frac{\sum\limits_{i=1}^{n}{\sum\limits_{j=1}^{n}{{{W}_{ij}}\left( {{Y}_{i}}-\overline{Y} \right)\left( {{Y}_{j}}-\overline{Y} \right)}}}{{{S}^{2}}\sum\limits_{i=1}^{n}{\sum\limits_{j=1}^{n}{{{W}_{ij}}}}}$ (6)
where n is the total number of observations, Yi is the observed value of resident health status at i position, Wij is the spatial weight matrix (spatial adjacent: 1, non-adjacent: 0), S2 is the variance of the attribute value, and $\overline{Y}$ is the average value of Yi. At a given level of significance, positive Moran’s I values indicate clustering of regions with similar health status. Conversely, negative Moran’s I indicate that adjacent areas have significant differences in resident health status, i.e., good and poor health statuses are significantly spatially dispersed. Normally, Moran’s I is examined with the Z-test. Positive and significant Z values indicate a positive spatial autocorrelation. Negative and significant Z values indicate that there is negative spatial autocorrelation. Z value of zero indicates an independent and random distribution.
$Z\left( I \right)=\frac{I-E\left( I \right)}{\sqrt{Var\left( I \right)}} $ (7)
where E(I) is mathematical expectation and Var(I) is the variance.
Getis-Ord G* was adopted to reflect the spatial dependency and heterogeneity of the resident health status. The formula can be expressed as:
${{G}_{i}}^{*}\left( d \right)={\sum\limits_{i=1}^{n}{{{W}_{ij}}}\left( d \right){{Y}_{i}}}/{\sum\limits_{i=1}^{n}{{{Y}_{i}}}}\;$ (8)
where a significantly positive G*i (d) value indicates that the observed value is relatively high around area i, which indicates a hot-spot area; other values of G*i (d) indicate cold-spots. Yi is the observed value of resident health status in region i and Wij is the spatial weight matrix, where the space adjacent value is 1 and the non-adjacent value is 0.
2.2.4 Spatial regression analysis to evaluate the influencing factors on resident health status
Because the traditional econometric model does not nest the spatial interaction effect, it may lead to errors in the model setting and estimation results. Instead, a spatial panel model with both nested spatial and time effects makes the spatial regression model set more practical. The spatial panel model also better clarifies the influence of the selected factors on the spatial-temporal patterns of resident health status. At present, commonly used spatial regression models include the Spatial Lag Model (SLM), Spatial Error Model (SEM), and Spatial Durbin Model (SDM) (Lesage and Pace, 2009). Among them, the SDM has nested spatial dependencies, and the independent variables and error terms are unaffected by the spatial dependence of missing variables (Lee and Yu, 2010). Therefore, the SDM was used to analyze the effect of key human factors on spatial-temporal changes in resident health status.
The provincial unit was set as i = 1, ..., 31, and the time series was set as t = 1, ..., 11 (from 2003 to 2013). The SDM model, which analyses the relationship between key human factors and resident health status can be expressed as:
${{y}_{it}}=\delta \sum\limits_{j=1}^{n}{{{w}_{it}}{{y}_{jt}}}+\beta \sum\limits_{j=1}^{n}{r{{w}_{ij}}{{x}_{i,j,t-1}}}+{{\mu }_{i}}+{{\lambda }_{t}}+{{\varepsilon }_{it}}$ (9)
where δ represents the spatial regression coefficient, wij represents an element in the spatial weight matrix W, yjt represents the observed value of the resident health status in j unit at time t and x(i, j, t-1) is the row vector (1, k) of independent variable in i unit at time t-1. λ is the column vector of k dimension, which represents the coefficient of the spatial hysteresis interpretation variable. μi represents the spatial fixed effect, which controls all variables with space-fixed and time-independent. λi represents the time fixed effect, which controls all variables with time-fixed and space-independent. εit represents the spatial autocorrelation error term.

3 Regional differences in Chinese resident health status and changes in spatio-temporal patterns

3.1 Changes in regional differences in resident health status

From 2003-2013, the residents’ health index (RHI) of Chinese residents decreased from 0.404 to 0.295, indicating that the health status improved 26.98% (Figure 1). However, due to the spread of the SARS epidemic in 2003 and an imperfect public health service system, from 2003 to 2005, the Chinese RHI increased from 0.404 to 0.464, indicating a health status deteriorated 14.91%. Since then the public health system has improved with reforms in the medical and health system and increasing investments in medical and health. This resulted in the Chinese RHI dropping to 0.295 from 0.464 with a corresponding health status improvement of 36.51%. From 2003 to 2013, the full implementation of the new rural cooperative medical system, the central government’s subsidies, and increasing investments in the western region resulted in significant advances in the health status of western Chinese residents. The RHI in the western region decreased from 0.558 to 0.353 and health status improved 32.26%; this is in contrast to the central and eastern regions, where health status improved 17.42% and 23.74%, respectively. However, despite these gains, health status in China continued to show an “East-Centre-West” stepwise declining pattern.
Figure 1 Trends in the residents’ health index (RHI) in China from 2003 to 2013
From 2003 to 2013, the differences in resident health status between provinces were large and the overall trend widened; the coefficient of variation increased from 0.369 to 0.495, a growth of 27.06%, and the Theil index increased from 0.0619 to 0.0832, an increase of 34.47% (Figure 2). The SARS epidemic in 2003 significantly impacted resident health status and differences in resident health status between provinces from 2003 to 2005 began to narrow. Subsequently, provincial differences widened and fluctuated. The Theil index showed that the evolution of differences within regions (intra-zones) coincided with overall differences. More specifically, from 2003 to 2007, differences between regions (inter-zones) were wider than those within regions and overall differences were primarily caused by differences between regions, with an average contribution rate of 61.45%. Then from 2008 to 2013, the differences within regions were greater than those between regions, and the overall differences were primarily caused by differences within regions, with an average contribution rate of 60.15%. In general, the differences in the resident health status between regions tended to shrink, while differences within regions tended to expand. However, there were significant differences in trends of the variation in resident health status in the eastern, central, and western regions. That is, while the differences within the eastern and central regions were growing, the fluctuation was relatively stable and the amplitude was small. In contrast, the differences within western region rapidly expanded, the coefficient of variation increased 114.21% and the Theil index increased 274.18%; the differences in health status of residents of the western provinces became increasingly significant.
Figure 2 Regional differences in resident health status in China from 2003-2013 based on (a) the variable coefficient and (b) the Theil index

3.2 Changes in spatial distribution of resident health status

To present the spatial distribution of Chinese resident health status visually for 2003, 2008, and 2013, the 31 provinces were divided into five groups based on their RHI and plotted with natural breakpoint classification method using ArcGIS software. These groups were high, above-medium, medium, below-medium, and low health status regions.
Between 2003 and 2013, the health status of Chinese residents changed significantly at the provincial scale (Figures 3 and 4). From 2003 to 2008, 22.58% of provinces transferred to a high status and 19.35% to a low status. The status transformations for provinces were complex and did not improve systematically. That is, 9.68% of provinces directly transformed to a high health status, 12.90% of provinces gradually improved in status, and 6.45% of provinces directly transformed to a low health status, 12.90% of provinces gradually declined in status. From 2008 to 2013, status transformations were simpler, and all transformations were gradual, successive migrations to higher or lower status. Of these, 19.35% of provinces transferred to a high status and only 6.45% of provinces were to a low status. Compared with 2003-2008, the number of high, below-medium, and low health status provinces decreased 33.33%, 75.0%, and 60.0%, respectively, while above-medium and medium health status provinces increased 11.11% and 100%, respectively. Generally, the high and above-medium health status provinces were primarily in the eastern region for 2003-2013, although the proportion of eastern provinces decreased slightly. The central region was dominated by above-medium and medium health status provinces. The western region was dominated by provinces that changed from low and below-medium to medium and above-medium health status. Despite improvements in the overall health status, the general feature of the “East-Centre-West” stepwise declining pattern remained unchanged and the differences within the eastern and western regions remained (Figure 4).
Figure 3 The spatial distribution of resident health status in China for 2003 (a), 2008 (b), and 2013 (c)
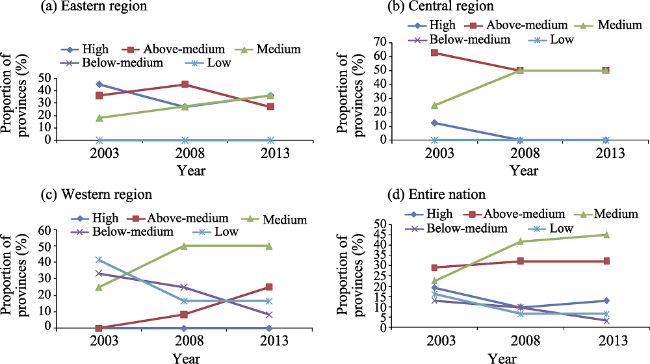
Figure 4 Resident health status in different parts of China, eastern region (a), central region (b), western region (c), and the entire nation (d), from 2003 to 2013
In addition to the general spatial trends, the health status distributions also changed. From 2003 to 2008 (Figure 3), the high health status regions shrank sharply, and changed from relatively dispersed to concentrated, forming the contiguous high health status area of Jiangsu-Shandong-Shanghai. The spatial range of above-medium health status regions slightly expanded and formed three contiguous areas, Beijing-Tianjin-Hebei-Liaoning, Sichuan, and Hunan-Hubei-Jiangxi-Anhui-Zhejiang. The spatial scope of the medium health status regions expanded largely, shifting from relative dispersed to more concentrated areas; there was a contiguous area of Fujian-Guangdong-Guangxi-Yunnan-Hainan and a wedge-shaped area of Inner Mongolia-Heilongjiang-Jilin-Shanxi-Shaanxi-Chongqing. Both the below-medium and low health status regions declined largely, with the low health status regions transformed from wedge-shaped to half-surrounded below-medium health status regions. From 2008 to 2013 the spatial distributions became more concentrated. The spatial scope of high health status regions slightly expanded to include Beijing outside the contiguous distribution area (Jiangsu-Shandong-Shanghai) and connected with the above-medium health status regions across central China. Together, the two regions formed a “T-shaped” pattern stretching from the coast to the inland, and divided the medium-level regions into southern and northern stripes extending from east to west. The below-medium health status regions shrank slightly, but remained half-surrounded by the low health status regions; these two regions were closely grouped and located in the northwest. As a result, the spatial variation in Chinese resident health status showed a clear “East-Centre-West” stepwise declining pattern and a symmetrical declining trend toward north and south from central China.

3.3 Spatio-temporal changes in resident health status

Using the RHI from each province in the ESDA method, Moran’s I values were 0.377, 0.268, and 0.262, respectively, in 2003, 2008, and 2013. The confidence level for the normal statistic Z value of Moran’s I was higher than 0.01, which showed that the RHIs from 2003 to 2013 were positively spatially autocorrelated. That is, the provinces with higher resident health status tended to gather, and so did the provinces with lower resident health status. However, during this period, Moran’s I value of the RHI showed a decreasing trend, indicating that the spatial autocorrelation of the resident health status weakened. From the changes in Moran’s I value, the spatial relationship of resident health status significantly varied from 2003 to 2008, with the change in amplitude of Moran’s I value of 0.109. In comparison, the amplitude was only 0.006 from 2008 to 2013, indicating few changes and general stability in the spatial relationship of health status.
Global Moran’s I values only showed that the resident health status had a significant spatial correlation for all of China, but failed to reflect local spatial information. Therefore, the Getis-Ord G* values were used to define “cold spot,” “sub-cold spot,” “sub-hot spot,” and “hot spot” regions that reflected local spatial relationships (Figure 5). Form 2003 to 2008,
the spatial relationship of Chinese resident health status changed largely, cold-spot regions and hot-spot regions shrank while sub-cold regions and sub-hot regions expanded. The proportion of hot-spot and cold-spot regions to all provinces dropped from 45.16% to 35.48% and from 16.13% to 9.68%, respectively. Stable provinces accounted for 77.42% of the total; among these, Xinjiang-Qinghai-Tibet was a stable cold-spot region while Beijing-Tianjin-Hebei-Shandong-Henan-Hubei-Jiangxi-Jiangsu-Anhui-Shanghai-Zhejiang was a stable hot-spot region. From 2008 to 2013, the spatial relationship of Chinese resident health status changed little, the cold-spot regions remained unchanged, hot-spot regions decreased in area, and sub-cold and sub-hot regions continued to expand. The proportion of hot-spot region to all provinces reduced from 35.48% to 16.13%, and stable provinces accounted for 74.19%; among these, Xinjiang- Qinghai-Tibet remained a stable cold-spot region and Shandong-Henan-Hubei-Anhui-Jiangsu-Shanghai remained a stable hot-spot region. In general, both hot-spot and cold-spot regions declined from 2003 to 2013, which indicates that the concentration trend for both high and low health status provinces weakened. This trend was particularly clear for provinces with high health status. In both periods, the percentage of stable provinces was higher than 70%, indicating that the distribution of Chinese resident health status had a spatial locking or path dependence. The western region formed a large-scale cold-spot region with stability while the eastern coast was dominated by a hot-spot region with significant stability. Consequently, this analysis reinforced the overall characteristic of “East-Centre-West” stepwise decline in resident health status.
Figure 5 The spatio-temporal dynamics of the resident health status in China based on local spatial relationships in 2003 (a), 2008 (b), and 2013 (c)

4 Influencing factors on Chinese resident health status

4.1 Regional differences in key human factors

The Commission on Social Determinants of Health within the WHO suggested that health inequities are not simply “natural” phenomena and significantly affected by unfair human factors (WHO CSDH, 2008). Some research has also shown that regional health inequities are not only the results of differences in natural factor, but are influenced by economic development (Sundmacher et al., 2011), public health expenditures (Li and Yu, 2013), access to health care resources (Garcia-Subirats et al., 2014; Boccolini and de Souza Jr, 2016), environmental quality (Qi, 2008; Baguma, 2017), urbanization (Van de Poel et al., 2012; Cheng and Yang, 2015; Miao and Wu, 2016), and other human factors. Therefore, we analyzed the impact of these key human factors on resident health with Spatial Durbin Model (SDM).
(1) Economic development
The level of economic development will affect the accessibility of health products and services. Poorly distributed economic development will lead to discrepancies in the quality of health products and services in different regions; thus, the effectiveness of preventive health services and disease control will also be affected, resulting in differences in resident health status (Sundmacher et al., 2011). From 2003 to 2013, China’s GDPPC grew at an average annual rate of 29.75%, and the average annual growth rate of the western region was as high as 45.52%; China’s economic development increased significantly, especially in the western region (Figure 6). During this period, the GDPPC in China also showed an “East-Centre-West” stepwise declining pattern; the coefficient of variation reduced 42.47%, but with differences between the three regions. The variation coefficient of the GDPPC in the eastern and central regions tended to decline, 43.09% and 29.94%, respectively, while that of the GDPPC in the western region increased 41.66%. These data showed that provincial differences in economic development level as a whole had decreased, but the differences had expanded between the western provinces.
Figure 6 Trends in key human factors from 2003 to 2013, GDPPC is gross domestic product per capita (a), PCPHE is per capita public health expenditure (b), AHCR is accessibility of health care resources (c), UR is urbanization rate (d), and EQI is environmental quality index (e)
(2) Public health expenditure
Public health expenditure exerts a significant positive effect on health output, which impacts human health primarily by influencing access to health services, health insurance coverage, and public health (Li and Yu, 2013). From 2003 to 2013, per capita public health expenditure in China increased 78.53%, and the average annual growth rate in the central region was as high as 120.39% (Figure 5). During this period, the coefficient of variation for per capita public health expenditure in China reduced 62.43%. Among regions, the variation coefficient for per capita public health expenditure in the central region decreased 73.63%, which was much higher than that of the eastern and western regions; however, the values of the coefficients of variation were lower than that of the eastern region. In general, provincial differences in public health expenditure in China narrowed, although the eastern provinces had more significant variations than the central and western provinces.
(3) Access to health care resources
The fair allocation of health care resources is an important factor that influences resident health equity (Zheng et al., 2015; Han et al., 2015; Mullachery et al., 2016). In this study, the number of technical health workers per 1000 persons, the number of beds in medical institutions per 1000 persons, and the number of hospitals per 10,000 persons were applied to illustrate the accessibility of health care resources1 (First, the index was standardized using the formula:z=(x-xmin) /(xman-xmin). Second, the accessibility of health care resources was calculated using the equal weighted sum method; larger values indicate higher accessibility of health care resources.). From 2003 to 2013, the average annual growth rate (AAGR) of accessibility to health care resources in China was 2.11%; in the western region, AAGR was as high as 4.76%. This trend indicates that China’s health care resources improved significantly, especially in the western region (Figure 5). During the period, the coefficient of variation for accessibility of health care resources in China reduced by 37.83% and it reduced by 28.59% in the central region, which was higher than in the eastern and western regions. Therefore, provincial differences in the accessibility of health care resources tended to decrease, especially in the central provinces.
(4) Urbanization
Urbanization has brought fundamental changes in social organization, family relations, and lifestyles, which exerts a significant impact on human health (Bai et al., 2012). Here, we used urbanization rate to evaluate this factor’s influence on health status. The AAGR of urbanization rate in China from 2003 to 2013 was 1.32%, of which the AAGR in the eastern region reached to 1.50%. The urbanization level in China developed rapidly over this period, especially in the eastern region. Furthermore, although the coefficient of variation decreased 28.09% nationally, the urbanization rate had an “East-Centre-West” stepwise declining pattern and there were regional differences in the coefficient of variations. The variance coefficients for urbanization rate in the eastern and central regions declined 43.52% and 62.69%, respectively, while that in the western region increased 14.02%. Generally, provincial differences in the urbanization as a whole tended to decrease, except in the western region where differences in urbanization between provinces expanded.
(5) Environmental quality
The negative impact of environmental quality on health is significant (Narayan and Narayan, 2008; Li and Han, 2015), and there is a direct link between pollutants and specific diseases that can cause immediate and long-term damage to individual health and increase morbidity and mortality at a macro level (Xu and Chen, 2010). Water and air pollution have become the primary environmental problems in China. Therefore, in this study, wastewater discharge per capita (industrial wastewater + domestic sewage) and waste gas per capita were used to represent the environmental quality2 (2First, the index was standardized using the formula: z = (xmax - x) / (xmax - xmin). Second, the index for environmental quality was calculated using the equal weighted sum method; larger values indicate better environmental quality.). From 2003 to 2013, the environmental quality index in China fell 1.17% annually, and the average annual decline in the western region was as high as 1.36%; China’s environmental quality generally worsened, especially in the western region. During this period, the environmental quality index in China maintained a “Centre-West-East” decreasing trend. The coefficient of variation decreased 6.25% nationally, but was different in each region; the variation coefficient of the environmental quality index for the eastern and central regions declined 51.12% and 12.50%, respectively, while it increased 73.81% in the western region. Generally, provincial differences in environmental quality tended to decrease, although differences in the western provinces expanded.

4.2 The impact of human factors on resident health status

Pearson correlation analysis was used to test the relationship between these human factors and the resident’s health index (Table 1). The results showed that the GDPPC and urbanization rate maintained a strongly negative correlation with the RHI, which indicated that higher provincial GDPPC and urbanization likely resulted in better resident health status. That is, economic and urban development effectively changed health status. Per capita public health expenditure and the RHI also had a significantly negative correlation for five years; regions with more public health expenditure provided better health care services, which in turn, actively improved resident health. The environmental quality index had a significant negative correlation with the residents’ health index for six years, indicating that better environmental quality resulted in maintenance of good resident health status. Although the accessibility of the health care resources negatively correlated with the RHI, it was insignificant.
Table 1 Pearson correlation coefficients between RHIs and key human factors
Variable 2003 2004 2005 2006 2007 2008 2009 2010 2011 2012 2013
GDPPC -0.508** -0.486** -0.422** -0.453** -0.441** -0.437** -0.405** -0.425** -0.448** -0.418** -0.413**
PCPHE -0.000 -0.078 -0.190 -0.140 -0.309 -0.218 -0.427** -0.498** -0.452** -0.457** -0.454**
AHCR -0.261 -0.184 -0.104 -0.125 -0.15 -0.132 -0.12 -0.133 -0.112 -0.168 -0.165
UR -0.489** -0.437** -0.493** -0.537** -0.535** -0.541** -0.522** -0.512** -0.524** -0.550*** -0.546***
EQI -0.500** -0.416** -0.235 -0.404** -0.477** -0.370** -0.372 -0.178 -0.327* -0.251 -0.260

Note: ***p<0.001;** p<0.05;* p<0.1

There was a significant spatial autocorrelation in the health status of Chinese residents, which indicated a spatial interaction effect in health status across different provinces. Therefore, SDM with random effect was selected to explain the influences of each human factor on resident health status. The estimated SDM results are shown in Table 2. From Table 2, the GDPPC, per capita public health expenditure (PCPHE), urbanization rate (UR), and environmental quality index (EQI) passed the significance test at 5%, while the accessibility of health care resources (AHCR) failed. Therefore, economic development, public health expenditure, urbanization, and environmental quality were key factors affecting the spatio-temporal distribution of resident health status. More specifically, the elastic coefficient of GDPPC, PCPHE, UR, and EQI were -0.017, -0.013, -0.129, and -0.012, respectively, which indicated that these four factors had a positive effect on the resident health status. Therefore, economic development, increased public health expenditure, higher urbanization, and better environmental quality could effectively improve resident health status. In addition, the elastic coefficients of spatial lags of GDPPC and environmental quality were -0.037 and -0.081, respectively, but that of urbanization rate was 0.093. Therefore, improving the economic development level and the environmental quality in neighboring provinces would have a positive impact on the resident health status in a province, while increasing urbanization in adjacent provinces would exert a negative impact on resident health in a province.
Table 2 Key human factor parameters estimated using SDM
Variable Elastic
coefficient
T value P value Variable Elastic
coefficient
T value P value
lnGDPPC -0.017** -2.39 0.017 W*lnGDPPC -0.037*** -2.79 0.005
lnPCPHE -0.013** -1.98 0.049 W*lnPCPHE 0.003 0.48 0.630
lnAHCR -0.054 -1.36 0.174 W*lnAHCR 0.029*** 2.83 0.005
lnUR -0.129** -2.32 0.021 W*lnUR 0.093*** 3.40 0.001
lnEQI -0.012** -2.08 0.035 W*lnEQI -0.081*** 3.99 0.000
W*lnRHI 0.030*** 3.51 0.001

Note: *** p<0.01; ** p<0.05;* p<0.1; W* lnGDPPC, W* lnPCPHE, W* lnAHCR, W* lnUR and W* lnEQI stand for the spatial lagging of GDPPC, PCPHE, AHCR, UR, and EQI respectively.

Table 3 shows that the direct effects of GDPPC, PCPHE, UR, and EQI were -0.018, -0.016, -0.132, and -0.008 respectively. The direct effects of urbanization rate and GDPPC were larger and the two most important factors affecting resident health status. Every 1% increase in GDPPC, PCPHE, UR, and EQI would lead to improve resident health status 0.018%, 0.016%, 0.132%, and 0.008%, respectively. Due to feedback effects between provinces, there was a slight difference between the elastic coefficients of GDPPC, PCPHE, UR, and EQI and the values of their direct effects. Part of this feedback effect was derived from the spatial lagging of the RHI while the other was from the spatial lagging of the explanatory variables. For example, the elasticity coefficient of GDPPC was -0.017 and its direct effect was -0.018. The reason for this difference was partly due to the negative statistics of the W*lnGDPPC coefficient and partly due to the significantly positive spatial lagging of the residents’ health index (W*lnRHI). In addition, the feedback effects of GDPPC and UR were 0.001 and 0.003, only accounting for 5.56% and 2.27% of their direct effects, clearly showing the differences in feedback effects from different human factors.
Table 3 Estimates of key human factors direct and indirect effects
Variable Direct effect P value Indirect effect P value
lnGDPPC -0.018** 0.038 -0.164*** 0.009
lnPCPHE -0.016** 0.045 0.009 0.747
lnAHCR -0.057 0.180 0.125** 0.015
lnUR -0.132** 0.021 0.410*** 0.001
lnEQI -0.008** 0.011 -0.362*** 0.000

Note: *** p<0.01; ** p<0.05; * p<0.1

The indirect effects of GDPPC and EQI were -0.164 and -0.362, respectively, while the indirect effects of the AHCR and UR were 0.125 and 0.410, respectively (Table 3). These results indicate that GDPPC and environmental quality had negative spillover effects, while AHCR and UR had positive spatial spillover effects. Therefore, increasing economic development and improving environmental quality in the province would have a positive impact on the resident health status in neighboring provinces. In contrast, improving AHCR and UR would have a negative impact on the resident health status in neighboring provinces. For every 1% increase in GDPPC and EQI in a province would respectively increase the resident health status 0.164% and 0.362% in adjacent provinces. However, every 1% increase in AHCR and UR in a province would respectively decrease resident health status 0.125% and 0.410% in neighboring provinces. In addition, the spatial lag of RHI was statistically significant and indicated that geographic areas of the spillover effect for resident health status crossed provincial boundaries.

5 Conclusions and outlook

In this study, regional differences in and key influencing factors on Chinese resident health status were analyzed using the coefficient of variation, Theil index, Exploratory Spatial Data Analysis (ESDA), and Spatial Durbin Model (SDM). The main conclusions are as follows.
(1) From 2003 to 2013, based on the RHI, Chinese resident health status grew at a rate of 26.98% and the growth rate was higher in the western region than in the eastern and central regions, reaching 32.26%. During the period, regional differences in resident health status generally increased: the coefficient of variation increased 24.15% and the Theil index increased 72.25%. In general, differences in resident health status between regions tended to decrease, but within regions it tended to expand, especially in the western region.
(2) The eastern region was dominated by above-medium and high health status provinces; the central region was dominated by provinces transforming from above-medium to above-medium and medium health status; and the western region was dominated by provinces transforming from low and below-medium to medium and above-medium health status. The spatial distribution of resident health status generally formed a “T-shaped” pattern and presented an “East-Centre-West” stepwise declining pattern and a symmetric declining toward the north and south from the center.
(3) From 2003 to 2013, both the health status hot-spot and cold-spot decreased, while the distribution of resident health status was generally constant, indicating spatial locking or path dependence. The western region was dominated by a stable cold-spot region while the eastern coast was dominated by a stable hot-spot region.
(4) Economic development, public health expenditure, urbanization, environmental quality, and other human factors had a significant impact on resident health status. Among them, increasing economic development level, greater public health expenditures and urbanization, and improved environmental quality resulted in better resident health status. Due to spatial dependency, provincial resident health status created a feedback effect, wherein resident health status in a certain province can influence resident health in neighboring provinces.
As a core problem closely related to human development, health inequality has aroused increasing concern worldwide. Identifying influencing factors on health inequities and resolving them have become popular topics in the discipline of health geography research (Linsheng et al., 2012; Dummer, 2008). With recent research progress showing human impacts on global environmental change, investigating the effects of global environmental change on health should be an objective of the international community (Martens, 1996). Additionally, the International Human Dimension Programme on Global Environmental Change organized the Population Health Advisory Working Group and convened a symposium, “Towards Sustainable Global Health” to systematically focus on the impact of human dimensions on population health (UNU-EHS, 2008). Given this context, this study analyzed the changing trajectories of regional differences in Chinese resident health status from 2003 to 2013 and the impact of key human factors on resident health status using a Spatial Regression Model. The findings should provide a scientific basis for central and local authorities to form appropriate and region-specific medical and health policies. However, due to limited data availability, this study only selected perinatal mortality, maternal mortality, and incidence of infectious diseases to characterize resident health status. Although the findings are in agreement with the conclusions in the relevant literature (Xie, 2011; Li and Xu, 2015; Yang et al., 2017), resident health status is multi-dimensional and additional indicators of resident health status need to be explored in the future. Furthermore, because the sample data and time nodes are relatively small, this study may not fully reveal the spatio-temporal characteristics of Chinese resident health status. Multi-time domain and multi-scale analyses of resident health status should be comprehensively conducted. In addition, this study only addressed the influence of economic development, public health expenditure, accessibility of health care resources, urbanization, and environmental quality on resident health status. In the future, more human factors should be taken into consideration, such as lifestyle or medical systems. Research on the spatialization of human dimensions, such as spatial differences and configuration, and multiple impact mechanisms on resident health status should also be strengthened. Moreover, we should analyze the relationship between resident health status and spatial changes in human dimensions and its coupling mechanism.

The authors have declared that no competing interests exist.

[1]
Acheson D, 1998. Independent Inquiry into Inequalities in Health. London: The Stationery Office.

[2]
Baguma D, 2017. Public health safety and environment in inadequate hospital and healthcare settings: A review.Public Health, 144: 23-31.The list of possible interventions includes enhancing policies to improve the administration of health services, strengthening Rio Conventions implementation on environmental concerns, control of environmental hazards and public health.

DOI PMID

[3]
Bai X, Nath I, Capon A.et al, 2012. Health and wellbeing in the changing urban environment: Complex challenges, scientific responses, and the way forward.Current Opinion in Environmental Sustainability, 4(4): 465-472.With rapid global urbanization, the importance of understanding relationships between the changing urban environment and human health and wellbeing is being increasingly recognized. However, the science underlying the complexity of linkages is poorly developed. In this paper, we explore the different types of health and wellbeing risks in the urban environment, their dynamic, ever evolving nature, and define both their spatial and socioeconomic dimensions. We also present the new innovative program on Health and Wellbeing in the Changing Urban Environment that was launched recently by the International Council for Science (ICSU) wherein an integrated systems approach is recommended to address this complexity. We conclude by identifying key elements needed for the success of the new science initiative.

DOI

[4]
Boccolini C S, de Souza Jr P R, 2016. Inequities in healthcare utilization: Results of the Brazilian national health survey, 2013.International Journal for Equity in Health, 15(1): 150-157.The Brazilian Unified Health System is a public healthcare system that has universal and equitable access among its main principles, but the continental size of the country and the complexity of the public health system complicate the task of providing equal access to all. We aim to investigate the factors associated with inequities in healthcare utilization in Brazil. We employed data from a nationally representative cross-sectional study (2013 National Health Survey;n=6560,202). The outcome was underutilization of healthcare by adults, defined as lack of utilization of one or more of these services: physician or dentist consultation, and blood glucose or blood pressure screening. A logistic regression model, considering the complex sample, was employed (alpha65=65502%). 0.702% of the sample never visited a physician, 3.302% never visited a dentist, 302% never underwent blood pressure screening, 11.502% never underwent blood glucose screening, and 1502% never utilized at least one of these services. Multivariate models showed a higher likelihood of underutilization of healthcare among individuals of the lowest social class “E” (AOR65=656.31, 95 % CI65=653.76–10.61), younger adults (Adjusted Odds Ratio, or AOR65=654.40, 95 % CI65=653.78–5.12), those with no formal education or incomplete primary education (AOR65=652.93, 95 % CI65=652.30–3.74), males (AOR65=652.16, 95 % CI65=651.99–2.35), and those without private health insurance (AOR65=652.11, 95 % CI65=651.83–2.44). Individuals self-classified as “white” were less likely to report underutilization (AOR65=650.82, 95 % CI65=650.75–0.90). Despite recent expansion of primary healthcare and oral health programs in Brazil, we observed gaps in healthcare utilization among the most vulnerable segments of the population.

DOI

[5]
Braveman P, 2006. Health disparities and health equity: Concepts and measurement. Annual Review of Public Health, 27(1): 167-194.

DOI

[6]
Brinda E M, Attermann J, Gerdtham U G.et al, 2016. Socio-economic inequalities in health and health service use among older adults in India: Results from the WHO study on global ageing and adult health survey. Public Health, 141: 32-41.61Reporting of poor health was concentrated among individuals belonging to poor socio-economic status.61In contrast, participants with higher wealth status had more frequent health service visits.61Inequalities in economic factors contributed to health inequalities among older individuals in India.61Social or financial protection strategies in alignment with health policies may address the financial risk, poor health vulnerability and promote better health among the older Indian population.

DOI PMID

[7]
Chen M, Lu D, Zhang H, 2009. Comprehensive evaluation and the driving factors of China’s urbanization.Acta Geographica Sinica, 64(4): 387-398. (in Chinese)

[8]
Cheng M, Yang M, 2015. Impact of urbanization on the health of Chinese residents: An empirical study based on the provincial panel data.China Population, Resource and Environment, 25(7): 89-96. (in Chinese)

[9]
Commission on Social Determinants of Health (WHO CSDH), 2008. Closing the gap in a generation: Health equity through action on the social determinants of health. .

[10]
Du B, Wang X, 2013. Research of evolution, regional difference and influence factor of the inequalities in health of the old.Population Research, 37(5): 81-90. (in Chinese)

[11]
Dummer T J, 2008. Health geography: Supporting public health policy and planning.Canadian Medical Association Journal, 178(9): 1177-1180.The article provides information about health geography. According to the author, health geography is a discipline of human geography that deals with the interaction between people and the environment. He added that understanding geography is crucial in assessing the interrelations inherent in many health-related risk exposures. Moreover, the importance of context, setting and spatial scale are recognized by health geography in determining health outcomes. He emphasized that interactive, multidisciplinary approach is crucial in ensuring that the research provides relevant, high-quality evidence to inform health policy.

DOI PMID

[12]
Fang P, Dong S, Xiao J.et al, 2010. Regional inequality in health and its determinants: Evidence from China.Health Policy, 94(1): 14-25.Health inequality is a problem with great political importance all over the world. Urban–rural inequality in health has attracted great attentions in recent years in China, but very few researches have been undertaken into regional discrepancies in health. This research aims at measuring the degree of regional health inequality in China and identifying its determinants. Indicators for health, socioeconomic status, health resources and health services delivery were selected through Delphi consultations from 18 experts. With cross-sectional data from 31 provinces, composite health indexes were generated. The regional inequality in health was described by Lorenz curve and measured by Gini coefficient. The determinants of health inequality were identified through canonical correlation analysis. The results showed that there existed distinct regional disparities in health in China, which were mainly reflected in “Maternal & Child Health” and “Infectious Diseases”, not in the most commonly used health indicator average life expectancy. The regional health inequality in China was increasing with the rapid economic growth. The regional health inequality was associated with not only the distribution of wealth, but also the distribution of health resources and primary health care services. Policy makers need to be aware of three major challenges when they try to achieve and maintain equality in distribution of health: First, the most commonly used health indicators are not necessarily sensitive enough to detect health inequalities. Second, increase in health inequality is often accompanied with rapid economic growth and increase in life expectancy. Countries in transition are facing the greatest challenge in developing a fair and equitable health care system. Finally, investment in health resources does bring about differences in distribution of health. However, primary health care plays a more important role than hospital services in reducing regional disparities in health.

DOI PMID

[13]
Garcia-Subirats I, Vargas I, Mogollón-Pérez A S.et al, 2014. Inequities in access to health care in different health systems: A study in municipalities of central Colombia and north-eastern Brazil.Social Science & Medicine, 13(1): 204-213.Introduction Health system reforms are undertaken with the aim of improving equity of access to health care. Their impact is generally analyzed based on health care utilization, without distinguishing between levels of care. This study aims to analyze inequities in access to the continuum of care in municipalities of Brazil and Colombia. Methods A cross-sectional study was conducted based on a survey of a multistage probability sample of people who had had at least one health problem in the prior three months (2,163 in Colombia and 2,167 in Brazil). The outcome variables were dichotomous variables on the utilization of curative and preventive services. The main independent variables were income, being the holder of a private health plan and, in Colombia, type of insurance scheme of the General System of Social Security in Health (SGSSS). For each country, the prevalence of the outcome variables was calculated overall and stratified by levels of per capita income, SGSSS insurance schemes and private health plan. Prevalence ratios were computed by means of Poisson regression models with robust variance, controlling for health care need. Results There are inequities in favor of individuals of a higher socioeconomic status: in Colombia, in the three different care levels (primary, outpatient secondary and emergency care) and preventive activities; and in Brazil, in the use of outpatient secondary care services and preventive activities, whilst lower-income individuals make greater use of the primary care services. In both countries, inequity in the use of outpatient secondary care is more pronounced than in the other care levels. Income in both countries, insurance scheme enrollment in Colombia and holding a private health plan in Brazil all contribute to the presence of inequities in utilization. Conclusions Twenty years after the introduction of reforms implemented to improve equity in access to health care, inequities, defined in terms of unequal use for equal need, are still present in both countries. The design of the health systems appears to determine access to the health services: two insurance schemes in Colombia with different benefits packages and a segmented system in Brazil, with a significant private component.

DOI PMID

[14]
Han Z, Li B, Zhang K, 2015. Evaluation and spatial analysis of the equalization of basic public service in urban and rural areas in China.Geographical Research, 34(11): 2035-2048. (in Chinese)With the rapid socio-economic development, and the progresses of urbanization, the demand for basic public service is increasing both in rural and urban areas. Thus, regional and urban-rural non-equalization are increasingly prominent, which are critical to the development of the harmonious society. Against this background, the paper established an index system for basic public service level evaluation from six aspects, including education services, cultural services, health services, social security services, infrastructure services and information services, in order to assess the basic public service level in both urban and rural areas of China's 31 provincial level administrative units. Taking the assessment outcomes as variables,we evaluated equalizations of basic public service in urban and rural areas of China's 31 provincial level administrative units by the method of information entropy. Finally, we explored the spatial pattern of the equalization of basic public service in urban and rural areas with the method of "Exploratory Spatial Data Analysis". As a result, firstly, there are significant inter-provincial differences in the public service level between urban and rural areas. The spatial distribution of basic public service level in urban areas present the letter "T" shape, and the basic public service level decreases from east to central part then to west, while the spatial distribution of basic public service level in rural areas, in contrast, decreases from east to west then central region. These results suggested that to speed up the economic development of relatively backward areas is an effective way to improve the level of basic public service in urban areas. Secondly, equalizations of basic public service in urban and rural areas are generally low, with a significant global autocorrelation in the spatial distribution. Thirdly, the relationship between the equalization of basic public service in urban and rural areas and the basic public service level of rural areas is similar to the Matthew Effect. The influence of basic public service level of rural areas on the index of the equalization of basic public service is greater than that of urban areas. So, it is important for the improvement of the equalization of basic public service to enhance the level of basic public service of rural areas.

[15]
Hong E, Ahn B C, 2011. Income-related health inequalities across regions in Korea.International Journal for Equity in Health, 10(1): 1-11.pAbstract/p pBackground/p pIn the Indian context, a households caste characteristics are most relevant for identifying its poverty and vulnerability status. Inadequate provision of public health care, the near-absence of health insurance and increasing dependence on the private health sector have impoverished the poor and the marginalised, especially the scheduled tribe population. This study examines caste-based inequalities in households out-of-pocket health expenditure in the south Indian state of Kerala and provides evidence on the consequent financial burden inflicted upon households in different caste groups./p pMethods/p pUsing data from a 2003-2004 panel survey in Kottathara Panchayat that collected detailed information on health care consumption from 543 households, we analysed inequality in per capita out-of-pocket health expenditure across castes by considering households health care needs and types of care utilised. We used multivariate regression to measure the caste-based inequality in health expenditure. To assess health expenditure burden, we analysed households incurring high health expenses and their sources of finance for meeting health expenses./p pResults/p pThe per capita health expenditures reported by four caste groups accord with their status in the caste hierarchy. This was confirmed by multivariate analysis after controlling for health care needs and influential confounders. Households with high health care needs are more disadvantaged in terms of spending on health care. Households with high health care needs are generally at higher risk of spending heavily on health care. Hospitalisation expenditure was found to have the most impoverishing impacts, especially on backward caste households./p pConclusion/p pCaste-based inequality in household health expenditure reflects unequal access to quality health care by different caste groups. Households with high health care needs and chronic health care needs are most affected by this inequality. Households in the most marginalised castes and with high health care need require protection against impoverishing health expenditures. Special emphasis must be given to funding hospitalisation, as this expenditure puts households most at risk in terms of mobilising monetary resources. However, designing protection instruments requires deeper understanding of how the uncovered financial burden of out-patient and hospitalisation expenditure creates negative consequences and of the relative magnitude of this burden on households./p

DOI PMID

[16]
Kirby R S, 2005. Geography of health inequalities in the developed world: Views from Britain and North America.Professional Geographer, 57(4): 615-617.Electoral geographers in the United States and the United Kingdom have similar goals but pursue these through different means. In part, these reflect differences between the two countries' electoral and political systems, but they also reflect different methodological strategies and desired ends. Drawing on the U.K. experience, this article identifies areas for possible expansion in studies of the electoral geography of the United States, which are expressed as five challenges.

DOI

[17]
Lee L F, Yu J, 2010. Some recent developments in spatial panel data models.Regional Science and Urban Economics, 40(5): 255-271.Spatial econometrics has been an ongoing research field. Recently, it has been extended to panel data settings. Spatial panel data models can allow cross sectional dependence as well as state dependence, and can also enable researchers to control for unknown heterogeneity. This paper reports some recent developments in econometric specification and estimation of spatial panel data models. We develop a general framework and specialize it to investigate different spatial and time dynamics. Monte Carlo studies are provided to investigate finite sample properties of estimates and possible consequences of misspecifications. Two applications illustrate the relevance of spatial panel data models for empirical studies.

DOI

[18]
Lesage J, Pace R K, 2009. Introduction to Spatial Econometrics. New York: CRC Press.

[19]
Li H, Yu W, 2013. Effect of the government’s health expenditure on the health of rural residents in China.Social Sciences in China, (10): 41-60. (in Chinese)

[20]
Li G, Han M, 2015. The impacts analysis of haze pollution on the resident’s expenditures of health care.Chinese Health Economics, 34(7): 74-76. (in Chinese)

[21]
Li L, Xu R, 2015. The regional difference of the residents’ health level in China.Health Economic Research, (1): 14-20. (in Chinese)

[22]
Mackenbach J P, Stirbu I, Roskam A J.et al, 2008. Socioeconomic inequalities in health in 22 European countries.New England Journal of Medicine, 358(23): 2468-2481.Elsevier’s Scopus, the largest abstract and citation database of peer-reviewed literature. Search and access research from the science, technology, medicine, social sciences and arts and humanities fields.

DOI PMID

[23]
Martens W J M, 1996. Global atmospheric changes and human health: An integrated modeling approach.Climate Research, 6(2): 107-112.

DOI

[24]
Miao J, Wu X, 2016. Urbanization, socioeconomic status and health disparity in China.Health & Place, 42: 87-95.61Living in more urbanized areas raises the risk of developing chronic diseases.61The health penalty of urbanization is more severe among higher-income earners.61Rapid urbanization accelerates the spatial concentration of people adopting unhealthy lifestyles.61An unhealthy diet and decreased physical activity contribute to the negative effects of urbanization on health.

DOI PMID

[25]
Ming Y, 2007. Research of the trend of infant mortality rate and regional difference in China.Population Research, 33(5): 77-87. (in Chinese)

[26]
Mullachery P, Silver D, Macinko J, 2016. Changes in health care inequity in Brazil between 2008 and 2013.International Journal for Equity in Health, 15(1): 140.Brazil has made progress towards a more equitable distribution of health care, but gains may be threatened by economic instability resulting from the 2008 global financial crisis. This study measured predictors of health care utilization and changes in horizontal inequity between 2008 and 2013. Data were from two nationally representative surveys that measured a variety of sociodemographic, health behaviors and health care indicators. We used Poisson regression models to estimate adjusted prevalence ratios and the Horizontal Equity Index (HEI) standardized by health needs to measure inequity in the utilization of doctor and dentist visits, hospitalizations and reporting of a usual source of care (USC) for those 18 and older. To estimate the HEI, we ranked the population from the poorest to the richest using a wealth index. We also decomposed the HEI into its different components and assessed changes from 2008 to 2013. The population proportion with doctor and dentist visits in the past year and a USC increased between 2008 and 2013, while hospitalizations declined. In 2013, pro-rich inequity in doctor visits increased significantly while the distribution of hospitalizations shifted from pro-rich in 2008 to neutral in 2013. Dentist visits were highly pro-rich and USC was slightly pro-rich; the distribution of dentist visits and USC did not change over time. Health need was a strong predictor of health care utilization regardless of the type of coverage (public or private). Education, wealth, and private health plans were associated with the pro-rich orientation of doctor and dentist visits. Private health plans contributed to the pro-rich orientation of all outcomes, while the Family Health Strategy contributed to the pro-poor orientation of all outcomes. The results of this study support the claim that Brazil population continued to see absolute gains in access to care despite recent economic crises. However, gains in equity have slowed and may even decline if investments are not maintained as the country enters deeper financial and political crises. The online version of this article (doi:10.1186/s12939-016-0431-8) contains supplementary material, which is available to authorized users.

DOI PMID

[27]
National Health and Family Planning Commission (NHFPC), 2015. China Statistical Yearbook of Health and Family Planning (2015). Beijing: Chinese Union Medical University Press . (in Chinese)

[28]
Narayan P K, Narayan S, 2008. Does environmental quality influence health expenditures? Empirical evidence from a panel of selected OECD countries.Ecological Economics, 65(2): 367-374.In this paper we examine the role of environmental quality in determining per capita health expenditures. We take a panel cointegration approach in order to explore the possibility of estimating both short-run and long-run impacts of environmental quality. Our empirical analysis is based on eight OECD countries, namely Austria, Denmark, Iceland, Ireland, Norway, Spain, Switzerland, and the UK for the period 1980 1999. We find that per capita health expenditure, per capita income, carbon monoxide emissions, sulphur oxide emissions and nitrogen oxide emissions are panel cointegrated. While short-run elasticities reveal that income and carbon monoxide emissions exert a statistically significant positive effect on health expenditures, in the long-run in addition to income and carbon monoxide, we find that sulphur oxide emissions have a statistically significant positive impact on health expenditures.

DOI

[29]
Pearce J, Dorling D, Wheeler B, 2006. Geographical inequalities in health in New Zealand, 1980-2001: The gap widens.Australian and New Zealand Journal of Public Health, 30(5): 461-466.

DOI

[30]
Qi L, 2008. Interrelationship between growth, environment and population health: An empirical analysis based on China’s provincial data.China Population, Resource and Environment, 18(6): 169-173. (in Chinese)Economic growth changes the environment;economic growth and the environment jointly affect population health;population health influences economic growth.Using province-level panel data covering the pericd 1990-2006,this paper analyzes the relationship between growth,environment and population health in China on the basis of a simultaneous equations model.The results indicate divergent trends in emissions of various industrial pollutants,and suggest that pollution impedes economic growth.Income has a significant positive effect on population health,while the effect of industrial pollution is significantly negative.Population health has no significant contribution to economic growth.Finally,education and services are beneficial to economic growth and environmental improvement.

DOI

[31]
Smyth F, 2008. Medical geography: Understanding health inequalities.Progress in Human Geography, 32(1): 119-127.

DOI

[32]
Sundmacher L, Scheller-Kreinsen D, Busse R, 2011. The wider determinants of inequalities in health: A decomposition analysis.International Journal for Equity in Health, 10(1): 2187-2198.pAbstract/p pBackground/p pThe common starting point of many studies scrutinizing the factors underlying health inequalities is that material, cultural-behavioural, and psycho-social factors affect the distribution of health systematically through income, education, occupation, wealth or similar indicators of socioeconomic structure. However, little is known regarding if and to what extent these factors can assert systematic influence on the distribution of health of a population independent of the effects channelled through income, education, or wealth./p pMethods/p pUsing representative data from the German Socioeconomic Panel, we apply Fields regression based decomposition techniques to decompose variations in health into its sources. Controlling for income, education, occupation, and wealth, we assess the relative importance of the explanatory factors over and above their effect on the variation in health channelled through the commonly applied measures of socioeconomic status./p pResults/p pThe analysis suggests that three main factors persistently contribute to variance in health: the capability score, cultural-behavioural variables and to a lower extent, the materialist approach. Of the three, the capability score illustrates the explanatory power of interaction and compound effects as it captures the individuals socioeconomic, social, and psychological resources in relation to his/her exposure to life challenges./p pConclusion/p pModels that take a reductionist perspective and do not allow for the possibility that health inequalities are generated by factors over and above their effect on the variation in health channelled through one of the socioeconomic measures are underspecified and may fail to capture the determinants of health inequalities./p

DOI PMID

[33]
UNU-EHS (United Nations University, Institute for Environment and Human Health), IHDP, 2008. Towards sustainable global health. Source-Publication Series of UNU-EHS, 11.

[34]
Van de Poel E, O’ Donnel O, Van Doorslaer E, 2012. Is there a health penalty of China’s rapid urbanization? Health Economics, 21(4): 367-385.While highly pertinent to the human welfare consequences of development, the impact of rapid urbanization on population health is not obvious. This paper uses community and individual-level longitudinal data from the China Health and Nutrition Survey to estimate the net health impact of China's unprecedented urbanization. We construct an index of urbanicity from a broad set of community characteristics and define urbanization in terms of movements across the distribution of this index. We use difference-in-differences estimators to identify the treatment effect of urbanization on the self-assessed health of individuals. We find that urbanization raises the probability of reporting of poor health and that a greater degree of urbanization has a larger effect. The effect may, in part, be attributable to changed health expectations, but it also appears to operate through health behaviour. Populations experiencing urbanization tend to consume more fat and smoke more. Copyright 2011 John Wiley & Sons, Ltd.

DOI PMID

[35]
Wang J, Xu C, 2017. Geodetector: Principle and prospective.Acta Geographica Sinica, 71(1): 116-134. (in Chinese)Spatial stratified heterogeneity is the spatial expression of natural and socioeconomic process, which is an important approach for human to recognize nature since Aristotle. Geodetector is a new statistical method to detect spatial stratified heterogeneity and reveal the driving factors behind it. This method with no linear hypothesis has elegant form and definite physical meaning. Here is the basic idea behind Geodetector: assuming that the study area is divided into several subareas. The study area is characterized by spatial stratified heterogeneity if the sum of the variance of subareas is less than the regional total variance; and if the spatial distribution of the two variables tends to be consistent, there is statistical correlation between them. Q-statistic in Geodetector has already been applied in many fields of natural and social sciences which can be used to measure spatial stratified heterogeneity, detect explanatory factors and analyze the interactive relationship between variables. In this paper, the authors will illustrate the principle of Geodetector and summarize the characteristics and applications in order to facilitate the using of Geodetector and help readers to recognize, mine and utilize spatial stratified heterogeneity.

DOI

[36]
Xie E, 2011. Analysis of regional differences in health in China.Journal of Shanxi Finance and Economics University, 33(8): 11-24. (in Chinese)

[37]
Xie E, Tu G, 2011. Health achievement index in China: Equity-efficiency tradeoff.China Soft Science, (7): 9-16.Based on the China Health and Nutrition Surveys(CHNS),this paper analyzes health extended concentration and achievement Indices.The main conclusion is that urban and rural's health level decreased from 1991 to 2006,the poorest quintile suffer decreased mostly.Standard concentration was positive significantly since 2000.That means the health is pro-rich.An unequal distribution across income groups to the poor and a lower mean health level decreases China's achievement Indices.Higher proportions of males and older individuals(65 years+) are associated with lower health achievement.A larger primary industry and a lower unemployment are associated with higher health achievement.In particular,a higher proportion of state and local government spending on public health is found to be significantly associated with better health achievement.In contrast,medical care resource indicators are not found to contribute to health achievement.

[38]
Xu D, Chen Y, 2010. Analysis on the effect of environmental quality on health expenditures.China Population, Resource and Environment, 20(4): 159-164. (in Chinese)In this article,we take the industrial sulphur oxide emissions as a proxy variable for environmental quality,and develop panel data models for east,central and west China separately.We examine the role of environmental pollution and urban households' income in determining per capita health expenditures.We adopt a panel error correction approach to explore the possibility of investigating the reaction after a shock to this system.Our empirical analysis reveals that in the long run,the environmental quality exerts a statistically significant positive effect on health expenditures in any area of China,which implies that the seriousness of environmental pollution will result in the deterioration of households' health and the increase in the health expenditures.While the fact of negative short-run impacts of environmental quality just provides some evidences for authorities and firms pursuing economic growth,regardless of environmental conservation.It is arduous,but also urgent to protect our environment.Both the long-run and the short-run elasticities of households' income are all larger than one,which emphasizes the great significance of improving the urban households' income.Consequently,this article also gives evidence for improving the health subsidies from a policy point of view.

DOI

[39]
Yang L, Li H, Li Y.et al, 2010. Progress of medical geography and environmental health studies.Progress in Geography, 29(1): 31-44. (in Chinese)Human health is one of the key issues either in geographical or environmental science studies in last years. The interested topics can be cataloged as follows:(1) Health issues from global environment change (GEC),including health threats of atmospheric composition change and land use/land cover changes,infectious diseases,food-producing system and health,and health impacts from urbanization. (2) Environmental health risk assessment,including health risks from environmental pollutants (either heavy metals or POPs in air,soil or water),ecological degeneration and natural/human induced hazards. (3) Social determinants of human health,especially health equity. (4) Aging issues,including the health/care demands of old population and their impacts on health/care system. (5) Medical geographical information system,including disease monitoring,modeling and health management. With the fast development of medical geography in China,Chinese scientists have not only engaged in international programme/project planning,but also taken some top position in international organization. The progress of medical geography research in China can be summarized as the following aspects:(1) Geography of endemic diseases is still the study emphasis; (2) The theory of environmental health risk assessment has been generally accepted and the health risk assessing technique of environmental pollution is gradually standardized; (3) The health impacts of global environmental changes on China's population have begun to attract more attention; (4) With rapid urbanization,environmental health problems in urban and rural areas receive universal recognition; (5) RS,GIS and models are adopted in the study of medical geography. Additionally,ageing and longevity issues,as well as the human dimensions on health,and public health risks assessment of disasters,will be the new research focus of medical geography in China.

DOI

[40]
Yang Z, Ao R, Wang N.et al, 2017. Spatial-temporal difference characteristic of pollution’s health stress of China.Scientia Geographica Sinica, 37(3): 339-346. (in Chinese)Health is the basic right of human beings,and is also one of the important goals of the construction of well-off society in China.Nowadays,the rapid urbanization and industrialization have resulted in serious environmental pollution,which did harm to human health.To harmonize the relationships between economic development,environmental conservation and population health,it is necessary to measure the health pressure caused by environmental pollution at macro level to explore the spatial distribution pattern and changing rules of pollution's health pressure.This paper established the population health pressure model based on environmental pollution,and used the spatial agglomeration and convergence test model to study the temporal and spatial differences characteristics of health pressure caused by pollution in China in the recent decade.At first,this paper built the index system of pollution health pressure.And then,the analytic hierarchy process based on expert knowledge was employed to determine the weight of index.And the findings showed that:1) The pollution health pressure of each province decreased from 2005 to 2014,as well as the provincial differences,while the spatial pattern of"high in the east,middle in the central and low in the west"still existed;2) The spatial agglomeration was one of the main characteristics of health pressure distribution,which could describe the spatial relations of geographic position and pressure index.This paper used the spatial autocorrelation and the global exponential of Moran's I to study the spatial agglomeration.The spatial distribution of provincial pollution health pressure was not completely random.But instead it present the trend of spatial agglomeration,which meant that the high(low) pressure provinces were tend to adjacent high(low) level provinces.And compared with 2005,the space agglomeration in 2014 of pollution health pressure decreased;3) Studying the convergence of temporal and spatial changes of health pressure helped learning the changing trends of health pressure,which could provide references for the formulation of relevant optimization policy.And the statistical test shown that the provincial pollution health pressure in 2005-2014 present the weak convergence trend while controlling the variables(urbanization rate,per capita GDP,population mortality and the forest coverage rate).And it meant that the provincial health pressure would be tend to the low-level convergence,in accordance with the continual decrease of health pressure difference and the weaker tendency of spatial agglomeration.Obviously,this article aimed at exploring the temporal and spatial differences characteristics of health pressure caused by environmental pollution in China,and the findings could provide references for government to optimize and coordinate the complicated relationships between environment and health.

[41]
Zatonski W, 2007. The east-west health gap in Europe: What are the causes?European Journal of Public Health, 17(2): 121-121.Eur J Public Health. 2007 Apr;17(2):121. Epub 2007 Feb 13. Editorial; Research Support, Non-U.S. Gov't

DOI PMID

[42]
Zheng W, Jiang H, Ai H.et al, 2015. Analysis of regional inequalities of basic medical resources supply in China.Geographical Research, 34(11): 2049-2060. (in Chinese)As an important part of public services, the equal supply of basic medical resources contributes to realizing the equality of public services. Based on the medical statistic data of342 prefectures in China from 1997-2012 and related studies, the regional inequalities of basic medical resources supply have been examined by coefficient of variation, Theil Index Gini Coefficient and spatial autocorrelation model. This article also explores the causes of these inequalities and recommendations for future policy. Results show that:(1) Despite the regional inequality of basic medical resources supply in China is remarkable, there is still an apparent fluctuation and reduction.(2) The analysis of spatial patterns shows that it is the great changes in spatial distribution of HH(high value agglomeration) type areas and LL(low value agglomeration) type areas, that have mainly caused the regional inequality of basic medical resources supply in China.(3) The areas that have relatively abundant supply in basic medical resources are mainly distributed at central-western and northeastern China, while their parallel areas in eastern China are in the Shandong Peninsula and Beijing-Tianjin region.(4) Compared with the disparity of regional economic development, the inequality of basic medical resources supply in China is diminishing, along with the changes of their spatial patterns.(5) The regional inequality of medical services is regarded as the result of the medical and health system reform, the changes of nation's regional policy, large-scale population migration and unsuited resources supply system, and the special income elasticity of medical service requirement. To make proportional supply of basic medical resources, the departments concerned should establish a national unified social security system and increase the input of basic medical resources on the basis of resident population of each area. Besides, introducing the social and foreign capital into the security system should also be considered.

[43]
Zhou Z L, Fang Y, Zhou Z Y.et al, 2017. Assessing income-related health inequality and horizontal inequity in China.Social Indicators Research, 132: 1-16.

DOI

Outlines

/