Research Articles

Effect of land prices on the spatial differentiation of housing prices: Evidence from cross-county analyses in China

  • WANG Shaojian , 1 ,
  • WANG Jieyu 1 ,
  • WANG Yang , 2, *
Expand
  • 1. Guangdong Provincial Key Laboratory of Urbanization and Geo-simulation, School of Geography and Planning, Sun Yat-sen University, Guangzhou 510275, China
  • 2. Guangdong Open Laboratory of Geospatial Information Technology and Application, Guangzhou Institute of Geography, Guangzhou 510070, China
*Corresponding author: Wang Yang (1984-), Associate Professor, specialized in urban geography. E-mail:

Author: Wang Shaojian (1986-), Associate Professor, specialized in urban geography and regional development. E-mail:

Received date: 2017-12-07

  Accepted date: 2017-12-30

  Online published: 2018-06-20

Supported by

National Natural Science Foundation of China, No.41601151

Natural Science Foundation of Guangdong Province, No.2016A030310149

Pearl River S&T Nova Program of Guangzhou

Copyright

Journal of Geographical Sciences, All Rights Reserved

Abstract

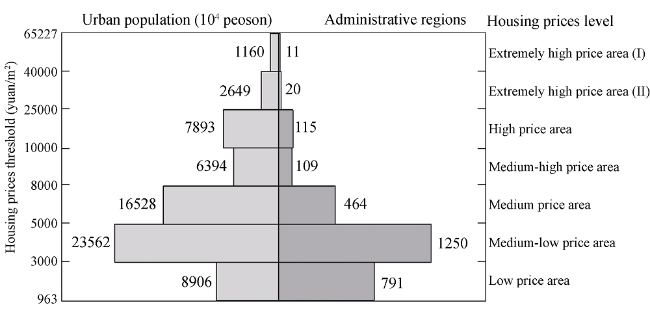
This study analyzes the spatial patterns and driving forces of housing prices in China using a 2,872-county dataset of housing prices in 2014. Multiple theoretical perspectives on housing demand, supply, and market, are combined to establish a housing price model to explore the impact of land prices on housing prices. The relative impacts of land prices on housing prices at different administrative levels are then analyzed using the geographical detector technique. Finally, the influencing mechanism of land prices on housing prices is discussed. The main conclusions are as follows. (1) Housing prices have a pyramid-ranked distribution in China, where higher housing prices are linked to smaller urban populations. (2) Land prices are the primary driver of housing prices, and their impacts on housing prices vary over different administrative levels. To be specific, the effect of land prices is the strongest in the urban districts of provincial capital cities. (3) The internal influence mechanisms for land prices driving housing prices are: topographic factors, urban construction level, the agglomeration degree of high-quality public service resources, and the tertiary industrial development level. The urban land supply plan (supply policies) is the intrinsic driver that determines land prices in cities; through supply and demand, cost, and market mechanisms, land prices then impact housing prices.

Cite this article

WANG Shaojian , WANG Jieyu , WANG Yang . Effect of land prices on the spatial differentiation of housing prices: Evidence from cross-county analyses in China[J]. Journal of Geographical Sciences, 2018 , 28(6) : 725 -740 . DOI: 10.1007/s11442-018-1501-1

1 Introduction

Since the economic reform, China has generated a spectacular economic growth with an annual growth rate of more than 9% (Wang et al., 2014a, 2014b; Wang et al., 2015). However, China also faces serious challenges arising from imbalanced housing prices. Housing prices generally vary spatially at the national or regional scale (Kim and Bhattacharya, 2009; Kuethe and Pede, 2010), and this observation had been the focus of human geography and regional economic research. In China, since the implementation of housing system reform in 1998, housing prices have risen rapidly and show increasingly significant spatial differences in regions and cities (Shih et al., 2014; Chen et al., 2011; Zhang et al., 2015). Furthermore, new patterns and trends in the regional real-estate market are gradually emerging (Wang et al., 2015), which are manifested as inter-provincial differences and inter-urban differences (Shih et al., 2014; Wang et al., 2013). Uneven housing prices have affected the habitation decisions of urbanized immigrants in China and have become a key factor determining the flow of labor in the region (Zhang et al., 2015; Wang et al., 2016a, 2016b).
Significant inequality in domestic housing prices has several causes. Supply and demand and cost theories are the two most commonly accepted analytical perspectives (Fortura and Kushner, 1986). Regional land prices are a significant factor determining housing prices in the region. From the perspective of housing supply, the shortage of land supply will reduce the housing supply (Bramley, 1993; Quigley and Rosenthal, 2005; Green et al., 2016), and promote a corresponding increase in housing prices (Peng and Wheaton, 1994; Ihlanfeldt, 2007; Zabel and Dalton, 2011). From the housing cost perspective, as the most important component of housing cost, land prices are bound to influence housing prices (Wen and Goodman, 2013). Therefore, land prices can either reflect the supply of housing in the region or directly determine the cost of housing, which drives housing prices in terms of the housing supply and costs. Using the annual housing survey data from 58 U.S. metropolitan areas (MSA) from 1974 to 1983, Potepan (1996) quantified the impact of land prices on housing prices. After establishing simultaneous equations for housing prices, land prices and rent, the elasticity of housing prices to land prices was estimated as 0.32. Compared to the cost of housing construction, government regulation, and other factors in the U.S., Glaeser et al. (2003) found that land restrictions and consequent land costs are the primary drivers of high housing prices in Manhattan, New York. Using 21 provincial cities in China from 2000 to 2005 as sample data, Wen and Goodman (2013) found that housing price and land price have an endogenous interrelationship. Wang et al. (2017) examined the relationship between housing prices and their potential determinants. Their results showed that land prices can predominantly explain the spatial differences in housing prices at the county level in China. Using panel data from 45 research units for 2002-2012 in Israel, Rubin and Felsenstein (2017) found that land control is the core mechanism for land prices affecting housing prices. From the existing literature, it is apparent that land prices play a decisive role in determining housing prices.
In addition to land prices, many other factors also have an impact on disparate housing prices. From the perspective of housing demand, income and demographic variables are two significant determinants (Mankiw and Weil, 1989). Income affects the purchasing power for housing, which in turn determines housing demand (Holly et al., 2010). Population growth drives the growth of residential demand and further affects housing prices (Capozza and Schwann, 1989). Moreover, a city’s economic structure has an influence on such indicators as income, population, unemployment rate, and vacancy rate, which affects housing prices through supply and demand mechanisms (Shen and Liu, 2004). From the perspective of housing supply, land supply and housing construction costs have a direct impact on housing supply, which is reflected in housing prices (Holmes et al., 2011; Bischoff, 2012). The supply elasticity of housing will be limited by the affordability to buyers (Quigley and Swoboda, 2010), which is closely related to their income level. In addition, wage level can determine the cost of housing construction, which then affects housing supply. Based on the supply and demand framework, the impact of housing market environment on housing prices cannot be ignored (Smith, 1974; Malpezzi, 1996). Research has shown that the transactional friction in real-estate markets (Caplin and Leahy, 2011), market turnover, and proportion of the population working in the real-estate industry are key factors in determining housing prices (Ortalomagné and Rady, 2001; Hwang and Quigley, 2006). These demand, supply, and market factors, which are the key in differentiating regional housing prices, are used as control variables to analyze the impact of land prices on housing prices in this study.
The significant spatial variability in land prices in China inevitably results in corresponding differences in housing prices (Qin et al., 2016; Zhang et al., 2017). The existing literature that has addressed the impact of land prices on housing prices in China included the following research cases. The levels of income, construction costs, impending marriages, user costs, and land prices were concluded to be the primary determinants of housing prices in China’s 29 provinces (Li and Chand, 2013). Housing prices and land prices in 21 provincial cities in China have an endogenous interrelationship (Wen and Goodman, 2013). Housing prices have risen more significantly in coastal China under the construction land use quota system (Liang et al., 2016); therefore, land policy drives differences in housing prices between the coastal and inland provinces of China (Han and Lu, 2017). The research units in these studies are province or city. However, refining the analysis unit can lead to more information and precise conclusions (Cohen et al., 2015). Counties, large in number and with significantly different characteristics, are the basic administrative unit in China. Therefore, more accurate conclusions could be drawn using the county as the basic unit to analyze the impact of China’s land prices on the spatial variability in housing prices. In addition, there is notably regional inequality in China (Wang et al., 2012), which means that housing sub-market characteristics may differ across regions and administrative levels. Therefore, we can separately analyze the impact of land prices on housing prices in the regional housing sub-market and compare the differences between various regions, providing the basis for differentiating between policies regulating housing prices and real-estate market development.
This study uses China’s 2,872 counties (county-level cities and districts) as the basic research units to analyze the spatial variation patterns in China’s housing prices in 2014. We investigate the impact and magnitude of land prices on housing prices, and examine the different characteristics and mechanisms of influencing factors at different administrative levels by combining the theoretical perspectives of demand, supply, and market. This paper provides new research perspectives on research sample, supporting data, and driving forces. The basic unit of research includes almost all administrative units at the county level, which provides a detailed analysis. Housing prices are acquired from a large amount of actual listing data, which provides a realistic survey of the current housing status. The selected factors cover the main indicators from the perspective of housing supply, housing demand, and market environment. The extensive dataset provides a mechanism for investigating geographical differences in the influencing factors. Therefore, this paper provides a new empirical research reference for this field, and also has important academic significance.

2 Data and methodologies

2.1 Data description

This study takes 2872 county administrative units in China as the basic research units, including districts, county-level cities, banners, autonomous banners, and special districts, and excluding Hong Kong, Macao, and Taiwan. Housing prices data were obtained from the following three sources: “Xitai Data”, “Haowu Data”, and “58Tongcheng Data”. “Xitai Data” is the national cities real-estate database, constructed by the Xitai Data Company, which is currently the largest online real-estate transaction database in China, covering 947 county-level units in 118 major prefecture-level cities with 113.3 million sets of housing data (http://www.cityre.cn/cityCenter.html). All housing data were obtained in May 2014, and the unit price of housing was automatically calculated by the database according to the monthly sales data. “Haowu Data” was collected from the network data platform (http://jia.haowu123.com/). Compared to “Xitai Data”, the “Haowu Data” covers more counties, with 62.21 million sets of second-hand housing data. Therefore, the housing data from the 719 counties not covered by the “Xitai Data” was obtained from the “Haowu Data;” the collection period remained May 2014. The “58Tongcheng Data” was obtained by mining the artificial data from the “58Tongcheng” website (http://*.58.com/), which is currently one of China’s most important real-estate information platforms, covering the most extensive geographical areas, including almost all of China’s county units. Thereby, all the counties not covered by the “Xitai Data” and “Haowu Data” were acquired from the “58Tongcheng Data”. The data mining method obtained the average housing prices in June 2014 for each county using the average price of the most recent 500 second-hand housing units sold. For counties with less than 500 units in the month, all the data for 2014 were used to calculate the average price. Given this method, we calculated the average real-estate prices for 1094 counties. In addition, there was limited real-estate transaction data for 112 counties, primarily located in the Qinghai-Tibet Plateau, which could skew the average housing prices not to reasonably reflect the true housing prices in this region. Therefore, these 112 counties were treated as “no data” areas in this study. The data source distribution is shown in Figure 1.
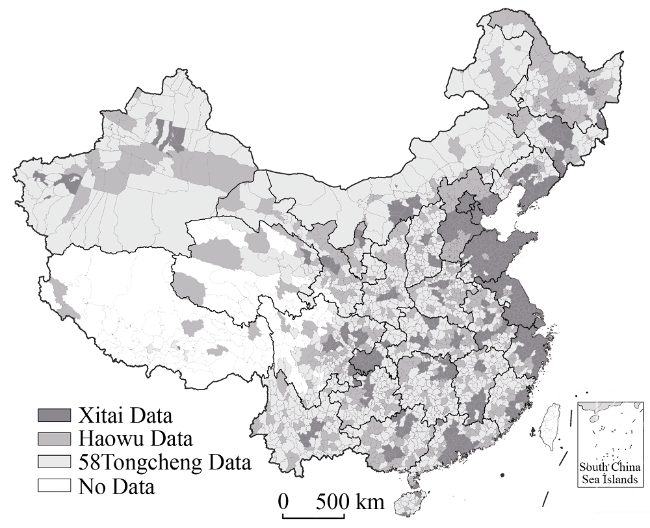
Figure 1 The spatial distribution of the three sources of housing price data in China
In terms of the distribution characteristics of the three data sources, the “Xitai Data” contains housing information for the coastal urban agglomerations and inland major urban agglomerations. The “Haowu Data” covers the secondary important districts in each province. The housing information for the remaining areas was obtained from the “58Tongcheng Data”. The number of counties covered by the “Xitai Data,” “Haowu Data,” and “58Tongcheng Data” respectively accounted for 32.97%, 25.03%, and 38.09% of the total number of counties. The proportion of “no housing data” counties accounted for 3.90% of the total, and are concentrated in Tibet, Qinghai, western Sichuan, and southern Gansu. The three data mining sources employed reflect the following changing characteristics: amount of housing price data, ease of data acquisition, and activity in the real-estate market. Compared with statistics from the National Bureau of Statistics or local housing department, these data more accurately reflect the status of local housing prices. For example, the National Bureau of Statistics provides a price index, which is calculated through actual sales price statistics based on similar housing in similar areas for the sample. Moreover, the data released by local housing departments are the weighted average of monthly housing net prices, easily affected by structural changes in trading volume. Therefore, second-hand housing listing prices, based on large sample data, are more stable and representative.
Five socio-economic factors, the average cost of land, proportion of renters, floating population, average wage of urban employees, and the proportion of the population working in the real-estate industry were selected, to account for the spatial differences in housing prices in China. These data were collected from the Population Census of the People’s Republic of China by County (2010), the China City Statistical Yearbook (2011), the China Statistical Yearbook of Land Resources (2011), the China Statistical Yearbook for the Regional Economy (2011), and the China County Statistical Yearbook (2011). All data were selected from 2010 because the Sixth National Population Census of China was conducted in that year, so they were most comprehensive. In addition, Zhang (2008) showed that the impact of housing demand, housing purchasing power, and land prices on housing prices tends to lag about three years. Therefore, it is reasonable and feasible to collect data from 2010 on the influencing factors for housing prices in 2014.

2.2 Methodologies

2.2.1 Kernel density estimation
Kernel density estimation captures the distribution shape information from housing prices while retaining its overall structure, avoiding the error caused by pre-specifying a particular distribution pattern, such as a normal distribution (Chen and Wang, 2011). Given this feature, the kernel density estimation was employed to estimate the overall distribution characteristics of housing prices. The formula can be expressed as follows (Wang et al., 2013):
${{f}_{n}}(x)=\frac{1}{n{{h}_{n}}}\sum\limits_{i=1}^{n}{k\left( \frac{x-{{x}_{i}}}{{{h}_{n}}} \right)}$ (1)
where $k\left( \frac{x-{{x}_{i}}}{{{h}_{n}}} \right) $ is the Gaussian Kernel function, n represents the number of counties, hn is the bandwidth, and x refers to the county housing prices.
2.2.2 Multivariate linear regression model
The Multivariate Linear Regression Model has been widely used to analyze the factors influencing housing prices (Wang et al., 2017). The significance level for each factor in the model can be used as the criterion to identify the primary influencing factor (Wang et al., 2014). The general form of the multivariate linear regression model is provided as follows:
P=a0+a1F1+a2F2+…+anFn (2)
where F1, F2,…, Fn are the various factors that affect housing prices, a1, a2,…, an denote the regression coefficients for each factor, P refers to housing prices, and a0 is the intercept for all factors.
2.2.3 The geographical detector technique
The existence of several important determinants of housing prices necessitates using the geographical detector technique, first applied by Wang et al. (2010) to the study of the risk of endemic diseases and related geographical factors. The advantage of the geographical detector technique lies in the fewer constraints on assumptions (Hu et al., 2011). The core assumption in this method for exploring the strength of the influencing factors is that housing prices take on a spatial distribution consistent with the most significant factors. The power of the influencing factors D={Di} on the housing prices effect U can be expressed as:
${{P}_{D,U}}=1-\frac{1}{n\sigma _{U}^{2}}\sum\limits_{i=1}^{m}{{{n}_{D,i}}}\sigma _{{{U}_{D,i}}}^{2}$ (3)
where PD,U refers to the power of influencing factors D, m is the number of sub-regions, n represents the number of counties in the regions of the study area, nD,i denotes the number of counties in sub-regions, σ2U stands for the variance in the housing prices in the regions of the study area, and $\sigma_{U_{D,i}}^{2}$ is the variance in the housing prices in the sub-regions. In general, PD,U takes values in the interval [0,1]. The value of PD,U tends to be 1, indicating that the U factor has a greater impact on housing prices.

3 Patterns of spatial variability in housing prices

Using cluster analysis and accounting for the principle of taking integers, the housing prices for all county-level units in China in 2014 were divided into six levels; from low to high, these are: 3000, 5000, 8000, 10,000, and 25,000 yuan/m2. According to the classifications, counties were further divided into six categories: low price area (791), medium-low price area (1250), medium price area (464), medium-high price area (109), high price area (115), and extremely high price area (31). Figure 2 shows the spatial variability in housing prices according to the described classification method; the spatial pattern of housing prices has the dual characteristics of administrative level and spatial agglomeration. Generally, the administrative level is positively related with housing prices: higher prices are found at higher administrative levels. Provincial capital cities maintain higher housing prices, followed by prefecture-level cities and counties, or county-level cities. Furthermore, high housing price areas tend to be concentrated in the three urban agglomerations in China’s southeast coasts, i.e., the Pearl River Delta, Yangtze River Delta, and western coast of the Straits, and the Beijing-Tianjin region, whereas the medium-low housing price areas are mainly concentrated in inland regions.
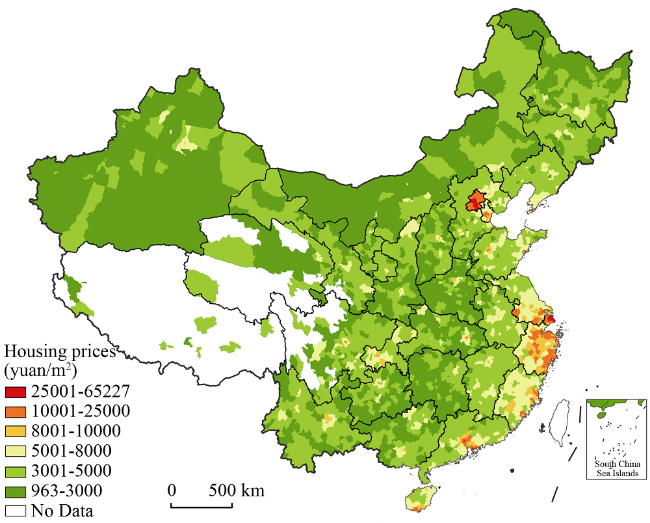
Figure 2 The pattern of spatial variability in housing prices in China
According to the classifications of housing prices, the number of counties in each price range and the urban population in each region were calculated and the distribution of housing prices in China is depicted in Figure 3. In general, the number of administrative regions and urban population negatively correlated with housing prices, presenting a pyramid-shaped distribution. Housing prices have three dominant characteristics: the prices in high-level administrative cities are higher than in lower-level cities, prices in coastal cities are higher than in inland areas, and prices in the central area are higher than those in the peripheral areas. Moreover, the 146 high-price areas, with housing prices more than 10000 yuan/m2, include a population of 117 million, accounting for 17.44% of the total urban population in China. In contrast, the 2041 areas with housing prices lower than 5000 yuan/m2 account for 73.95% of the country’s total population. Approximately 400 million urban residents live in those regions, accounting for 59.75% of the urban population in China. Therefore, the issue of high housing prices in China is a regional issue rather than a national one, both in terms of scope and population. However, cities and counties with high housing prices are often the political, economic, and cultural centers of the region, and also the major agglomeration points for migrants. Therefore, the social influence of the high housing prices cannot be ignored.
Figure 3 The pyramid-shaped distribution of housing prices in China
According to the kernel density estimate, the housing price distribution characteristics of capital cities, including municipality and sub-provincial cities; prefecture-level cities, including prefectures and counties, and cities where autonomous prefectures are located; and counties, including county-level cities, are illustrated in Figure 4. As shown, regions with higher administrative level host a wider price range, flatter distribution, and more significant absolute differentiation in housing prices. In contrast, the distribution curve for regions of lower administrative level is sharper. The kernel density estimates for different administrative levels indicate that housing prices decrease from capital cities, to prefecture-level cities, and then to counties. Furthermore, each curve has a significant “long tail,” revealing that each administrative level has few units with higher housing prices. Regions with higher administrative levels have longer “long tails,” indicating that higher administrative districts contain more high-price areas and larger price differences.
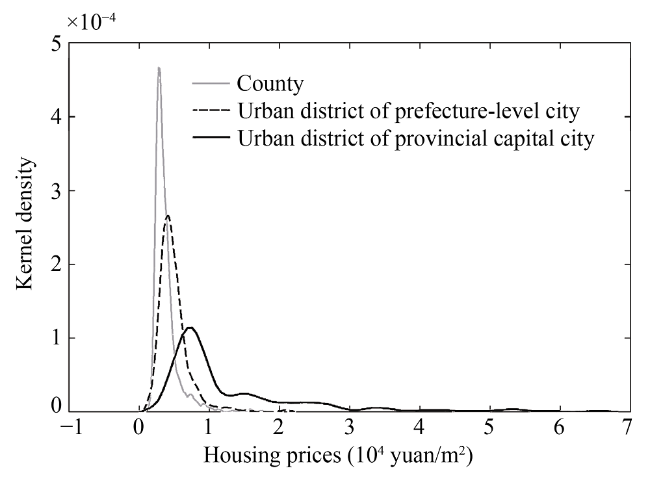
Figure 4 Kernel density estimates of housing prices in China

4 The effects of land prices on China’s housing prices differentiation

4.1 The impact of land prices on China’s housing prices

In this study, the direction and strength of determinants driving differences in China’s housing prices were analyzed, taking into consideration land prices, housing supply, housing demand, and housing market. Housing supply and bottom-line construction costs are represented by land prices. Housing demand and purchasing power are expressed through the following factors: the proportion of renters, floating population, and housing affordability. The housing market is characterized by its relative activity. These factors are measured using the average land price, proportion of renters in the total number of households, urban floating population, average wage of urban employees, and proportion of the population working in the real-estate industry. The statistical descriptions and expected directions of selected factors are compiled in Table 1. We chose those factors for the following reasons. First, land prices are the core determinants affecting housing supply, and are highly correlated with the cost of housing. Second, the vast majority of renters belong to the floating population, and most of them cannot afford to buy local houses but have a rigid demand for housing purchases. Meanwhile, when renters increase in proportion, this usually leads to higher housing demand, and hence higher housing prices in those regions. Third, the floating population is also an important indicator reflecting comprehensive housing demand and overall attractiveness of the city because of their strong intention to settle down. The housing purchasing power and affordability are measured by the average wage of urban employees, which influences both housing demand and housing supply flexibility. Finally, housing market activity can directly reflect the demand for housing investment and the maturity of the real-estate market.
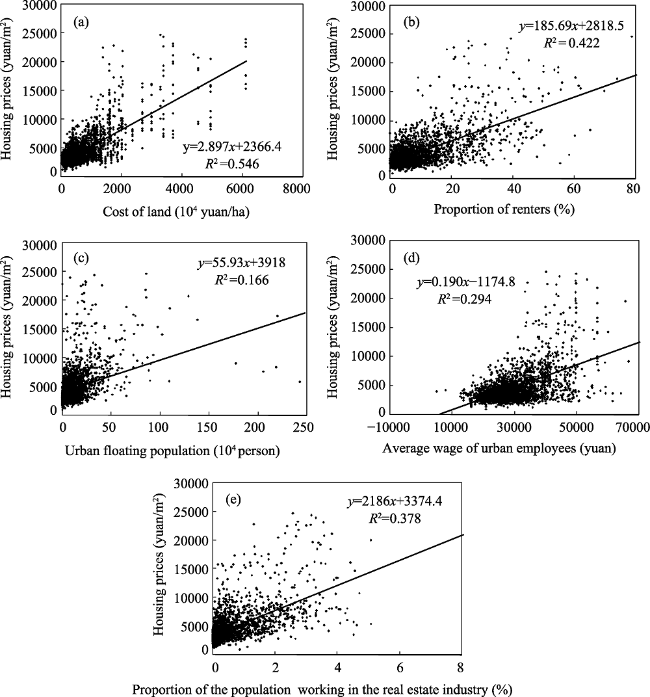
Table 1 Statistical summary of the variables
Variables Definition Expected direction Min Max Mean S.D.
Land price Cost of land (104 yuan/ha) + 27.76 6127.08 783.02 829.99
Proportion of renters Proportion of renters (%) + 0.00 84.94 9.50 10.45
Floating population Urban floating population (104 person) + 0.00 243.41 10.58 15.79
Wage level Average wage of urban employees (yuan) + 5128.74 125949.00 30286.80 9161.17
Housing market Proportion of the population working in the real-estate industry (%) + 0.00 8.06 0.56 0.89
To further analyze the strength and directions of the selected factors’ influence on housing prices, excluding the extremely high-price areas, scatter diagrams of associations between impact factors and housing prices are provided in Figure 5. The results show that positive relationships exist between each impact factor and housing prices, which further support the choice of these five influencing factors. The value of R2 for land prices, proportion of renters, and housing market activity were higher than for other factors, indicating that these three factors clearly control the spatial distribution of housing prices. Due to the limitations of land price data acquisition at the county-level, land prices at the prefectural-level unit were applied. Land prices tend to be more distinct at the large-scale, and thereby land price differences between prefectural-level units are more significant (Song et al., 2011; Gao et al., 2010). Therefore, this data processing method has no significant impact on the conclusions.
Figure 5 Scatter diagrams of relationships between impact factors and housing prices in China
A regression model of housing prices was constructed using the above-described five influencing factors as independent variables (Table 2). Using this model, the directions and strength of the influence of the primary elements can be verified. As reported in Table 2, the goodness-of-fit statistic R, the adjusted R2, and the df value were 0.855, 0.731, and 5, respectively, indicating that the regression model is well fitted. The F value is 1502.289, while the significance level is 0.0000, which means that the model is extremely significant. The significance levels for each of the five factors are lower than 0.01, indicating that all factors have a significant positive impact on housing prices, which is consistent with our hypothesis.
Table 2 Regression coefficients for the housing price model for China
Variables Non-standardized coefficient Standard error Standardized coefficient t-value Significance Model parameters
Coefficient (α0) -1103.623 178.337 - -6.188 0.000 R = 0.855
R2 = 0.732
Aj-R2 = 0.731
F = 1502.289
Sig. = 0.000
df = 5
Land price 2.702 0.068 0.488 39.482 0.000
Proportion of
renters
28.680 6.657 0.065 4.308 0.000
Floating
population
0.001 0.000 0.033 2.882 0.007
Wage level 0.089 0.007 0.178 12.947 0.000
Housing market 1448.468 72.222 0.281 20.056 0.000
Based on the non-standardized coefficients and intercepts in Table 2, the regression model for housing prices in China’s counties was constructed as follows:
P=-1103.623+2.7022x1+28.680x2+0.001x3+0.089x4+1448.468x5 (4)
The model reveals that with other factors unchanged: an average land price increase of 1 yuan results in a housing price increase of 2.702 yuan; a 1% increase in the proportion of renters results in a housing price increase of 28.680 yuan; a floating population increase of 1% results in a housing price increase of 0.001 yuan; an average wage of urban employees increase of 1 yuan results in a housing price increase of 0.089 yuan; and a 1% increase in the proportion of the population working in the real-estate industry results in a housing price increase of 1448.468 yuan.
Land prices are a crucial factor and are the basis for determining residential housing prices. The first step in residential construction is developers obtaining a leasehold for state-owned land through bidding, auction and listing. Therefore, land costs become the basis and bottom-line for housing prices. According to previous research, the proportion of urban land prices in total housing prices in China rose from 9.0% in 1998 to 24.3% in 2011. Unequal land cost has become an important factor in housing cost differences, and land price changes in China are also Granger causes of housing price changes (Zeng and Zhang, 2013). According to the four-quadrant model established by Wheaton (1996), increases in land prices will result in a corresponding decrease in land supply. Under the premise of a constant plot ratio, the supply of housing will decrease, and with demand unchanged, housing prices will increase. Therefore, from the perspective of housing supply, land costs are positively correlated with housing prices.
The proportion of renters reveals the level of non-home ownership. Chinese culture embraces a strong philosophy of home ownership, and renting is considered as a transitional solution to housing issues. Therefore, renters are the largest group driving housing needs in China. As a result, the proportion of renters in a city is higher, which leads to a greater contradiction between supply and demand of housing, and a greater difficulty in purchasing houses. There is a positive relationship between the size of the floating population and residential prices. The floating population plays an important role in the regional labor market, and is also an important manifestation of the popularity of a region. The flow of young people into areas results in a substantial demand for housing, which is reflected in the spatially consistent distribution of population inflows and housing prices in eastern and central China. The level of wages reflects the affordability of home buyers in the region, which is the foundation for determining whether housing prices will continue to rise. Thus, the level of wages determines the effective demand for housing. Regional wage levels, as a significant factor attracting labor, could determine regional competitiveness. In the absence of competitive wages, the regional labor supply will gradually decrease, thereby reducing housing demand (Wheaton, 1996). Housing market activity directly reflects the housing investment demand in the region and real-estate market maturity, which has a positive impact on housing prices; this relationship is primarily caused by the friction in trading transactions in the real-estate market and market turnover (Caplin and Leahy, 2011; Ortalomagné and Rady, 2011). Generally, higher city administrative levels are associated with more active real-estate markets, which is consistent with the spatial differences in housing prices.

4.2 The magnitude of the land price impact on housing prices

The geographical detector technique was used to analyze the strength of the influencing factor impacts. Based on the pyramid-level distribution characteristics of county-level housing prices in China, the original values of the five factors were divided into five categories, from high to low: high (10%), middle-high (20%), middle (40%), middle-low (20%), and low (10%) levels. Based on the classifications, value thresholds for the five factors were determined, and their spatial distributions are plotted in Figure 6.
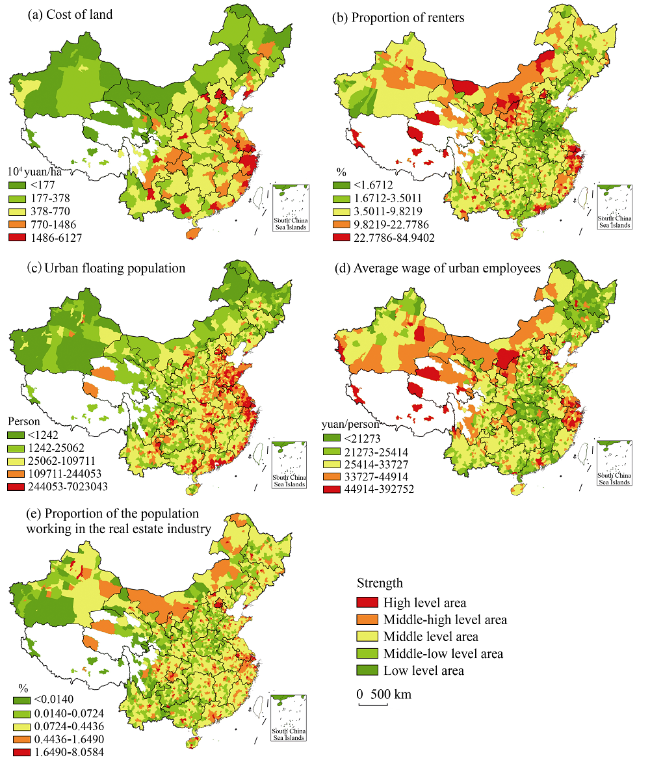
Figure 6 The spatial distribution of the strength of the five factors influencing housing prices in China
In China, there is significant inequality in urban size, population attraction, stage of urban development, real-estate market development, and land market conditions between different administrative levels of a city (county). Cities at a higher administrative level are usually attractive to the population, have scarce land availability, show a greater contradiction between supply and demand for housing, and have a more active real-estate market (Wang et al., 2013; Wang et al., 2015). Therefore, each factor has varying impact strength on different administrative cities. Table 3 shows the intensity differences for the potential determinants on housing prices in the capital cities, prefecture-level cities, and counties (county-level cities), based on the geographical detector technique.
Table 3 Geographical detection results for potential determinants of housing prices in China
Land prices Proportion of
renters
Floating
population
Wage level Housing market
Nation 0.3837 0.3291 0.1664 0.2816 0.3214
Urban district of provincial capital city 0.9070 0.9069 0.6452 0.8307 0.9244
Urban district of prefecture-level city 0.7141 0.8790 0.0095 0.9108 0.8166
County 0.7022 0.7844 0.7382 0.2829 0.7489
The results indicate that significant differences in detection power exist among the detection factors. Specifically, the P value of the cost of land is the highest (0.3837), indicating that land prices are the core driving forces in uneven housing prices at the county scale in China. The P values for the proportion of renters (0.3291) and housing market activity (0.3214) are also relatively high, while the P value for the floating population is the lowest.
The P values for the internal impact factors of the three housing sub-markets classified by administrative level are much higher than that at the national level, which once again indicates that there is a housing sub-market in China at the administrative level. There are also differences in the strength of influencing factors for different administrative sub-markets: in the urban district of provincial capital cities, the impacts of housing market activity, proportion of renters, and land costs are the most significant. In the urban district of prefecture-level cities, housing affordability exerts the most significant impact on housing prices, while the floating population has a weak influence. In counties and county-level cities, housing affordability has the weakest impact, while the remaining four factors have some influence on housing prices.
There are regional differences in the impact of land prices on housing prices. Specifically, the effect of land prices on housing prices is the strongest in urban areas of capital cities. In the prefecture-level cities, counties, and county-level cities, the impact of land prices on housing prices is relatively weak, but cannot be ignored.

4.3 The mechanisms of land price influence on housing prices in China

The impact of land prices on housing prices also has its own internal influence mechanisms. Topographic factors, urban construction level, degree of agglomeration of high-quality public service resources, tertiary industrial development, and urban land supply plan (supply policies) are intrinsic drivers that determine land prices in the city. Through supply and demand, cost, expected growth, and market mechanisms, these factors then affect housing prices. Furthermore, residential prices will exert a feedback on land prices, driving land prices higher or lower.
Districts with a varied topography usually have higher land development costs and housing construction costs, resulting in the short supply of construction land, which is directly reflected in higher land prices, increasing the fixed cost of housing construction and thus housing prices.
High urban construction level significantly affects activity and competition in a city, attracting high-end industries and high floating populations, which increases the demand and price for land. However, high land prices are also an important prerequisite for maintaining a high level of urban construction. Through the supply and demand mechanism and the cost mechanism, land prices exert a positive influence on housing prices.
High-quality public service resources, including quality education, medical care, culture, science, and technology, are important factors in attracting migrants, while increasing the demand for housing for a large number of temporary residents. Regions with high-quality public resources are usually at higher administrative levels, such as the central cities in provinces, which incorporate vibrant real-estate markets; therefore, these regions are characterized by a high demand for land. In addition, a large amount of urban land is occupied by public resources, which exacerbates the demand for urban land and further increases the difference between land supply and demand, which drives housing prices higher.
Regions with highly developed tertiary industry are usually characterized by better urban development, and most traditional industries have been relocated, implying that those regions have strong comprehensive competitiveness and high urban quality. The proportion of high value-added formats, such as research and development, finance and business center economies, high-level industrial structure, and urban consumption structure, drive strong employment absorption, high employment quality, and large land demand. Moreover, urban residents’ relatively high capacity to afford high land prices, the active real-estate market, and higher expectations of rising housing prices directly promote higher land prices and, subsequently, housing prices.
The urban land supply plan is controlled and influenced by urban comprehensive planning and general land use planning, as well as the annual land supply policy. Because the government strictly controls the size and development boundaries for mega-cities, the large difference between land supply and demand in urban areas in capital cities will persist for a long time. Land becomes the object of many developments’ bidding and land prices continue to rise as a result of the short supply and high demand. This further increases the expectation for rising housing prices, which continues to drive increases in housing development costs and further price increases.

5 Conclusions

(1) The spatial variability in housing prices across China is characterized by distinct administrative level and spatial agglomeration differences. Regions with higher administrative levels maintain larger price ranges, more significant absolute differentiation within sub-markets, and more high-price areas.
(2) From the multiple perspectives of land prices, housing supply, housing demand, and housing market, we find that land prices, proportion of renters, floating population, housing affordability, and housing market activity all significantly affect regionally different housing prices in China. Land prices are the primary driver of housing prices at the county level; specifically, the effect of land prices on housing prices is the strongest in the urban areas of capital cities. In prefecture-level cities, counties, and county-level cities, the impact of land prices on housing prices is relatively weak.
(3) Land prices influencing housing prices are as follows: topographic factors, urban construction level, degree of agglomeration of high-quality public service resources, tertiary industrial development, and urban land supply plan (supply policies). These are the intrinsic drivers that determine land prices in the city, and through supply and demand, cost, expected growth, and market mechanisms, together they affect housing prices. The internal drivers also partially affect the other four factors, the proportion of renters, floating population, housing affordability, and housing market activity, leading to the distinct spatial variability in housing prices across China.

The authors have declared that no competing interests exist.

[1]
Bischoff O, 2012. Explaining regional variation in equilibrium real estate prices and income.Journal of Housing Economics, 21(1): 1-15.We combine the real estate model of Potepan (1996) with the spatial equilibrium approach of Roback (1982) to prove the interdependency of housing prices, rental prices, building land prices and income via one simultaneous equilibrium analysis. Using unique cross-sectional data on the majority of German counties and cities for 2005, we estimate the equations in their structural and reduced form. The results show significantly positive interaction effects of income and real estate prices. Moreover, we can confirm model predictions concerning the majority of exogenous determinants. In particular, expectations about population development seem to be among the most important determinants of price and income disparities between regions in the long term.

DOI

[2]
Bramley G, 1993. The impact of land use planning and tax subsidies on the supply and price of housing in Britain.Urban Studies, 30(1): 5-30.

DOI

[3]
Caplin A, Leahy J, 2011. Trading frictions and house price dynamics.Journal of Money, Credit and Banking, 43(Suppl.2): 283-303.We model liquidity in housing markets. The model provides a simple characterization for the joint process of prices, sales, and inventory. We compare the implications of the model to certain properties of housing markets. The model can generate the large price changes and the positive correlation between prices and sales that we see in the data. Unlike the data, prices are negatively autocorrelated and high inventory predicts price appreciation. We investigate several amendments to the model. Informational frictions show promise.

DOI

[4]
Capozza D R, Schwann G M, 1989. The asset approach to pricing urban land: Empirical evidence.Real Estate Economics, 17(2): 161-174.

DOI

[5]
Chen J, Guo F, Wu Y, 2011. One decade of urban housing reform in China: Urban housing price dynamics and the role of migration and urbanization, 1995-2005.Habitat International, 35(1): 1-8.This paper explores the possible effects of rural–urban migration and urbanization on China’s urban housing prices through focusing on a critical decade in urban housing reform, from 1995 to 2005. Compared with other countries, China differs, to a certain extent, in migration and urbanization patterns due to its unique Household Registration System ( Hukou) and huge population base. However, very few02empirical housing studies have examined the role of rapid urbanization and massive rural–urban migration in affecting housing price dynamics in China. This paper analyses the changes over time in housing prices in each Chinese province and examines empirically the determinants of urban house price at national and regional levels using time-series and cross-sectional data. The study finds that the abolition of the policy on the provision of welfare housing in 1998 is an important milestone in Chinese urban housing reform, which resulted in the market-oriented urban housing provision system. When comparing the results from coastal and inland provincial analyses, it is found that coastal provinces encountered greater pressure and challenges in dealing with the accommodation of migrants who were mainly from inland provinces. In contrast, inland provinces have relatively less pressure from migrants. The results from this paper are also in agreement with the hypothesis that regional variations in the urbanization level would have impact on the price of sold commodity houses. The results from this microlevel analysis of housing price may inform the Chinese policy makers to re-evaluate China’s urban housing reform policies from the perspective of facilitating labor migration and urbanization.

DOI

[6]
Chen Y, Wang H, 2011. Construction and application of bipartite recursive algorithm based on kernel density estimation: A new non-parametric method to measure the given income population scale.Statistics & Information Forum, 26(9): 3-8. (in Chinese)

[7]
Cohen J P, Ioannides Y M, Thanapisitikul W, 2015. Spatial effects and house price dynamics in the U.S.A.Journal of Housing Economics, 31(1): 1-13.This paper examines spatial effects in house price dynamics. Using panel data from 363 US Metropolitan Statistical Areas for 1996 to 2013, we find that there are spatial diffusion patterns in the growth rates of urban house prices. Lagged price changes of neighboring areas show greater effects after the 2007-2008 housing crash than over the sample period of 1996-2013. In general, the findings are robust to controlling for potential endogeneity, and for various spatial weights specifications (including contiguity weights and migration flows.) These results underscore the importance of considering spatial spillovers in MSA-level studies of housing price growth.

DOI

[8]
Fortura P, Kushner J, 1986. Canadian inter-city house price differentials.Real Estate Economics, 14(4): 525-536.The purpose of this paper is to identify the sources of intercity house price differentials in Canada. The results indicate that demand factors are important explanatory variables; a 1% increase in the income of households raises house prices by 1.11%; higher rates of anticipated inflation result in higher house prices as households increase their demand for real assets such as housing during inflationary periods; and finally, the fraction of households that are non-family households is positively associated with house prices. These results are in agreement with those of other countries.

DOI

[9]
Gao Y, Zhao R, Shan A.et al, 2010. SOFM-based classification for land price of city in China.Acta Scientiarum Naturalium Universitatis Pekinensis, 46(4): 655-660. (In Chinese)Cities at prefectural level(area cities)are not only high-speed economic developing areas,but also the key areas of land supply,reorganization and active transaction.Five variables such as area of land transfer,average land prices, GDP,growth rate of GDP,and fixed assets investment are used to develop a self-organizing feature map(SOFM)artificial neural network model.The results show that 282 area cities in China are divided into the four categories: developed area of high land prices,developed area of low land prices,underdeveloped area of high land prices,underdeveloped areas of low land prices.According to the results,the characteristics of each region are analyzed and the current development situation is discussed.Classification results match the objective reality very well,indicating SOFM-based classification method is an alternative approach in research of socio-economic development.

[10]
Glaeser E L, Gyourko J, Saks R, 2005. Why is Manhattan so expensive? Regulation and the rise in housing prices.Journal of Law & Economics, 48(2): 331-369.In Manhattan, housing prices have soared since the 1990s. Although rising incomes, lower interest rates, and other factors can explain the demand side of this increase, some sluggishness in the supply of apartment buildings is needed to account for high and rising prices. In a market dominated by high ises, the marginal cost of supplying more housing is the cost of adding an extra floor to any new building. Home building is a highly competitive industry with almost no natural barriers to entry, and yet prices in Manhattan currently appear to be more than twice their supply costs. We argue that land use restrictions are the natural explanation for this gap. We also present evidence that regulation is constraining the supply of housing in a number of other housing markets across the country. In these areas, increases in demand have led not to more housing units but to higher prices.

DOI

[11]
Green K P, Filipowicz J, Lafleur S.et al, 2016. The impact of land-use regulation on housing supply in Canada. Accessed September, 28.

[12]
Han L, Lu M, 2017. Housing prices and investment: An assessment of China’s inland-favoring land supply policies.Journal of the Asia Pacific Economy, 22(1): 106-121.Since 2003, China's central government has allocated more construction land-use quotas to inland provinces than elsewhere in an attempt to balance the growth gap between its coastal and inland regions. Here, firm-level data from 2001 to 2007 were used to determine how this change in land policy has affected firms' investments and housing prices. Results have shown that cities in which land-use quotas decreased experienced faster housing price growth than the cities in which land-use quotas increased after 2003. This sharp change in policy also highlighted two major channels of the effects of housing prices on investment by firms. The results show that higher housing prices increased firms' investment by providing a source of more valuable collateral, while crowding out fixed capital investment. The net effect of housing prices on investment is negative and limiting economic growth.

DOI

[13]
Holly S, Pesaran M H, Yamagata T, 2010. A spatio-temporal model of house prices in the USA.Journal of Econometrics, 158(1): 160-173.This paper provides an empirical analysis of changes in real house prices in the USA using State level data. It examines the extent to which real house prices at the State level are driven by fundamentals such as real per capita disposable income, as well as by common shocks, and determines the speed of adjustment of real house prices to macroeconomic and local disturbances. We take explicit account of both cross-sectional dependence and heterogeneity. This allows us to find a cointegrating relationship between real house prices and real per capita incomes with coefficients ( 1 , 1 ), as predicted by the theory. We are also able to identify a significant negative effect for a net borrowing cost variable, and a significant positive effect for the State level population growth on changes in real house prices. Using this model we then examine the role of spatial factors, in particular, the effect of contiguous states by use of a weighting matrix. We are able to identify a significant spatial effect, even after controlling for State specific real incomes, and allowing for a number of unobserved common factors. We do, however, find evidence of departures from long run equilibrium in the housing markets in a number of States notably California, New York, Massachusetts, and to a lesser extent Connecticut, Rhode Island, Oregon and Washington State.

DOI

[14]
Holmes M J, Otero J, Panagiotidis T, 2011. Investigating regional house price convergence in the United States: Evidence from a pair-wise approach.Economic Modelling, 28(6): 2369-2376.In this paper we examine long-run house price convergence across US states using a novel econometric approach advocated by Pesaran (2007) and Pesaran et al. (2009). Our empirical modelling strategy employs a probabilistic test statistic for convergence based on the percentage of unit root rejections among all state house price differentials. Using a sieve bootstrap procedure, we construct confidence intervals and find evidence in favour of convergence. We also conclude that speed of adjustment towards long-run equilibrium is inversely related to distance.Highlights? House price convergence is investigated for US states and Metropolitan Areas. ? A probabilistic test statistic is based on pair-wise unit root tests. ? Confidence intervals are obtained from a bootstrap procedure. ? The results confirm the presence of long-run convergence. ? The speed of adjustment is inversely related to the distance between states.

DOI

[15]
Hu Y, Wang J, Li X.et al, 2011. Geographical detector-based risk assessment of the under-five mortality in the 2008 Wenchuan earthquake, China.PLoS One, 6(6): e21427.On 12 May, 2008, a devastating earthquake registering 8.0 on the Richter scale occurred in Sichuan Province, China, taking tens of thousands of lives and destroying the homes of millions of people. Many of the deceased were children, particular children less than five years old who were more vulnerable to such a huge disaster than the adult. In order to obtain information specifically relevant to further researches and future preventive measures, potential risk factors associated with earthquake-related child mortality need to be identified. We used four geographical detectors (risk detector, factor detector, ecological detector, and interaction detector) based on spatial variation analysis of some potential factors to assess their effects on the under-five mortality. It was found that three factors are responsible for child mortality: earthquake intensity, collapsed house, and slope. The study, despite some limitations, has important implications for both researchers and policy makers.

DOI PMID

[16]
Hwang M, Quigley J M, 2006. Economic fundamentals in local housing markets: Evidence from US metropolitan regions.Journal of Regional Science, 46(3): 425-453.ABSTRACT. This paper investigates the effects of national and regional economic conditions on outcomes in the single-family housing market: housing prices, vacancies, and residential construction activity. Our three-equation model confirms the importance of changes in regional economic conditions, income, and employment on local housing markets. The results also provide the first detailed evidence on the importance of vacancies in the owner-occupied housing market on housing prices and supplier activities. The results also document the importance of variations in materials, labor and capital costs, and regulation in affecting new supply. Simulation exercises, using standard impulse response models, document the lags in market responses to exogenous shocks and the variations arising from differences in local parameters. The results also suggest the importance of local regulation in affecting the pattern of market responses to regional income shocks.

DOI

[17]
Ihlanfeldt K R, 2007. The effect of land use regulation on housing and land prices.Journal of Urban Economics, 61(3): 420-435.This paper investigates the effects of land use regulation restrictiveness on house and vacant land prices. In contrast to prior studies, the index of restrictiveness is treated as an endogenous variable and estimated effects are allowed to vary by market setting. Using data on more than 100 Florida cities, greater regulation restrictiveness is found to increase house price and decrease land price. Evidence is also provided showing that more restrictiveness increases the size of newly constructed homes.

DOI

[18]
Kim S W, Bhattacharya R, 2009. Regional housing prices in the USA: An empirical investigation of nonlinearity.The Journal of Real Estate Finance and Economics, 38(4): 443-460.Existing literature on housing prices is predominantly in a linear framework, and an important question that has not been addressed is whether housing prices exhibit nonlinearity. We examine Smooth Transition Autoregressive (STAR) model based nonlinear properties of housing prices over the 1969 2004 period for the entire US and the four regions. Our main findings are (1) housing price for the entire US and all regions except for the Midwest show non-linearity, (2) the dynamic properties implied by the nonlinear estimation explain the typical patterns that have characterized each housing market, and (3) results of Granger causality tests look more plausible in the nonlinear framework where we find stronger evidence of Granger causality from housing price to employment and also from mortgage rates to housing price.

DOI

[19]
Kuethe T H, Pede V O, 2011. Regional housing price cycles: A spatio-temporal analysis using US state-level data.Regional Studies, 45(5): 563-574.Kuethe T. H. and Pede V. O. Regional housing price cycles: a spatio-temporal analysis using US state-level data, Regional Studies. A study is presented of the effects of macroeconomic shocks on housing prices in the Western United States using quarterly state-level data from 1988:1 to 2007:4. The study contributes to the existing literature by explicitly incorporating locational spillovers through a spatial econometric adaptation of vector autoregression (SpVAR). The results suggest these spillovers may Granger cause housing price movements in a large number of cases. SpVAR provides additional insights through impulse response functions that demonstrate the effects of macroeconomic events in different neighbouring locations. In addition, it is demonstrated that including spatial information leads to significantly lower mean-square forecast errors. Kuethe T. H. et Pede V. O. La variation cyclique régionale du prix du logement: une analyse géographico-temporelle des données sur les états aux E-U, Regional Studies. A partir des données trimestrielles au premier trimestre de 1988 jusqu'au quatrième trimestre de 2007, on présente ici une étude des effets des chocs macroéconomiques sur le prix du logement dans le sud-ouest des Etats-Unis. L'étude contribue à la documentation actuelle en incorporant explicitement les retombées géographiques par moyen d'une adaptation spatiale économétrique de l'autorégression vectorielle (spVAR). Les résultats laissent supposer que ces retombées pourraient entra06ner une variation du prix du logement en de nombreuses situations. SpVAR fournit des aper04us supplémentaires par moyen des fonctions de réponse spontanée qui montrent l'impact des chocs macroéconomqiues dans divers endroits voisins. En plus, on démontre que l'inclusion des données spatiales réduit sensiblement les erreurs quadratiques moyennes prévues. Prix du logment69Autorégression vectorielle69Econométrie spatiale Kuethe T. H. und Pede V. O. Regionale Hauspreiszyklen: eine r01umlich-zeitliche Analyse von Daten auf US-Bundesstaatsebene, Regional Studies. In dieser Studie verdeutlichen wir mit Hilfe von Quartalsdaten auf Bundesstaatsebene im Zeitraum vom ersten Quartal 1988 bis zum vierten Quartal 2007 die Auswirkungen makro02konomischer Schocks auf die Hauspreise im Westen der USA. Die Studie tr01gt zur vorhandenen Literatur bei, indem sie standortspezifische 05bertragungen mit Hilfe einer r01umlichen 02konometrischen Anpassung der Vektor-Autoregression (SpVAR) explizit einbezieht. Aus den Ergebnissen geht hervor, dass diese 05bertragungen in vielen F01llen Granger-kausal auf Ver01nderungen bei den Hauspreisen wirken k02nnen. Die SpVAR bietet zus01tzliche Einblicke in Form von Impulsantwort-Funktionen, die die Auswirkungen makro02konomischer Ereignisse in verschiedenen angrenzenden Standorten nachweisen. Zus01tzlich wird nachgewiesen, dass die Einbeziehung r01umlicher Informationen zu signifikant niedrigeren mittleren quadratischen Prognosefehlern führt. Hauspreise69Vektorautoregression (VAR)69R01umliche 00konometrie Kuethe T. H. y Pede V. O. Ciclos en los precios de la vivienda a nivel regional: un análisis espacio-temporal usando datos estatales de los Estados Unidos, Regional Studies. Con ayuda de datos trimestrales a nivel estatal de 1988:1 a 2007:4, presentamos un estudio sobre los efectos de los choques macroeconómicos en los precios de la vivienda en la zona occidental de los Estados Unidos. El estudio contribuye a la literatura existente al incorporar explícitamente los desbordamientos de ubicación a través de una adaptación econométrica espacial de la autorregresión vectorial (SpVAR). Los resultados indican que estos desbordamientos según la causalidad de Granger podrían causar movimientos en los precios de la vivienda en un gran número de casos. La SpVAR proporciona nuevas perspectivas a través de funciones de respuesta de impulsos que demuestran los efectos de los sucesos macroeconómicos en diferentes lugares próximos. Además, demostramos que incluyendo información espacial conduce significativamente a menos errores en los pronósticos de valor medio cuadrático. Precios de la vivienda69Autorregresión vectorial (VAR)69Factores econométricos espaciales

DOI

[20]
Li Q, Chand S, 2013. House prices and market fundamentals in urban China.Habitat International, 40(7): 148-153.House prices in China increased at an average annual nominal rate of 11% in the two decades to 2009: This increase in prices occurred during a period of rapid transition in ideology (from the plan to the market), in income, urban population and policies. This paper uses annual data from 29 provinces from 1998 to 2009 to determine the contribution of market fundamentals to house prices in urban China. The findings show that important market fundamentals such as the levels of income, construction costs, impending marriages, user cost and land prices are the primary determinants of house prices. A second finding is that housing prices in more developed provinces are determined by supply factors including construction costs and land prices, while prices in other provinces are determined by both demand and supply factors. (C) 2013 Elsevier Ltd. All rights reserved.

DOI

[21]
Liang W, Lu M, Zhang H, 2016. Housing prices raise wages: Estimating the unexpected effects of land supply regulation in China.Journal of Housing Economics, 33: 70-81.China is currently experiencing rapid rises in labor cost. Since 2003, the central government has increased the share of land use quotas allocated to the central and western regions to support their development. As a result, the relative decline in land supply in the eastern regions has raised housing prices and consequently increased wages, damaging the competitiveness of the Chinese economy. On the basis of city-level panel data from 2001 to 2010, we used the per capita land supply as the instrument variable for housing prices and analyzed the sub-samples along the border between the inland and the eastern regions. We found that land supply policies have led to the rapid growth of housing prices and increased wages in the cities where land supply has been restricted, mainly in eastern region. This study indicates that regardless of the geographical advantages of the east region, land supply policies have had a negative impact on the efficiency and competitiveness of the Chinese economy.

DOI

[22]
Malpezzi S, 1996. Housing prices, externalities, and regulation in U.S. metropolitan areas.Journal of Housing Research, 7(2): 209-241.No abstract is available for this item.

DOI

[23]
Mankiw N G, Weil D N, 1989. The baby boom, the baby bust, and the housing market.Regional Science and Urban Economics, 19(2): 235-258.This paper examines the impact of major demographic changes on the housing market in the United States. The entry of the Baby Boom generation into its house-buying years is found to be the major cause of the increase in real housing prices in the 1970s. Since the Baby Bust generation is now entering its house-buying years, housing demand will grow more slowly in the 1990s than in any time in the past forty years. If the historical relation between housing demand and housing prices continues into the future, real housing prices will fall substantially over the next two decades.

DOI PMID

[24]
Ortalomagné F, Rady S, 2001. Housing market dynamics: On the contribution of income shocks and credit constraints.Review of Economic Studies, 73(2): 459-485.We propose a life-cycle model of the housing market with a property ladder and a credit constraint. We focus on equilibria that replicate the facts that credit constraints delay some households' first home purchase and force other households to buy a home smaller than they would like. The model helps us identify a powerful driver of the housing market: the ability of young households to afford the down payment on a starter home, and in particular their income. The model also highlights a channel whereby changes in income may yield housing price overreaction, with prices of trade-up homes displaying the most volatility, and a positive correlation between housing prices and transactions. This channel relies on the capital gains or losses on starter homes incurred by credit-constrained owners. We provide empirical support for our arguments with evidence from both the U.K. and the U.S.

DOI

[25]
Peng R, Wheaton W C, 1994. Effects of restrictive land supply on housing in Hong Kong: An econometric analysis.Journal of Housing Research, 5(2): 263-291.

[26]
Potepan M J, 1996. Explaining intermetropolitan variation in housing prices, rents and land prices.Real Estate Economics, 24(2): 219-245.In attempting to explain why housing prices, rents and urban land prices vary so dramatically between U.S. metropolitan areas, a simple model of a metropolitan housing market is presented identifying three interrelated submarkets. Estimating equations for rent, housing prices and urban land prices are identified and estimated using two-stage least squares. The empirical results provide strong support for the theoretical model concerning how these three submarkets interact. The results also suggest that household income and construction costs are the most important factors causing housing prices, rents and land prices to vary between metropolitan areas.

DOI

[27]
Quigley J M, Rosenthal L A, 2s005. The effects of land use regulation on the price of housing: What do we know? What can we learn? Cityscape, 8(1): 69-137.Effective governance of residential development and housing markets poses difficult challenges for land regulators. In theory, excessive land restrictions limit the buildable supply, tilting construction toward lower densities and larger, more expensive homes. Often, local prerogative and regional need conflict, and policymakers must make tradeoffs carefully. When higher income incumbents control the political processes by which local planning and zoning decisions are made, regions can become less affordable as prices increase. Housing assistance programs meant to benefit lower income households could be frustrated by limits on density and other restrictions on the number and size of new units. The empirical literature on the effects of regulation on housing prices varies widely in quality of research method and strength of result. A number of credible papers seem to bear out theoretical expectations. When local regulators effectively withdraw land from buildable supplies hether under the rubric of "zoning," "growth management," or other regulation he land factor and the finished product can become pricier. Caps on development, restrictive zoning limits on allowable densities, urban growth boundaries, and long permit-processing delays have all been associated with increased housing prices. The literature fails, however, to establish a strong, direct causal effect, if only because variations in both observed regulation and methodological precision frustrate sweeping generalizations. A substantial number of land use and growth control studies show little or no effect on price, implying that sometimes, local regulation is symbolic, ineffectual, or only weakly enforced. The literature as a whole also fails to address key empirical challenges. First, most studies ignore the "endogeneity" of regulation and price (for example, a statistical association may show regulatory effect or may just show that wealthier, more expensive communities have stronger tastes for such regulation). Second, research tends not to recognize the complexity of local policymaking and regulatory behavior. For example, enactments promoting growth and development, often present in the same jurisdictions where zoning restrictions are observed, are rarely measured or analyzed. Third, regulatory surveys are administered sparsely and infrequently. Current studies are often forced to rely on outdated land use proxies and static observations of housing price movements. Fourth, few studies utilize sophisticated price indexes, such as those measuring repeat sales of individual properties. Such methods correct for well-known biases in price means and medians typically reported. An agenda for future research in the area of regulatory effects on price should address these shortcomings and generate replicable findings relevant for policy reform efforts. Ideally, a national regulatory census would measure at regular intervals municipal enactments and implementation patterns. The most demanding aspect of this task is the development of standard regulatory indexes facilitating comparison at the municipal level and allowing for aggregation to the metropolitan and state levels. Over time, this survey should help describe changes in antecedent law and resulting land policy behavior so that time series encompassing regulation and price can be compiled. Existing building permit surveys can be adapted to facilitate this effort. Regular reporting from developers and builders regarding their experiences with local regulatory processes should then complement the census of laws and behaviors. An additional source of information would be a regularly refreshed, national land use survey, mapping in some detail the ever-changing patterns of residential and other development in metropolitan areas. Early efforts to improve and expand research should focus primarily on the deliberate, painstaking development of better, more current data. When better data are available, the existing community of scholars will develop methods providing more reliable tests of hypotheses about the link between regulation and the well-being of housing consumers.

[28]
Quigley J M, Swoboda A M, 2010. Land use regulation with durable capital.Journal of Economic Geography, 10(1): 9-26.This article compares the level and distribution of the welfare changes from restricting land available for residential development in a city. We compare the economic costs when residential capital is durable with the costs when capital is perfectly malleable and those when population is also freely mobile. Our simulation, based on the stylized specification of an urban location model, suggests that in a more realistic setting with durable capital, the costs of regulation are substantially higher than they are when capital is assumed to be malleable or when households are assumed to be fully mobile. Importantly, the extent of wealth redistribution attributable to these regulations is much larger when these more realistic factors are recognized. When capital is durable, the results also imply that far more new development takes place on previously undeveloped land at the urban boundary, sometimes resulting in an increase in total land under development.

DOI

[29]
Qin Y, Zhu H, Zhu R, 2016. Changes in the distribution of land prices in urban China during 2007-2012.Regional Science and Urban Economics, 57: 77-90.61We examine the changes in land prices in urban China between 2007 and 2012.61Land prices are analyzed using quantile regression and decomposition methods.61Price gaps are decomposed into a composition effect and a coefficient effect.61The two effects vary with the part of the price distribution and differ by land types.

DOI

[30]
Rubin Z, Felsenstein D, 2017. Supply side constraints in the Israeli housing market: The impact of state owned land.Land Use Policy, 65: 266-276.House prices in Israel have risen since 2008 by as much as 98%. Much of this increase is attributed to low levels of housing supply and housing supply elasticities. In Israel land is frequently owned by the state. This results in heavy government involvement in the housing market through the control of land supply via land tenders. This paper estimates the impact of state owned land on the Israeli housing market focusing on these unusual conditions of land supply. A model for the creation of new housing units is proposed. This incorporates land tenders, enabling the estimation of housing supply dynamics with an accurate measure of public land supply. The model is tested using regional panel data which facilitates the dynamic estimation of national and local supply elasticities and regional spillovers. The paper uses novel data sources resulting in a panel of 45 spatial units over a span of 11 years (2002 2012). Due to the nonstationary nature of the data, spatial panel cointegration methods are used. The empirical results yield estimates of housing supply price elasticities and elasticities with respect to land supply. Results show that housing supply is positively impacted by governmental decisions but the impact is low. Supply elasticity with regard to government land tenders stands at around 0.05 over the short run and 0.08 over the long run. Government policy of offering land in low demand areas and fixing minimum-price tendering does not seem to affect housing supply. Policy implications point to the need for more sensitive management of the delicate balance between public and private source of land in order to mitigate the excesses of demand shocks.

DOI

[31]
Shen Y, Liu H, 2004. Housing prices and economic fundamentals: A cross city analysis of China for 1995-2002.Economic Research Journal, 6: 78-86.Using the Panel Data of housing prices and economic fundamentals of 14 cities for 1995—2002, with the Pooled Least Squares and Dummy Variable Regression Model, this paper investigates the city-level interactions of housing prices and economic fundamentals in China. It reveals that, during all the period, past and current information of economic fundamentals could partially explain the level or percentage change rate of housing prices and the city-level housing market in China is not in accordance with the Efficient Market Hypothesis. Special effects of cities do exist in the reduced form composed by the level of the variables, and special effects of years are significant in 1998 and later on, especially for 2001—2002. The growth of housing prices could not be well explained by past information of economic fundaments and housing prices in recent years which may need the policy makers and practitioners pay enough attention to.

[32]
Shih Y N, Li H C, Qin B, 2014. Housing price bubbles and inter-provincial spillover: Evidence from China.Habitat International, 43(4): 142-151.61Housing bubbles and affordability problems do exist in some provinces of China.61Housing prices of the provinces in the same possible contagious regions are cointegrated.61The spillover effects exist in the contagious regions around Beijing and Shanghai.

DOI

[33]
Smith L B, 1974. The Postwar Canadian Housing and Residential Mortgage Markets and the Role of Government. Toronto: University of Toronto Press.

[34]
Song J, Jin X, Tang J.et al, 2011. Analysis of influencing factors for urban land price and its changing trend in China in recent years.Acta Geographica Sinica, 66(8): 1045-1054. (in Chinese)There are many factors affecting the level of land price and its changing trends, and these factors may fluctuate from time to time according to social and economic development and people's demands. In this paper, hierarchical linear models were employed to quantitatively measure the influences and interactions of 10 factors which were chosen in three aspects of urban land supply and demand and farmland protection policy, including real estate investment, population density, urban construction land area, new area for land transfer, arable land occupation tax, new construction land use fee. The level-1 and level-2 models constitute an individual development model using quarterly land price data of 105 cities of China with well-developed land markets from 2008 to 2010 and municipal influencing factors data, aiming to explore the way these factors affect the urban land price and its growth rate. The level-2 and level-3 models constitute an organization model, intending to explore contribution degree of the provincial factors chosen in this paper to land price and its growth rate. The results showed that there are multi-level factors affecting urban land price and its growth rate, and the interclass correlation coefficient shows that 12.45% of the difference in urban land price comes from provincial "background effect". Influencing factors of urban land price and its growth rate are different, and their dominant influencing factors have significant difference. Six municipal influencing factors chosen in this paper explained 82.07% of the difference in urban land price altogether, while 62.75% of the difference in urban land price growth rate. This illustrates that changes in land price growth rate is more "rational" than those of land price. Real estate investment explained 79.90% of the difference in urban land price, being the biggest influencing factor of all the municipal factors, which is the direct driving force of land prices rising. Meanwhile, both urban construction land area and real estate investment have a significant influence on land price growth rate. Farmland protection policies have a significant effect on controlling the level of land price and its growth rate. Concretely, new construction land use fee and arable land occupation tax are two of the most notable land price influencing factors at the provincial level.

DOI

[35]
Wang J F, Li X H, Christakos G.et al, 2010. Geographical detectors-based health risk assessment and its application in the neural tube defects study of the Heshun Region, China.International Journal of Geographical Information Science, 24(1): 107-127.Physical environment, man‐made pollution, nutrition and their mutual interactions can be major causes of human diseases. These disease determinants have distinct spatial distributions across geographical units, so that their adequate study involves the investigation of the associated geographical strata. We propose four geographical detectors based on spatial variation analysis of the geographical strata to assess the environmental risks of health: the risk detector indicates where the risk areas are; the factor detector identifies factors that are responsible for the risk; the ecological detector discloses relative importance between the factors; and the interaction detector reveals whether the risk factors interact or lead to disease independently. In a real‐world study, the primary physical environment (watershed, lithozone and soil) was found to strongly control the neural tube defects (NTD) occurrences in the Heshun region (China). Basic nutrition (food) was found to be more important than man‐made pollution (chemical fertilizer) in the control of the spatial NTD pattern. Ancient materials released from geological faults and subsequently spread along slopes dramatically increase the NTD risk. These findings constitute valuable input to disease intervention strategies in the region of interest.

DOI

[36]
Wang S J, Fang C L, Guan X L.et al, 2014a. Urbanization, energy consumption, and CO2 emissions in China: A panel data analysis of China’s province.Applied Energy, 136: 738-749.Global warming resulting from rapid economic growth across the world has become a worldwide threat. The coordination of development of urbanisation, energy consumption, and carbon dioxide (CO2) emissions therefore forms an important issue; it has attracted considerable attention from both governments and researchers in recent years. This study investigated the relationship between urbanisation, energy consumption, and CO2 emissions over the period 1995 2011, using a panel data model, based on the data for 30 Chinese provinces. The potential to reduce CO2 emissions was also analysed. The results indicated that per capita CO2 emissions in China were characterised by conspicuous regional imbalances during the period studied; in fact, per capita CO2 emissions decrease gradually from the eastern coastal region to the central region, and then to the western region. Urbanisation, energy consumption, and CO2 emissions were found to present a long run bi-directional positive relationship, the significance of which was discovered to vary between provinces as a result of the scale of their respective economies. In addition, a bi-directional causal relationship was found to exist between urbanisation, energy consumption, and CO2 emissions: specifically, a bi-directional positive causal relationship exists between CO2 emissions and urbanisation, as well as between energy consumption and CO2 emissions, and a one way positive causal relationship exists from urbanisation to energy consumption. Scenario simulations further demonstrated that whilst China per capita and total CO2 emissions will increase continuously between 2012 and 2020 under all of the three scenarios developed in this study, the potential to achieve reductions is also high. A better understanding of the relationship between urbanisation, energy consumption, and CO2 emissions will help China to realise the low-carbon economic development.

DOI

[37]
Wang S J, Fang C L, Ma H T.et al, 2014b. Spatial differences and multi-mechanism of carbon footprint based on GWR model in provincial China.Journal of Geographical Sciences, 24(4): 804-822.Global warming has been one of the major concerns behind the world’s high-speed economic growth. How to implement the coordinated development of the carbon footprint and the economy will be the core issue of the world’s economic and social development, as well as the heated debate of the research at home and abroad in recent years. Based on the energy consumption, integrated with the “Top-Down” life cycle approach and geographically weighted regression (GWR) model, this paper analyzed the spatial differences and multi-mechanism of carbon footprint in provincial China in 2010. Firstly, this study calculated the amount of carbon footprint of each province using “Top-Down” life cycle approach and found that there were significant differences of carbon footprint and per capita carbon footprint in provincial China. The provinces with higher carbon footprint, mainly located in northern China, have large economic scales; the provinces with higher per capita carbon footprint are mainly distributed in central cities such as Beijing, Shanghai and energy-rich regions and heavy chemical bases. Secondly, with the aid of GIS and spatial analysis model (GWR model), this paper had unfolded that the expansion of economic scale is the main driver of the rapid growth of carbon footprint. The growth of population and urbanization also acted as promoting factors for the increase of the carbon footprint. Energy structure had no considerable promoting effect for the increase of the carbon footprint. Improving energy efficiency is the most important factor to inhibit the growing carbon footprint. Thirdly, developing low-carbon economies and low-carbon industries, as well as advocating low-carbon city construction and improving carbon efficiency would be the primary approaches to inhibit the rapid growth of carbon footprint. Moderately controlling the economic scale and population size would also be required to alleviate carbon footprint. Meanwhile, environmental protection and construction of low-carbon cities would evoke extensive attention in the process of urbanization.

DOI

[38]
Wang S J, Fang C L, Wang Y.et al, 2015. Quantifying the relationship between urban development intensity and carbon dioxide emissions using a panel data analysis.Ecological Indicators, 49: 121-131.As a factor associated with urban management and planning, urban development intensity (UDI) could in fact form the basis for a new rationale in coordinating urban sustainable development and reducing CO2emissions. However, existing literature engaging in the task of quantifying the impacts of urban development intensity on CO2emissions is limited. Therefore, the goal of this study is to quantify the relationship between urban development intensity and CO2emissions for a panel made up of the five major cities in China (Beijing, Shanghai, Tianjin, Chongqing and Guangzhou) using time series data from 1995 to 2011. Firstly, this study calculated CO2emissions for the five selected cities and presented a comprehensive index system for the assessment of the level of urban development intensity based on six aspects (land-use intensity, economic intensity, population intensity, infrastructure intensity, public service intensity and eco-environmental intensity) using locally important socioeconomic variables. Panel data analysis was subsequently utilised in order to quantify the relationships between urban development intensity and CO2emissions. The empirical results of the study indicate that factors such as land-use intensity, economic intensity, population intensity, infrastructure intensity and public service intensity exert a positive influence on CO2emissions. Further, the estimated coefficients suggest that land-use intensity is the most important factor in relation to CO2emissions. Conversely, eco-environmental intensity was identified as having a major inhibitory effect on CO2emission levels. The findings of this study hold important implications for both academics and practitioners, indicating that, on the path towards developing low-carbon cities in China, the effects of urban development intensity must be taken into consideration.

DOI

[39]
Wang S J, Fang C L, Wang Y, 2016a. Spatiotemporal variations of energy-related CO2 emissions in China and its influencing factors: An empirical analysis based on provincial panel data.Renewable & Sustainable Energy Reviews, 55: 505-515.This paper examines carbon dioxide (CO2) emissions from the perspective of energy consumption, detailing an empirical investigation into the spatiotemporal variations and impact factors of energy-related CO2 emissions in China. The study, which is based on a provincial panel data set for the period 1995鈥2011, used an extended STIRPAT model, which was in turn examined using System-Generalized Method of Moments (Sys-GMM) regression. Results indicate that while per capita CO2 emissions in China were characterized by conspicuous regional imbalances during the period studied, regional inequality and spatial autocorrelation (agglomeration) both decreased gradually between 1995 and 2011, and the pattern evolutions of emissions evidenced a clear path dependency effect. The urbanization level was found to be the most important driving impact factor of CO2 emissions, followed by economic level and industry proportion. Conversely, tertiary industry proportion constituted the main inhibiting factor among the negative influencing factors, which also included technology level, energy consumption structure, energy intensity, and tertiary industry proportion. Importantly, the study revealed that the CO2 Kuznets Curve (CKC), which describes the relation between CO2 emissions and economic growth, in fact took the form of N-shape in the medium- and long-term, rather than the classical inverted-U shape of the environmental Kuznets Curve (EKC). Specifically, an additional inflection appeared after the U-shape relationship between economic growth and CO2 emissions, indicating the emergence of a relink phase between the two variables. The findings of this study have important implications for policy makers and urban planners: alongside steps to improve the technology level, accelerate the development of tertiary industry, and boost recycling and renewable energies, the optimization of a country energy structure that can in fact reduce reliance on fossil energy resources and constitute an effective measure to reduce CO2 emissions.

DOI

[40]
Wang S J, Li Q Y, Fang C L.et al, 2016b. The relationship between economic growth, energy consumption, and CO2 emissions: Empirical evidence from China.Science of the Total Environment, 542: 360-371.61The nexus between economic growth, energy use and CO2emissions for China examined.61Cointegration tests suggest presence of long-run relationship among the variables.61Generalized impulse response due to the external shocks to the system examined.61Bi-directional causality between economic growth and energy consumption.61Unidirectional causality from energy consumption to CO2emissions.

DOI PMID

[41]
Wang S J, Liu X P, Zhou C S.et al, 2017. Examining the impacts of socioeconomic factors, urban form, and transportation networks on CO2 emissions in China’s megacities.Applied Energy, 185: 189-200.In addition to socioeconomic factors, urban planning and transportation organization are beginning to play an increasingly important role in the reduction of CO2emissions. However, little attention has been paid to the ways in which this emerging role can be framed. Therefore, this study aims to examine the combined impacts of socioeconomic and spatial planning factors on CO2emissions in cities that have experienced rapid urbanization, using an econometric model and a comprehensive panel dataset incorporating socioeconomic, urban form, and transportation factors for four Chinese megacities eijing, Tianjin, Shanghai and Guangzhou, n the period 1990 2010. Making use of remote sensing land-use data, the digitization of transportation maps, and a set of socioeconomic data, we developed an extended STRIPAT model in order to empirically estimate the impacts of the selected variables on CO2emission levels in these cities. The results indicate that the socioeconomic factors of economic growth, urbanization, and industrialization will lead to increased CO2emissions, while the service level and technology level can contribute to the reduction of CO2emissions. The results also suggest that the expansion of urban land use and increases in urban population density should be controlled through urban planning measures in order to reduce CO2emissions. In addition, pursuing compact urban development patterns would also help to reduce CO2emissions. Transportation factors including urban road density and the traffic coupling factor were both found to have exerted significant negative effects on CO2emission levels, indicating that increases in the coupling degree between urban spatial structure and traffic organization can also contribute to reducing such emissions. Our results cast a new light on the importance of practices of urban planning and spatial optimization measures in achieving CO2emission reductions. The findings obtained in this study are seen as providing important decision support in building low-carbon cities in China.

DOI

[42]
Wang Y, Fang C L, Sheng C Y, 2013. Spatial differentiation and model evolution of housing prices in Yangzhou.Acta Geographica Sinica, 68(8): 1082-1096. (in Chinese)Urban housing price differentiation is an important issue in urban geography.However,relatively little analysis is available on continual time for all types,and all space.In China's high housing price times,housing price has become the core issue which was paid close attention by the government and inhabitants.The focus of this research is to examine global differentiation,spatial differentiation,model evolution and dynamics of housing prices in Yangzhou.Housing prices data for housing estates in the period 2001-2012 were used.Global differentiation index(GDI) was established to measure the trend of global and within-group differentiations on housing prices in Yangzhou.Then based on kernel density estimation(KDE),the evolvement rule of distribution shape and differentiation pattern of housing price is examined.After that,the trend of spatial differentiation of 6 types housing prices was captured by trend analysis.Finally,the model and dynamics of spatial differentiation and pattern were summarized according to the above results.The results show that:(1) there have been increasing gaps among housing estates since 2001.In this period,the trend of differentiation has showed an upward fluctuation,which is coupled with the annual growth rate of housing price.Moreover,there exists a sector pattern of western-eastern differentiation.The spatial distribution of housing estates of homogeneity price turned cluster in 2001 into dispersion in 2012.Meanwhile,high price and low price housing estates are expanded along particular directions from core to periphery;(2) the fluctuations of prices on 6 types housing are obviously different.And their price levels are unequal,but their shapes of trend are similar;(3) the spatial model that is sector of western-eastern differentiation with cluster on housing estates of homogeneity price in 2001 has been turned into sector and concentric circles integrated on housing estates of heterogeneity price in 2012;(4) the core dynamics of global differentiation on housing price exert great influence on rapidly expansion of urban residential land,widening of residents' income gap,boom of real estate market,and diversification of housing types.The main dynamics of the enrollment of spatial pattern on housing price are as follows: the formulation and change of direction for urban development,locational direction on dwelling construction of particular housing types,ancient city protection,urban redevelopment and new urban district construction.

[43]
Wang Y, Fang C L, Xiu C L.et al, 2012. A new approach to measurement of regional inequality in particular directions.Chinese Geographical Science, 22(6): 705-717.AbstractRegional inequality is a core issue in geography, and it can be measured by several approaches and indexes. However, the global inequality measures can not reflect regional characteristics in terms of spatiality and non-mobility, as well as correctly explore regional inequality in particular directions. Although conventional between-group inequality indexes can measure the inequality in particular directions, they can not reflect the reversals of regional patterns and changes of within-group patterns. Therefore, we set forth a new approach to measure regional inequality in particular directions, which is applicable to geographic field. Based on grouping, we established a new index to measure regional inequality in particular directions named Particular Direction Inequality index (PDI index), which is comprised of between-group inequality of all data and between-group average gap. It can reflect regional spatiality and non-mobility, judge the main direction of regional inequality, and capture the changes and reversals of regional patterns. We used the PDI index to measure the changes of regional inequality from 1952 to 2009 in China. The results show that: 1) the main direction of China regional inequality was between coastal areas and inland areas; the increasing extent of inequality between coastal areas and inland areas was higher than the global inequality; 2) the PDI index can measure the between-region average gap, and is more sensitive to evolution of within-region patterns; 3) the inequality between the northern China and the southern China has been decreasing from 1952 to 2009 and was reversed in 1994 and 1995.

DOI

[44]
Wang Y, Li Q, Wang S J.et al, 2014. Determinants and dynamics of spatial differentiation of housing price in Yangzhou.Progress in Geography, 33(3): 375-388. (in Chinese)Urban housing price differentiation is an important issue in urban geography. Given the current high prices of housing in China,spatial variation of inner city housing prices becomes an important part of the Chinese urban geographic studies. Housing prices in China have become the focus of concern for both the government and urban residents,had significant implications for social justice and stability,improvement of living standards,enhancement of residential satisfaction and social harmony,as well as become the key issue in sustainable urbanization and the healthy development of real estate markets. Therefore,housing prices has become the core issue that is paid close attention by all levels of governments and inhabitants. The focus of this research is to examine determinants and dynamics of spatial differentiation of housing price in Yangzhou. In this paper,all types of residential areas located in Yangzhou are investigated,with the living quarters(or residential groups) taken as the basic research unit,with data in 2012. As the study included ordinary commercial housing,attached and detached houses,high-end commercial and residential apartments,housing-reform quarters,affordable houses and single-storey cottages,that is,all housing types that can be sold on the market,the result of this investigation is much more reliable compared to other studies that analyzed only ordinary commercial housing. Our appraisal system of urban housing price differentiation composed of 20 evaluation factors,four determinants and four expectation factors. The four determinants contain building(architectural) characteristics,residential quarter characteristics,location and convenience features,and landscape and environmental characteristics. The four expectation factors are displacement and resettlement,residential quarter renewal,urban spatial development strategy,and landscape and environmental renovations. Based on the evaluation and expectation factors,we calculated the scores of the four determinants in all residential groups,and analyzed their spatial differentiation patterns. Linear regression was performed between the dependent variable-housing prices of the 1305 residential quarters in Yangzhou in 2012,and the independent variables: the four determinants of price. The main influence factors of the city-wide housing market and sub-markets were evaluated by regression against housing prices. The results show that:(1) spatial patterns of the four determinants' scores are clearly different. Building characteristics and residential quarter characteristics scores show a low(center district) to high(outskirts) differentiation with concentric circles. Scores of location and convenience and landscape and environment characteristics are high in the west and center districts,and low in the east district and outskirts.(2) The key determinant of housing price is residential quarter characteristics in Yangzhou. There exist different key determinants for respective housing sub-markets.(3) The main dynamics of spatial differentiation of housing prices are as follows: locational direction on dwelling construction of particular housing types,spatial agglomeration of particular income groups,spatial inequality of investment in public commodity and locational direction on urban residential expansion and urban redevelopment. These dynamics acted on the four determinants and generated the observed spatial differentiation of housing prices in Yangzhou.

DOI

[45]
Wang Y, Wang D L, Liu X L.et al, 2015. Spatial differentiation of urban housing prices and its impacts on land market in China.China Land Sciences, 29(6): 33-40. (in Chinese)The purpose of this study is to study on the new trends, new patterns and new features of spatial differentiation of urban housing prices in China, and discuss driving factors and mechanism of land market. Methods employed were PDI index, GIS and gray relative analysis. The results indicate that 1) significant spatial inequality of urban housing prices exists in china, especially the grade differentiation between first-tier cities and other cities; 2) the administrative hierarchical disparity of housing prices enhanced, while the spatial agglomeration disparity weakened; 3) the land supply and cost are in direct relation to spatial differentiation of urban housing prices in China, with the first factor being the most significantly; 4) the influence of land market for the housing prices vary among cities with different levels, with first-tier cities being the most significantly. It is concluded that significant spatial inequality and disparity of urban housing prices exists in China. It is closely related to factors of land market, and the core driving force is the land supply.

[46]
Wang Y, Wang D L, Wang S J, 2013. Spatial differentiation patterns and impact factors of housing prices of China’s cities. Scientia Geographica Sinica, 33(10): 1157-1165. (in Chinese)In China′s high housing price times, housing price has become the core issue which was paid close attention by government and inhabitant. However, relatively little analysis is available on spatial differentiation patterns of housing prices in China′s cities according to taking more cities as analysis units in geographic field.And there is not unanimous conclusion in the main impact factors on spatial differentiation of housing price. In light of this, taking the housing prices and housing price-to-income ratio of 286 cities in China as basic data,we studied spatial differentiation patterns, global trends, spatial heterogeneities and correlations of housing prices and housing price-to-income ratio respectively. Furthermore, based on the law of supply-demand and urban hedonic price theory, we selected hypothetical 10 impact factors including 30 indicators on spatial differentiation for housing prices in China′s cities. Finally, the main impact factors were selected and analyzed according to regression analysis based on semilogarithmic model. The results show that: 1) There exist obviously spatial differentiation patterns for housing prices in China′s cities, and these differentiation patterns have features of the spatial agglomeration(between inland areas and three urban agglomerations of southeast coastal areas)and urban administrative level(between provincial capital and prefecture-level cities) simultaneously. 2) There are more number and larger scope with higher housing price-to-income ratio than that of housing prices. The number of cities of high housing affordability has been more than a half; 3) Both global differentiation trend and spatial heterogeneity of housing prices are stronger than that of housing price-to-income ratio; 4) Both the law of supply-demand and urban hedonic price theory can explain the phenomenon of spatial differentiation for housing prices in China′s cities. 5) The main impact factors on spatial differentiation of housing prices in China′s cities based on law of supply-demand are as follows: urban resident income and wealth level, urban housing price expectation and demand potential, urban residential construction cost. The main impact factors based on urban hedonic price theory are urban location and administrative level, urban natural environment, urban economic and producer environment, and urban infrastructure. Therein, urban resident income and wealth level and urban location and administrative level are two core impact factors on spatial differentiation for housing prices in China′s cities.

[47]
Wang Y, Wang S J, Li G D .et al , 2017. Identifying the determinants of housing prices in China using spatial regression and the geographical detector technique.Applied Geography, 79: 26-36.This study analyzed the direction and strength of the association between housing prices and their potential determinants in China, from a tripartite perspective that takes into account housing demand, housing supply, and the housing market. A data set made up of county-level housing prices and selected factors was constructed for the year 2014, and spatial regression and geographical detector technique were estimated. The results of the study indicate that the housing prices of Chinese counties are heavily influenced by the administrative level of the county in question. On the basis of results obtained using Moran's I , the study revealed the presence of significant spatial autocorrelation (or spatial agglomeration) in the data. Using spatial regression techniques, the study identifies the positive effect exerted by the proportion of renters, floating population, wage level, the cost of land, the housing market and city service level on housing prices, and the negative influence exerted by living space. The geographical detector technique revealed marked differences in the relative influence, as well as the strength of association, of the seven factors in relation to housing prices. The cost of land had a greater influence on housing prices than other factors. We argue that a better understanding of the determinants of housing prices in China at the county level will help Chinese policymakers to formulate more detailed and geographically specific housing policies.

DOI

[48]
Wen H, Goodman A C, 2013. Relationship between urban land price and housing price: Evidence from 21 provincial capitals in China.Habitat International, 40: 9-17.Economic fundamentals are recognized as determining factors for housing and land prices on the city level, but the relationship between housing price and land price has been disputed. In this paper, a simultaneous-equations model is developed to explore the interaction between housing price and land price. This model uses urban land price and housing price as endogenous variables and five factors for land price and seven factors for housing price as exogenous variables. By using sample data of 21 provincial cities in China from 2000 to 2005, the model is estimated by using the two-stage least-squares method. Housing price and land price have an endogenous interrelationship, and as a whole, housing price has greater influence on land price. Per capita disposable income is not only an important factor for land price but also has a direct impact on housing price. Lagged house price has the highest degree of influence on housing price, which implies that increased house price is the expected effect of housing price. The model is effective and reasonable, and it can provide a basis for relevant government departments to establish related policies.

DOI

[49]
Wheaton W C, 1996. Urban Economics and Real Estate Markets. Englewood Cliff: Prentice Hall.

[50]
Zabel J, Dalton M, 2011. The impact of minimum lot size regulations on house prices in Eastern Massachusetts.Regional Science & Urban Economics, 41: 571-583.There has been an increased focus on zoning as a cause of high house prices in many metropolitan areas in the United States. But isolating the direct causal impact of zoning on house prices is difficult. This study overcomes the problems in the existing literature by investigating the effect of minimum lot size restrictions (MLRs) on house prices using data on transactions of single-family homes in the greater Boston area from 1987 to 2006. We estimate a model of house prices that include changes in minimum lot size at the zoning district level, variables that account for possible spillover effects in the same town and in nearby towns, and zoning district fixed effects. We estimate price effects due to MLR of 20% or more at the upper end of the impact distribution. We find evidence of significant spillover effects within towns that are similar to those in the zoning district in which the MLR changed. The impact on house prices in nearby towns is significant and as high as 5%. Finally, we find that the impact increases over time with effects as large as 40% occurring 10 years after the change in MLR.Highlights? We estimate the effect of minimum lot size restrictions (MLRs) on house prices in the greater Boston area from 1987 to 2006. ? We estimate price effects due to MLR of 20% or more at the upper end of the impact distribution. ? We find evidence of significant spillover effects in the same town and in nearby towns. ? We find that the impact increases over time with effects as large as 40% occurring 10 years after the change in MLR.

DOI

[51]
Zang B, Lv P, Warren C M J, 2015. Housing prices, rural-urban migrants’ settlement decisions and their regional differences in China. Habitat International, 50: 149-159.

DOI

[52]
Zeng G, Zhang H, 2013. Test on the relationship between price of urban land and commercial residential houses.Contemporary Economic Research, (6): 19-25. (in Chinese)The academic circle has been arguing over the relationship between prices of land and commercial residential houses and they kept asking whether rise of land prices leads to increase of house prices or vice versa.Logically,these two prices influence each other.But as to what the influence really is,empirical study needs to be done here to confirm it.Since 1998,the prices of land and houses have been on the rise and land-to-house price ratio based on prices of land and houses has presented the same trend.By analysis on the four-quadrant model of urban land and house prices,we find that price fluctuation in land prices leads to the changes in house prices and increase of land prices will result in the rise of house prices.Through the empirical test on logarithm data based on monthly sale prices of commercial houses and monthly land purchase expenses on per unit area,we find that a positive cointegration relationship could be seen between house prices and land prices and the reverse recovery mechanism doesn't exist in land prices.On the long term,commercial house prices are not the Granger reasons of land prices,and in fact the opposite is true.Therefore,to reduce the prices of commercial houses,we need to lower down the prices of land.

[53]
Zhang H, 2008. Effects of urban land supply policy on real estate in China: An econometric analysis.Journal of Real Estate Literature, 16(1): 55-72.

[54]
Zhang L, Hui C M, Wen H, 2015. Housing price-volume dynamics under the regulation policy: Difference between Chinese coastal and inland cities.Habitat International, 47: 29-40.61Housing price–volume relationships are examined before and after the House Purchase Limit Policy in China.61House searching models are developed with down-payment constraints to explain price–volume dynamics.61Different price–volume causal relationships exist between coastal and inland cities.61The direct government intervention cannot radically change the driving mechanism.61Results can provide a basis for some government departments to assess related policies.

DOI

[55]
Zhang L, Hui E C, Wen H, 2017. The regional house prices in China: Ripple effect or differentiation.Habitat International, 67: 118-128.

DOI

Outlines

/