
Journal of Geographical Sciences >
Spatiotemporal changes in Chinese land circulation between 2003 and 2013
Author: Wang Yahui, PhD Candidate, specialized in land use change and agricultural economy.E-mail: wangyhui.15b@igsnrr.ac.cn
Received date: 2017-09-10
Accepted date: 2017-11-23
Online published: 2018-06-20
Supported by
National Natural Science Foundation of China, No.41571095, No.41271119
Copyright
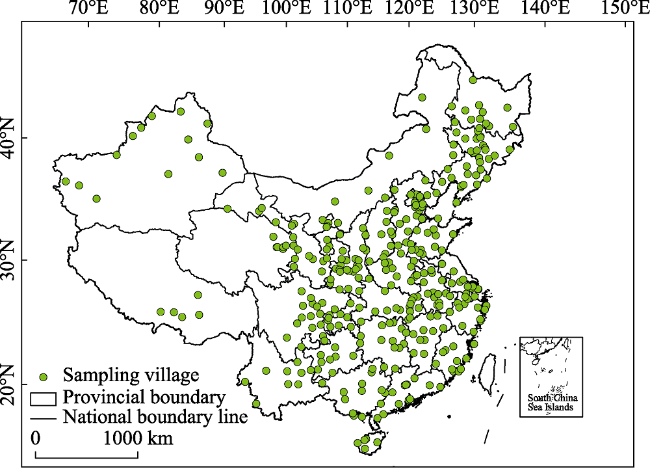
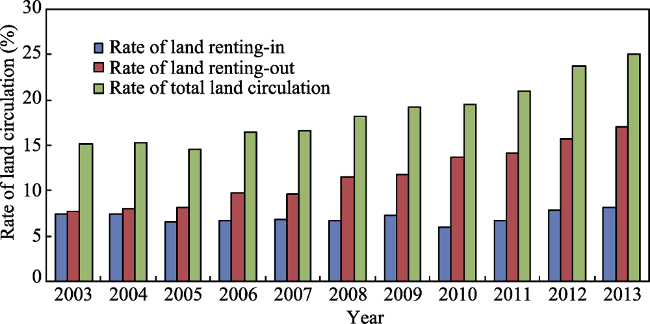
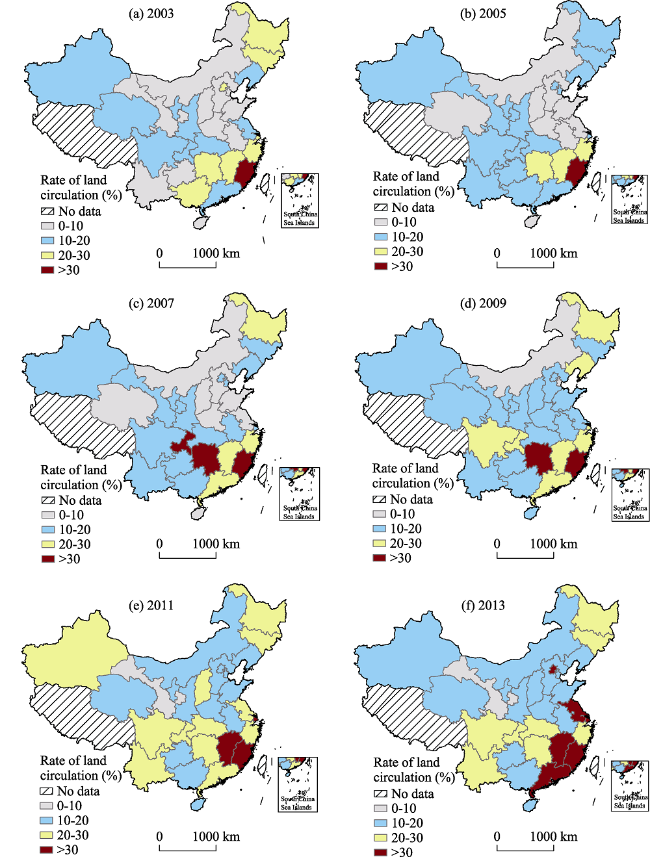
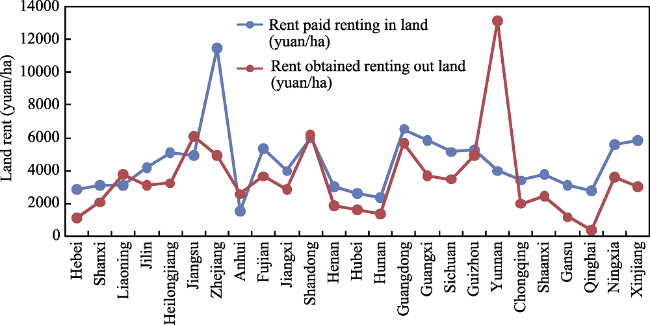
Land circulation is an important measure that can be utilized to enable agricultural management at a moderate scale. It is therefore imperative to explore spatiotemporal changes in land circulation and the factors that drive these variations in order to maintain and increase the vitality of the land rental market. An initial analysis of spatiotemporal patterns in land circulation is presented in this study on the basis of data from 169,511 farm households between 2003 and 2013. The rural fixed observation point system advocated by the Chinese Ministry of Agriculture was utilized for this analysis, and Heckman two-stage models were developed and estimated in order to identify the drivers of regional differences in land circulation at the national scale and at the levels of different terrains. The results of this study show that the rate of land circulation in China rose from 15.09% to 25.1% over the course of the study period, an average rate of 0.8%. More specifically, data show that the rate of land circulation in the south of China has been higher than in the north, that the average land rental payment was 4256.13 yuan per ha, and that 55.05% of households did not pay such a fee during the land circulation process. In contrast, the average rent obtained was 3648.45 yuan per ha nationally even though 52.63% of households did not obtain any payments from their tenants. The results show that land quality, geographic location, transaction costs, and household characteristics have significantly affected land circulation in different regions of China. Specifically, the marginal effects of land quality and geographic location were larger in the plain regions, while transaction cost was the key factor influencing land circulation in the hilly and mountainous regions. The signal identified in this study, rent-free land circulation, is indicative of a mismatch that has led to the marginalization of mountainous regions and higher transaction costs that have reduced the potential value of land resources. Thus, as the opportunity cost of farming continues to rise across China, the depreciation of land assets will become irreversible and the phenomenon of land abandonment will become increasingly prevalent in hilly and mountainous regions in the future. The transaction costs associated with the land rental market should be reduced to mitigate these effects by establishing land circulation intermediaries at the township level, and the critical issues of land abandonment and poverty reduction in hilly and mountainous regions should arouse more attention.
Key words: land circulation; rent-free; driving factors; Heckman two-stage model; China
WANG Yahui , LI Xiubin , XIN Liangjie , TAN Minghong , JIANG Min . Spatiotemporal changes in Chinese land circulation between 2003 and 2013[J]. Journal of Geographical Sciences, 2018 , 28(6) : 707 -724 . DOI: 10.1007/s11442-018-1500-2
Figure 1 Distribution of Chinese villages investigated in this study |
Table 1 The effective number of farm households surveyed each year |
| Year | Total number surveyed | Renting-in land | Renting-out land |
|---|---|---|---|
| 2003 | 16,905 | 1231 | 1637 |
| 2004 | 16,668 | 1233 | 1324 |
| 2005 | 17,331 | 1126 | 1402 |
| 2006 | 16,871 | 1126 | 1639 |
| 2007 | 14,356 | 1211 | 1384 |
| 2008 | 15,378 | 1033 | 1764 |
| 2009 | 15,399 | 1132 | 1823 |
| 2010 | 15,392 | 1509 | 2104 |
| 2011 | 13,432 | 1641 | 1905 |
| 2012 | 14,127 | 1838 | 2231 |
| 2013 | 13,652 | 2050 | 2184 |
| Total | 169,511 | 15,130 | 19,397 |
Data sourced from the rural fixed observation point system between 2003 and 2013. |
Table 2 Definitions and statistical descriptions of the variables used in this study |
| Variables | Definitions | 2003 | 2013 | ||
|---|---|---|---|---|---|
| Mean | S.D | Mean | S.D | ||
| Dependent variable | |||||
| First stage model: Land rented-out | Yes = 1, otherwise = 0 | 0.12 | 0.24 | 0.17 | 0.25 |
| Second stage model: Rent per unit area | Rent obtained (yuan/ha) | 1792.5 | 6565.8 | 4097.4 | 8600.3 |
| Independent variables | |||||
| Land quality | Yield per ha larger than the average in village = 1, otherwise = 0 | 0.51 | 0.67 | 0.57 | 0.71 |
| Geographic location | |||||
| Suburban region | Located in the suburbs (yes = 1, otherwise = 0) | 0.16 | 0.36 | 0.16 | 0.37 |
| Economic level | Lowest level = 1, medium level = 3, highest level = 5 | 2.81 | 0.88 | 2.82 | 0.87 |
| Transaction costs | |||||
| Number of land parcels | Number of the plots in cultivation (plots) | 4.47 | 4.98 | 4.11 | 4.92 |
| Land circulation intermediary | Circulating intermediary in town (yes = 1, otherwise = 0) | 0.11 | 0.33 | 0.18 | 0.43 |
| Household characteristics | |||||
| Rate of non-agricultural income | Rate of non-agricultural income in household income (%) | 58.21 | 38.29 | 76.98 | 42.22 |
| Age of family head | Age of the household head (years) | 50.12 | 10.87 | 52.46 | 9.25 |
| Physical condition of family head | No ability to work = 1, average level = 3, favorable level = 5 | 4.33 | 2.21 | 4.20 | 1.90 |
| Number of labor force | Number of people in the labors from 16 years old to 65 years old | 2.17 | 1.02 | 2.22 | 1.08 |
| Occupation | Agriculture = 1, otherwise = 0 | 0.88 | 0.31 | 0.86 | 0.32 |
| Total value of productive assets | Total value of productive assets (yuan) | 5913.7 | 2819.1 | 9007.3 | 3285.2 |
| Village characteristics | |||||
| Per capita income in village | Total income divided by total population in village (yuan/year) | 2719.3 | 2799.2 | 4789.3 | 4319.8 |
| Number of enterprises in village | Number of non-agricultural enterprises | 3.27 | 2.19 | 5.83 | 2.24 |
| Rate of population outflow | Outflow population number divided by total people (%) | 21.00 | 18.00 | 33.12 | 19.00 |
| Financial constraints | Has get a loan (yes = 1, otherwise = 0) | 0.05 | 0.21 | 0.09 | 0.29 |
The data in this table are derived from computations based on rural fixed observation point data for 2003 and 2013. |
Figure 2 Land circulation rates in China between 2003 and 2013 |
Figure 3 Patterns in land circulation at the provincial level across China between 2003 and 2013 |
Table 3 Regional differences in the cost of renting-in land |
| Region | No land rent | Land rent (≤7500 yuan/ha) | Land rent (7500- 15,000 yuan/ha) | Land rent (≥15,000 yuan/ha) | ||||
|---|---|---|---|---|---|---|---|---|
| Number of households | Rate (%) | Number of households | Rate (%) | Number of households | Rate (%) | Number of households | Rate (%) | |
| Total samples | 6169 | 55.05 | 3546 | 31.64 | 590 | 5.26 | 875 | 7.81 |
| Plain | 1579 | 50.33 | 1157 | 36.89 | 133 | 18.81 | 268 | 8.54 |
| Hilly | 2613 | 51.68 | 1851 | 36.61 | 304 | 6.01 | 288 | 4.51 |
| Mountainous | 1977 | 68.67 | 494 | 17.16 | 172 | 5.97 | 236 | 8.19 |
The data in this table are derived from computations based on rural fixed observation point data. |
Table 4 Regional differences in the cost of renting-out land |
| Region | No land rent | Land rent (≤7500 yuan/ha) | Land rent (7500- 15,000 yuan/ha) | Land rent (≥15,000 yuan/ha) | ||||
|---|---|---|---|---|---|---|---|---|
| Number of households | Rate (%) | Number of households | Rate (%) | Number of households | Rate (%) | Number of households | Rate (%) | |
| Total samples | 10,209 | 52.63 | 6440 | 33.20 | 1680 | 8.66 | 927 | 4.78 |
| Plain | 2363 | 40.87 | 2257 | 39.03 | 794 | 13.73 | 368 | 6.36 |
| Hilly | 4554 | 57.52 | 2929 | 36.99 | 326 | 4.12 | 108 | 1.36 |
| Mountainous | 3077 | 56.96 | 1227 | 22.71 | 672 | 12.44 | 426 | 7.88 |
The data in this table are derived from computations based on rural fixed observation point data. |
Figure 4 Regional differences in land rent across China |
Table 5 Heckman two-stage estimation results for regional differences in land circulation |
| Variable | First stage model: Renting-out land = 1, otherwise = 0 | Second stage model: Log (1 + land rent per ha) | ||
|---|---|---|---|---|
| B | T-value | B | T-value | |
| Land quality | -0.093*** | -8.92 | 0.309*** | 6.17 |
| Geographical location | ||||
| Suburban region | -0.147*** | -10.23 | 0.392*** | 4.24 |
| Economic level | -0.012* | -1.78 | 0.327*** | 8.03 |
| Transaction costs | ||||
| Number of land parcels | -0.245** | -2.18 | -0.029*** | 2.89 |
| Land circulation intermediary | 0.039*** | 8.11 | 0.064*** | 7.82 |
| Household characteristics | ||||
| Rate of non-agricultural income | 0.179*** | 13.31 | 0.363 | 1.08 |
| Age of family head | 0.139*** | 4.29 | - | - |
| Physical condition of family head | -0.042*** | -7.13 | - | - |
| Number of labor force | -0.022*** | -4.01 | 0.073** | 2.47 |
| Occupation | -0.212*** | -13.31 | 0.344*** | 3.02 |
| Log(total value of productive assets) | -0.004** | -2.13 | -0.005*** | -3.73 |
| Village characteristics | ||||
| Log(per capita income in village) | 0.101*** | 8.37 | 0.265*** | 3.29 |
| Number of enterprises in village | 0.001*** | 3.90 | 0.003 | 1.64 |
| Rate of population outflow | 0.560*** | 17.82 | -0.167*** | -13.12 |
| Financial constraints | 0.090*** | 5.21 | -0.060 | -0.51 |
| Year dummies | Yes | |||
| Regional dummies | Yes | |||
| Lambda (λ) | -2.87*** | |||
| Wald chi-squared (32) | 1336.83 | |||
| Probability greater than chi-squared | 0.0000 | |||
| Number of observations | 130,452 | |||
Abbreviations: ***, p < 0.001; **, p < 0.05; *, p < 0.1. The dependent variable in the second stage model is log (1+land rent per ha) following Cheng et al. (2016); “-” denotes the variables have no significant effect on land rent; model analysis was performed using the software STATA 13.0 (Heckman, 1979). |
Table 6 Heckman two-stage estimation results for land circulation in regions characterized by different terrains |
| Variables | Plain regions | Hilly regions | Mountainous regions | |||
|---|---|---|---|---|---|---|
| First stage model: Renting-out land = 1, no = 0 | Second stage model: Log(1 + land rent per ha) | First stage model: Renting-out land = 1, no = 0 | Second stage model: Log(1 + land rent per ha) | First stage model: Renting-out land = 1, no = 0 | Second stage model: Log(1 + land rent per ha) | |
| Land quality | -0.172*** | 0.324*** | -0.133*** | 0.662*** | -0.055*** | 0.123 |
| Geographical location | ||||||
| Suburban region | -0.304*** | 0.473 | -0.053** | 0.510*** | -0.233*** | -0.177 |
| Economic level | -0.060*** | -0.092 | -0.004 | 0.418*** | 0.021* | 0.331*** |
| Transaction costs | ||||||
| Number of land parcels | -0.138*** | -0.073* | -0.232*** | -0.225** | -0.246*** | -0.206** |
| Land circulation intermediary | 0.042*** | 0.051** | 0.027*** | 0.213*** | 0.009** | 0.343*** |
| Household characteristics | ||||||
| Rate of non-agricultural income | 0.233*** | 0.074 | 0.155*** | 0.019*** | 0.173*** | -0.065 |
| Age of family head | 0.009 | - | 0.086 | - | 0.372*** | - |
| Physical condition of family head | -0.073*** | - | -0.057*** | - | -0.004 | - |
| Number of labor force | 0.003 | 0.142*** | -0.029*** | 0.112 | -0.047*** | -0.009 |
| Occupation | -0.212*** | 0.193 | -0.241*** | 0.911*** | -0.156*** | 0.078 |
| Log(total value of productive assets) | -0.002 | 0.015 | 0.008** | -0.092*** | -0.019*** | -0.033* |
| Village characteristics | ||||||
| Log(per capita income in village) | 0.093*** | 0.294*** | 0.086*** | -0.352* | 0.102*** | 0.493*** |
| Number of enterprises in village | 0.004*** | -0.006 | -0.004*** | 0.017*** | 0.004*** | 0.001 |
| Rate of population outflow | 0.331*** | -0.073 | 0.321*** | -5.664*** | 0.058 | -2.171*** |
| Financial constraints | 0.013 | 0.183 | 0.183*** | -0.901 | 0.013 | 0.212 |
| Year dummies | Yes | Yes | Yes | |||
| Regional dummies | Yes | Yes | Yes | |||
| Lambda (λ) | -0.454* | -6.155*** | -1.221* | |||
| Wald chi-squared (32) | 525.75 | 553.65 | 618.01 | |||
| Probability greater than chi-squared | 0.0000 | 0.0000 | 0.0000 | |||
| Number of observations | 37,338 | 41,322 | 51,792 | |||
Abbreviations and notes as in Table 5. |
The authors have declared that no competing interests exist.
| [1] |
|
| [2] |
|
| [3] |
|
| [4] |
|
| [5] |
|
| [6] |
|
| [7] |
|
| [8] |
|
| [9] |
|
| [10] |
|
| [11] |
|
| [12] |
|
| [13] |
|
| [14] |
|
| [15] |
|
| [16] |
|
| [17] |
|
| [18] |
|
| [19] |
|
| [20] |
|
| [21] |
|
| [22] |
|
| [23] |
|
| [24] |
|
| [25] |
|
| [26] |
|
| [27] |
|
| [28] |
|
| [29] |
|
| [30] |
|
| [31] |
|
/
| 〈 |
|
〉 |