研究论文

Comprehensive methods for measuring regional multidimensional development and their applications in China

  • XU Yong , 1, 2 ,
  • DUAN Jian 1, 2 ,
  • XU Xiaoren , 3, *
Expand
  • 1. Institute of Geographic Sciences and Natural Resources Research, CAS, Beijing 100101, China
  • 2. University of Chinese Academy of Sciences, Beijing 100049, China
  • 3. Shandong Provincial Key Laboratory of Water and Soil Conservation and Environmental Protection, College of Resources and Environment, Linyi University, Linyi 276000, Shandong, China
*Corresponding author: Xu Xiaoren, PhD, E-mail:

Author: Xu Yong, Professor, specialized in regional sustainable development and human-environment interactions. E-mail:

Received date: 2017-06-13

  Accepted date: 2017-12-20

  Online published: 2018-08-10

Supported by

National Natural Science Foundation of China, No.41171449;Knowledge Innovation Project of the Chinese Academy of Sciences, No.KZZD-EW-06

Copyright

Journal of Geographical Sciences, All Rights Reserved

Abstract

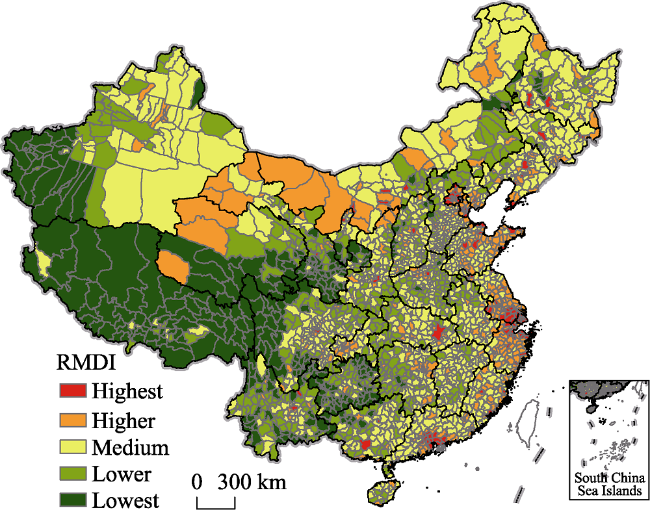
National and international research on regional development has matured from the use of single elements and indicators to the application of comprehensive multi-element and multi-indicator measures. We selected 12 indicators from six dimensions for analysis in this study, including income, consumption, education, population urbanization, traffic, and indoor living facilities. We then proposed the polyhedron method to comprehensively measure levels of regional multidimensional development. We also enhanced the polygon and vector sum methods to render them more suitable for studying the status of regional multidimensional development. Finally, we measured levels of regional multidimensional development at county, city, and provincial scales across China and analyzed spatial differences using the three methods above and the weighted sum method applied widely. The results of this study reveal the presence of remarkable regional differences at the county scale across China in terms of single and multidimensional levels of regional development. Analyses show that values of the regional multidimensional development index (RMDI) are high in eastern coastal areas, intermediate in the midlands and in northern border regions, and low in the southwest and in western border regions. Districts characterized by enhanced and the highest levels of this index are distributed in eastern coastal areas, including cities in central and western regions, as well as areas characterized by the development of energy and mineral resources. The regional distribution of reduced and the lowest levels of this index is consistent with concentrations of areas that have always been impoverished. Correlation analyses of the results generated by the four methods at provincial, city, and county scales show that all are equivalent in practical application and can be used to generate satisfactory measures for regional multidimensional development. Additional correlation analyses between RMDI values calculated using the polyhedron method and per capita gross domestic product (GDP) demonstrate that the latter is not a meaningful proxy for the level of regional multidimensional development.

Cite this article

XU Yong , DUAN Jian , XU Xiaoren . Comprehensive methods for measuring regional multidimensional development and their applications in China[J]. Journal of Geographical Sciences, 2018 , 28(8) : 1182 -1196 . DOI: 10.1007/s11442-018-1549-y

1 Introduction

Regional development is a core research field in economic geography and is key to our understanding of local areas (Li et al., 2016; Liu et al., 2016). As a result, the quantitative assessment of regional development level and the differences between them have become hugely debated issues for governments and within academia (Salvati et al., 2016; United Nations, 1954). In the early studies, regional development levels or gaps were measured using one-dimensional economic indicators, including national income, gross national product, and GDP (Galbraith, 1958; Mishan, 1967). However, as people have become increasingly aware of the importance of health, education, and public welfare, subsequent research has not been constrained by economic income comparisons and has attached more importance to the integration of composite indexes and the use of social indicators (Sen, 1991).
Morris (1978) proposed the concept of a physical quality of life index (PQLI), encompassing rates of infant mortality and literacy of people over 15 years old as well as life expectancy. He advocated use of the equally weighted sum method to calculate this composite index (Morris, 1978); thus, PQLI is very simple, easy to understand, and can be used as a proxy for the level of public health care and the living standards of residents within a whole country or specific region (Liang, 1994). Although this index is not able to provide a marker for the whole of social welfare and couldn’t be used as a reflection of the level of regional development, it nevertheless has enabled new research directions in the use of multidimensional comprehensive measures. In light of the limitations of using GDP to measure the level of regional development, a 1990 human development report issued by the United Nations Development Program (UNDP) proposed use of the Human Development Index (HDI), a measure that was created by the economists Amartya Sen (1991) and Mahbubul Haq (1999). This index encompasses health, education, and national income elements, and contains indicators of per capita GDP, life expectancy, adult literacy rate, and the gross enrolment ratio (Mahbub, 1999; UNDP, 1990). The HDI is calculated using the equally weighted sum method and can be used to measure the level of regional multidimensional development since it is not only based upon PQLI, but also uses per capita GDP as a supplementary indicator.
Both the HDI and PQLI are general methods that have been continually improved and perfected since they were first proposed (Grimm et al., 2008; Noorbakhsh, 1998; Nussbaum, 2000). Indeed, a selection of such indicators are also applied outside of economics and social science in areas related to the environment and management (Barro and Lee, 2010; Ediger and Tatlidil, 2006; Fukuda-Parr et al., 2010). As a result, studies have extended from treating countries as their basic units to consideration of regions and other subsidiary scales (Pradhan and Sanyal, 2011; Silva, 2014). In short, international research on regional development has evolved from the use of one-dimensional measurements towards the application of comprehensive multidimensional techniques.
Because of the confidentiality of economic and social data, research on Chinese regional development was rare prior to the 1980s, when large-scale studies were carried out for the first time. On the basis of existing literature and results, it is clear that a great deal of research carried out within China initially applied one-dimensional indexes, such as GDP and household income, to measure regional gaps in development and to analyze the influencing factors. Some of the methods initially applied include the Gini coefficient, the Theil index, the integrated entropy index, and the coefficient of variation (Lin and Liu, 2003; Liu, 2006; Wang and Fan, 2004).
A small number of research results based on the use of comprehensive measures have begun to appear in recent years in a number of publications and variable progress has been made. For example, by carrying out screening, classification, and an attribute analysis of elements of regional development, the ‘regional development gap assessment and regulation’ project team of Chinese Academy of Sciences constructed a macroscopic-microcosmic indicator system that is aimed at measuring the quality of people’s livelihoods (Xu and Fan, 2014). Although just a handful of multidimensional measure-based methods for assessing regional development are available, the weighted sum, vector sum, and polygon methods have been applied successfully in related fields. Of these, the HDI is a typical weighted sum method that has been frequently applied in domestic research to the extent that its indicators and algorithm have been continuously revised and improved (Fu et al., 2014; Lu, 2012). In addition, research on major function-oriented zoning has led to application of the vector sum method to evaluate the suitability of land for development and protection, applying the difference values between the vector sums of the two indexes as composites (Fan, 2015). Liu and Xu (2016) reported the results of county-level determination of multidimensional poverty in rural China by establishing a multi-indicator system and a more precise method of integration based on a vulnerability and sustainable livelihood framework. This approach is one example of a typical application of the polygon area method for the integration of multi-indicators (Liu and Xu, 2016). In summary, both gaps and levels of regional development have been measured to date within China by mainly applying one-dimensional indexes, although the use of multidimensional integration methods in other related fields can be taken as references.
Building on the use of multidimensional integration methods as references, and given data accessibility, we selected 12 indicators from six dimensions for use in this study, including income, consumption, education, population urbanization, traffic, and indoor living facilities. We then proposed the polyhedron method and enhanced the polygon and vector sum method, combined with the weighted sum method applied widely, to comprehensively measure the levels of regional multidimensional development and gaps at county, city, and provincial scales, based on the indicators of six dimensions. This study has four main aims, including initially to establish and modify the use of comprehensive measurements methods to study gaps in regional multidimensional development. Secondly, this study aims to analyze spatial differences in Chinese regional development from integrated multi-element and multi-indicator perspectives. Thirdly, we compare the results generated using different methods to provide a basis for the future selection of approaches in this research field. Finally, we consider whether per capita GDP can be used to replace the composite index by conducting a series of correlation analyses.

2 Materials and methods

2.1 An indicator system for measuring levels of regional multidimensional development

Two kinds of concepts in regional development are recognized that differ in terms of their constituent parts. In the first case, regional development can be used to refer just to economic development, while the second concept refers to multidimensional development that supplements elements of social development and human settlement. Thus, regional multidimensional development is not just concerned with the development of a region in terms of economy, society, and human settlements, but can also refer to the concept of overall progress. This overall level can be characterized by use of the regional multidimensional development index (RMDI). As a result, regional multidimensional development has five characteristic attributes, including regional properties, objectivity, development, and integrality, as well as variability. Regional properties refer to the fact that the objectives of a study are always constrained within certain borders that could be administrative or natural, while objectivity refers to the constituent elements that comprise economy, society, and human settlements. Development compares the stage that is characteristic of the constituent elements that comprise the dynamic development process, while integrality refers to studies of composite indexes or comparisons between different RMDI indicators in different regions. The meaning of variability is broader than the meaning of gaps and can be expressed quantitatively.
Building on the use of these constituent elements of regional multidimensional development, including economy, society, and human settlements, and taking into account literature that is related to the use of indicator systems (e.g., Fang and Mao, 1999; Xu and Fan, 2014), this study establishes an indicator system for use as a multidimensional measure (Table 1). The level of economic development was characterized using indicators of residential income and consumption, while indicators of the level of labor-force education and the rate of population urbanization were used to reflect the level of social development. We chose to use indicators of traffic development and the allocation of indoor living facilities as proxies for the quality of human settlements.
Table 1 Indicators of regional multidimensional development
Element Feature indicator/
Dimension
Attribute indicator Equation
Economy Level of residential income (I) Per capita disposable income of urban households (IC)
Per capita net income of rural households (IR)
Per capita local financial budget revenue (IF)
I=IC×B+IR×(1-B)+Ii
Level of residential consumption (C) Per capita total retail sales of urban and rural consumer goods
Society Level of
labor-force
education (E)
Average number of education years for population of school age
Level of population urbanization (U) Rate of population urbanization (β)
Human
settlement
Allocation level of indoor living
facilities (F)
Allocation rate for indoor tap water (FW)
Allocation rate for indoor kitchens (FK)
Allocation rate for indoor toilets (FT)
Allocation rate for indoor bathrooms(FB)
F=1/4×(FW+FK+FT+FB)
Values for indicators have been normalized
Level of traffic development (T) Proportion of traffic land to total land (TP)
Traffic Dominance (TD) (Jin et al., 2008)
T=1/2×(TP+TD)
Values for indicators have been normalized

2.2 Methods for measuring levels of regional multidimensional development

(1) The polyhedron method. This method uses the length of a line between a fixed point (the origin) and vertices as a value for each indicator and calculates the volume of a polyhedron, the RMDI. This equates to an octahedron (Figure 1) composed of six indicators (or dimensions), with O as the original point, and OE, OU, OT, and OF denoting the level of labor-force education, population urbanization, traffic development, and the allocation level of indoor living facilities, respectively. Thus, in terms of the four feature indicators (dimensions) used in this study, the angles between two adjacent dimensions would be α (α = 360°/4), while OI and OC are perpendicular to the quadrilateral EUTF, and denote the levels of residential income and consumption, respectively. The volume of the octahedron can therefore be defined as RMDI_V, as follows:
$RMD{{I}_{-V}}=\frac{1}{6}\sin \ \alpha ({{a}_{E}}\times {{a}_{U}}+{{a}_{U}}\times {{a}_{T}}+{{a}_{T}}\times {{a}_{F}}\text{+}{{a}_{F}}\times {{a}_{E}}\text{)}\times ({{a}_{I}}+{{a}_{C}})$ (1)
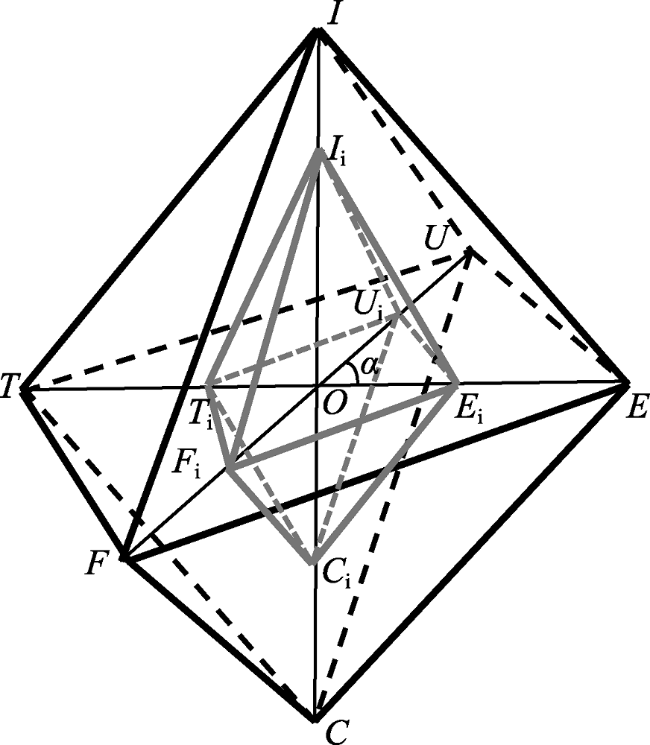
Figure 1 Sketches of the octahedron method for calculating the RMDI
In this expression, aE denotes the level of labor-force education, while aU refers to the level of population urbanization, aT denotes the level of traffic development, aF denotes the allocation level of indoor living facilities, aI refers to the level of residential income, and aC denotes the level of residential consumption. The values for all indicators were normalized in this study.
(2) The polygon method. Two kinds of polygon methods are available, utilizing either sequential or full permutation. In the case of the former, a polygon comprises concurrent lines based on a fixed point. Each line represents a specific indicator, with lengths denoting values. Thus, the area of the polygon area serves as a composite index that can be calculated by summing adjacent triangular areas in order. This approach has a number of advantages when compared to full permutation (Liu and Xu, 2016), including that since the length of each line represents a specific indicator value, it is simple to use graphs to compare measured units.
This calculation method therefore comprises a hexagon (Figure 2) that is composed of six feature indicators (dimensions), including the original point, O, alongside OI, OC, OE, OU, OT, and OF, which denote the level of residential income, residential consumption, labor-force education, population urbanization, traffic development, and the allocation level of indoor living facilities, respectively. Thus, the angles between two nearby dimensions are a (a = 360°/6) and the area of the hexagon is defined as RMDI_A, as follows:
$RMD{{I}_{-A}}=1/2\times \sin \ \alpha \times ({{a}_{I}}\times {{a}_{C}}+{{a}_{C}}\times {{a}_{E}}+{{a}_{E}}\times {{a}_{U}}\text{+}{{a}_{U}}\times {{a}_{T}}\text{+}{{a}_{T}}\times {{a}_{F}}\text{+}a{}_{F}\times a{}_{I})$ (2)
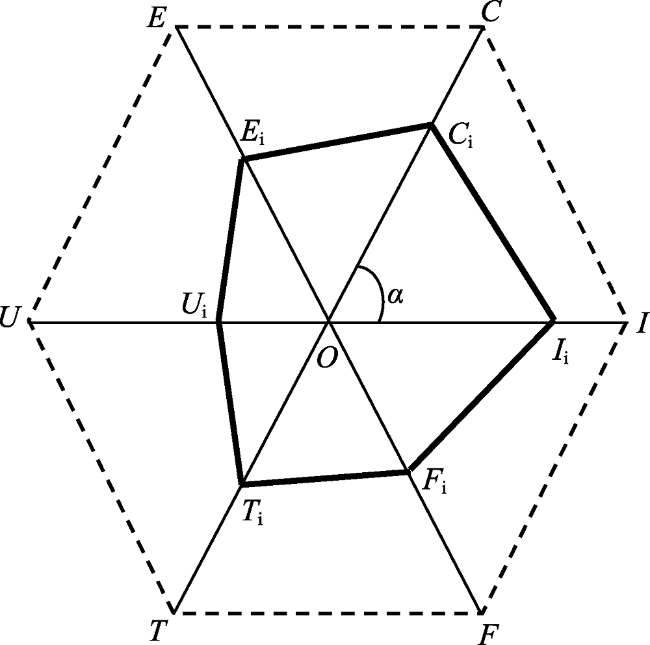
Figure 2 Sketches of the hexagon method for calculating the RMDI
The notations used in this case are the same as those used in Equation (1).
(3) The vector sum method. Because each indicator in this method is taken to be a vector, each module corresponds with an indicator value. Thus, the vector sum is defined as RMDI_M, simpler than either the polyhedron or polygon method, as follows:
$RMD{{I}_{-M}}=\sqrt[{}]{a_{I}^{2}+a_{C}^{2}+a_{E}^{2}+a_{U}^{2}+a_{T}^{2}+a_{F}^{2}}$ (3)
The notations used in this case are the same as those used in Equation (1).
(4) The weighted sum method. This method is commonly applied to calculate a RDM and includes both the HDI and the PQLI. In this case, the RMDI_W is calculated as follows:
$RMD{{I}_{-W}}=1/6\times ({{a}_{I}}+{{a}_{C}}+{{a}_{E}}+{{a}_{U}}+{{a}_{T}}+{{a}_{F}})$ (4)
The notations used in this case are the same as those used in Equation (1).

2.3 Data and resources

This study incorporates data from 12 indicators that cover the whole of China at the provincial, city, and county levels, with the exception of Hong Kong, Macao, and Taiwan. Data for the per capita disposable income of urban households, the per capita net income of rural households, local financial budget revenue, and the total retail sales of urban and rural consumer goods were extracted from the China Statistical Yearbook for Regional Economy 2011 (note that data for Tibet and Xinjiang are absent from this compilation). Data for average number of education years for population of school age, rate of population urbanization, and indoor living facilities (e.g., the presence of showers, kitchens, and tap water) were extracted from the 2010 population census. Thus, the allocation rate for each type of facility is the proportion of households that own a particular facility compared to the overall number of households sampled in a specific region. Sampled households account for 10% of the total families in a region, while the county boundaries applied are based on a 2004 map provided by the National Geomatics Center of China. Data for transportation areas were taken from the Ministry of Land and Resources for 2008, while traffic dominance data come from the Major Function Oriented Regionalization of China (The State Council, 2010). Income and consumption data for Tibet were provided by the local statistical bureau, while data for the cities of Shihezi, Alaer, Tumushuke, and Wujiaqu in Xinjiang come from their respective 12th Five-Year Plan for National Economic and Social Development.

3 Results

3.1 Single dimension analysis

We used the maximum standardization method to normalize feature indicator values for levels of residential income, residential consumption, the number of education years for population of school age (15-69), and rate of population urbanization to between 0 and 1. Thus, applying the natural fracture method in the software ARCGIS, normalized indicator values for our four dimensions were then combined with those for the normalized level of traffic development and allocation of indoor living facilities and divided into five county level categories across China. These categories are referred to as highest, higher, medium, lower, and lowest (Figure 3 and Table 2).
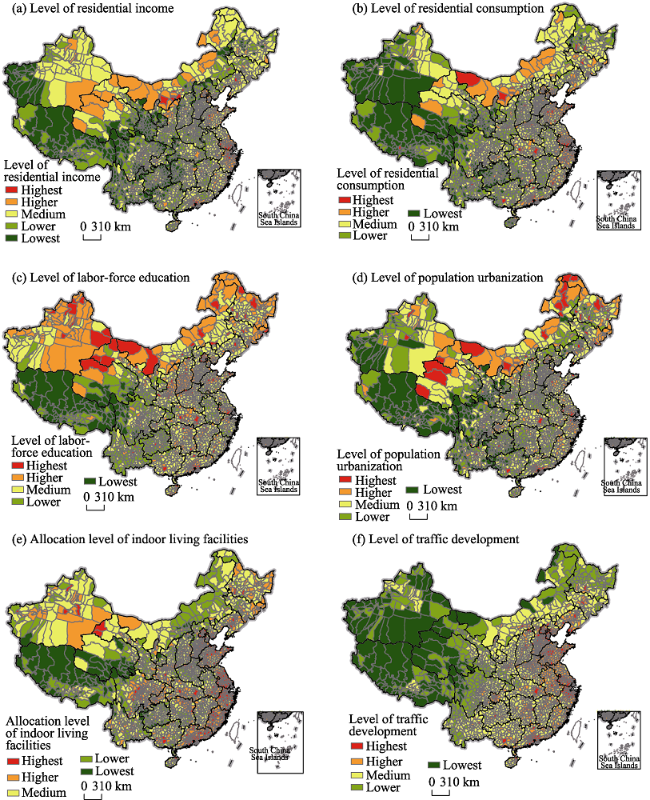
Figure 3 Single-dimension classification for China’s regional development in 2010
Table 2 Single-dimension classification for China’s regional development in 2010
Indicator/dimension Rank Range Number of counties Average value
Level of residential
income
Highest 0.39-1 103 0.49
Higher 0.25-0.39 305 0.3
Medium 0.14-0.25 993 0.18
Lower 0.1-0.14 578 0.12
Lowest 0-0.1 397 0.08
Level of residential
consumption
Highest 0.15-1 153 0.229
Higher 0.08-0.15 405 0.106
Medium 0.035-0.08 1,006 0.053
Lower 0.018-0.035 563 0.027
Lowest 0-0.018 249 0.013
Level of labor-force
education
Highest 0.75-1 259 0.81
Higher 0.68-0.75 515 0.71
Medium 0.6-0.68 1,114 0.64
Lower 0.4-0.6 415 0.54
Lowest 0-0.4 73 0.32
Level of population
urbanization
Highest 0.75-1 212 0.88
Higher 0.5-0.75 318 0.60
Medium 0.3-0.5 1,018 0.38
Lower 0.2-0.3 562 0.26
Lowest 0-0.2 266 0.14
Allocation level of
indoor living facilities
Highest 0.8-1 406 0.87
Higher 0.65-0.8 648 0.72
Medium 0.45-0.65 849 0.56
Lower 0.25-0.45 370 0.37
Lowest 0-0.25 103 0.15
Level of traffic
development
Highest 0.42-1 344 0.508
Higher 0.323-0.42 610 0.346
Medium 0.2-0.323 1,034 0.241
Lower 0.102-0.2 280 0.110
Lowest 0-0.102 108 0.101
The results of this analysis show that values of residential income are high in eastern coastal and northern border regions, but are low in the mountainous regions of western China (Figure 3a). Data also show that the Yangtze and Pearl river deltas, the Beijing-Tianjin region, and the cities of Hohhot and Ordos in Inner Mongolia are characterized by the highest levels of residential income and are also surrounded by areas where this measure is higher. In addition, coastal and central parts of Shandong, western Inner Mongolia and the Greater Khingan Mountains, as well as adjoining areas of Xinjiang, Qinghai, and Gansu, and many other provincial capitals are also characterized by higher residential income levels. In contrast, distribution of the medium-value residential income group ranges widely from eastern China to the west, while the lower income group is mainly distributed across central and western China. Examples of the lower residential income group are predominantly concentrated in regions such as the eastern Greater Khingan and Taihang mountains, as well as in Henan and Anhui. In addition, southern Shaanxi, northern Sichuan, and southeastern Tibet are also characterized by lower residential income values, while the lowest value group is mainly located in western regions, including southern Xinjiang and Gansu, as well as on northern Tibetan Plateau and in the Wuling mountain areas in Guizhou and Hunan.
Results show that values of residential consumption are the highest on the eastern coastal China and the lowest in Northwest and Southwest China (Figure 3b). Data show that the highest values are seen in Beijing and Tianjin, in the Yangtze and Pearl river deltas, on the Shandong Peninsula, and in municipal districts, while the areas surrounding these centers of high residential consumption are also characterized by higher levels, patchily distributed across Northeast China, and in Hubei and Fujian. At the same time, medium values of residential consumption are widely distributed within each provincial unit, while lower values are seen on the Loess and Yunnan-Guizhou plateaus, in most parts of Guangxi, in western Hunan, southern Jiangxi, western Sichuan, in the southern border region of Tibet, and to the north of the Tianshan Mountains. The lowest levels of residential consumptions are seen across most parts of Tibet, and in southern Qinghai and Xinjiang.
Values for labor-force education are the highest in the north and east of China and are the lowest in the southwest (Figure 3c). The highest values of this index have a relatively fragmented distribution across wide swathes of China, characterizing urban districts as well as interconnected areas of Qinghai, Xinjiang, and Inner Mongolia. Higher values for labor-force education are also mainly characteristic of northern China; there is a continuous distribution of higher values in the northern border region, in most parts of Xinjiang, and in the central and western parts of the Loess Plateau. At the same time, higher values for labor-force education are patchily distributed across the middle reaches of the Yangtze River Basin, while medium values are widely distributed in eastern, central, and northeastern China. Lower values are mainly seen in western regions, including on the Yunnan-Guizhou Plateau, in adjoining areas of Gansu, Qinghai, and Sichuan, and in the southern border region of Tibet. Results show that the lowest values for this index are concentrated on the Qinghai-Tibet Plateau and in western Sichuan.
The spatial distribution of population urbanization values reveals the presence of a high-medium-low trend that spreads from the border regions of northern China and eastern coastal areas into central China, and then into Southwest China (Figure 3d). The highest values of population urbanization are scattered within the municipal districts of large cities and around the Greater Khingan Mountains, while higher values are mainly concentrated in the coastal areas and border regions of China. Data show that Beijing and Tianjin, the Yangtze and Pearl river deltas, the northeast, and border regions of Inner Mongolia are all characterized by higher values of population urbanization, while medium values are continuously distributed across the Huang-Huai-Hai Plain and middle-lower Yangtze Plains, within the Jiangnan hills, along the Hexi Corridor, and in eastern Xinjiang and parts of Qinghai. Lower values for population urbanization are widely distributed across China, while the lowest values for this index are mainly seen in the western regions, especially in Tibet, and in southwestern Xinjiang, northwestern Sichuan, and southern Gansu.
Values that denote the presence of indoor living facilities are the highest in the eastern coastal areas of China and along the Yangtze River, while this index is low in Southwest China and in western Inner Mongolia (Figure 3e). The highest values for indoor living facilities are seen in eastern coastal areas, and are also scattered along the Yangtze River, in Xinjiang and in the northeast of the country. Data show that the spatial distribution of higher values basically overlaps with the highest values, while medium values are more dispersed, concentrated in the northeast, along the Hexi Corridor, in Xinjiang, in western Inner Mongolia, and in western Qinghai, Jiangxi, Guangxi, and Yunnan. Lower values are found in central and western China; these levels of indoor living facilities have a sheet-like distribution across eastern Inner Mongolia, on the Loess Plateau, and in surrounding areas on the Qinghai-Tibet Plateau, as well as in Yunnan, Guangxi, Guizhou, and Henan. Data show that Southwest China is characterized by the lowest levels; these values are largely distributed across northern Tibet and the southern Qinghai Plateau, as well as patchily on the Yunnan-Guizhou and Loess plateaus.
Results for the spatial distribution of traffic development reveal the presence of a high-medium-low trend that spreads from the east to the west, with the lowest values located in the western regions along a line marked by Helanshan-Longmen-Jinghong (Figure 3f). The highest values of traffic development are seen within the urban agglomerations of Beijing-Tianjin-Hebei and in the Yangtze and Pearl river deltas, and also have a scattered distribution in eastern urban areas marked by the Helanshan-Longmen-Jinghong line. Values for the Huang-Huai-Hai and middle-lower Yangtze plains are also higher, and similar values are also seen along main railways, including the Beijing-Guangzhou, Beijing-Harbin, and Lanzhou-Lianyungang lines. Medium values for this index conform to a sheet-like distribution in areas that encompass northeastern-to-northern Inner Mongolia and the Loess Plateau, as well as the Sichuan Basin, Hubei, western Hunan, Guizhou, and Guangxi. Lower values are seen in Heilongjiang, in eastern Inner Mongolia, western Sichuan, western Yunnan, and in border regions adjacent to Gansu and Qinghai.

3.2 Comprehensive multidimensional measures

(1) A comprehensive measure based on the polyhedron method. Results based on use of the polyhedron method led to an average RMDI calculation of 0.0516 for the 2376 counties of China. Data also reveal remarkable regional differences at the county level countrywide; the highest composite index was 1.0357 for the Xicheng District of Beijing, while the lowest value was just 0.0003 for Zhongba County in Tibet. We then used the natural fracture method (Figure 4) to divide Chinese counties into five levels (i.e., highest, higher, medium, lower, and lowest) based on their RMDI values. Comparative results show that the coastal areas of eastern China mainly exhibit the highest and higher levels for this index, while medium values are found in the central region and in the border regions of northern China. In contrast, the southwest and western border regions of the country are mainly characterized by lower and the lowest levels.
Figure 4 Spatial differences in the RMDI across China in 2010
The highest composite index groupings are found in Beijing and Tianjin, in the Yangtze and Pearl river deltas, and in the eastern municipal districts delineated by the Helanshan-Longmen-Jinghong line. At the same time, regions characterized by higher composite index values are mainly distributed adjacent to areas that exhibit the highest values, including around Beijing-Tianjin-Hebei, in the Yangtze and Pearl river deltas, in Shandong and Qinghai, and in western Inner Mongolia. Examples of the medium composite index group are widely distributed across China, forming densely distributed clusters in Northeast, North China, and the middle-lower Yangtze plains, as well as in southeastern coastal areas, in the Sichuan Basin, and in the central and eastern parts of Xinjiang. Lower composite indexes tend to be relatively more concentrated in the central and western regions, including the eastern areas of the Greater Khingan Mountains, on the western Huang-Huai Plain, in mountainous regions of Wuling and Qinling-Daba, as well as in northern Hebei, Yunnan, Guizhou, Qinghai, and Xinjiang. Results show that the composite indexes for western regions are the lowest of all, encompassing the Qinghai-Tibet and Yunnan- Guizhou plateaus, as well as southwestern Xinjiang and southern Gansu.
The eastern coastal areas of China tend to exhibit highest, higher, and medium levels of development because of natural and geographic advantages as well as superior social and economic maturity. At the same time, western Inner Mongolia and Qinghai are also characterized by higher levels of development because of their sparse populations and economic expansion promoted by abundant energy resources. Key counties listed in the National Poverty Alleviation Plan and regions that have been impoverished over long periods of time tend to exhibit the lower and lowest values of composite indexes (Liu and Xu, 2016).
(2) Comparative analysis of the four methods. As discussed above, we used SPSS software to carry out a series of correlation analyses between the results generated via the polyhedron, polygon, vector sum, and weighted sum methods. We performed comparative analyses at the county level and found the results of any two methods were correlated at a 0.01 significance level. We fitted data curves from the results of our four methods, using Excel, and generated power function relationships in each case (Figure 5). Although the results of these comparisons reveal a few differences between the results of the four methods, correlations are significant in all cases, with multiple correlation coefficients (R2) all higher than 0.9187. These results demonstrate that the four methods applied in this study are all equivalent in terms of their practical application at the county level.
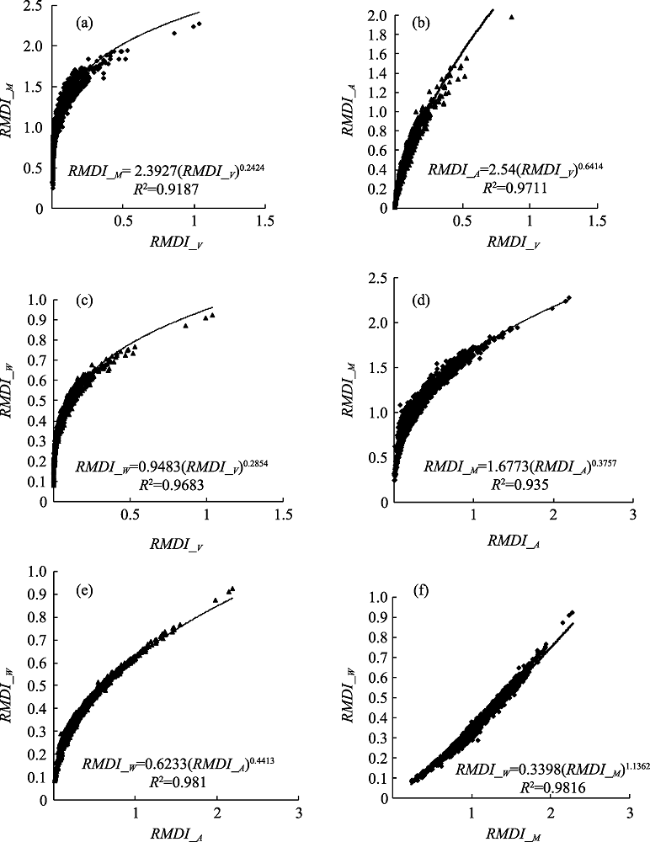
Figure 5 Curves fitted to results from the four measurement methods used in this study at the county level across China
In order to further verify the feasibility of our four methods at different scales, we performed additional correlation analyses in SPSS and Excel using the same indicators and methods as before but at the levels of city and province (Figure 6 and Table 3). Curves fitted to results generated using the polyhedron and polygon methods at city and provincial levels both show similar linear function relationships and have multiple correlation coefficients (R2) of 0.93 and 0.9554, respectively. Correlations between results generated using the vector sum and weighted sum methods reveal power function relationships at the city level and exponential function relationships at the provincial level, with R2 of 0.9838 and 0.9747, respectively. All other correlations conform to logarithmic function relationships, with R2 all greater than 0.9204. In other words, our results show that all four methods are equivalent in practical application at the city and provincial levels.
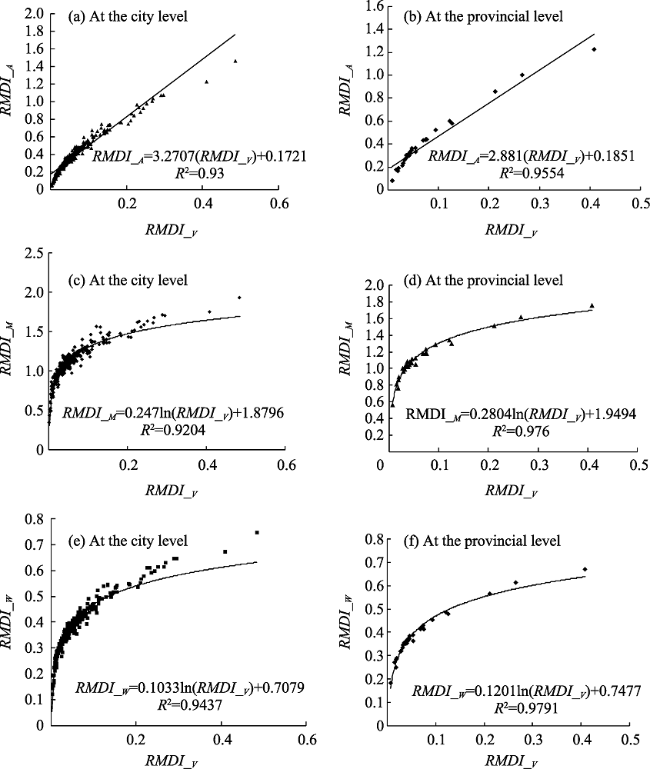
Figure 6 Curves fitted to results from the four measurement methods used in this study at the city and provincial levels across China
Table 3 Fitted equations and multiple correlation coefficients for the results of the four measurement methods used in this study at the provincial and city levels across China
Level Method Equation R2
City RMDI_A VS RMDI_M RMDI_M = 0.3902ln(RMDI_A) + 1.5412 0.9322
RMDI_A VS RMDI_W RMDI_W = 0.1624ln(RMDI_A) + 0.5655 0.9462
RMDI_M VS RMDI_W RMDI_W = 0.3403(RMDI_M)1.1574 0.9838
Provincial RMDI_A VS RMDI_M RMDI_M = 0.427ln(RMDI_A) + 1.567 0.9721
RMDI_A VS RMDI_W RMDI_W = 0.1821ln(RMDI_A) + 0.583 0.9664
RMDI_M VS RMDI_W RMDI_W = 0.1143e1.0723(RMDI_M) 0.9747

4 Discussion and conclusions

4.1 Discussion

(1) Correlations between RMDI and per capita GDP. Although previous research has used per capita GDP as a proxy for regional development level, correlation analysis between RMDI calculated using the polyhedron method and per capita GDP at the county level suggest that the latter does not accurately reflect the level of regional multidimensional development. Our correlation analysis shows that there is no obvious relationship between these two variables; the maximum multiple correlation coefficient (R2) between the two was 0.4467 when plotted using a linear function (Figure 7). Correlation coefficients were even less significant when other functions were used.
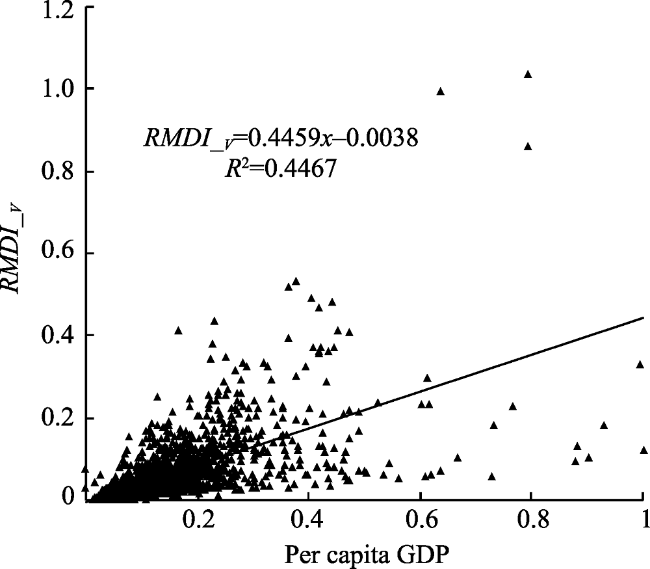
Figure 7 Lack of a correlation between the RMDI and per capita GDP
(2) It will be necessary to include ecological and environmental indicators in further studies. Much previous research has focussed on the question of how to incorporate ecological and environmental indicators within a comprehensive measurement index system and quantify them accurately. Quantifying these indicators has so far proved problematic, however, because ecological factors are diverse and there is often little to compare. In addition, air pollution is usually cross-regional, whereas water pollution is localized, soil pollution can be sophisticated, and the available environmental data used for monitoring remains incomplete. Therefore, although environmental and ecological indicators were not included in this study, it will be worthwhile to consider them in future research.

4.2 Conclusions

(1) Regional development research both nationally and internationally has developed from the use of trends in single elements and indicators towards the application of multi-element and multi-indicator comprehensive measures. Building on these developments, we selected 12 indicators from six dimensions, encompassing income, consumption, education, population urbanization, traffic, and indoor living facilities, and proposed the use of the polyhedron method to comprehensively measure levels of regional multidimensional development. We also enhanced the polygon and vector sum methods to render them more suitable for studying the status of regional multidimensional development. We present comprehensive measurements that quantify the level of regional multidimensional development at county, city, and provincial scales across China. We also analyze the spatial differences in these levels using these three methods, as well as the widely applied weighted sum approach. Our results show that while both the polyhedron and polygon methods are good for visual expression, the vector sum and weighted sum methods are relatively simpler.
(2) The results of this study reveal remarkable regional differences across China in the RMDI when calculated at the county level using the polyhedron method. Values for this index are high in eastern coastal areas, medium in the central regions and northern border regions, and low in the southwest and western border regions. Districts that are characterized by higher and the highest levels of the RMDI are distributed in eastern coastal areas, as well as in cities in central and western regions, and in areas where energy and mineral resources are being developed. Trends in the distribution of regions characterized by lower and the lowest levels of the RMDI coincide with regions of long-term poverty.
(3) We performed correlation analyses on the results of our four methods at provincial, city, and county levels. Results show that all four methods are equivalent to one another in practical application and can all be used to measure the RMDI. However, the lack of a correlation between RMDI calculated using the polyhedron method and per capita GDP at the county level indicates that the latter should not be used as a proxy for the level of regional multidimensional development.

The authors have declared that no competing interests exist.

1
Barro R J, Lee J W, 2010. A new data set of educational attainment in the World, 1950-2010.Journal of Development Economics, 104: 184-198.

2
Ediger V S, Tatlidil H, 2006. Energy as an indicator of human development: A statistical approach.The Journal of Energy and Development, 31(2): 213-232.

3
Fan Jie, 2015. Draft of major function oriented zoning of China.Acta Geographica Sinica, 70(2): 186-201. (in Chinese)

4
Fang Chuanglin, Mao Hanying, 1999. A system of indicators for regional development planning.Acta Geographica Sinica, 54(5): 410-419. (in Chinese)Regional development planning is a product of a region which has reached a certain level of economic and social development. From the perspective of sustainable regional development under the condition of transition to a market economy, this paper proposes a basic framework and method for the evaluation of regional development planning. The system consists of weighted coefficient values for planning indicators based on an entropy technique using the hierarchy analysis methods as well as methods to transform qualitative indicators to quantitative indicators based on expert opinions. Applied to western China as an example, this paper constructs a multi layer, multi objective fuzzy comprehensive evaluation model to assess the overall as well different levels of regional development. This indicator system is conducive to the ascertaining of the regularities of the dynamic changes in the levels of regional development and in detecting the general directions of regional growth. It is also a useful means for the design of effective programs to achieve specified levels of regional growth.

DOI

5
Fu Wei, Zhao Junquan, Du Guozhen, 2014. The evaluation of resources sustainable utilization: Based on empirical analysis of resources welfare index.Journal of Natural Resources, 29(11): 1902-1914. (in Chinese)The sustainable resources use is the core of development and its main component.As the background of the"nature-economy-society"trinity complex system,this paper,based on the perspective of the comprehensive resources utilization efficiency,put forward Resources Welfare Index(RWI) with the combination of Human Development Index(HDI) and Ecological Footprint Index(EFI).RWI means the level of welfare brought about by the unit resource to fully reflect the comprehensive efficiency level of the resources utilization to develop economy at the same time feedback to society.This paper used 24 countries as the research sample including the G20 countries and analyzed the changes of HDI,EFI and RWI from 1996 to 2008 to evaluate sustainable situation of resources utilization.We concluded that the sustainable utilization of the resources of the 24 countries could be roughly divided into three categories.The first category,benign development,the growth rate of RWI was positive,social welfare improved and resource consumption reduced;the second category,inferior benign positive development,the growth rate of RWI was positive,social welfare and resource consumption both improved,but the former growth rate is higher than the latter,and the third category,inferior malignant positive development,the growth rate of RWI was negative,social welfare and resource consumption both improved,but the former growth rate is lower than the latter.

DOI

6
Fukuda-Parr S, Lawson-Remer T, Randolph S, 2010. An index of economic and social rights fulfilment: Concept and methodology.Journal of Human Rights, 8(3): 195-221.In response to an increasing demand for rigorous monitoring of states in meeting their human rights obligations, a growing literature has emerged on measuring human rights fulfillment. Data are increasingly used in human rights assessment and advocacy but with an ad hoc approach, with three common limitations: frequent use of subjective indicators; focus on the right bearer enjoyment of right without taking account of duty bearer conduct; and event or country specific analysis that does not allow comparisons over time or space. This paper explores a methodology for measuring economic and social rights fulfillment that is reliable and authoritative. It proposes a composite index that: uses available survey-based objective, rather than subjective, data; focuses on state obligations rather than solely on individual enjoyment of rights; and captures progressive realization of human rights subject to maximum available resources. Two calculation methods are proposed: the ratio approach and the achievement possibilities frontier approach. The paper identifies key conceptual and data constraints. Recognizing the complex methodological challenges, the aim of this paper is not to resolve all the difficulties, but rather to contribute to the process of building rigorous approaches to human rights measurement. The proposed index provides important new information compared with other measures of economic and social rights fulfillment; although it still does not fully capture some desired features such as the right to nondiscrimination and equality, and the right to social security. The paper also outlines an agenda for longer term research and data collection that would make more complete measurement possible.

DOI

7
Galbraith J K, 1958. The Affluent Society. Boston: Houghton Mifflin Company.

8
Grimm M, Harttgen K, Klasen Set al., 2008. A human development index by income groups.World Development, 36(12): 2527-2546.

DOI

9
Jin F J, Wang C J, Li X Wet al., 2010. China’s regional transport dominance: Density, proximity, and accessibility.Journal of Geographical Sciences, 20(2): 295-309.Transport infrastructure plays an important role in shaping the configuration of spatial socio-economic structures and influences regional accessibility.This paper defines transport dominance from three aspects:quality,quantity,and advantage,measured by density,proximity,and accessibility indices.County is the basic unit for analysis.The results reveal:(1)Transport dominance statistically follows a partial normal distribution.A very few counties,1.4%of the total,have extremely high transport dominance which strongly supports the socio-economic development in these areas.In contrast,one eighth of all counties have poor transport dominance which impedes local socio-economic development to some extent. The remaining areas,about 70%of the counties,have median transport dominance.(2) Transport dominance is spatially unevenly distributed,with values decreasing gradually from the coastal area to the inland area.Areas in the first-highest level of transport dominance are mainly concentrated in the Yangtze River Delta,the Greater Beijing area,and the Pearl River Delta.Areas in the second-highest level are focused in Chengdu,Chongqing,and Wuhan metropolitan areas.Provincial capitals and a few other counties belong to the third-highest level.

DOI

10
Li X J, Luo Q, Hai B Bet al., 2016. Progress in the micro-perspective studies of economic geography in China since 1980s.Journal of Geographical Sciences, 26(8): 1041-1056.Micro-perspective studies on economic geography in China can be classified into geography of the enterprise, geography of the rural household, and small-scale studies on economic activities. Literature on geography of the enterprise includes spatial expansion of the enterprise, industrial location, firm's networks, industrial relocation, industrial clusters, and the relationship between industrial organizations and the environment. Studies on geography of the rural household(GRH) include the theoretical framework of GRH, the locations of rural economic activities, and the interrelation between rural households and geographical environment. Small-scale studies focus on human-land interaction from a land plot perspective, relations between specialized villages and the environment, and regional sustainable development research at site-specific scale. Micro-perspective studies on economic geography attempt to search for the basic unit of economic-geographical landscape, exploring the geographical process and the formation mechanism of geographical phenomena. The exploration of these three perspectives anticipates new approaches to economic-geographical studies with China's special background.

DOI

11
Liang Hong, 1994. Applicable appraise for population quality life index. Chinese Journal of Social Medicine, 6: 12-13, 16. (in Chinese)PQLI be often used in learn of propulation quality life,and some people donot agree to use this index,but nobody has studied the applicable of PQLI.This article want to appraise the ap- plicable of PQLI by buliding moving model under GNP background

12
Lin Yifu, Liu Peilin, 2003. Chinese development strategy and economic convergence.Economic Research Journal, 3: 19-25, 89. (in Chinese)This paper argues that the regional income gap of China is mainly due to the non-viability of enterprises caused by over-capital-intensity which is not matched to the endowment structure. Empirical research is consistent with this hypothesis.

13
Liu Hui, 2006. Regional inequality measurement: methods and evaluations.Geographical Research, 25(4): 710-718. (in Chinese)Regional inequality is one of the major subjects of research on China,and is a major concern to the Chinese government.On the basis of analyzing the structure differences of some major indexes for measuring regional inequality,the rural regional inequality changes in China at provincial level from 1980 to 2002 is described by different methods respectively.It is found that the changes of different indexes show the same trend in a longer period of time,but some in a shorter period.All the methods showed that China's rural regional inequality has an overall increasing trend with a short period of decreasing in the whole process of reform.However,the decomposition of the Theil's regional inequality reveals that since 1987,the interregional inequalities among the eastern,central and western regions have been more serious than the provincial inequality within regions.The further factor decomposition of the Gini index shows that farmers' wage component contributes more than 66% to the total inequality index and is the most important factor resulting in rural total regional inequality.It is proposed that any conclusions from a short period of data analysis are inadeguate.When analyzing driving forces of regional inequality,long-term data should be used.The further decomposing analysis of different indexes shows that each method has its own advantages and disadvantages.The Gini index is suitable for factor analysis but cannot be decomposed by regions.The greatest advantage of the Theil's index is that it can be decomposed by different levels of regions and is very useful for different spatial scale analyses of regional inequality.Standard Deviation is more suitable for simple analysis of regional inequality in China.Compared with the above three indexes,the Atkinson index is rarely used.But when regional inequality is very small,it is the only one that can be used for analysis.

DOI

14
Liu W D, Song Z Y, Liu Z G, 2016. Progress of economic greography in China’s mainland since 2000. Journal of Geographical Sciences, 26(8): 1019-1040.Economic geography in China's mainland has developed in a different way from that in many other countries. On the one hand, it has been increasingly active in participating in academic dialogues and knowledge development led by Anglophone countries; on the other hand, it takes practice-based and policy-oriented research, i.e. satisfying the demands from the Chinese government and society, as the linchpin of research. Since there has been a lot of literature reviewing the development of economic geography in the country before the new millennium, this paper will make a comprehensive analysis of the discipline in 2000 2015, based on a bibliometric survey and research projects done by Chinese economic geographers. The analysis indicates that(1) economic geography research in China's mainland is unevenly distributed but concentrated in several leading institutions;(2) traditional research fields like human-nature system, regional disparity, industrial location and transportation geography remain dominant while new topics such as globalization, multinational corporations and foreign direct investments, information and communication technology, producer services, climate change and carbon emission emerge as important research areas;(3) Chinese economic geography is featured by policy-oriented research funded by government agencies, having considerable impacts on regional policy making in China, both national and regional. To conclude, the paper argues that the development of economic geography in China's mainland needs to follow a dual track in the future, i.e. producing knowledge for the international academic community and undertaking policy-oriented research to enhance its role as a major consulting body for national, regional and local development.

DOI

15
Liu Y H, Xu Y, 2015. A geographic identification of multidimensional poverty in rural China under the framework of sustainable livelihoods analysis.Applied Geography, 73: 62-76.61A method for identification of multidimensional poverty was established.61The method better reflects the impact of multiple factors on people's livelihood.61The method targets at counties both in economic and multidimensional poverty.61Natural basis is still the key determination for China's multidimensional poverty.61The method can improve the effectiveness and sustainability of poverty reduction.

DOI

16
Lu Kangqiang, 2012. Component equilibrium: An improved composite method and its empirical test for HDI.Statistical Research, 29(10): 45-51. (in Chinese)HDI is a well-known and widely used composite index,but it has two statistical defects in its traditional calculation method: one is that it has no distributional-sensitivity to each of its sub-indicators,and the other one is that it ignores the equilibrium among its dimensional indices.Focusing on the latter and following the axiomatic approach,this paper presents an improved method for HDI in component equilibrium oriented.The empirical results show that,compared to both the traditional and the existing composite method,this improved method can not only give better expression to the main idea of human development,but also improve HDI's statistical discrimination.So the improved method can be taken as a new choice for calculating HDI.

17
Mahbubul H, 1999. Reflections on Human Development. New York: Oxford University Press.

18
Mishan E J, 1967. The Cost of Economic Growth. London: Staples Press.

19
Morris M D, 1978. A physical quality of life index.Urban Ecology, 3(3): 225-240.There is an increasing interest in measuring the extent to which the very poor benefit from economic development policies. Neither per capita Gross National Product nor any other monetary measure derived from the GNP is a very satisfactory indicator of how social benefits are distributed. Other measures, for example those based on nutrition or health standards, tend to be very ethnocentric. The Physical Quality of Life Index (PQLI) is an attempt to create a practical measure of social distribution that will avoid the limitations of the GNP, that will minimize cultural and developmental ethnocentricity, and that will be internationally comparable. It uses three indicators: literacy, infant mortality, and life expectancy at age one. Each is place on a fixed 1 100 scale. The worst (= 1) is set on the basis of historical experience; the best (= 100) is fixed in terms of what might be achieved within the next half-century or so. Having placed the three indicators on a common scale, the composite index is the result of an equally weighted summation. The PQLI is relatively neutral. It measures results, not inputs. To the extent that we can explain why a country like Sri Lanka, with a per capita income of $150, has a very high PQLI, the Index may lead us to less costly methods of life quality improvement (as measured by the Index) than now are used.

DOI

20
Noorbakhsh F, 1998. A modified Human development index.World Development, 26(3): 517-528.This paper discusses a modified index for measuring human development. The suggested index is based on the components of the Human Development Index (HDI) developed by the United Nations Development Programme (UNDP) since 1990. It discusses two categories of technical issues related to the HDI for 1995: those related to the components and those relevant to the structure of the index. The data from the Human Development Report 1995 for 174 countries are used to test the robustness of the suggested index and the results are compared to those of the HDI. The new index is then used to delineate, with some justification, different groups of countries at various levels of human development.

DOI

21
Nussbaum M C, 2000. Women and Human Development: The Capabilities Approach. New York: Cambridge University Press.

22
Pradhan R, Sanyal G S, 2011. Good governance and human development: Evidence from Indian States.Journal of Social and Development Science, 1(1): 1-8.

23
Salvati L, Venanzoni G, Carlucci M, 2016. Towards (spatially) unbalanced development? A joint assessment of regional disparities in socioeconomic and territorial variables in Italy.Land Use Policy, 51: 229-235.

DOI

24
Sen A, 1991. Welfare, preference, and freedom.Journal of Econometrics, 50(1/2): 15-29.

DOI

25
Silva R, Ferreira-Lopes A, 2014. A regional development index for Portugal.Social Indicators Research, 118: 1055-1085.In a report from 2008 the Organization for Economic Cooperation and Development came to the conclusion that Portugal is a country still very much marked by regional asymmetries and in need of better regional governance mechanisms and policies. We propose a regional development index for Portugal at the NUTS III level, based on the methodology of the human development index (HDI) from the United Nations Development Programme , which will be helpful to assess the evolution of the asymmetries between regions and evaluate the need for regional policy. Results show us a country that has most of the highest ranked NUTS III regions positioned along the coastline, although some interior NUTS III regions improved their relative positions in the ranking between 2004 and 2009. In addition to the three traditional dimensions of the HDI—income, education, and health—we include two more, given their increasing importance in the literature that criticizes the HDI and suggests the inclusion of new variables—governance and environment. Results show some considerable differences when we add the environment dimension: the interior regions improve their relative positions in the ranking, but in terms of governance they change little. Results also show that there is still the need for regional policy, although the dispersion in the ranking between the best and worst positioned NUTS III regions has decreased in all dimensions except education.

DOI

26
UNDP, 1990. Human Development Report 1990. New York: Oxford University Press.

27
The State Council, 2010. National Major Function Zoning. The State Council Article No.46 in 2010. (in Chinese)

28
United Nations, 1954. Report on International Definition and Measurement of Standards and Levels of Living. New York: United Nations.

29
Wang Xiaolu, Fan Gang, 2004. Analysis on the regional disparity in China and the influential factors.Economic Research Journal, (1): 33-44. (in Chinese)

30
Xu Yong, Fan Jie, 2014. Index system for regional development disparity measurement.Progress in Geography, 33(9): 1159-1166. (in Chinese)Development disparities among regions are the joint effect of multiple factors in the natural, economic, social, and cultural systems. Developing index systems for the measurement of regional development disparities reflects a trend of movement from single factor and single index analysis to multiple factors and multiple indices analysis in the field of regional development disparity research. Well-built index systems can be useful in promoting information rich and artificial intelligence based regional disparity analysis, identifying and analyzing factors that constitute constraints on regional development, and seeking directions for policy making to narrow gaps of regional development.(1) Regional development disparity refers to the extent to which regions as a whole or in certain aspects differ from each other in economic and social development or quality of human habitation. It is region specific, object oriented, development focused, integrated, and differentiation concerned. The key components of regional development disparities include economic, social, human capability, and human habitation disparities.(2) Principles to be observed in designing an useful index system for measuring regional development disparities include that the index system being developed should be scientifically proven, holistic, operable, hierarchical, and able to incorporate dynamic changes. Generally speaking, the complete index system should comprise of two sets of indices for different scales of analysis at the macroscopic scale and the microscopic scale. The hierarchical structure of these indices should include composite indices at the top, indicators in the middle, and attributes at the bottom.(3) In total, three sets of indices for measuring regional development disparities are developed initially. The indices for macroscopic analysis are comprised of 3 composite indices, 18 indicators, and 54 attributes. The recommended indices for macroscopic analysis include 3 composite indices, 11 indicators, and 13 attributes. The indices for microscopic analysis are made of 3 composite indices, 14 indicators, and 70 attributes.

DOI

Outlines

/