研究论文

Urban land expansion and its driving factors of mountain cities in China during 1990-2015

  • WANG Ziwei , 1, 2 ,
  • LU Changhe , 1, 2, *
Expand
  • 1. Key Laboratory of Land Surface Pattern and Simulation, Institute of Geographic Sciences and Natural Resources Research, CAS, Beijing 100101, China
  • 2. College of Resources and Environment, University of Chinese Academy of Sciences, Beijing 100049, China
*Corresponding author: Lu Changhe (C. H. Lu), Professor, E-mail:

Author: Wang Ziwei, PhD Candidate, E-mail:

Received date: 2017-10-17

  Accepted date: 2018-02-08

  Online published: 2018-08-10

Supported by

National Key R&D Plan of China, No.2017YFA0604701;National Natural Science Foundation of China, No.41671093

Copyright

Journal of Geographical Sciences, All Rights Reserved

Abstract

Land expansion of mountain cities in China is not systematically studied yet. This study identified 55 major mountain cities at and above prefecture level, and analyzed the land expansion characteristics and driving forces, based on visually interpreted data from TM images in 1990, 2000, 2010 and 2015. From 1990 to 2015, total built-up land area of the mountain cities increased by 3.87 times, 5.56% per year. The urban land growth was apparently accelerated after 2000, from 4.35% per year during 1990-2000 increased to 6.47% during 2000-2010 and 6.2% during 2010-2015. Compared to the urban population growth, the urban land expansion rate was 44% higher. As a result, the urban land area per capita increased, but it was still within the government control target, and also was much lower than the average of all cities in China. Urban development policy, changes to administrative divisions, GDP and population growth, and road construction were identified as the major driving forces of land expansion. Terrain conditions were not found a relevance to the urban land expansion rate during 1990-2015, but had a significant impact on the layout and shape, and also probably on the urban land efficiency.

Cite this article

WANG Ziwei , LU Changhe . Urban land expansion and its driving factors of mountain cities in China during 1990-2015[J]. Journal of Geographical Sciences, 2018 , 28(8) : 1152 -1166 . DOI: 10.1007/s11442-018-1547-0

1 Introduction

Since 1990, China’s urban land has experienced a rapid expansion and as of the end of 2015, the total area from the statistical data was 40,941 km2, up 311.4%. This quick urban land expansion was not in a synchronous pace with the urban population growth, as the urbanization rate was 56.1% in 2015, increasing only by 29.7% compared to that in 1990. This illustrated that the urban land expansion was not only driven by urban population growth, but also by other factors such as economic development, transportation infrastructure construction, industrial restructuring, and new district development (Chen et al., 2016; Li et al., 2011; Tan et al., 2005; Zhou et al., 2007).
For individual cities, the urban land area mostly showed a quick expansion during the past two decades, but the growth rate varied greatly over time and space (Chi et al., 2015; Liu et al., 2016; Tong et al., 2016; Yu et al., 2016). This implies that the pattern and driving mechanism of urban land expansion differed regionally, due to the influence of diversified socio-economic conditions (Huang et al., 2007; Lin et al., 2015; Tan, 2017; Yu et al., 2017). In addition, the terrain and natural resource conditions also exerted a great influence on the urban land expansion (Cao et al., 2016; Li et al., 2016; Zhang et al., 2016), particularly for mountain cities.
In China, two thirds of the territory is mountainous areas and 35% of the designated cities are mountain cities (Huang, 2006). So far, only a few studies have paid special attention to mountain cities, and discussed issues related to urban land use structure (Guo et al., 2005) and urban planning (Liu, 2009). To understand the development process of mountain cities, we should make a systematic analysis of the urban land expansion and the driving mechanism. Therefore, this study selected the mountain cities at and above prefecture level as the representative to identify the urban growth characteristic and the causes. Firstly, the urban land area for each city was extracted in four representative years of 1990, 2000, 2010 and 2015 by visual interpretation using TM images, and then the urban land expansion rate and its spatio-temporal variation during 1990-2015 were analyzed using index approaches and ArcGIS tools. Finally, the driving factors were identified by ridge regression analyses.

2 Data and methods

2.1 Definition of mountain city and the urban area

Based on the definition in previous studies (Chen, 2001; Huang, 2006), a city located in mountainous areas is simply identified as a mountain city. The built-up areas of a mountain city are generally distributed in valleys and basins or on gently sloping lands, and mostly surrounded by steep terrain. The urban area includes all the built-up lands within the city districts, the same as the city range defined in the China City Statistical Yearbook. In this study, only the mountain cities at and above prefecture level were studied. From the 295 same-level cities across China, a total of 55 cities were determined as mountain cities, using slope steepness and relative elevation as the major indicators based on the 30-m resolution DEM and imagery data. These mountain cities are mostly distributed in central, southwestern and northwestern China (Figure 1).
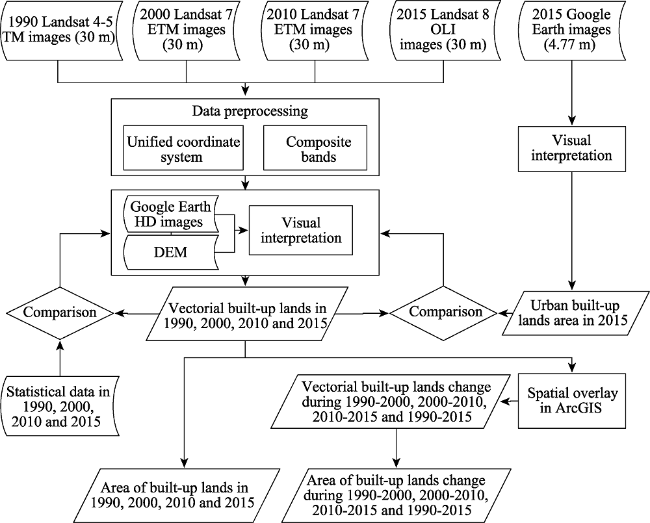
Figure 1 The flowchart of urban land area extraction in the four years and calculation of its changes for the four periods

2.2 Extraction of urban land area

This study selected the years of 1990, 2000, 2010 and 2015 as representatives. The urban area of the mountain cities for each year was extracted using Landsat images and digital elevation data of ASTER GDEMV2. The data, as collected from the Computer Network Information Center, Chinese Academy of Sciences (http://www.gscloud.cn) included Landsat 4-5 TM images in 1989, 1990 and 19911( As the images in 1990 were only available for 16 cities (Chenzhou, Hechi, Lishui, Longnan, Lvliang, Mianyang, Shangluo, Shaoguan, Tianshui, Tongren, Weihai, Yan’an, Zigong, Leshan, Yibin, and Zunyi), the urban boundary was delineated using the images in 1989 for 22 cities (Bijie, Dazhou, Fushun, Benxi, Guangyuan, Guiyang, Hegang, Huangshi, Liaoyuan, Lincang, Liupanshui, Longyan, Nanchong, Chongqing, Nanping, Panzhihua, Sanming, Wuzhou, Xining, Yangquan, Yichun, Yichun), and 1991 for other 17 cities.), Landsat 7 ETM images in 2000 and 2010, and Landsat 8 OLI images in 2015 at the same spatial resolution of 30 m. The imagery data were imported to ArcGIS to convert to the WGS-84 coordinate system, and then to make the false colored images based on the short-wave infrared band, near infrared band and green band using the Composite Bands tool in ArcGIS. With the colored images, the urban area in each of the four years was interpreted, respectively. In addition, the digital elevation data and Google Earth HD images were used to help determining the boundary when it cannot be clearly identified with the Landsat images. The interpreted urban area for each city in 1990, 2000, 2010 and 2015 was overlapped in sequence using analysis tools in ArcGIS to obtain the urban area changes in 1990-2000, 2000-2010, 2010-2015 and 1990-2015, respectively (Figure 1).
To examine the accuracy, we downloaded the high resolution color images (4.77 m) of 2015 from Google Earth for the 55 cities. With these images, we obtained the urban area for each city by visual interpretation. By comparison, the area obtained with the Landsat images in 2015 was overestimated by 0.16%-18.26% for 39 cities and underestimated by 0.26%-15.44% for the other 16 cities. The absolute value of the error was below 5% for 17 cities, 5%-10% for 16 cities, 10%-15% for 15 cities, and above 15% for 7 cities. The mean absolute value of the errors was 8.29% for all cities. Compared with the statistical data reported in the China City Statistical Yearbooks, the interpreted urban area was 23% lower in 2015, since the statistical data included the lands that obtained the Land Planning Permit and Land Construction Permit, but not constructed yet. In general, the data accuracy could be acceptable for the objective of this study mainly aimed to detect the urban land change during 1990-2015.

2.3 Methods

Urban land expansion rate can be quantified using index methods, such as proportion index, extent index, and growth speed index. For the driving mechanism, multi-regression analyses were normally applied (Li et al., 2017; Yu et al., 2017). In this study, three indices were used to characterize the land expansion characteristic of mountain cities, and multi-regression analyses were applied for detection of the driving forces.
2.3.1 Quantification of urban land expansion
Annual growth rate of urban land area, the elastic coefficient to urban population growth, and city compactness index were used to describe the land expansion characteristics. For urban land growth rate, it is calculated with the formula below:
R = [(Lt / L1)1(t-1) - 1] × 100% (1)
where R is the annual growth rate (%) during the study period t (years), and L1 is the urban land area (km2) at the beginning year and Lt at the ending year of the study period.
Elastic coefficient is used to evaluate the coordination degree between urban land and population growths for each city from 1990 to 2015. This widely used coefficient (Yang et al., 2013) is presented as the ratio of mean annual growth rate (%) of urban land area to that of urban population during a given period (An et al., 2012). Based on the data availability, the urban population data in 1990 were collected from the China City Statistical Yearbook, in 2000 and 2010 separately from the fifth and sixth census data, and in 2015 from the statistical bulletin of the national economic and social development of each city district.
City compactness index is used to characterize the shape of a city (Mizutani, 2012; Pan et al., 2015), by checking degree of the urban built-up area approaching to a circle shape. It is formulated as below:
$C=\frac{2\times \sqrt{\pi \times A}}{P}$ (2)
where A represents the urban land area (m2), P stands the boundary length (m), and C is the compactness index for a city. The compactness index ranges between 0 and 1. The larger the compactness index is, the closer to a circle the city shape is, and thus the more compact the city is (Liu et al., 2014). In this study, the urban area and its perimeter were calculated using the ArcGIS Calculator for each of the 55 cities in 1990, 2000, 2010 and 2015. For cities comprising several built-up areas, the compactness index was the weighted average of the index of each built-up area that was calculated with the same equation (2).
2.3.2 Identification of factors affecting urban expansion
Qualitative analyses were firstly applied to screen out possible factors affecting urban land expansion by literature reviews, and then ridge regressions that can eliminate the multicollinearity influence (Barcena et al., 2014), was used to identify the driving factors and their contribution to urban land change. By preliminary analysis, seven socio-economic factors were considered, including GDP, urban income, urban population, fixed asset investment, foreign investment, urban green land area, and urban road area. The data during 1990-2015 were collected from China City Statistical Yearbook for 48 mountain cities1( Due to administrative changes, the socio-economic data during the study period were incomplete for other 7 cities including Lvliang, Tongren, Bijie, Pu’er, Lincang, Longnan and Hechi, thus these 7 cities were excluded for the analysis.) with complete available data. In addition, two terrain variables, i.e., slope steepness and elevation for the urban area, and three buffer zones of 500 m, 1000 m and 2000 m around the city were included for the analysis, with the data computed from the DEM data using ArcGIS. For GDP and income, the values at 2000, 2010 and 2015 were converted to the constant price at 1990. All variables were normalized using the Napierian logarithm to eliminate the heteroscedasticity (Zhang, 2007), and then regressed using ridge regression approach to identify the relevance degree and contribution to urban land area and the change. The general form of multivariable regression is presented below:
$\ln {{A}_{i}}=\sum{{{\beta }_{ij}}\ln {{V}_{ij}}+\varepsilon }$ (3)
where Ai is the urban land area (km2) in a year for city i, Vij is the independent variables involved such as GDP and population, βij is the coefficient of variable j, and ε is residual error. For the analysis of factors affecting the urban land change, the value for the variables is the total change during the given period.

3 Urban land expansion characteristics of mountain cities

3.1 Urban land expansion and its spatio-temporal variation

The urban built-up land area for all mountain cities, totalling 5047 km2 in 2015, or 12.32% of the total built-up area for all cities in China, expanded by 387.01% in total or 5.56% per year, compared to that of 1304 km2 in 1990. Regionally, western China showed the fastest urban land growth of 6.74% per year, followed by 6.33% in eastern China and 4.93% in central China (Table 1). For the mountain cities in northeastern China that are generally resource-based, the urban land showed a very low growth rate, only with an annual rate of 2.17%. At city level, the expansion rate varied greatly from 0.63% to 9.44% per year (Figure 2 and Table 2). In 15 cities including Chongqing, Yan’an, Mianyang, Tongren, and Weihai, the urban land area increased by 5.04-9.54 times during the past 25 years, while in 4 resource-based industrial cities of Hegang, Shuangyashan, Benxi and Fushun, the urban area was only increased by 17.1%-31.7%.
Table 1 Total urban land area of mountain cities in 1990, 2000, 2010 and 2015 and annual growth rate in different regions of China during 1990-2015
Regions Urban land area (km2) Annual growth rate (%)
1990-2015
1990 2000 2010 2015
Eastern China 112.97 207.89 430.71 524.62 6.33
Central China 220.32 311.88 577.21 734.27 4.93
Western China 627.42 1064.76 2251.7 3201.00 6.74
Northeastern China 343.57 412.04 476.12 587.82 2.17

Note: Eastern China includes cities in provinces of Hebei, Shandong, Zhejiang, Fujian and Guangdong. Central China includes cities in Shanxi, Henan, Hubei, Hunan and Jiangxi. Northeastern China includes cities in Heilongjiang, Jilin and Liaoning, and western China includes cities in Sichuan, Guizhou, Yunnan, Shaanxi, Gansu, Guangxi and Qinghai and the city of Chongqing.

Table 2 Annual urban land growth rate (%) in different periods and the elastic coefficient for all mountain cities of China during 1990-2015
City Annual urban land expansion rate (%) Population growth (%) 1990-2015 Elastic
coefficient 1990-2015
1990-2000 2000-2010 2010-2015 1990-2015
Chengde 6.50 5.06 2.07 5.02 3.59 1.40
Yangquan 2.68 0.08 4.94 2.08 2.67 0.78
Lvliang 1.19 12.45 4.42 6.22 7.76 0.80
Fushun 1.17 1.00 0.69 1.01 0.65 1.55
Benxi 0.66 1.49 0.27 0.91 0.74 1.23
Liaoyuan 3.73 1.85 2.13 2.65 1.11 2.39
Baishan 3.40 1.22 1.92 2.23 3.00 0.74
Tonghua 3.10 0.91 4.61 2.52 1.23 2.05
Jixi 3.94 2.26 7.20 3.90 0.79 4.94
Hegang 0.94 0.10 1.10 0.63 0.87 0.72
Shuangyashan 0.25 1.51 2.03 1.11 -2.71 -0.41
Yichun 2.73 5.61 23.26 7.73 -0.14 -55.21
Lishui 4.58 15.42 4.97 8.87 7.28 1.22
Sanming 0.65 3.18 3.73 2.27 2.28 1.00
Nanping 6.99 3.72 16.14 7.42 2.18 3.40
Longyan 12.81 4.38 1.07 6.98 5.50 1.27
Yichun 7.39 10.43 3.52 7.80 5.51 1.42
Weihai 8.68 12.50 5.03 9.44 7.75 1.22
Sanmenxia 6.31 2.43 1.19 3.71 3.62 1.02
Huangshi 0.85 7.91 1.36 3.72 2.49 1.49
Shiyan 4.03 6.54 11.60 6.51 4.59 1.42
Yichang 2.45 7.21 9.04 5.64 5.08 1.11
Chenzhou 5.54 6.06 3.22 5.28 6.01 0.88
Zhangjaijie 7.88 5.32 1.94 5.64 6.17 0.91
Huaihua 5.96 7.39 2.31 5.78 4.50 1.28
Yiyang 2.94 7.90 1.73 4.65 6.04 0.77
Loudi 2.25 5.23 4.85 3.96 5.50 0.72
Shaoguan 3.66 6.59 1.00 4.28 3.97 1.08
Wuzhou 7.99 4.06 3.12 5.42 3.42 1.58
Hechi 5.29 5.65 1.60 4.68 5.95 0.79
Zigong 4.27 3.70 6.41 4.47 2.89 1.55
Chongqing 4.03 11.86 15.05 9.27 7.30 1.27
Nanchong 5.29 14.40 3.23 8.41 7.52 1.12
Luzhou 6.45 8.07 8.28 7.46 5.63 1.33
Mianyang 10.90 8.06 5.48 8.66 5.18 1.67
Neijiang 4.37 6.31 2.91 4.85 3.86 1.26
Leshan 8.26 4.84 1.63 5.54 3.21 1.73
Yibin 8.79 4.48 3.81 6.05 5.45 1.11
Guangyuan 8.83 8.54 0.65 7.02 4.16 1.69
Dazhou 9.37 5.21 3.66 6.54 6.18 1.06
Panzhihua 2.10 2.02 1.93 2.03 1.97 1.03
Liupanshui 3.27 10.47 5.07 6.46 1.00 6.46
Tongren 3.29 13.02 9.90 8.41 5.80 1.45
Bijie 2.74 10.03 4.71 6.00 9.32 0.64
Guiyang 7.54 6.15 7.80 7.03 4.33 1.62
Zunyi 5.18 5.21 7.70 5.69 5.12 1.11
Kunming 6.78 11.74 1.20 7.58 4.75 1.60
Puer 3.79 12.17 1.68 6.63 5.66 1.17
Lincang 3.28 10.06 5.39 6.37 2.94 2.17
Shangluo 5.73 5.86 4.24 5.48 6.23 0.88
Yan’an 5.73 7.83 15.40 8.45 5.88 1.44
Lanzhou 4.45 1.01 1.27 2.43 3.74 0.65
Tianshui 3.20 1.74 3.73 2.72 4.04 0.67
Longnan 10.18 4.23 3.70 6.46 6.59 0.98
Xining 5.52 6.15 4.35 5.54 3.24 1.71
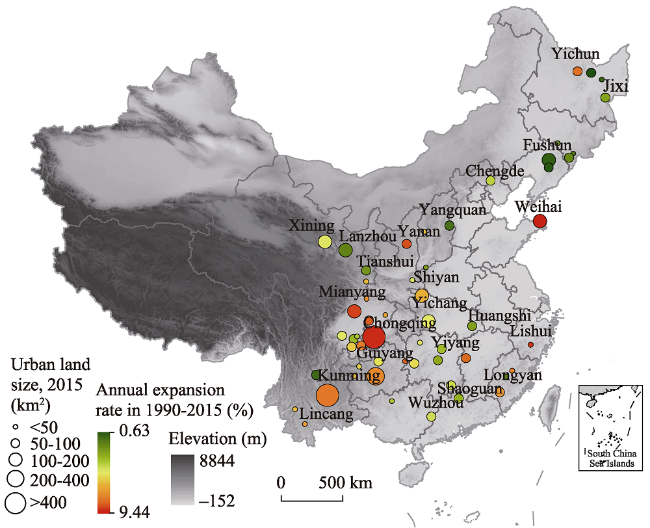
Figure 2 Spatial variation of urban land area and annual expansion rate of mountain cities in China
The mean urban land expansion rate of all mountain cities was 4.35% per year during 1990-2000, increased apparently to 6.47% during 2000-2010, and then slightly decreased to 6.2% during 2010-2015. As for individual cities, the growth rate varied more greatly among the three periods (Table 2), with the greatest expansion not synchronized in the same stage. In 22 cities, the fastest urban expansion occurred in the second period of 2000 to 2010, 16 in the first decade, and 17 in the last five years. Several cities showed an abrupt increase in the urban land area, such as Yan’an and Shiyan during 2010-2015, Chongqing, Weihai, Tongren, Lishui, Nanchong and Puer during 2000-2010, and Longyan, Mianyang and Longnan during 1990-2000. This quick increase was largely caused by the administrative adjustment and new district development.
The elastic coefficient of urban land growth to urban population growth during 1990-2015 varied from 0.65 to 6.62 for the mountain cities (Table 2) except two resource-based industrial cities in northeastern China. The elastic coefficient of these two cities showed a negative value, due to the urban population decrease. In 15 cities including Lanzhou and Tianshui, the elastic coefficient was less than 1, as the growth rate of urban land was lower than that of the population, while in 23 and 15 cities the elastic coefficients ranged from 1.01 to 1.50 and above 1.50, respectively. As a result of the very low population growth, Liupanshui and Jixi showed a very high value of 6.46 and 4.94 (Table 2). Except the two cities with negative values, the mean elastic coefficient for all other cities was 1.44, implying that mean growth rate of urban land was 44% higher than that of population, exceeding the rational value of 1.10, as suggested in literature (An et al., 2012; Marshall, 2007).

3.2 Urban sprawl characteristics

Figure 3 presents urban land sprawl of all mountain cities during 1990-2015, showing that the urban land expanded unevenly in terms of spatial distribution. In many cities such as Tonghua, Bijie, Yan’an, Panzhihua, Tongren, Shuangyashan, the new urban area extended along river valleys in a stripped pattern. In several cities including Chongqing, Guiyang, Nanchong, Lishui, Shaoguan, Hechi and Weihai, the new urban lands were separately developed in different areas with some distance from the old city areas. In cities including Lincang, Yiyang, Yichun, Pu’er, Longyuan, Baishan and Sanmenxia, the new urban area was continuously extended from the old city, because these cities are generally located in mountain basins, and thus there is continuous gentle land near the cities suitable for urban development.
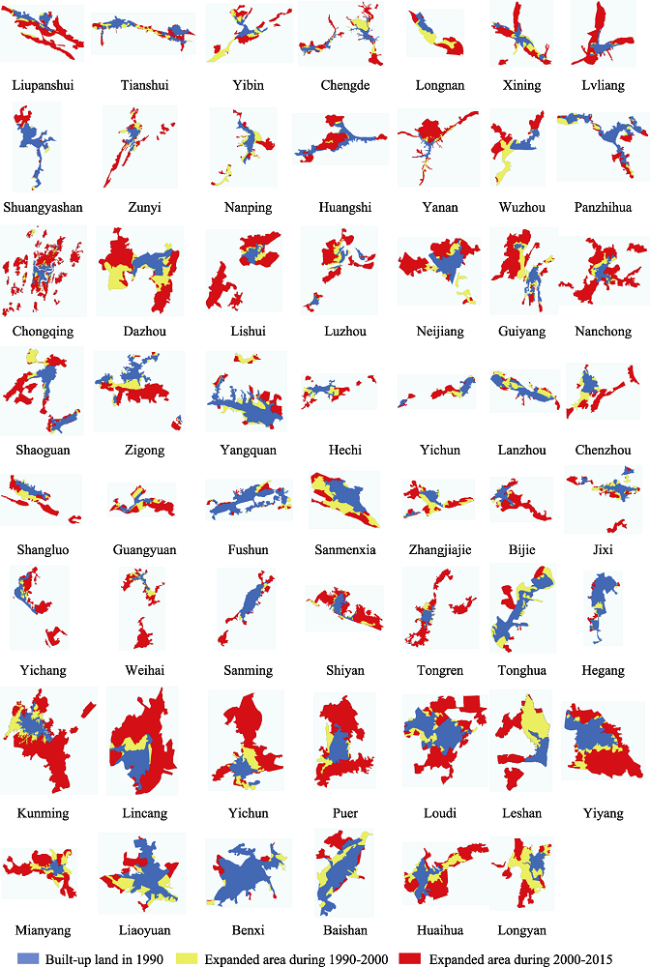
Figure 3 Urban land expansion in all mountain cities of China during 1990-2015 (the maps are schematically presented, not at the same scale)
The urban land area of most mountain cities is spatially discontinuous, irregular and incompact, and thus the compactness index was very low. The average index value was only 0.36, 0.34, 0.34 and 0.33 in 1990, 2000, 2010 and 2015, respectively, much lower than the value of 0.375 to 0.739 for other cities reported in different studies (Liu et al., 2014; Pan et al., 2015). Of the 55 mountain cities, only 17 in 1990, 15 in 2000, 13 in 2010 and 12 in 2015 showed a compactness index value above 0.4, while 18 cities were found with the value below 0.3 in 2015. Compared to 1990, the compactness index in 2015 apparently decreased in most mountain cities (Figure 4), inferring that the suitable land surrounding the city could be becoming less available, and thus the terrain restriction on the urban layout was stronger.
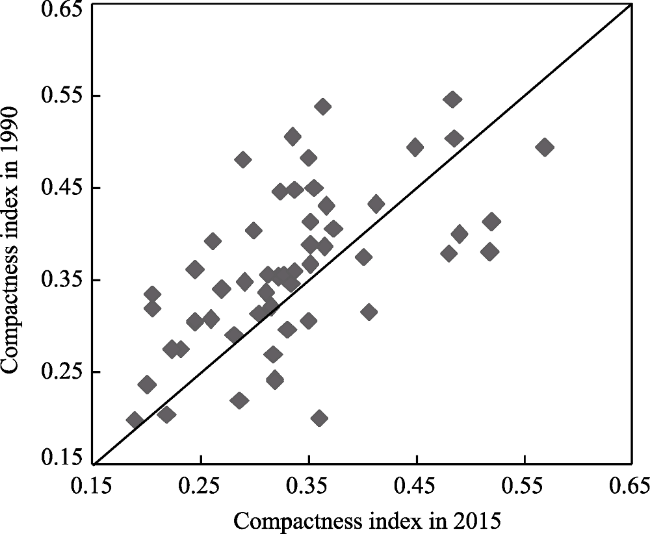
Figure 4 Schematic comparison of city compactness index of mountain cities in China in 1990 and 2015

4 Factors affecting the urban land expansion

This section analyzed the influences of policy, adjustment of urban administrative division, terrain and socio-economic factors on the urban land change during 1990-2015.

4.1 Urban development policy

As indicated by several studies (Huang et al., 2012; Obeso Muniz et al., 2017), the government policies have a great influence on the urban development, including industry policy, fiscal policy, land use policy, regional development policy, and urban planning policy. For the mountain cities involved in this study, changes in the urban land growth rate between different stages could be mainly caused by the national urban development policy. In 1990, the Chinese government issued the City Planning Law, to “strictly control the size of large cities and rationally develop medium-sized cities and small cities”. Meanwhile, various policies were simultaneously adopted to control the over-expansion of urban land, particularly that of large cities. After ten years, this control was relaxed in 2000 by the policy adjusted to “adhere to the coordinated development of large, medium and small cities, and small towns”, which was released in the China’s 10th Five-Year Plan (2001-2005) and the Report at 16th CPC National Congress in 2002. With this relaxed control, many cities enhanced the development, resulting in the much quicker urban land expansion after 2000.

4.2 Changes to administrative divisions

Changes to the administrative divisions involve the adjustment in administrative rank, economic status and territorial governance (Cartier, 2016). These changes were often associated with new area development, and thus greatly stimulated the expansion of city range (Wang et al., 2016). During the study period, several mountain cities adjusted the city scope to extend the urban space. Such a well-known city is Chongqing. In 1997, it was approved as the fourth municipality directly under the central government, and since then the urban growth rate was doubled (Table 2). Another case is Kunming. After the new planning was implemented in 1998 (Luo et al., 2015), Kunming city kept a high land expansion rate of more than 10% per year during 2000-2010. In several other cities, such as Tongren and Yan’an, the urban land showed an accelerated expansion after the new district development was implemented in 2006 and 2012, respectively.

4.3 Terrain conditions

As mentioned in Section 3.2, terrain conditions had a significant influence on the shape and layout of mountain cities, but its impact seemed insignificant on the city size and expansion speed of the urban land area. Terrain characteristics indicated by the slope steepness and elevation were not found to have a relevance to the total urban land area and urban land changes by paired correlation. This was also found in a previous study for all cities in China (Huang et al., 2007). The reason might be that the terrain limitations can be largely removed by engineering measures such as building industrial terraces, truncating small hills, which has been practiced in mountain cities such as Yan’an and Tongren in recent years. Another reason is that the city can select a new area to break through the shackles of insufficient space around the built-up area for urban development (Zhang et al., 2015).
Since larger investment is needed to realize the land expansion, the mountain cities generally showed a stronger tendency to more efficiently use the urban space than to expand the area, compared to other cities in China. From this angle, terrain condition could have a significant restriction on the development of mountain cities. For instance, the mean land area per capita in the mountain cities was 74.6 m2 in 1990, 65.8 m2 in 2000, 87.1 m2 in 2010, and 97.3 m2 in 2015, all below the target area (100 m2 per capita) of urban land use control specified by the Chinese government (MLR, 2014). The cities with the urban land area below 100 m2 per capita covered 84% of the mountain cities in 1990, and further increased to 95% in 2000. After then, the proportion decreased to 75% in 2010 and further to 58% in 2015, implying that the urban land expansion was highly accelerated in many mountain cities during the last 15 years. For all cities in China, the mean land area per capita was 87.1 m2, 107.1 m2, 117.0 m2 and 113 m2 in the corresponding year (MOHURD, 2016; Wang et al., 2012; Yang et al., 2013), which is expected to reach 165 m2 in 2020 (Tan et al., 2010).

4.4 Socio-economic factors

The ridge regressions indicated that total GDP, urban population, and green land area had a significant relevance to the urban land area in the four years. Road land area appeared to be a significant contribution factor in 2000 and 2015 (Table 3). Urban population was the most important factor influencing urban land area: the contribution coefficient was 0.296 in 1990, implying that the urban land area would increase by 2.96% with a growth of 10% in population. After 1990, its influence showed a slightly declining trend, from 0.29 in 2000 to 0.276 in 2010 and 0.266 in 2015. Total GDP and green land area were also significant to the urban area, but their significance, i.e., the contribution coefficient decreased, from 0.258 and 0.279 in 1990 to 0.136 and 0.177 in 2015, respectively. Total urban road area was not found to have a significant relevance to the urban land area in 1990, but in 2015, it became the most important contributor, implying that transportation construction was becoming more important in promoting urban development. Assets investment was found to have a significant relevance only in 2010.
Table 3 Regression results between urban land area and the driving factors in four years
Factors 1990 2000 2010 2015
LnGDP 0.258** 0.189** 0.139*** 0.136**
(2.567) (2.133) (2.876) (3.109)
LnPOP 0.296*** 0.29*** 0.276*** 0.266***
(2.9) (3.242) (5.323) (4.763)
LnGR 0.279*** 0.162* 0.192*** 0.177**
(3.314) (1.987) (3.6) (3.077)
LnINV 0.074 0.113 0.133** 0.0308
(0.742) (1.337) (2.555) (0.605)
LnRDA 0.039 0.172* 0.231*** 0.312***
(0.452) (1.916) (4.24) (5.563)
R2 0.78 0.751 0.897 0.845
Adjusted R2 0.753 0.72 0.886 0.829
F statistics 29.14*** 24.767*** 82.117*** 53.375***

Note: *, **, *** represent the significance level of 10%, 5% and 1%, respectively. The value in parentheses is the t test.

For the urban land expansion, urban population growth (LnΔPOP) and urban road construction (LnΔRDA) were found to be the significant contributors in the four periods (Table 4). During the study period of 1990 to 2015, changes in GDP (LnΔGDP) showed a significant contribution to the urban land expansion, and in the other periods, the contribution was not significant. In 2010-2015, total fixed assets investment (LnΣINV) had a significant contribution to the urban land increase (Table 3), implying that the low-slope hilly and mountain land development promoted by the government since 2011 (MLR, 2011) obviously stimulated the land expansion of mountain cities. During the 25 years from 1990 to 2015, land expansion of the mountain cities was mainly stimulated by urban population growth, road construction and GDP growth, which can explain about 70% of the urban land increase. Income and foreign investment, and slope steepness and elevation were not found to have a significant relevance to the urban size or urban land expansion.
Table 4 Regression results between urban land increase and the driving factors during three periods
Factors 1990-2000 2000-2010 2010-2015 1990-2015
LnΔGDP 0.073 0.0635 0.121 0.197**
(0.713) (0.437) (1.279) (2.544)
LnΔPOP 0.319*** 0.334*** 0.215** 0.186**
(2.99) (2.767) (2.188) (2.257)
LnΣINV 0.144 0.0929 0.259** 0.101
(1.386) (0.929) (2.561) (1.224)
LnΔRDA 0.225** 0.284** 0.232** 0.365***
(2.143) (2.281) (2.442) (4.272)
R2 0.457 0.461 0.516 0.688
Adjusted R2 0.406 0.411 0.472 0.658
F statistics 8.861*** 9.404*** 11.74*** 23.191***

Note: *, **, *** represent the significance level of 10%, 5% and 1%, respectively. The value in parentheses is the t test.

5 Discussion

5.1 Spatio-temporal variation of urban land expansion rates

From 1990 to 2015, the total built-up land area of the mountain cities increased by 3.87 times, or 5.56% per year. Affected by the urban development policy, the urban land expansion showed a periodic characteristic, with the annual growth rate varying from 4.35% during 1990-2000 to 6.47% during 2000-2010 and then to 6.2% during 2010-2015. This phased difference was also observed for the urban land change in other cities of China, but the difference extent was much lower in the mountain cities. For instance, Liu et al. (2014) found that the built-up land expansion rate of China during 2000-2010 was 2.14 folds of that during 1990-2000. According to the statistics, the annual growth rate in China’s total urban area was 6.95% during 2000-2010, but it was only 2.12% during 1990-2000. This infers that the policy adopted in 1990 to control the over-expansion of large cities had a less impact on the mountain cities, because the cities are mostly small and medium-sized cities.
The urban land expansion showed an obvious regional difference, with an annual growth rate during the 25 years ranged from above 6.0% in the eastern and western regions of China, to 4.93% in the central region, and then apparently decreased to 2.17% in northeastern China (Table 1). For all cities in China, the urban land expansion showed a similar regional variation (An et al., 2012; Wen et al., 2016). As for individual mountain cities, the urban growth rate varied greatly, with the area increasing by 5.40-9.54 times in 15 cities and only 17.1%-31.7% in 4 cities in northeastern China. For the quickly growing cities, the land expansion was greatly promoted by the changes to administrative divisions and new district development, while for the slowly ones, the low land expansion was mainly due to the shrinkage of urban population associated with low economic development. Several similar cases were reported in previous studies. For instance, in Shanghai, the urban land area increased by 120% from 1990 to 2000 after the Pudong New Area was initiated in 1990 (Zhang et al., 2015). In Tianjin, the urban land was expanded by 78% during 2000-2010, mainly as a result of the Binhai New Area development after 2000 (Zhang et al., 2016).

5.2 Urban land expansion and population growth

Total growth of urban land for the mountain cities was much higher than that of urban population, with the mean elastic coefficient of 1.44 from 1990 to 2015. However, the urban expansion for the mountain cities as a whole was lower compared with other cities in China. A study indicated that the mean elastic coefficient for all cities in China was 1.53 during 1990-1999 and 2.25 during 1999-2009 (An et al., 2012), showing a much faster growth rate in the urban land area compared with population. As for specific cities, about half of the mountain cities showed an above 20% quicker growth in the urban land area than population. However, over 65% of the cities in China showed a much faster growth of urban land than that of population (Yang et al., 2013; Zou et al., 2015). In general, the urban land use intensity in the mountain cities was rather high, for instance, the mean land area per capita for the 55 mountain cities was 97.3 m2 in 2015, while it was only 86.1% of the mean value (113 m2) for all cities in China in 2015 (MOHURD, 2016).

5.3 Urban land expansion mechanism

In most mountain cities, the terrain seems to have no significant influence on the urban land expansion rate, which is in accordance with the results reported by Huang et al. (2007); however, terrain condition significantly determined the main direction of urban expansion (Figure 3), and thus had an apparent impact on the city shape and sprawl pattern, as indicated by the compactness of the mountain cities that was generally very low (Figure 4). Similar results were also obtained by previous studies (Pan et al., 2015; Wang et al., 2005) that the compactness of the cities in plain areas of northern China was higher than that of the cities in southern China, as they are often restricted by the surrounding hills or rivers and lakes. For some cities such as Lanzhou, the urban development could be strongly restricted by the surrounding mountains, as the urban land increased by only 28 km2 during 2000-2015.
For all cities in China, population and GDP growth were acknowledged as the main driving factors (Tan et al., 2003; Zhang et al., 2011). As for mountain cities, except policy and changes to administrative divisions, urban population growth, GDP growth and urban road construction were identified as the major driving factors of the urban land expansion from 1990 to 2015, and fixed asset investment made a great contribution to the urban land expansion in recent 5 years of 2010-2015. Other factors were not found to have a significant relevance to the urban land expansion in the mountain cities. It should be noted that the interpreted urban land only covered the built-up areas in the city districts, while the socio-economic data were collected for the whole city. Therefore, the space extent for the data may not be exactly matched. The urban population was all non-agricultural population as registered in the city, not including the floating population, which could cause bias errors on the results, particularly for per capita urban land area.

6 Conclusions

The study results indicate that most of mountain cities maintained a quick growth during 1990-2015, and after 2000 the urban expansion was markedly accelerated. Five factors identified in this study stimulated this quick growth, including policy, adjustment of administration devisions, urban population and GDP growth, and urban road construction. Terrain conditions were not found to have a significant influence on the urban land expansion rate of mountain cities, but had a great impact on the city shape and compactness. Due to terrain restriction, the mountain cities presented a stronger tendency to more efficiently use the urban space than to expand the area, thus showed higher urban land use efficiency than cities in plain areas.
During 1990-2015, total built-up land area of the mountain cities increased by 3.87 folds. However, this quick urban land growth could be reasonable for the mountain cities as a whole, as the urban land area per capita was still within the government control target. Considering their important role in absorbing the rural population and promoting the regional development, appreciate financial supports and preferential policies should be adopted to enhance the development of mountain cities. As these cities are mostly surrounded by mountains, the urban development should be aimed at building an ecological and livable city, instead of damaging the mountain landscape and natural ecosystems.

The authors have declared that no competing interests exist.

1
An Qian, Li Xiaojian, Lv Kewen, 2012. A research on the spatial structure and efficiency of China's expansion of urban built-up area (1990-2009).Economic Geography, 32(6): 37-45. (in Chinese)We select the data of China's 260 cities from 1990 to 2009;analyze the characteristics,the spatial structure and evolution of urban expansion based on rank-size law,the index of and GIS.Then we introduce an index of to evaluate the efficiency of urban expansion.The research results are as follows:(1) Urban expansion has obvious stage characteristics,mainly due to the adjustment of national urban strategy.Urban development trend after 2000 is not balanced and urban system has turbulent changes.(2) The trend that urban built-up areas are getting larger is more significant.Urban type is promoted to a higher level.City regional spatial distribution is extremely uneven.The regional differences of the city situated lead to urban sprawl,thus the city status also changes.(3) The urban growth rate of all regions was significantly different.The provincial capital city expansion is slow at first but fast at last.The urban expansion of many cities formed a regional group.Urban rapid expansion mismatches with the urban population growth.The overall urban rapid expansion should be slowed down.(4) The efficiency of urban expansion is very different at different stages.The level of expansion efficiency pointed out that the urban built-up expansion in different city should choose appropriate development path,and develop appropriate policies and measures.

2
Barcena Mj, Menendez P, Palacios Mbet al., 2014. Alleviating the effect of collinearity in geographically weighted regression.Journal of Geographical Systems, 16(4): 441-466.Geographically weighted regression (GWR) is a popular technique to deal with spatially varying relationships between a response variable and predictors. Problems, however, have been pointed out (see Wheeler and Tiefelsdorf in J Geogr Syst 7(2):161 187, 2005 ), which appear to be related to locally poor designs, with severe impact on the estimation of coefficients. Different remedies have been proposed. We propose two regularization methods. The first one is generalized ridge regression, which can also be seen as an empirical Bayes method. We show that it can be implemented using ordinary GWR software with an appropriate choice of the weights. The second one augments the local sample as needed while running GWR. We illustrate both methods along with ordinary GWR on an example of housing prices in the city of Bilbao (Spain) and using simulations.

DOI

3
Cao Yingui, Bai Zhongke, Zhou Weiet al., 2016. Analyses of traits and driving forces on urban land expansion in a typical coal-resource-based city in a loess area. Environmental Earth Sciences, 75(119116).The development of coal-resource-based cities is cyclical and presents different traits affected by different socio-economic driving forces in each stage. In this paper, we study urban land expansion

DOI

4
Cartier Carolyn, 2016. A political economy of rank: The territorial administrative hierarchy and leadership mobility in urban China.Journal of Contemporary China, 25(100): 529-546.08 2016 Taylor & Francis The level or rank of an administrative division (行区等级 or 政区级别) in China—a structural condition of the sub-national territorial administrative system—is a correlate of administrative rank (行政级别). State reterritorialization of the administrative divisions (行政区划), through establishment and expansion of hundreds of cities, introduces a political economy of differentiation and change by which city governments take the measure of their administrative reach and economic capacity. How do changes to the administrative divisions involve administrative rank, economic status and territorial governing power? In Suzhou, a prefecture-level city, incommensurability between the economic status of the city and its administrative rank reveals how ‘unfair’ rank in the administrative hierarchy becomes implicated in negotiations over territorial adjustments and cadre appointments, leading to creative forms of rank adjustment. Dynamics of the administrative divisions reflect rank consciousness, influence official positions and structure urban transformation in contemporary China.

DOI

5
Chen Jianglong, Gao Jinlong, Chen Wen, 2016. Urban land expansion and the transitional mechanisms in Nanjing, China.Habitat International, 53: 274-283.61Spatiotemporal patterns of urban land expansion is investigated from 1985 to 2013.61Landscape pattern change along four urban-rural gradients is detected.61Driving mechanisms is analyzed at the county level from 1996 to 2013.61Transitional framework helps better understand the rapid urban growth in China.

DOI

6
Chen Wei, 2001. Discrimination of the concept of our country's mountainous city.Huazhong Architecture, 19(3): 55-58. (in Chinese)AS for the study of construction of mountainous cities we should the understand the concept of mountainous city. At the angle of people's living environments, this thesis induces the connotation features of mountainous of cities from three aspects. And on the basis of this point, the theis probes into the distribution features of our country's mountainous cities and the present developmental conditions of mountainous cities in southwestern districts. This thesis aims at making certain basis for further analyzing and studying the developmental problems of our country's mountainous cities.

7
Chi Wenfeng, Shi Wenjiao, Kuang Wenhui, 2015. Spatio-temporal characteristics of intra-urban land cover in the cities of China and USA from 1978 to 2010.Journal of Geographical Sciences, 25(1): 3-18.Urban land cover has major impacts on a city ecosystem services and the inherent quality of its urban residential environment. The spatio-temporal distribution of impervious surface area and green areas in Chinese cities has exhibited a significantly marked difference in comparison with USA cities. This study focused on monitoring and comparing the spatio-temporal dynamics, land cover patterns and characteristics of functional regions in six Chinese ( n =3) and USA ( n =3) cities. The study data were collated from Landsat TM/MSS imagery during the period 1978 2010. Results indicate that Chinese cities have developed compactly over the past three decades, while development has been notably dispersed among USA cities. Mean vegetation coverage in USA cities is approximately 2.2 times that found amongst Chinese urban agglomerations. Land use types within Chinese cities are significantly more complex, with a higher density of impervious surface area. Conversely, the central business district (CBD) and residential areas within USA cities were comprised of a lower proportion of impervious surface area and a higher proportion of green land. Results may be used to contribute to future urban planning and administration efforts in both China and the USA.

DOI

8
Guo Liying, Hu Yecui, 2005. Integrated utilization models of land resources of the mountainous type city in southeast coastal areas.Journal of Mountain Science, 23(1): 121-125. (in Chinese)The southeast coastal area of China has played a more and more important role in promoting China's economy and its ability of international competition since the reforming and opening up. Land resources make remarkable contribution to the development of economy in southeast coastal area. Simultaneously, the pattern of land cover in this area is markedly changed and the quality of regional environment is deteriorated rapidly due to the intensive exploitation of land resources, especially the unreasonable land use under the objective guide of economic development. So southeast coastal area is particularly becoming man-made fragile ecosystem in recent years. Taking the Yueqing of Wenzhou city as an example, based on the analysis of features and problems of land use change in this region, it has been put out that the utilization potential of land resources is to rest with the integrated resource advantage including mountain, plain and sea area. The authors have given some suggestions that the systemic design and zoned layout of land resources exploration facing up to the regional land resource system of mountain-plain-sea area must be concerned and enhanced in order to realize the regional optimal allocation and sustainable use of land resources, to create an assurable environment of land furnish for planning as a whole of harmony development between urban and village region in southeast coastal area.

9
Huang Guangyu, 2006. Theory of Mountain Urbanology. Beijing: China Building Industry Press. (in Chinese)

10
Huang Jikun, Zhu Lifen, Deng Xiangzheng, 2007. Regional differences and influencing factors of urbanland expansion in China.Science in China (Ser. D: Earth Sciences), 37(9): 97-103. (in Chinese)

11
Huang Xiangmei, Hong Shiqin, 2012. The effects of governments applying on distribution of city sizes.Journal of Lanzhou Commercial College, 28(1): 49-57. (in Chinese)At present,China's urban cities are characterized with a quite low average size,high concentration within regions,big regional differences in concentration,etc..Government is the dominant force for urbanization,so it has a significant impact on the distribution of urban's scale.This paper derives an urban concentration equation from Individual utility function.Based On the function,we empirically analyze impacts exerted by governments on city-size distribution from 2000 to 2009.The main conclusions are(1) central government constrain concentration while local governments promote it;(2)there is bilateral causality between local governments and cities concentration;(3)loosing regulations make an increase in primary ration,and city size is more concentrated.To achieve a desired urban development,we propose to change governments' incentives,foster market mechanisms,and utilize kinds of measures including industry,trade,transportation to adjust the imbalance of China's city-size distribution.

12
Li Cheng, Zhao Jie, Xu Yong, 2017. Examining spatiotemporally varying effects of urban expansion and the underlying driving factors.Sustainable Cities and Society, 28: 307-320.In the context of rapid urbanization, the comprehensive analysis of urbanization process, urban expansion effects and the underlying driving factors have become increasingly crucial for providing support to the land management and urban planning decision. This study explores spatial metrics, geographically weighted regression (GWR), and cellular automata (CA) model, with a case study in Xuzhou city, China, to analyze the urbanization process. Spatial metrics were applied for quantifying the urban spatial patterns. The spatiotemporally varying effects of urban expansion on spatial patterns were further investigated using GWR. By involving natural and socioeconomic variables, CA model was applied to examine the relationship between driving factors and urban expansion. The results indicate that the spatial patterns of Xuzhou have significantly changed along with the urbanization process. The parameters obtained from GWR imply that the effects of urban expansion on spatial patterns are spatiotemporally varying. CA model helps in better understanding the effects of the considered factors on urban expansion by reproducing historical urban expansion process. The findings provide an effective way to better understand the urbanization process, and to aid the decision making for urban land management.

DOI

13
Li Hui, Wang Li, Ren Qilonget al., 2016. Urban land expansion characteristics and driving factors in northeast China.Geospatial Information, 4(14): 84-89. (in Chinese)Selecting the 37 prefecture-level Cities in Northeast China as research samples, using built-up area of urban land size to represent the city area, combined rank-size rule and fractal theory to analyze overall trends of urban land in Northeast China the past 20 years' expansion, we calculated the magnitude of urban land expansion index(UEI) to analyze the urban land expansion different degree. The results show that the overall balance of urban land size is decreased, the disparity continues to widen, and the urban system is simple. Urban land expansion rate presented Megacity Medium Cities Small Cities Cities. Terrain conditions, the distribution of resources, economic development, transportation construction and government policies are the main driving forces of urban land expansion in Northeast China.

14
Li Mingcai, Guo Jun, Xiong Mingmin, 2011. Expansion characteristics and its driving forces of built-up area in Tianjin based on remote sensing and GIS.Chinese Journal of Ecology, 30(7): 1521-1528. (in Chinese)Spatiotemporal expansion of urban area is an important indicator for characterizing urbanization level.In this paper,the information of recent 20 years land use change in the six districts of Tianjin central urban area and four districts around the urban area was extracted by integrating four TM/ETM images from 1987 to 2006,and,combining with socio-economic statistic data and applying GIS spatial analyses and spatial gravity center transfer model,the expansion process,orientation,and driving forces of Tianjin built-up area were analyzed.In 2006,up to 82.0% of construction lands were in the central urban area of Tianjin,and near 24.9% were in the four districts around the urban area.From 1987 to 2006,the built-up area showed a large expansion,with the construction lands increased by 19.1%,and the period 2001-2006 was most evident in built-up area expansion.The increase of construction lands was dominantly from agricultural lands and water area.In recent 20 years,the expansion of Tianjin built-up area was mainly in an export-oriented way,with the six districts in central urban area as the center and an overall southeastward transfer of gravity center.Economic development,especially the rapid growth of GDP and the adjustment of industrial structure,was the most important factor controlling the expansion of the built-up area in recent 20 years.Transportation infrastructure improvement was the impetus for the built-up area expansion and partly affected the expansion orientation,population increase as a result of economy development also accelerated the expansion of the built-up area,and macroscopic policies,in a large degree,determined the expansion pattern and scale of Tianjin City.

DOI

15
Lin Xueqin, Wang Yang, Wang Shaojianet al., 2015. Spatial differences and driving forces of land urbanization in China.Journal of Geographical Sciences, 25(5): 545-558.Land urbanization plays an important supporting and restriction role in the rapid and sustainable development of urbanization in China, and it shows distinctive spatial heterogeneity. Applying urban area as the basic research unit and urban construction land area as the core indicator, this paper establishes the conceptual framework and calculation method for the quantity and rate of land urbanization process. The study evaluates the spatial differentiation pattern of absolute and relative process of land urbanization in 658 cities in China from 2000 to 2010. The spatial distribution of cities with rapid land urbanization process is discussed, and the contribution rate and its spatial heterogeneity of major land use types are examined with the aid of GIS. The main conclusions are as follows: (1) Land urbanization in China shows a clear spatial difference. The greater the city scale, the faster its land urbanization. The cities with rapid land urbanization show a significant pattern of central distribution in coastal regions and a scattered distribution in the inland regions. (2) Over the last 10 years, the average quantity of land urbanization in the 656 cities was 3.82 km 2 , the quantity of land urbanization is differentiated by administrative grade. The average rate of land urbanization was 6.89%, obviously faster than the speed of population urbanization. The rate of land urbanization reveals a pattern of differentiation between coastal and other cities. (3) In the past 10 years, the two primary land use types associated with land urbanization in China are residential and industrial, with a combined contribution rate of 52.49%. The greater the scale of the city, the more significant the driving effect of industrial land. In small- and medium-scale cities of the western and central regions, the growth of residential land is the primary driver of land urbanization, while in coastal urban agglomerations and cities on important communication axes, the growth of industrial land is the main driver. (4) Overall, urban population agglomeration, industrial growth and investment are the three drivers of land urbanization in China, but cities of different scales have different drivers.

DOI

16
Liu Fang, Zhang Zengxiang, Shi Lifenget al., 2016. Urban expansion in China and its spatial-temporal differences over the past four decades.Journal of Geographical Sciences, 26(10): 1477-1496.The urban expansion process in China from the 1970 s to 2013 was retrieved based on remote sensing and GIS technology. With the latest zoning method used as reference, annual expansion area per city, urban expansion type, and fractal dimension index were employed to analyze the Chinese urban expansion characteristics and its spatial difference from the aspects of urban expansion process, influence of urban expansion on land use, and urban spatial morphological evolutions. Results indicate that 1) under the powerful guidance of policies, urban expansion in China went through six different stages, and cities in the eastern region entered the rapid expansion period the earliest, followed by cities in the central, northeastern and western regions; 2) cultivated lands and rural settlements and industrial traffic lands were the important land sources for urban expansion in China; the influence of urban expansion on land use in the eastern region was the strongest, followed by the central, northeastern and western regions; 3) urban spatial morphology tended to be complex and was directly related to the adopted spatial expansion mode. Infilling expansion became the main urban expansion mode in the western region first, then in the central and northeastern regions, and finally in the eastern region. This study establishes the foundation for an in-depth recognition of urban expansion in China and optimization of future urban planning.

DOI

17
Liu Gaoxiang, 2009. Mountain city growing space planning research base on theory of man-land relationship [D]. Chongqing: Chongqing University. (in Chinese)

18
Liu Jiyuan, Kuang Wenhui, Zhang Zengxianget al., 2014. Spatiotemporal characteristics, patterns, and causes of land-use changes in China since the late 1980s.Journal of Geographical Sciences, 24(2): 195-210.Land-use/land-cover changes (LUCCs) have links to both human and nature interactions. China's Land-Use/cover Datasets (CLUDs) were updated regularly at 5-year intervals from the late 1980s to 2010,with standard procedures based on Landsat TM\ETM+ images. A land-use dynamic regionalization method was proposed to analyze major land-use conversions. The spatiotemporal characteristics,differences,and causes of land-use changes at a national scale were then examined. The main findings are summarized as follows. Land-use changes (LUCs) across China indicated a significant variation in spatial and temporal characteristics in the last 20 years (1990-2010). The area of cropland change decreased in the south and increased in the north,but the total area remained almost unchanged. The reclaimed cropland was shifted from the northeast to the northwest. The built-up lands expanded rapidly,were mainly distributed in the east,and gradually spread out to central and western China. Woodland decreased first,and then increased,but desert area was the opposite. Grassland continued decreasing. Different spatial patterns of LUC in China were found between the late 20th century and the early 21st century. The original 13 LUC zones were replaced by 15 units with changes of boundaries in some zones. The main spatial characteristics of these changes included (1) an accelerated expansion of built-up land in the Huang-Huai-Hai region,the southeastern coastal areas,the midstream area of the Yangtze River,and the Sichuan Basin;(2) shifted land reclamation in the north from northeast China and eastern Inner Mongolia to the oasis agricultural areas in northwest China;(3) continuous transformation from rain-fed farmlands in northeast China to paddy fields;and (4) effectiveness of the "Grain for Green" project in the southern agricultural-pastoral ecotones of Inner Mongolia,the Loess Plateau,and southwestern mountainous areas. In the last two decades,although climate change in the north affected the change in cropland,policy regulation and economic driving forces were still the primary causes of LUC across China. During the first decade of the 21st century,the anthropogenic factors that drove variations in land-use patterns have shifted the emphasis from one-way land development to both development and conservation.The "dynamic regionalization method" was used to analyze changes in the spatial patterns of zoning boundaries,the internal characteristics of zones,and the growth and decrease of units. The results revealed "the pattern of the change process," namely the process of LUC and regional differences in characteristics at different stages. The growth and decrease of zones during this dynamic LUC zoning,variations in unit boundaries,and the characteristics of change intensities between the former and latter decades were examined. The patterns of alternative transformation between the "pattern" and "process" of land use and the causes for changes in different types and different regions of land use were explored.

DOI

19
Liu Qinping, Yang Yongchun, Fu Dongxiaet al., 2014. Urban spatial expansion based on DMSP_OLS nighttime light data in China in 1992-2010.Scientia Geographica Sinica, 34(2): 4-11. (in Chinese)An existing algorithm based on the statistical data was refined, and a Python implementation of the improved algorithm was programmed to extract the built-up areas of 656 cities in 1992, 2000, and 2010 based on DMSP_OLS nighttime light data. ArcGIS 10 and Visual FoxPro 6.0 were used to analyze the characteristics of the expansion of the cities. This study selected 2 indices, the compactness of urban external spatial morphology(CUESM) and the speed of urban spatial expansion(SUSE), to analyze the spatial expansion of countyand higher-level cities in China from 3 aspects: the sizes of cities(metropolises, large cities, medium-sized cities, and small cities), large regions(eastern, central, western, and northeastern China), and administrative divisions of China(provinces, autonomous regions, and municipalities). The results are as follows. First, during the same year, the values of CUESM were getting smaller with increasing city, and were larger in central and western China than those in the eastern and northeastern China. During the period of 1992-2010, the values of CUESM became slightly smaller in large cities, almost unchanged in small cities, and got larger in the cities of other sizes. The values of CUESM became smaller in the eastern and western China, but they got larger in the central and northeastern China from 1992 to 2010. Secondly, during the same period, SUSE increased with urban size. From 1992 to 2010, SUSE was high in the eastern China, low in the central and western China, and the lowest in the northeastern China. SUSE was high in Beijing, Chongqing, Shanghai, and Tianjin, low in Guangdong, Jiangsu, Shandong, Zhejiang, and Fujian, and the lowest in the rest of the provinces in China. From 1992 to 2010, SUSE accelerated in all sizes, regions and provinces.

20
Luo Zhendong, Wang Xin, Geng Lei, 2015. Administrative division adjustment in metropolitan area of China: Stages and characteristics in the acceleration period of urbanization.Planning Studies, 35(2): 44-49, 64. (in Chinese)

21
Marshall Juliand, 2007. Urban land area and population growth: A new scaling relationship for metropolitan expansion.Urban Studies, 44(10): 1889-1904.

DOI

22
Ministry of Housing and Urban-Rural Development of the People's Republic of China (MOHURD), 2016. Urban and Rural Construction Statistics Bulletin of 2015. [viewed 1 October 2017]. Available from: . (in Chinese)

23
Ministry of Land and Resources of the People's Republic of China (MLR), 2011. The MLR plans to strengthen the use of low-slope hilly Land and mountain land. [viewed 1 October 2017]. Available from: . (in Chinese)

24
Ministry of Land and Resources of the People's Republic of China (MLR), 2014. Notice on strengthening and managing the strictest farmland protection system. [viewed 1 October 2017]. Available from: . (in Chinese)

25
Mizutani Chiaki, 2012. Construction of an analytical framework for polygon-based land use transition analyses.Computers Environment and Urban Systems, 36(3): 270-280.Polygon representation is important for characterizing land uses and the relationships among them. This study aims to establish an analytical framework for polygon-based land use transitions to understand the processes of change regarding types of land uses and their shapes. The polygon event and polygon state help to reveal continuity both spatially and temporally. A polygon event represents a combination of changes in both the type of land use and its shape through a transition process. A polygon state reflects homogeneity during the transition process. Two indices, the stability index and the compactness, were used to enhance the understanding of the transition process. The stability index evaluates the succession of an attribute, while compactness recognizes the geometrical characteristics of a polygon. A case study on Tsukuba City, Japan, was evaluated to demonstrate the feasibility of the approach that is presented here. The proposed analytical framework supports the clarification of land use transition patterns and is effective in explaining the spatiotemporal land use transition process.

DOI

26
Obeso Muniz Icaro, Fernandez Garcia Felipe, 2017. Recent urban development in Gijon (Spain). Historic aerial photography as a tool for sustainability assessment of the process.Cities, 67: 1-8.

DOI

27
Pan Jinghu, Dai Weili, 2015. Spatial-temporal characteristics in urban morphology of major cities in China during 1990-2010.Economic Geography, 35(1): 44-52. (in Chinese)In this paper, a total of 62 major cities in Chinese mainland are selected as the research object. By constructing SVBI index, central built-up areas are extracted from multi-temporal Landsat TM/ETM+ remote sensing satellite imagery with the help of Arc GIS and Erdas software. Spatial-temporal characteristics of urban spatial morphologic evolution from1990 to 2010 are analyzed by using the index of expanding area, expansion rate, compactness indices, Boyce-Clark shape indices, fractal dimension, trend analysis and so on. The results show that expansion speed of Chinese major cities is proportional to those of urban level. Expansion speed of the eastern cities is higher than that of the western and central cities during the period from 1990 to 2010. The shape of the 62 cities tended to be stable, mostly in between the square and the rectangle. Overall, urban spatial compactness is increased, and the fractal dimension is declined. Major way of urban morphology evolution of Chinese major cities is the intension-type development instead of extensive transit during the period of 1990-2010. Out of 62 cities, 39 cities show an unreasonable speed at urban land expand. H-shape or starshape is the best urban morphology in eliminating air pollution. The factors influencing the urban morphology evolution of Chinese major cities include urbanization, traffic location, new-style spatial elements and government regulation.

28
Tan M H, Li X B, Xie Het al., 2005. Urban land expansion and arable land loss in China: A case study of Beijing-Tianjin-Hebei region.Land Use Policy, 22(3): 187-196.With significant economic development in the last decade in China, urban land has increasingly expanded and encroached upon arable land in the last decade. Although many papers have analyzed the characteristics of urban land expansion, relatively less attention has been paid to examining the different expansion features of different-tier cities at a regional level. This paper analyzes the spatio-temporal differences of urban land expansion and arable land loss among different-tier cities of the BTH (Beijing ianjin ebei) region in China in the 1990s, and identifies social, economic, political and spatial factors that led to these differences. Based on urban land change data determined by interpreting Landsat Thematic Mapper (TM) imagery, it was found that the urban land area in the BTH region expanded by 71% between 1990 and 2000. Different-tier cites, however, had enormous differences in urban development, such as speed of urban land expansion, speed of urban land per capita growth, and so on. These differences were closely related to rapid economic development, strict household registration systems, urban development guidelines ( chengshi fazhan fangzhen), and national land use policies. Of all the new urban land, about 74% was converted from arable land, and there was a general tendency for smaller cities to have higher percentages. One of the important reasons for this result is that urban land is highly correlated with arable land in spatial distribution.

DOI

29
Tan Minghong, 2017. Uneven growth of urban clusters in megaregions and its policy implications for new urbanization in China.Land Use Policy, 66: 72-79.

DOI

30
Tan Minghong, Li Xiubin, 2010. Characteristics of urban land per capita of major countries in the world and its implications for China.Journal of Natural Resources, 25(11): 1813-1822. (in Chinese)The urban land per capita always inspires researchers working in the fields of urban planning,geography and urban/regional planning,because it is a basic parameter for urban planning and land use planning.In 1991,the standard of urban land per capita came into operation,which has become one of the important indexes for judging whether urban planning is reasonable at the different levels in China.However,after the rapid urbanization and economic development of 20 years,can the standard still meet the increasing demand of urban land in this country? In response to the question,this study discusses the differences of urban land per capita for 80 countries with the largest population in the world,using the data from the Demograhia website,FAO and World Bank,etc.Furthermore,the factors causing the differences are examined,using the cross-sectional data of these countries.The results show that urban land per capita has a positive relationship with land resources per capita and GDP per capita.And the latter has more influence on the differences than the former.In addition,the percentage of arable land and permanent crop land to the total land also has a relationship with urban land per capita.In China,urban land per capita will increase with economic development and might approach 165 m2 in 2020,which is higher than that of the present level(155 m2) and much higher than the upper limit of the standard of urban land per capita(120 m2).

DOI

31
Tan Minghong, Li Xiubin, Lu Changhe, 2003. An analysis of driving forces of urban land expansion in China.Economic Geography, 23(5): 635-639. (in Chinese)This paper analyzes the processes of urban expansion and quantifies its relationship with economic development and population growth during the last 15 years in China, using partial correlation and regression approaches. The results show that the total urban land areas are linearly increased in the last 15 years, and highly related to the growth of GDP and urban population of the whole country, and land requirement for the improvement of urban environment. The more detailed results include that: firstly, during the last 15 years, the land areas of urban built - up area annually go up in the speed of about 850km2; secondly, in the case of controlling for variable of ln( GDP) , the partial correlation coefficient between the areas of urban built - up area and urban population is only 0,0197; on the contrary, in the case of controlling for variable of urban population, the partial correlation coefficient between the land area of urban built - up areas and In( GDP) is 0.6335. So, development of economy can better explain the expansion of urban land use than urban population; thirdly, the economy development is the strongest driving force on the urban land expansion, it can not only directly drive the expansion of urban land use, but also indirectly affect it through urban population and urban environment.

32
Tong Luyi, Hu Shougeng, 2016. Characterizations of urban sprawl in major Chinese cities.Resources science, 38(1): 50-61. (in Chinese)Synthetic multi-scale expansion measurements are essential to identifying inherent urban sprawl driving forces and dynamic principles,approaching effective national urban sprawl control,and facilitating neo- urbanization and ecological civilization construction in China.We characterized urban sprawl from 2000 to 2012 in 216 major cities in China using degree- offreedom,degree- of- sprawl and conceptual degree- of- goodness metrics.We found that despite overall compact urbanization sprawl observed in China,the relatively low- quality urban growth contributed by the expansion under uncontrolled modes was still scared.This showed different characteristics of urban sprawl at varied scales;specifically,the major sites for sprawl in eastern and central China with high degree-of-freedom and degree-of-sprawl values,which were mixed in different areas,obtained less comfortable expansion.Relatively low- quality expansion processes were observed in Guangdong,Hebei,Shandong,Henan and Anhui,while autonomous and western regions experienced more amicable urban growth.Although general compact growth patterns were generated in metropolitan areas,they were less coordinated,i.e.,high heterogeneous expansion in space and low- quality urban growth in some local parts from a conceptual perspective.It is predicated that inland and metropolitan districts will be major sites where urban land will be developed in coming decades.At the city scale,Guangzhou,Shijiazhuang,Ji'nan,Hefei and Xiangtan have lower degree- of- goodness values for urban sprawl.Initiatives to achieve hierarchical(national,regional,and local city levels)urban sprawl monitoring and management frameworks are vital tasks for integrated and balanced urban land development in time and space,high quality urbanization patterns,and sustainable urban development in China.

DOI

33
Wang Chenglong, Liu Hui, Zhang Mengtian, 2016. The influence of administrative boundary on the spatialexpansion of urban land:A case study of Beijing-Tianjin-Hebei urban agglomeration.Geographical Research, 35(1): 173-182. (in Chinese)As the static and abstract geographic elements, its is a puzzle that how administrative boundaries affect the process of the urban land expansion. Based on the empirical research of Beijing- Tianjin- Hebei urban agglomeration and evolution theory of the regional spatial structure, we build the model of administrative border effects on the urban land expansion of different development periods of China's urban agglomerations. According to the developed model, we divide the process of urban land expansion into four phases, namely, the invisible stage, the dissimilation stage, the persuation stage and the disappearing stage. Different phases have different characteristics. In the first stage, the spatial distribution of urban land is in the low level state of equilibrium; After that, the urban land in growth pole areas expands rapidly in the dissimilation stage. Then, urban land in cities around growth pole become the rapid expansion areas in the third stage. In the disappearing stage, the border only plays a crucial role in the symbol of different administrative divisions, and cities in the urban agglomerations become a comprehensive organism. Then the research of the spatial characteristics and dynamic mechanism of urban land expansion of the urban agglomeration is carried out in our study. We introduce the conditional convergence analysis and the regression equation into measuring the border effect of the urban land expansion measurements in the case of BeijingTianjin-Hebei urban agglomeration. According to the administrative level of different cities, the boundaries are divided into class A, class B, class C and class D. Border effect is measured in different time scales, including 20 years, 10 years and 5 years. It shows that: the greater the administrative level gap between two cities, the larger the border effect, and so there is the scale gap of the urban land expansion between two cities; the influence of border effect on urban land expansion is a long process, the longer it takes, the more significant the border effect is. The research will contribute to the theoretical support and policy recommendations in breaking the restriction of boundaries, delimiting the city development boundary and realizing the rational expansion of urban land.

34
Wang Jun, Zhao Min, Li Xinyang, 2012. Disscussion on ideas concerning formation of new planning standard of development land in China.City Planning Review, 36(4): 54-60. (in Chinese)

35
Wang Xinsheng, Liu Jiyuan, Zhuang Dafanget al., 2005. Spatial-temporal changes of urban spatial morphology in China.Acta Geographica Sinica, 60(3): 42-50. (in Chinese)Fractal dimensions, compact ratios, shape indices and types of urban l and expansion of 31 Chinese cities in 1990 and 2000 were computed by using dynam ic land-use data from the National Resources and Environmental Database establis hed by the IGSNRR, CAS. The results show, during the period from 1990 to 2000, t hat the type of urban land expansion belongs mostly to the 'extension' types and the cities with the 'filling' land expansion are almost located in the flat reg ions. Generally, fractal dimensions of 31 Chinese cities were inclined to reduce and fractal dimensions of the southern cities are more than those of the northe rn cities, compact ratios of most of the cities increased, urban shape indices o f most of the cities decreased, during the period from 1990 to 2000. In all the 31 cities, the changes in the planar configurations of Guangzhou, Nanchang, Jina n, Chengdu, Beijing and Shanghai are the greatest, while the changes of Lanzhou, Taiyuan and Tangshan's configurations are the least. Such a simple rule is reve aled that the fractal dimensions would reduce, compact ratio would increase and shape index would decrease if the type of urban land expansion belongs to the 'f illing' type and vice versa.

36
Wen Qingke, Zhang Zengxiang, Shi Lifenget al., 2016. Extraction of basic trends of urban expansion in China over past 40 years from satellite images.Chinese Geographical Science, 26(2): 129-142.If urban sprawl is to be avoided in China in the next ten years, it is not only crucial to understand the overall history, current status, and future trends of urban expansion there, but also these differences, and this is presently lacking. In this study, remotely sensed images with approximately 30 m spatial resolution were used to quantitatively assess the spatial and temporal patterns of urban expansion of 60 Chinese cities (1973 2013). Urban-expansion-process curves of the cities studied were drawn using annual expansion area as an indicator. Curve similarity analysis generated four basic process modes of urban expansion in China. These included cities that: 1) peaked around 2004 and then decelerated; 2) peaked around 2010 and then decelerated; 3) showed sustained acceleration, and 4) showed continued deceleration. Four basic process modes represented cities under different levels of development stage. Geographic location was found to be the most related characteristic to urban expansion process. Regional development policies at the national level in each region also showed highly temporal consistency with fluctuation characteristics of urban expansion process. Urban characteristic such as population size and administrative level were not found to be significantly related to urban expansion-process modes. Understanding the basic process-mode categories well is extremely important for future regional-balance planning and development of macroeconomic policies.

DOI

37
Yang Yanzhao, Feng Zhiming, Zhao Yandeet al., 2013. Coordination between urban land expansion and populationgrowth in China.Geographical Research, 32(9): 1668-1678. (in Chinese)Based on the urban built-up land and population data of 2000 and 2010,this paper establishes the coordination model to evaluate the relationships between urban land expansion and population growth of 657 cities in China in recent decade.The results showed that:(1) the development between urban land expansion and population growth is not synchronous,with a weak degree of coordination.Urban land expansion was the leading mode for the development of Chinese cities,with 1/3 of all the cities.Population growth ranks second with 1/4 of all the cities.The gap was very large.(2) With regard to spatial distribution,cities with significant land expansion are mainly concentrated in developed eastern China,such as coastal area and cities along the rivers and transportation lines.On the contrary,the distribution center of the cities with significant population growth moved westwards,which are mainly located in the central and western China to the Hu Huanyong Line.(3) From the aspect of the coordination for urban land expansion at different scales and population growth,mega-and big cities were characterized by rapid built-up land expansion with the higher ratio of land expansion,while small and medium-sized cities were featured by rapid population growth with the higher ratio of population growth.(4) With respect to changes scale of city size,the number of small cities increased due to a rapid population growth,whereas the number of big and medium-sized cities increased owing to the rapid land expansion,especially via the promotion of the real estate and constructions of the new cities.

DOI

38
Yu Wenjuan, Zhou Weiqi, 2017. The spatiotemporal pattern of urban expansion in China: A comparison study of three urban megaregions. Remote Sensing, 9(451).Urban megaregions have emerged as a new urbanized form. However, previous studies mostly focused on urban expansion at the city scale, particularly for large cities. Understanding urban expansion at the regional scale including cities having different sizes is important for extending current knowledge of urban growth and its environmental and ecological impacts. Here, we addressed two questions: (1) How do the extent, rate, and morphological model of urban expansion vary at both the regional and city scales? (2) How do factors, such as city size and expansion rate, influence urban expansion models? We focused on the three largest urban megaregions in China, Beijing-Tianjin-Hebei (BTH), Yangtze River Delta (YRD) and Pearl River Delta (PRD). We quantified and compared the spatiotemporal pattern of urban expansion during 2000-2010 at both the regional and city scales based on remote sensing data. We used correlation analysis and linear regressions to address our research questions. We found that (1) the three urban megaregions experienced rapid and massive urban growth, but the spatiotemporal pattern varied greatly. Urban expansion was dominated by edge-expansion in the BTH, edge-expansion and infilling in the YRD, and infilling in the PRD. Cities in the same megaregion tended to have similar expansion morphology; (2) geographical location influenced the model of urban expansion the most, followed by city size and by its expansion rate. Small-sized cities were more likely to develop in a leapfrogging model, while cities with relatively rapid expansion tended to grow in an edge-expansion model.

DOI

39
Yu Xi, Zhang Bingqi, Li Qianget al., 2016. A method characterizing urban expansion based on land cover map at 30 m resolution.Science China-Earth Sciences, 59(9): 1738-1744.Abstract Based on the global land cover data at 30 m resolution (GlobeLand30) in the year 2000 and 2010, the urban expansion process of 320 cities in China was analyzed using lognormal regression, and the expansion model were established. Three metrics were presented for the models, including the peak position, the full width at half maximum, and the skewness. It was found that the three metrics could reveal different patterns of the urban expansion process of cities with different sizes. Specifically, cities with larger size tend to expand outward strongly, and their expansion intensity and influence are likely to be higher. Moreover, most cities 17expansion occurs around the urban core with spatially limited influence. In addition, it was also found that the city expansion intensity is related to the city size. These results showed that the lognormal regression model could describe the distribution of urban expansion with effectiveness and robustness.

DOI

40
Zhang Li, Lei Jun, Li Xuemeiet al., 2011. The features and influencing factors of urban expansion in China during 1997-2007.Progress in Geography, 30(5): 607-614. (in Chinese)China is stepping into the developmental stage of fast urbanization.The important characteristic of ur-banization and rapid development of economy is the sharp expansion of urban build-up area.The demand of ur-ban land is getting larger and larger,however,it is impossible to meet the great demand unlimitedly due to the scarcity of land resources.The difficulty of urban land expansion is getting bigger and bigger,so the process of rapid urbanization is restricted by the shortage of land.The conflict between them becomes more and more seri-ous;as a result,the research on the process of rapid urbanization and the regularity of urban expansion is popu-lar in the academic world at present.This paper selects 222 municipal cities as samples,examines the general trend of urban land expansion from 1997 to 2007 based on rank-size law and fractal theory,and analyzes its diversity at different land scales and in different regions and provinces by calculating UEI(Urban Expansion Index).The results are shown as fol-lows.(1) The total amount of urban lands is keeping increasing in China,and in the case of 222 cities,the scale difference among cities is getting larger,and the general balance is keeping decreasing.(2) The larger the city scale is,the faster the expansion will be.(3) The expansion speed of eastern cities is greater than that of western cities.(4) The eastern coastal cities are developing faster,such as the municipalities directly under the Central Government,and those in Guangdong,Jiangsu,Zhejiang and Fujian.Finally,discussions are made on the mecha-nism of influencing factors from the viewpoint of physical conditions,administrative division adjustment,eco-nomic development and population growth.

DOI

41
Zhang Xiaoran, Bai Zhongke, Fan Xianget al., 2016. Urban expansion process, pattern, and land use response in an urban mining composited zone from 1986 to 2013.Journal of Urban Planning and Development, 142(4): 04016014.

DOI

42
Zhang Xiaotong, 2007. Econometrics. Tianjin: Nankai University Press. (in Chinese)

43
Zhang Yue, Ye Gaobin, Yao Shimou, 2015. The interactive study on new town construction of development zone and urban expansion: Taking Shanghai, Hangzhou and Nanjing as an example.Economic Geography, 35(2): 84-91. (in Chinese)Under the new situation of global economic integration, major cities space has expanded, the nearly half century rapid change is extremely amazing. Just like other major cities in the world, China's urban expansion, especially in the coastal areas of cities or metropolis is facing the same problems as urban expansion and constant urban sprawl.Impetus of the development is caused by the great social change and the economical high-speed growth and the structure transformation after our country- reform and open policy. The social and economic development promote the rapid changes of urban space through the suburbanization, that many urban industrial development zones, economic and technological development zones were established on the edge of city. After reform and opening up, there are hundreds of development zone and new cities that located in the fringes of China's large and medium cities, which have made a significant achievement, a few problems still remain yet, it's distinctly showed in that the population urbanization was false high, land urbanization was too fast, and resources consumed exceedingly. Under the new situation of urbanization in China, this paper aims to explore the relationship between the new town constructions of development zone and urban sprawl, problems caused by megacity expansion, its dynamic mechanism, the change factor as well as the new trend of future development. It has important practical significances and academic values for China's urban planning and the study of urban development.

44
Zhang Zengxiang, Li Na, Wang Xiaoet al., 2016. A comparative study of urban expansion in Beijing, Tianjin and Tangshan from the 1970s to 2013.Remote Sensing, 8(6): 496.

DOI

45
Zhou Guohua, He Yanhua, 2007. The influencing factors of urban land expansion in Changsha.Journal of Geographical Sciences, 17(4): 487-499.This research systematically analyses land-use map of Changsha city in different periods of time. The spatial form and structural evolution was analysed by studying indices such as city land-use structure proportion, expansion intensity, economic flexibility, population flexibility, changing compactness index and so on. The dynamic mechanism of urban land expansion has been discussed by integrating the regional social economy development situation and many aspects such as the physiographical surrounding, population and economic development, traffic infrastructure, planning and regional development tactic and system innovation. The research indicates that the urban land expansion speed and intensity have steadily increased in Changsha from 1949 to 2004. The expansion form has been from a single external expansion to a combination form of external and internal expansion, from a circular or linear continuous form to a blocky or agglomeration shape. Overall, the urban land expansion of Changsha city is a phasic, diversified and complex process. And no matter what the stage is, it is an organic system containing multiple speed, pattern and shape, which are driven by multiple impetuses. The dominant feature at different stages was highlighted because of the balance and fluctuation between different forces, and the existing urban land border and shape have resulted from the joint efforts of these phasic forces.

DOI

46
Zou Jinlang, Wu Qun, 2015. Variance analysis of decoupling population growth from construction land expansion in the cities of China. In: National Land Resources Development and Renovation and New Urbanization Construction Symposium. Anyang: Xinhua Publishing House. (in Chinese)

Outlines

/