研究论文

Coastline and landscape changes in bay areas caused by human activities: A comparative analysis of Xiangshan Bay, China and Tampa Bay, USA

  • LI Jialin , 1, 2 ,
  • LIU Yongchao 1, 3, 4 ,
  • PU Ruiliang 5 ,
  • YUAN Qixiang 6 ,
  • SHI Xiaoli 7 ,
  • GUO Qiandong 5 ,
  • SONG Xiayun 8
Expand
  • 1. Department of Geography & Spatial Information Techniques, Ningbo University, Ningbo 315211, Zhejiang, China;
  • 2. East China Sea Institute of Ningbo University, Ningbo 315211, Zhejiang, China
  • 3. Department of Geographic Information Science, Nanjing University, Nanjing 210023, China
  • 4. Collaborative Innovation Center of South China Sea Studies, Nanjing University, Nanjing 210023, China
  • 5. School of Geosciences, University of South Florida, Tampa, FL 33620, USA
  • 6. Center for Marine Resource Management, Ocean and Fishery Bureau of Xiangshan, Xiangshan 315700, Zhejiang, China
  • 7. Editorial Department of Journal of Ningbo University, Ningbo 315211, Zhejiang, China
  • 8. School of Accountancy, Zhejiang University of Finance and Economics, Hangzhou 310018, China

Author: Li Jialin (1973-), PhD and Professor, specialized in physical geography and coastal geomorphology. E-mail:

Received date: 2017-06-17

  Accepted date: 2017-08-10

  Online published: 2018-08-10

Supported by

NSFC-Zhejiang Joint Fund for the Integration of Industrialization and Informatization, No.U1609203;Natural Science Foundation of Zhejiang Province, No.LY16G030014;The K. C. Wong Magna Fund of Ningbo University and Natural Science Foundation of Ningbo City, No.2017A610300

Copyright

Journal of Geographical Sciences, All Rights Reserved

Abstract

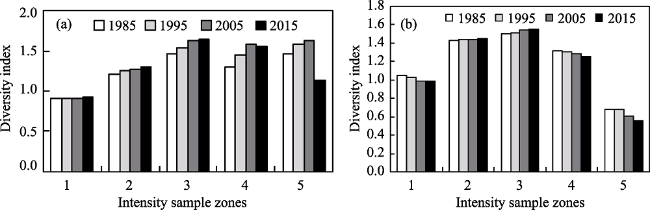
Using multitemporal Landsat TM/OLI images at a 10-year interval, in this study, we (1) extracted information of spatial location, length, and sinuosity of coastline and landscape configuration, diversity and fragmentation in the bay areas of Xiangshan Bay (XB), China and Tampa Bay (TB), USA from 1985 to 2015; (2) constructed indices of artificial coastlines and human disturbance on bay area landscapes; and (3) explored and discussed the impacts of human activities on changes of coastlines and landscape types in the two bay areas. Our analysis results demonstrate the following five points. (1) During the past 30 years, the lengths of natural coastline in XB and TB shrank, while the lengths of their artificial coastline increased first and then maintained stable. Since there were different influences of human activities on coastlines and landscape types between the two bay areas, XB experienced dramatic changes in parts of coastline geomorphologies and continuous decrease of coastline sinuosity, while, in TB, there was a little change in coastline geomorphologies and its coastline sinuosity was almost unchanged. (2) The intensity of human activities in XB was continuously enhanced from 1985 to 1995, and then the degree of enhancement had slowed down after 1995. However, in the time period, the impacted extent of human activities gradually increased and finally covered almost entire coastlines in XB. In TB area, although the intensity of human activities was enhanced, the degree of enhancement slowed down from 1985 to 2015 and the impacted areas of human activates were concentrated in several coastal city areas. (3) The average area of landscape patches strongly disturbed by human activities in both XB and TB generally showed a trend of decreasing from 1985 to 2005. However, during the period of 2005 to 2015, the average patch area of landscapes disturbed by different degrees of human activities in XB changed differently, while in TB it almost did not change. (4) From 1985 to 2005, the indices of landscape diversity in various areas of human disturbance in XB gradually increased, while in TB, changes in indices of the landscape diversity varied. From 2005 to 2015, the changes in the intensity of human disturbance in both bay areas were from weak to strong, whereas the indices of landscape diversity in XB and TB increased first and then decreased. (5) The landscape fragmentation index in different human disturbance areas in both XB and TB gradually increased from 1985 to 2005, while from 2005 to 2015, in both bay areas, the landscape fragmentation index presented a decreasing trend.

Cite this article

LI Jialin , LIU Yongchao , PU Ruiliang , YUAN Qixiang , SHI Xiaoli , GUO Qiandong , SONG Xiayun . Coastline and landscape changes in bay areas caused by human activities: A comparative analysis of Xiangshan Bay, China and Tampa Bay, USA[J]. Journal of Geographical Sciences, 2018 , 28(8) : 1127 -1151 . DOI: 10.1007/s11442-018-1546-1

1 Introduction

With socio-economic development and depletion of land resources, exploitation of coastal and marine resources has become a strategic choice of coastal states and regions (Xu et al., 2015b). Bay area becomes a frontier and a hotspot of coastal zone exploitation. Surface processes and eco-environmental evolution in the bay area have been severely challenged by human activities. Relying on increasing accessibility of research data supported by 3S technologies, shortage of resources and other environmental issues caused by human activities in coastal zones have gradually become a major concern of scholars and government administrators in the world (Wu et al., 2012).
Factors influencing these changes include types of shorelines (e.g., rocky, sandy), wave activity, tidal variations, storms and human impacts (Kannan et al., 2016). Human’s utilization of the coastlines with different intensity levels will directly impact the evolution of coastline (Tirkey et al., 2005; Paterson et al., 2014). The evolution process of a resource-environment system of coastline can be revealed through coastline change analysis (Xu et al., 2013; Li et al., 2014; Ghosh et al., 2015). Information on dynamic changes of coastline is usually obtained by using spectral analysis of remote sensing imagery (Chu et al., 2013; Sun et al., 2011; Lantuit et al., 2008), human-computer interactive interpretation (Yao et al., 2013; Xu et al., 2017), multispectral classification (Blodget et al., 1991), threshold value segmentation (Zhu et al., 2013), cluster-based segmentation (Burningham and French, 2017) and wavelet transform (Fan et al., 2002), etc. The research areas mainly involve mud coast (Ryu et al., 2014), island coast (Ghosh et al., 2015), estuarine coast (White et al., 1999) and coastal administrative elements (Xu et al., 2015a). Spatial statistical analysis (Guo et al., 2009), landscape pattern index analysis (Verbutg et al., 2002) and landscape simulation based on cellular automata (Qin et al., 2007), etc. were generally used to explore the evolution of resource-environment system of coastal landscapes. Research based on a large-scale temporal/spatial analysis is popular abroad (e.g., Solon et al., 2009; Olsen et al., 2007; Tzanopoulos et al., 2011; Tian et al., 2002), whereas a medium- and a small-scale analysis is a major direction in China (e.g., Parcerisas et al., 2012). Currently, studies on bay areas focus on the impacts of human activity on sedimentary dynamics of tidal inlets (Zhang et al., 1995), tidal current in a bay mouth (Wan et al., 2014), coastal landform (Li, 1986), area of tidal prism (Ma et al., 2014), and eco-environmental effects (Wang et al., 2007; Lin and Zuo, 2006).
In coastal zones, man-made coastal landforms replace the natural ones, which changes the process and law of evolution of landforms, resulting in changes of material structure and geomorphic characteristics (Li et al., 2017). As an important geomorphic element in a coastal zone, the bay area has its increasingly salient meaning as a state-level strategic vital area, a key area for coastline exploration, and a site for leisure and tourism (Chen et al., 2007). However, only fewer studies on systematic quantitative evaluation of impacts of human activities on changes of coastlines and landscapes of bay areas were found (Wang et al., 2014; Yuan et al., 2015). In particular, comparative research on different regions and states was rarely seen.
China and USA share the same features of rich harbor resources and intensified exploring activities, both with significant anthropogenic impacts on resource-environment systems of bay areas. However, due to different exploration phases residing in and protective measures adopted, there are huge differences between the two countries with respect to the effects of human activities on succession of resource-environment system of bays. Xiangshan Bay, Zhejiang, China and Tampa Bay, Florida, USA share the same climatic feature as transitional zones of tropical and subtropical climate, similar natural conditions for production and life, both with long exploitation history. However, the two regions have distinct features in population scale, socio-economic development level, management mechanism of recreation and leisure industry, and land utilization and exploitation, etc. Hence, in this study, we propose to carry out a comparative analysis on the impacts of contemporary human activities on the Earth surface on the evolution of coastline and landscape resources between the two bay areas, under different strategies of exploitation and utilization, and different protective measures adopted for the two regions. The major purpose is to understand in-depth the process of coastal artificialization and the response to coastline and landscape changes in order to provide a scientific reference for exploiting and utilizing, as well as protecting and planning bay areas in China.

2 Overview of the study areas

Xiangshan Bay (XB) is located in the coastal area in the eastern Zhejiang Province, China, adjacent to Hangzhou Bay in the north and to Sanmen Bay in the south. It neighbors the Zhoushan sea area through the Fudu Channel and the Shuangyumen Channel in the northeast, and connects the Damu Sea by Niubishan Channel in the southeast (Figure 1). Within XB, there are 65 islands and three secondary bays including the Xihu Bay, the Tie Bay and the Huangdun Bay, across Xiangshan, Ninghai, Fenghua, Yinzhou and Beilun counties/districts. XB covers a basin area of 1455 km2, with 392 km coastlines, in which 260 km belong to mainland coastline. The bay belongs to subtropical monsoon region, dominated by low mountainous-hilly terrains, with natural alluvial coast, erosion coast and artificial coast, respectively. It has extensive tidal flats and wetlands, as well as developed aquaculture production and mariculture industry. Since the Qingli period (1041) of the Song Dynasty, a series of engineering projects of seawalls had been constructed, including Dasong seawall in the eighth year of Yongzheng’s reign (1730), Yongcheng seawall in the eighth year of Xianfeng’s reign (1858), and Xianning seawall in the 31st year of Guangxu’s reign (1905) of the Qing Dynasty. Since 1950, seawall constructions of Xize, Tuanjie, Feiyue and Liansheng, etc. have been carried out. By 2015, a total reclaimed area of XB has surpassed 170 km2, which seriously disturbed natural ecological processes of the bay area.
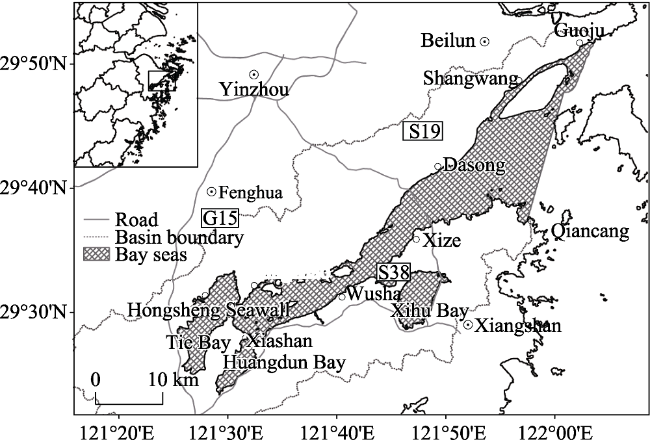
Figure 1 Location of Xiangshan Bay (XB), Zhejiang Province, China
Tampa Bay (TB) is located in the western coast of the middle section of Florida, USA. It neighbors the Gulf of Mexico on the west, with mainland on all other directions. Within the bay, there are two artificial islands, together with four secondary bays, i.e., Hillsborough Bay, Old Tampa Bay, Middle Tampa Bay, and Lower Tampa Bay (Figure 2), covering major areas of Hillsborough, Manatee and Pinellas counties, as well as a small portion of Pasco and Sarasota counties, surrounded by the cities of Tampa, St. Petersburg, and Clearwater. TB watershed covers an area of 5700 km2 and has a long zigzag coastline of 1040 km. Since as early as 5000 to 6000 years ago, indigenous people on the Weedon Island has settled down on the coast of TB. In the late 1800s, TB developed very fast, and as a result, a “Clearwater-St.Petersburg-Tampa” metropolitan region was gradually formed on the Pinellas Peninsula and coastal Hillsborough. Tourism industry highly developed in the bay area. Meanwhile, human activities also posed great impacts and interferences on resource and environment in the TB.
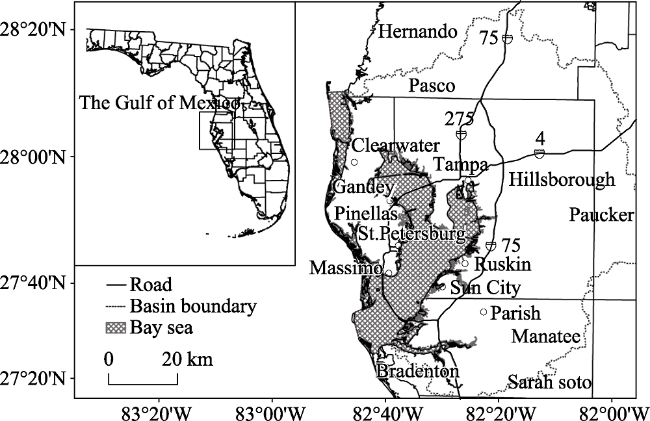
Figure 2 Location of Tampa Bay (TB), Florida, USA
Hence, management activities for bays and estuaries have been implemented in USA since the 1990s. A comprehensive management scheme was also adopted, involving a legal system for exploitation and management of bay areas, a prewarning mechanism to monitor the exploitation intensity, and a management information platform. To do so, sustainable exploitation and maintenance of bay areas have risen to national strategy, and environmental awareness of the general public has been promoted, leading to positive results. In contrast, the exploitation and utilization, as well as protective measures in XB lagged behind compared with those in TB. For example, there is a lack of laws and regulations on exploitation and management of bay areas, an incomplete protection mechanisms, and inadequate theoretical research on coastal and landscape resources, etc., which leads to considerable adverse impact and damage on marine water quality, ecology of intertidal zone, coastline and watershed landscape in XB. Therefore, in order to promote sustainable, coordinated development of ecology, economy and environment in bay areas in China, it is crucially significant to refer to the management experiences of bay areas from USA, and enhance issuance of policies and construction of legal systems concerning sustainable management of bay areas in China.

3 Data and methodology

3.1 Data sources and image pre-processing

Landsat TM/OLI images of watersheds in XB and TB in 1985, 1995, 2005 and 2015 were provided by the United States Geological Survey (USGS) and Geospatial Data Cloud, as the data sources of this research1(1 Official website of United States Geological Survey. Image data can be downloaded at [EB/OL]. http://glovis.usgs.gov/),2(2 Official website of Geospatial Data Cloud. Image data can be downloaded at [EB/OL]. http://datamirror.csdb.cn/). Image pre-processing including waveband combination, geometric correction and alignment, and false color composition was carried out before implementing image mosaicking based on geographic coordinate using Mosaic tools in the Map module of software ENVI4.8. On such a basis, the extent of the study areas was demarcated using a continuous “Watershed-Coast-Ocean” system (Wang et al., 2011). Specifically, Archydro tool embedded in ArcGIS10.2 was used to obtain the boundaries of watersheds in XB and TB, according to D8 algorithm and using ASRTER GDEM V2 digital elevation model with a 30 m horizontal accuracy (Yuan et al., 2014). Finally, with the vector data of watershed and the ocean as a mask, the extractor in the spatial analysis module of ArcGIS10.2 was used to extract raster graphs of remote-sensing images of the four years mentioned above, which led to the images covering the both study areas. In this study, data sources also include a 1:50,000 digital elevation model of XB, vector data of boundary of watershed of TB, 1:50,000 topographic map of XB, 1:50,000 topographic map of TB provided by The University of Texas, USA, Bays in China (The fifth part), as well as historical data of tide at different observation stations and historical monitoring data of marine environment3(3 Official website of Tampa Bay. Water Atlas of Tampa Bay [EB/OL]. http://www.tampabay.wateratlas.usf. edu/digitallibrary/) for TB.

3.2 Research methodology

3.2.1 Classification and extraction of coastlines
According to unique features of coastlines of XB and TB and referring to the planning of basic functions of coastlines in China, the coastlines in the study areas were classified into two types: natural coastline and artificial coastline (Table 1). Boundaries between waters and lands were extracted effectively based on remote-sensing interpretation standards for coastlines of each type (Sun et al., 2011) and using a threshold approach combined with NDVI index (Li et al., 2009). Local corrections of coastlines were done based on interpretation keys of coastlines, associated with tones, textures, spatial patterns and distributions, and the standard false color composite images for coastlines for each type. Finally, spatial location, length and sinuosity of coastlines of each time period were extracted.
Table 1 A summary of coastline classification system in this study
Primary type Secondary type Note
Natural
coastline
Bedrock coastline Land-sea boundary at bedrock coast
Estuary coastline Boundary between estuaries and the sea
Biological coastline Boundary between mangroves and tidal flats/wetlands
Gravel coastline Coastline of sand and gravel beach
Mud coastline Coastline of mud or salty mudflat
Artificial
coastline
Coastline formed by aquaculture Seaside coastline formed by aquaculture establishments on tidal flats and wetlands
Coastline formed by construction Seaside coastline formed by land for urban construction
Coastline formed by protection Coastline formed by wave protection and damp-proof purposes
Coastline formed by recreation and leisure Coastline used for recreation and leisure
Coastline formed by ports and wharfs Coastline formed by construction of ports and wharfs
ArcGIS10.2 was used to randomly select pixels on coastlines from the four years’ images. Points extracted automatically were located on corresponding coastlines. The extraction accuracy could be determined according to the number of points with displacement (Li et al., 2009). Eighty pixels of coastlines were selected from the four years’ images, respectively. Our results show that the extraction accuracy of bedrock coastline, gravel coastline and mud coastline was above 95%; that of aquaculture, construction, recreation and leisure, protection, and wharf was above 90%; and that of mud coastline and estuary coastline was above 80%. Therefore, for this case, our results were fairly reliable.
3.2.2 Indices for coastline changes and intensity levels of coastal artificialization
Spatial analysis to coastlines was carried out to interpret the data of coastlines in bays in the four periods of time. Thus, spatiotemporal changes of coastlines in XB and TB can be monitored. In order to investigate temporal features, spatial patterns and their evolutions of coastline changes in the two bays, length of coastline, sinuosity of coastline, and intensity levels of coastal artificialization were introduced as the evaluation indices (Yuan et al., 2015; Zhao, 2013).
(1) Length of coastline
To reveal the spatiotemporal changes of coastlines in XB and TB, a change rate of length of coastline was used in this study:
V = (Li+1 - Li) / Δt (1)
where Li+1 and Li are the lengths of coastlines of two periods (km), and Δt is the change time of coastline of adjacent times (year).
(2) Sinuosity of coastline
Curvature reflects the degree of unevenness of a geometric body. The greater the curvature, the greater the degree of deflection of a curve. Hence, a curvature can be used to reflect the sinuosity of coastlines in XB and TB.
Discrete points with an interval of 200 m were chosen along coastlines of Guoju-Qiancang section in XB and Massimo-Bradenton section in TB. Since distribution of the discrete points was centralized in some sections, statistical errors would be brought in, which requires screening of the discrete points obtained. A threshold e is selected, assuming A(i) and A(i+1) are the adjacent discrete points, where an initial value of d is defined as a straight line distance between A(i) and A(i+1), and s as a corresponding curve distance of the two points. When s/d>e, the curvature is calculated; when s/de, the next adjacent point is connected to generate a new discrete point series iteratively as above. In the new series, each of the two adjacent points is connected to their midpoint to form a triangle. Then the radius r of the circumscribed triangle can be calculated using the formula for solving circumference of a triangle and Heron’s formula:
$r=\frac{{{l}_{a}}\cdot {{l}_{b}}\cdot {{l}_{c}}}{\sqrt{{{\left( l_{a}^{2}\cdot l_{b}^{2}\cdot l_{c}^{2} \right)}^{2}}-2\left( l_{a}^{4}\cdot l_{b}^{4}\cdot l_{c}^{4} \right)}}$ (2)
where la, lb and lc are the three side lengths of the circumscribed triangle; curvature radius r is approximated to the radius of a curve; and curvature c = 1/r.
(3) Intensity levels of coastal artificialization
The pressure caused human activity on coast of bays can be expressed by the intensity of coastal artificialization. In this study, the model of pressure intensity in physics was used to represent the intensity of coastal artificialization in XB and TB.
$A=\frac{\sum\limits_{i=1}^{n}{{{l}_{i}}\cdot {{p}_{i}}}}{L}$ (3)
where A represents the intensity of coastal artificialization; L represents the total length of coastline in the study area (km); li indicates the length of coastline of the i-th type(km); n indicates the number of types of coastlines; pi indicates the factor of impact on resource-environment of the i-th coastline type (0≤pi<1). p represents the degree of impact of different coast types on the resource and environment. For instance, the p value for natural coast is 0. The greater p is, the more significant adverse impact is posed. Per a reference of monitoring data of stations along the sampling coastlines for resource and water quality survey of the two bays, several sections of artificial coastlines of various types were selected as samples to monitor coastlines. Concrete weight of index layer wij, proposed by Yuan et al. (2015), and results after data range standardization were used to carry out product summation to obtain the impact factor P of human activity on resource and environment of bays. The impact factors calculated consist of p1 (coastline formed by construction), p2 (coastline formed by protection), p3 (coastline formed by aquaculture), p4 (coastline formed by ports and wharfs), and p5 (coastline formed by recreation and leisure) with their corresponding values of 0.84, 0.33, 0.68, 0.48, and 0.46, respectively.
3.2.3 Index of intensity of artificial interference
The change of bay landscapes is affected by a set of natural and artificial factors. However, at a short time scale, human activities interfere and dominate the formation of landscape patterns and processes of the two bays. Hence, an index of intensity of human interference with a landscape (LHAI, Landscape human active interference index) was adopted based on the landscape type and change characteristics. Its calculation formula is as follows:
$LHAI=\frac{\sum\limits_{i=1}^{N}{{{A}_{i}}{{P}_{i}}}}{TA}$ (4)
where LHAI represents the index of intensity of human interference; N represents the number of landscape types, which is 9 in this study; Ai represents the area of the i-th landscape type (km2); pi represents the factor of impact on resource and environment of the i-th landscape type; TA indicates the total area of landscapes (km2). Per referring to advices from experts in the fields of geoscience, ecology, oceanography, and environmental sciences, as well as existing research results on change of landscape resource (Zhou et al., 2011; Lin et al., 2007), the factors of impact on resource and environment of landscapes in XB and TB were determined (Table 2).
Table 2 Impact factors of landscape resources and environments in XB and TB areas
Landscape type Conditions of impact on resource and environment of the landscape Impact factor
Land for
construction
There are significant impacts on landscape resources and eco-environment of bays, some of which are irreversible 0.85
Land for aquaculture and salt field There are considerable impacts on landscape resources and eco-environment of bays, most of which are irreversible 0.65
Land for recreation There are slight impacts on landscape resources and eco-environment of bays, most of which are irreversible 0.55
Unutilized land There are slight impacts on landscape resources and eco-environment of bays, most of which are irreversible 0.48
Cultivated land There are small impacts on landscape resources and eco-environment of bays, some of which are reversible 0.25
Lakes and rivers There are minor impacts on landscape resources and eco-environment of bays, some of which are capable of ecological conservation and regulation 0.10
Forest land There are minor impacts on landscape resources and eco-environment of bays, some of which are capable of ecological conservation and regulation 0.10
Sea area There are minor impacts on landscape resources and eco-environment of bays, some of which are capable of ecological conservation and regulation 0.10
Tidal flats
and wetlands
There are minor impacts on landscape resources and eco-environment of bays, some of which are capable of ecological conservation and regulation 0.10
For this case, the Create Fishnet Toolset in the data management module of ArcGIS10.2 was used to create a 600 m × 600 m grid as the template for the two study areas. Intensity of artificial interference within each grid in the two study areas was calculated and was used as a value of the centroid of each grid. Based on the trend analysis and normality test, the spatiotemporal distributions of intensity of artificial interference with landscapes in the two bays were obtained using Kriging interpolation with a 3D submodule in ArcGIS 10.2.

4 Result and analysis

4.1 Change of length of coastline

As presented in Table 3, with intensified coast exploitation, the proportion of artificial coastlines has been increasing during the past 30 years in both bays. However, since there exist distinct features of land use and harbor management, historical changes of length of coastlines in the two bay areas differed from each other. The length of artificial coastlines in XB grew from 80.24 km in 1985 to 133.07 km in 2015, showing a 52.83 km growth in the 30 years, accounting for yearly rising proportions of the total length of coastlines, from 28.27% in 1985 to 49.08%, 51.08%, and 51.49%, in 1995, 2005, and 2015, respectively. The average rate of length reduction for natural coastlines in XB within the 30 years was 2.61 km•yr-1. In the meantime, the length of artificial coastlines in TB grew from 492.17 km in 1985 to 528.54 km in 2015, showing an increase by only 36.37 km within the 30 years, accounting for yearly slowly rising proportions of the total length of coastlines, from 46.94% in 1985 to 48.19%, 50.37%, and 50.58%, in 1995, 2005, and 2015, respectively. The average rate of length reduction for natural coastlines in TB within the 30 years was only 50.96% of that in XB. It could be seen that the proportions of artificial coastlines exhibited a continuous growth in both bays; but the increasing magnitude of proportion of artificial coastlines in XB was far larger than that in TB. It would be constructive to refer to protection strategies in TB for the exploitation in XB in the aspects of scientific conservation of natural coastlines and control of increase rate of artificial coastlines.
Table 3 Changes in length of various coastline types during different periods in XB and TB from 1985 to 2015 (km)
XB, China TB, USA
Type 1985-
1995
1995-
2005
2005-
2015
Type 1985-
1995
1995-
2005
2005-
2015
Natural coastline Bedrock coastline -46.21 -10.71 -3.83 Bedrock coastline -0.22 0.01 -0.04
Estuary coastline -2.74 1.71 -1.17 Biological
coastline
-14.97 -20.13 -2.54
Gravel coastline 0.14 0.05 0.41 Gravel coastline 0.27 -1.38 0.1
Mud coastline -15.56 -0.4 0.12 Mud coastline 0.68 -1.72 0
Subtotal -64.37 -9.34 -4.48 Subtotal -14.26 -23.21 -2.49
Artificial coastline Coastline formed by aquaculture 35.6 6.8 -5.11 Coastline formed by protection -3.27 -0.85 0.4
Coastline formed by construction 0.09 -0.25 4.24 Coastline formed by construction 7.01 0.92 1.62
Coastline formed by protection 12.13 -6.5 -0.96 Coastline formed by recreation and leisure 2.53 5.54 -0.22
Coastline formed by ports and
wharfs
6.08 1.41 -0.69 Coastline formed by ports and
wharfs
5.64 16.97 0.08
Subtotal 53.91 1.45 -2.53 Subtotal 11.91 22.58 1.88
Total -10.46 -7.89 -7.02 Total -2.34 -0.64 -0.61

Note: “+” means the growth; “-” means the decrease.

Significant transformation of some local sections of coastlines is a direct quantitative indicator to reflect the actual exploitation process and intensity of key sections of bays. The sections in the two bays with significant transformation during the recent 30 years include Guoju-Dasong, Dasong-Tongzhao, Tongzhao-Wusha, and Wusha-Qiancang sections in XB, and Massimo-Gandy, Gandy-Tampa, Tampa-Citrus, and Citrus-Bradenton sections in TB (Figures 3 and 4). With respect to the change of lengths of natural coastlines in XB, a gradual decreasing trend for the four sections from 1985 to 1995 could be seen. Among the four sections, Tongzhao-Wusha section had the largest decreasing magnitude. Slight difference could be observed for the change of coastline sections from 1995 to 2015. In this period, Guoju-Dasong section exhibited a slow decrease, while Dasong-Tongzhao section showed a gradual increase. Tongzhao-Wusha section exhibited an increase of tidal flats and wetlands due to suspension of construction of Hongsheng seawall in the period, so that the shrinkage rate of coastline of the section slowed down as influenced by the growth of the mud coastline, with a change rate of -0.86 km•yr‒1 in coastline length in recent decades. Wusha-Qiancang section exhibited a stable decrease in the length of coastlines. However, a consistent decreasing trend of length of natural coastlines for all sections was observed in TB during the 30 years; among all sections, Massimo-Gandy section presented the lowest decrease magnitude. Gandy-Tampa section showed a decrease of coastline length from 1985 to 2005 due to the construction of reclamation engineering of David peninsula, which tended to be stable at the end of the project. The change of Tampa-Citrus section was flat. Citrus-Bradenton section had a fast transformation from natural coastline to artificial coastline due to the development of Manatee watershed from 1995 to 2005, showing a significant decrease of coastline length in that time period.
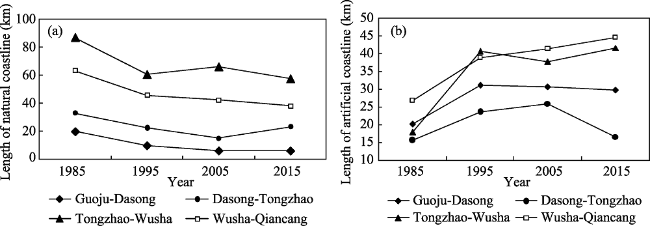
Figure 3 Changes in length of different natural (a) and artificial (b) coastline types in XB from 1985 to 2015
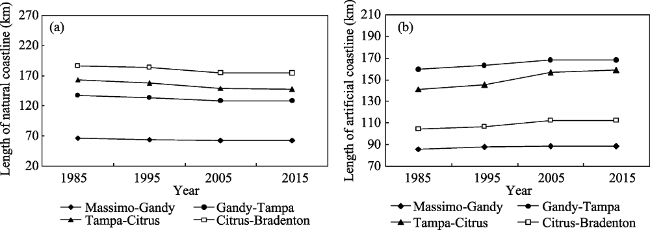
Figure 4 Changes in length of different natural (a) and artificial (b) coastline types in TB from 1985 to 2015
With respect to the change of lengths of artificial coastlines, the four sections of artificial coastlines in XB exhibited a gradual increasing trend from 1985 to 1995; among the four sections, Tongzhao-Wusha section had the highest increase rate. Coastlines of some portions in Guoju-Dasong and Tongzhao-Wusha sections were connected during the period from 1995 to 2005, leading to the shrinkage of length of total coastline, and thus the shrinkage of artificial coastlines. Dasong-Tongzhao section showed a decreasing trend in recent decades, while Guoju-Dasong section remained basically unchangeable. The reason is that while coastlines for aquaculture in Dasong-Tongzhao section decreased, reclamation in Dasong-Yangshashan section was carried out, which increased the proportion of artificial coastlines. With respect to the change of lengths of artificial coastlines in TB, the four sections all exhibited a gradual increase in the recent 30 years; among all sections, Massimo-Gandy section showed a relatively smaller increase rate of 0.24 km•yr‒1. Gandy-Tampa section presented an increase before stabilization; Tampa-Citrus section had the highest change rate compared with the other three sections, especially from 1995 to 2005, reaching 1.18 km•yr‒1. Citrus-Bradenton section had a significant change from natural coastline to artificial coastline due to the establishment of recreation and leisure sites along the Manatee River from 1995 to 2005.

4.2 Variation of sinuosity of coastline

Curvature measures a degree of unevenness of a geometric body. The larger the curvature, the larger the degree of deflection of a curve. Curvature of discrete points selected from the coastlines was used to analyze the sinuosity of coastlines. The change of curvature reflects the degree of exploitation and utilization of coastlines by human beings. In order to reflect the distribution of curvature of coastlines with more accuracy in the two bays, 10 test thresholds were selected in this study, based on the calculation formula for sinuosity mentioned previously, previous experience and comparative experiments. The threshold values (e) were an arithmetic progression starting from 1.005 to 1.050, with a common difference of 0.005. Our experiments showed that, when e approached 1.020 or 1.040, the median value of curvatures of all distributed discrete points could well reflect the change of sinuosity of coastlines in XB and TB in the four periods (Table 4).
Table 4 Changes in sinuosity of different coastline types in different years in XB and TB (10‒3•m‒1)
Time 1985 1995 2005 2015
Bay XB TB XB TB XB TB XB TB
Natural coastline 4.25 7.98 4.18 8.22 4.35 8.18 4.42 8.13
Artificial coastline 3.28 4.32 3.01 4.18 2.86 4.15 2.81 4.03
Entire coastline 3.71 5.23 3.42 5.15 3.25 5.09 3.17 5.07
Figures 5a and 5b provide the changing trends of natural coastlines, artificial coastlines and entire coastlines in XB and TB from 1985 to 2015. It is noticeable that from Figure 5a, sinuosity of coastlines in XB decreased gradually within the last 30 years; the change magnitude of sinuosity of natural coastlines was less than that of artificial coastlines, but the value of sinuosity of the former was still higher than the latter. As seen from the overall trend, the magnitude of change of sinuosity decreased yearly; the change rate of sinuosity of the first decade was 0.78%, higher than 0.50% from 1995 to 2005 and 0.25% from 2005 to 2015. Similar to XB, TB showed a decreasing trend of sinuosity of coastlines within the recent 30 years, too, but with a smaller magnitude; the sinuosity of natural coastlines main tained basically unchanged, while that of artificial coastlines slightly decreased. On the whole, the magnitude of change of curvature was small, being 0.15%, 0.12%, and 0.04% for the three periods, respectively. It can be seen that reclamation engineering and marine aquaculture activities in some sections in XB resulted in a flat morphology in a short time period, leading to obviously less sinuosity of coastlines compared with TB. This situation would pose a severe damage on the ecological function of bays and resources along the coastlines. Hence, the curved structural patterns of architectures in TB can be borrowed in the development in XB, to maintain the conservation rate of resource and the sinuosity of coastlines.
Figure 5 Changes in sinuosity of natural, artificial and entire coastlines in different years in XB (a) and TB (b) from 1985 to 2015
Spatially, the change of sinuosity of coastlines is mainly reflected in the curve/flat morphology of coastlines. As seen from Figure 5, the change of sinuosity of natural coastlines in XB and TB was small during the recent 30 years. The change trends of artificial coastlines and entire coastlines were similar to that of natural coastlines. Therefore, it is necessary to further analyze sinuosity features of coastlines with significant changes so that the reasons underlying the change of sinuosity of coastlines in each period could be clarified. To do so, remote-sensing images of two adjacent periods were used to create standard false color composite images by using three TM image bands 4, 3, and 2 or three OLI image bands 5, 4, and 3 with corresponding R, G, and B color guns, respectively. Segments with significant changes of coastlines were extracted from the composite images and presented in Figures 6 and 7.
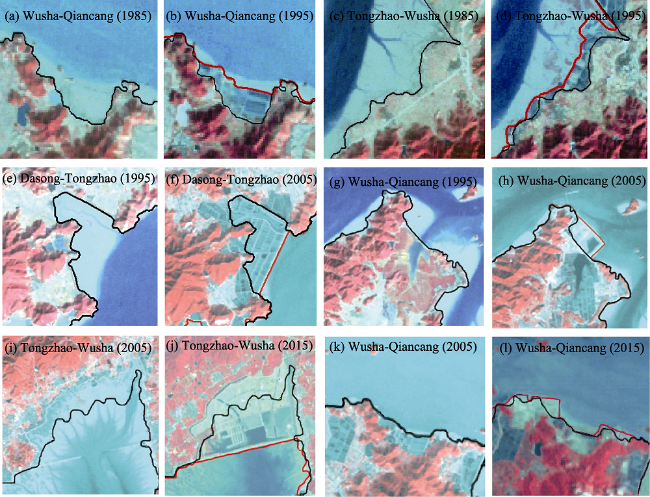
Figure 6 The coastline segments with significant changes in sinuosity between two adjacent periods in XB from 1985 to 2015
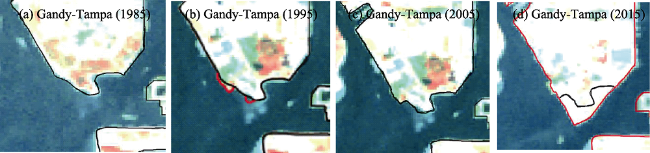
Figure 7 The coastline segments with significant changes in sinuosity between two adjacent periods in TB from 1985 to 2015
Coastline segments with significant changes between two adjacent periods were caused by either substituting straightened artificial coastlines for natural coastlines between headlands or extruding coastlines from land to sea after reclaiming tidal flats or wetlands (Figures 6 and 7). Clearly, the evolution of artificial coastlines profoundly affected the overall changes of sinuosity of all coastlines. TB had a small scale of reclamation and thus owned a high sinuosity of coastlines, which is different from the case in XB. The overall sinuosity of coastlines in both bays showed a decreasing trend from 1985 to 1995. The changes of sinuosity in Tongzhao-Wusha and Wusha-Qiancang sections in XB were more significant than the other sections due to the fast growth of land for construction and aquaculture on the east side of Huangdun Bay, which resulted in the substitution of meandering natural coastlines by artificial coastlines extruded to the sea. Gandy-Tampa section in TB also exhibited an obvious change due to a massive increase of land for construction on the east side of David peninsula. Compared with those in 1995, the sinuosities of coastlines in both bays were higher in 2005, which was a result of reclamation in Qiangjiao and aquaculture in Xiahuan Beach in XB, and a result of reclamation engineering on the east side of David peninsula in TB. Compared with that in 2005, the sinuosity of coastlines in XB decreased slightly in 2015, which was a result of disappearance of natural coastlines along the Chun Lake and an increase of artificial coastlines on the north bank of Qiancang due to reclamation in the Hongsheng seawall project. However, the sinuosity of coastlines in TB was only affected by the constructions of ports and wharfs in the southeastern city of Tampa, showing a negligible change. Because of different socio-economic development phases in China and USA, it is worth noting that different development and utilization approaches in the two bays resulted in different features in the utilization and succession speed of coastlines.

4.3 Change of intensity levels of coastal artificialization in bays

4.3.1 Spatiotemporal change analysis of coastal artificialization intensity in bays
To further reveal spatiotemporal change features of coastal artificialization intensity in XB and TB during the last 30 years, the image segmentation tool of ArcGIS10.2 was used to obtain coastlines with an increment of 2 km from Guoju-Qiancang section in XB and Massimo-Bradenton section in TB in 1985, 1995, 2005, and 2015, respectively. Based on the length of a coastline type and the calculated results of factor of impact on resource and environment by human activities, the intensity of coastal artificialization of each section was obtained using the field calculation function of ArcGIS10.2. Furthermore, the intensities of coastal artificialization were classified into four levels: low intensity (level I<0.21), medium intensity (0.21≤level II<0.45), medium high intensity (0.45≤level III <0.69), and high intensity (level IV≥0.69) (Figures 8 and 9). Following the categories, the intensity levels of coastal artificialization of the two bays were compared and analyzed (Figures 8 and 9).
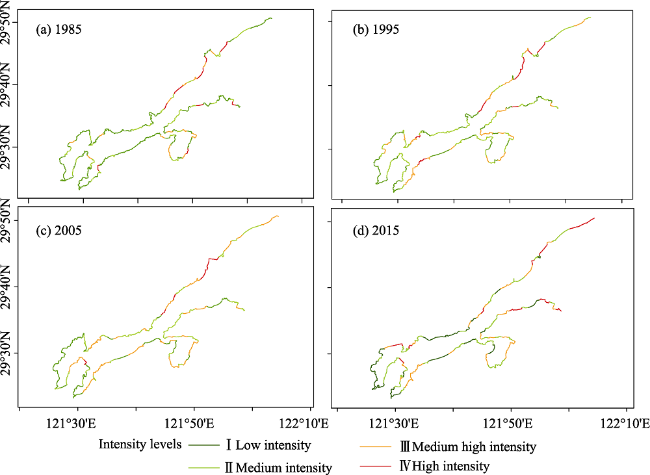
Figure 8 Distribution of artificial coastline intensity levels in XB from 1985 to 2015
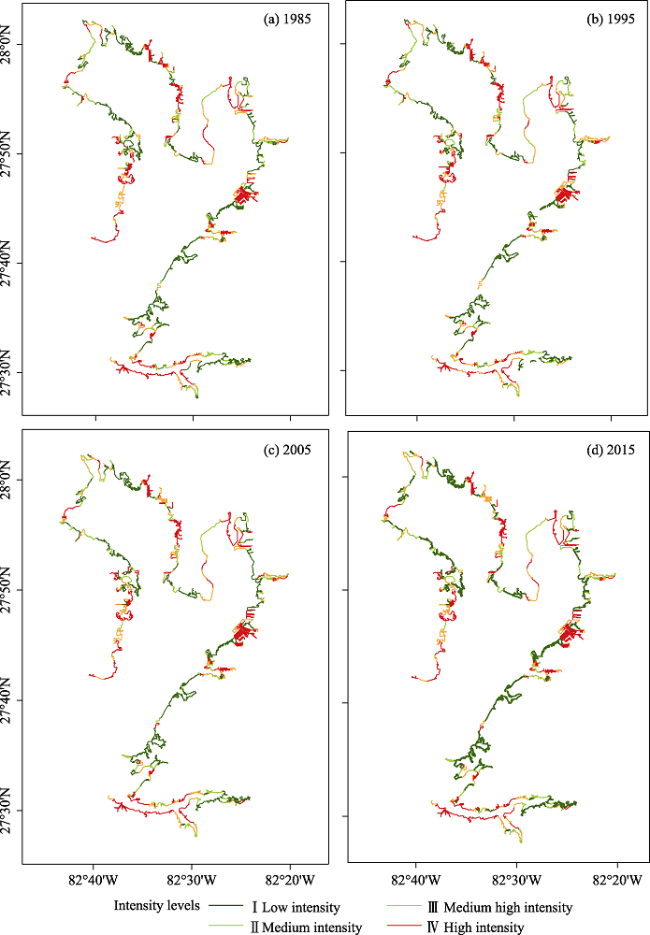
Figure 9 Distribution of artificial coastline intensity levels in TB from 1985 to 2015
Overall, the intensity of coastal artificialization in XB increased obviously during the study period; the change rate of coastal artificialization intensity for the recent 30 years was 1.59%. The change rate of intensity of coastal artificialization from 1985 to 1995 was the highest among the last 30 years, reaching 3.83%; after 1995 it slowed down, but the absolute value of intensity increased continuously. In contrast, the change rate of intensity of coastal artificialization in TB for the recent 30 years was only 0.14%; it was only 0.03% in the last 10 years. Human activities in coastlines in TB were concentrated in the western part of St. Petersburg and middle-lower reaches of the Manatee River on the south, as well as some parts of the City of Tampa in the northeast.
Locally, with the progression of coastline development, the concentration of human activities along the coastlines in XB was spread spatially. In the first decade, coastlines with intensity of coastal artificialization higher than level III were concentrated in Guoju-Dasong section, mainly due to a result of engineering construction of reclamation projects in the zone of Yangshashan and Xizhou and the Hongsheng seawall projects at the early stage. In the last decade, coastlines with intensity of coastal artificialization higher than level III increased, typically in the northern and southern coast of the bay. However, with the impact of human activity weakening along the coastlines, the development potential of natural coastlines decreased, so did the rate of coastal artificialization. Coastlines with intensity levels III and IV of artificialization were mostly factories and aquaculture ponds which have made a significant impact on the resource-environment system of coast, which exhibited a growing trend. In contrast, the changes of coastal artificialization intensity of some sections in TB were small, occurring only on the eastern side of David peninsula; zones with coastlines with intensity of levels I-IV had a steady variation, which was closely related to a perfect prewarning system for evaluating development intensity in TB. Based on the TB experience, in XB, a series of actions can be carried out to control the coastal artificialization intensity in coastlines with levels III and IV. The management activities include an evaluation on sensitivity on resource and environment of coastlines, a follow-up survey of water quality index of seawater, and an analysis of potential of coastal land use in the bay. Meanwhile, the sinuosity of artificial coastlines should be increased when conducting a construction of artificial landscapes, and a real-time monitoring of intensity of coastal artificialization and a comprehensive evaluation of utilization potential in corresponding zones should also be carried out.
4.3.2 The relationship between intensity of coastal artificialization and length of coastline
The total lengths of coastlines in both XB and TB shrank consistently, while those of natural coastlines and artificial coastlines traded off with each other. As presented in Figure 10, the intensity of coastal artificialization in XB was negatively correlated with lengths of both entire coastlines and natural coastlines, indicating a gradual decrease of natural and entire coastlines with increasing intensity of human activities. In addition, the intensity of coastal artificialization was positively correlated to the length of artificial coastlines, indicating an increase of length of artificial coastlines with a high intensity of coastal artificialization. As shown in Figure 11, the intensity of coastal artificialization in TB was negatively correlated to lengths of both entire coastlines and natural coastlines, also indicating a decrease of natural and entire coastlines with increased intensity of human activities. In addition, the intensity of coastal artificialization was also positively correlated to the length of artificial coastlines, indicating an increase of length of artificial coastlines with the intensity of coastal artificialization, similar to the case in XB.
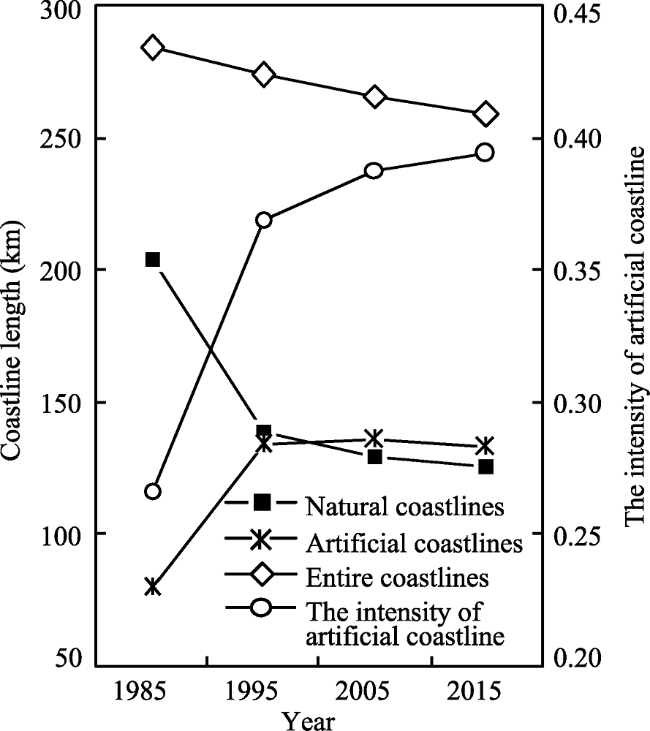
Figure 10 The relationship between the intensity of artificial coastline and coastline length in XB from 1985 to 2015
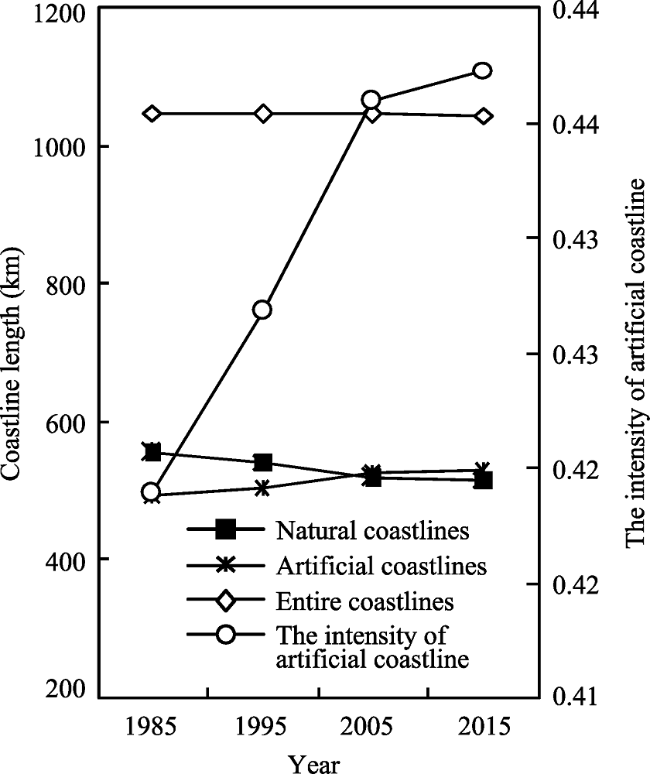
Figure 11 The relationship between the intensity of artificial coastline and coastline length in TB from 1985 to 2015
4.3.3 The relationship between intensity of coastal artificialization and sinuosity of coastlines
The overall sinuosity of coastlines in both XB and TB decreased gradually; the sinuosity of natural coastlines remained basically stable, whereas that of artificial coastlines decreased gradually. To analyze the relationship between sinuosity of coastlines and intensity of coastal artificialization, Figures 12 and 13 show the relationships between change of intensity of coastal artificialization and sinuosity of coastlines in the four periods in both XB and TB. It is noticable that intensities of coastal artificialization in XB and TB had a significantly negative correlation with sinuosity of entire coastlines and artificial coastlines. With the increase of the intensity of human activities, the sinuosity of entire coastlines and artificial coastlines decreased gradually. But the intensity of coastal artificialization had a significantly positive correlation with the sinuosity of natural coastlines. As can be seen, the intensity of coastal artificialization had a close connection to the sinuosity of coastlines in a certain period; when the intensity of coastal artificialization increased with time, the sinuosity of coastlines decreased correspondingly. Therefore, the principle of reasonable and appropriate coastal artificialization should be complied. Theoretical research on the relationship between sinuosity and intensity of coastal artificialization should be strengthened, and its result should be applied to the utilization and protection of resource of coastlines.
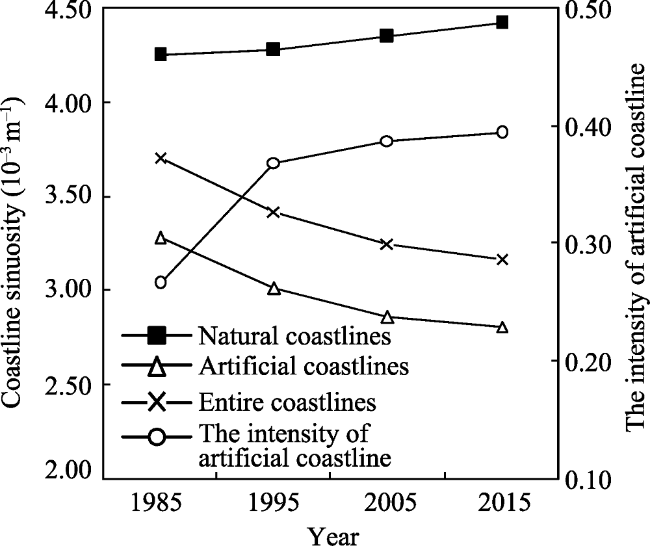
Figure 12 The relationship between the intensity of artificial coastline and coastline sinuosity in XB from 1985 to 2015
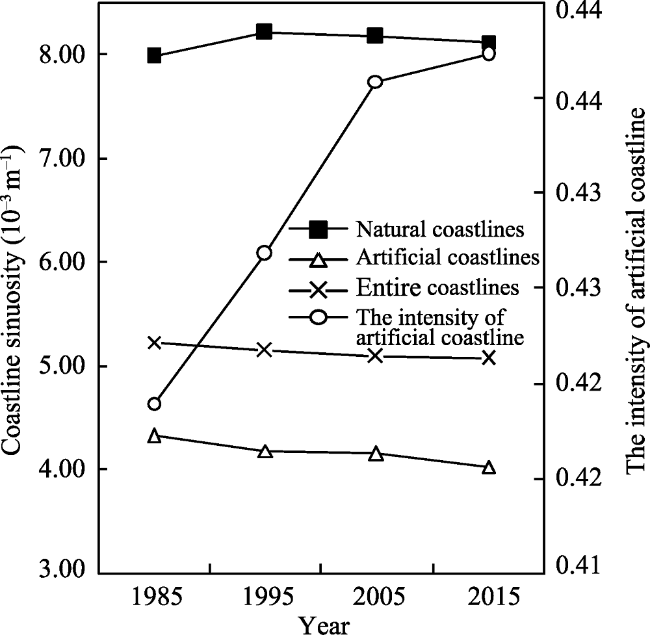
Figure 13 The relationship between the intensity of artificial coastline and coastline sinuosity in TB from 1985 to 2015

4.4 Analysis of change of intensity of artificial interference with different landscapes

According to Equation (4), we conducted an index calculation and spatiotemporal simulation of intensity of artificial interference with different landscapes in the two bays. In order to compare intensities of artificial interference with landscapes between XB and TB in different periods, the whole range of intensity was normalized and divided into five grades: low intensity (LHAI<0.21), medium low intensity (0.21≤LHAI<0.37), medium intensity (0.37≤ LHAI<0.53), medium high intensity (0.53≤LHAI<0.69), and high intensity (LHAI≥0.69), with an interval of 0.16. In such a way, the spatial distributions of intensity of human activity in the two bays were obtained (Figures 14 and 15). It is easy to see that the spatial distributions of landscapes with low and medium low intensity of artificial interference in both XB and TB were consistent, both in natural landscapes of forest lands, sea areas, lakes and rivers, tidal flats and wetlands, etc. Areas with medium, medium high, and high intensity of artificial interference were distributed in plains, covering landscapes of lands mainly for construction, aquaculture ponds, salt fields and cultivated lands in XB, and those of lands for construction and for recreation in TB.
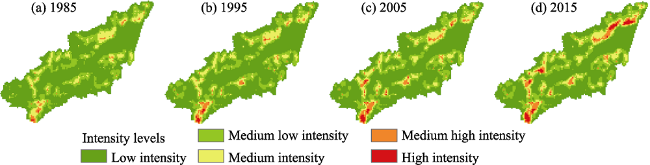
Figure 14 The intensity of landscape disturbed by human in XB from 1985 to 2015
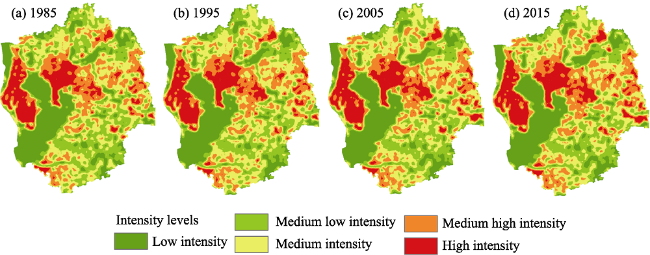
Figure 15 The intensity of landscape disturbed by human in TB from 1985 to 2015
Spatially, low and medium low intensity of artificial interference dominated in XB; areas with medium and medium high intensity of artificial interference spread gradually outward, while those with high intensity were distributed dispersedly, but with a trend of merging into a continuous zone. However, in TB, human activities with low and medium low intensity were sparsely distributed; areas with medium intensity of artificial interference were distributed in the north of the bay and the southeast of Hillsborough county, with primarily cultivated lands in the suburbs and lands for construction; and areas with medium high and high intensity of artificial interference were concentrated in the “Clearwater-St. Petersburg-Tampa” metropolitan region, the connected region of Brandon and Plant city (to the east of Hillsborough county), as well as the downstream of the Manatee river. Per the overall change pattern of intensity of artificial interference with landscapes, areas with the low and medium low intensity in XB were relatively stable in the size on the land side, but shrank on the sea side; areas with medium, medium high, and high intensity were distributed in coastal regions, with a trend of expansion. However, the variation of artificial interference with low and medium low intensity in TB was small, especially for that on the sea side. Areas with medium, medium high, and high intensity showed an expansion in the southeastern Pasco county, the southern Hillsborough county, and the northern Sarasota county. As can be seen, the landscape patterns and intensity of artificial interference with landscapes obviously changed under the impact of human activities in both XB and TB during the last 30 years.
In addition, areas with medium high and high intensity of artificial interference with landscapes in both XB and TB were mainly distributed in plains located near national and provincial/state freeways, or in the hinterland of counties (towns), such as Ninghai county and the “Clearwater-St. Petersburg-Tampa” metropolitan region. Industries with priority, such as vessel construction, reclamation engineering, real estate development, also resulted in significant changes in intensity of artificial interference with landscapes. For example, the accelerated investment, development and construction of real estate projects in TB in the 1990s resulted in significant changes in the intensity of artificial interference with landscapes in the northern, eastern and southern TB. In the early 21st century, power plant construction in Wushashan, Datang, continued construction of Haitang seawall, and reclamation engineering in Dasong-Yangshashan section made possible great changes in the intensity of artificial interference with landscapes in the northeastern, southeastern and western XB.

4.5 Response of bay landscapes to intensity of artificial interference

Coastal development caused acceleration of artificialization rate of landscapes in bay areas, resulting in responses of spatial patterns, diversity and fragmentation of the landscapes to human activities to different extents. According to the division standard for intensity grade of artificial interference with landscapes in the two bays in 2015, the study areas of the two bays were respectively divided into five zones with different intensity grades of artificial interference. The grid reclassification tool in the module of spatial analysis of ArcGIS10.2 was used to normalize the grades of intensity, with an increment of 0.14. The five zones consist of low intensity of interference (<0.33, grade 1), medium low intensity of interference (≥0.33 and <0.47, grade 2), medium intensity of interference (≥0.47 and <0.61, grade 3), medium high intensity of interference (≥0.61 and <0.75, grade 4), and high intensity of interference (≥0.75, grade 5). The five zones with intensity grades from 1 to 5 were obtained after coding (Table 5). Then the average area of patch and proportion of area of landscapes of each zone in the four periods were created based on calculated number of patches and area of landscapes. Changes of landscapes in XB and TB under the impact of artificial interference of different intensities from 1985 to 2015 were compared (Figures 16 and 17).
Table 5 Intensity divisions of human-disturbed landscapes and their internal main composition
Name Grade Composition of landscape
Zone with low intensity of artificial interference 1 Composed mainly of seas, forest lands, with low impermeability, including tidal flats, wetlands and mangrove forests, etc.
Zone with medium low intensity of artificial interference 2 Composed mainly of natural landscapes, i.e., forest lands and lakes, as well as some farm lands and dispersed residences
Zone with medium intensity of artificial interference 3 Composed mainly of architectures and vegetation mixed, as well as dispersed residences and farm lands
Zone with medium high intensity of artificial interference 4 Composed mainly of dispersed residences and open spaces ready to be developed
Zone with high intensity of artificial interference 5 Composed mainly of large-size structures, with high impermeability, including factories, highly dense residences, and airports
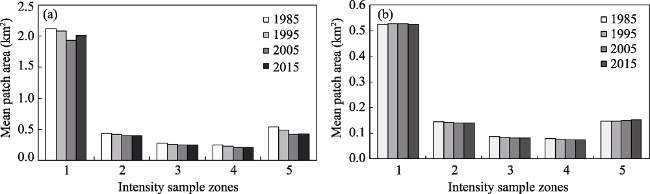
Figure 16 Responses of landscape mean patch area to intensities of different human disturbance in XB (a) and TB (b) from 1985 to 2015
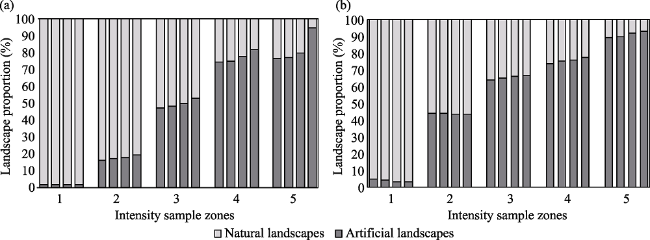
Figure 17 Responses of proportion of natural and artificial landscapes to intensities of different human disturbance in XB (a) and TB (b) from 1985 to 2015
In terms of the overall trend, the average area of patches in XB decreased gradually because of the increase of intensity of artificial interference. From zones 1 to 3, natural landscapes occupied relatively large proportion, but were fragmented and separated by dispersed artificial interferences; patches with small area gradually increased, resulting in the shrinkage of overall average area of patches. Proportion of natural landscapes of zone 4 was low, but artificial landscapes scattered, leading to an increase of number of patches and a decrease of average area of patches. Proportion of natural landscapes in zone 5 was low; connected artificial landscapes under concentrated artificial interferences dominated in this zone, resulting in an increase of patched area of landscapes. The changing trend of average area of patches in TB was basically consistent with that in XB, namely, with the increase of intensity of artificial interference for the zones, the average area of patches decreased. The average area of patches of landscapes from zones 1 to 4 was small, but for zone 5, artificial landscapes dominated because of concentrated human activities, resulting in an increase of average area of patches. Therefore, it is important to protect natural landscapes in the development in XB, enhance theoretical research on layout of bay landscapes and construction of information platforms, ensure a reasonable distribution of lands for recreation and leisure, factories and enterprises, and industries and mining, and encourage environmental awareness of the public, as well as increase promptness of ecological restoration of landscapes. It is also necessary to prevent damage on ecological systems and implement protective measures under laws and regulations so as to reduce the degree of artificial interference with natural landscapes during the development process in bays.
The landscape diversity in XB and TB was characterized using Shannon diversity index. An overall trend of increasing and then becoming stable of landscape diversity was found for zones 1 to 5 in XB (Figure 18a). For zones 1 to 3, the landscape diversity index increased gradually; since human activities were dispersed, only natural landscapes on the fringe were interfered, while artificial landscapes still took a small proportion. From zones 3 to 5, a stable trend was observed. An overall trend of gradual increase of landscape diversity was shown from zones 1 to 3 in TB, but landscape diversity from zones 4 to 5 decreased apparently (Figure 18b). The reasons could be as follows: from zones 1 to 3, diversified natural landscapes existed, which was further enhanced by the introduction of artificial landscapes; From zones 4 to 5, monotonous landscape types existed, and lands for construction dominated, resulting in a small landscape diversity index. Therefore, it is important to avoid monotonous landscapes during the development and utilization process in XB. It is also important to ensure a virtuous development of landscape patterns on the basis of comparative study of changes of diversity and heterogeneity of coastline sections of different landscapes or a landscape in different time periods, as well as analysis on sensitivity of landscapes during development and utilization of lands in the bays.
Figure 18 Responses of landscape diversity to intensities of different human disturbance in XB (a) and TB (b) from 1985 to 2015
A landscape fragmentation index reflects the degree of fragmentation of a landscape resulted from natural partition and artificial segmentation, namely, a measurement indicating the change of ecological pattern of landscape from continuous structures into patches and blocks. It can reflect the complexity of spatial pattern of landscapes and the degree of interference with landscapes by human activities. As seen from Figure 19, with the intensity of artificial interference with landscapes in XB, the continuously distributed natural landscapes in zones 1 to 4 were gradually fragmented under artificial interference, with separated patches and dispersed blocks as well as an increased degree of fragmentation. In zone 5, artificial landscapes were highly densely distributed with a relatively large average area of patches, which decreased the degree of fragmentation of landscapes from zones 4 to 5. Viewed from different time periods, the degree of landscape fragmentation in XB under different intensities of artificialization increased gradually from 1985 to 2005; in zones 3 and 5 from 2005 to 2015, the degree of landscape fragmentation decreased, mainly due to increased connection of artificial landscapes including cultivated lands and highly dense lands for construction, etc. Likewise, the trend of landscape fragmentation in TB was consistent with that in XB, i.e., an increase of landscape fragmentation from zones 1 to 4 and decrease of landscape fragmentation from zones 4 to 5. However, the change magnitude in TB was small and tended to keep stable, indicating small artificial interference in TB because of reasonable management activities. Hence, it is important to conserve some natural landscapes during the development and utilization in XB. Particularly, when the intensity of development reaches a certain degree, aggregated landscape types and their spatial spreads should be monitored in a wide range, so as to avoid separation of landscapes at a large scale under extraordinary interference by human activities.
Figure 19 Responses of landscape fragmentation to intensities of different human disturbance in XB (a) and TB (b) from 1985 to 2015

5 Conclusions

In this study, the impacts of human activities on the evolution of coastlines and landscapes in bay areas were explored in terms of quantitative comparison on the transformation of coastlines and landscapes in the two bay areas in China and USA. The conclusions derived from this study are summarized as follows:
(1) With the intensity of coastal development, the proportions of artificial coastlines in the two bays exhibited continuous growth during the last 30 years, while the length of natural coastlines decreased gradually. The increasing magnitude of proportion of length of artificial coastlines to the total length in Xiangshan Bay (XB) was far greater than that in Tampa Bay (TB). Resources of coastlines were irreversible and vulnerable to the destruction. Hence, protective measures adopted in TB should be referred to the development in XB, so as to scientifically conserve resources of natural coastlines and control the increasing rate of artificialization of coastlines.
(2) Sinuosity of coastlines in XB decreased continuously within the last 30 years. Change of sinuosity of natural coastlines was smaller than that of artificial coastlines, while the absolute value of sinuosity of the former was still higher than that of the latter. Likewise, the sinuosity of coastlines in TB exhibited a decreasing trend within the recent 30 years, but with a small change magnitude. Such a difference in the two bays was caused by different strategies of land utilization and socioeconomic development in the two countries. In addition, the evolution trend of artificial coastlines in XB and TB under the interference of human activities also profoundly affected the change process of sinuosity of all coastlines. Therefore, it is important in the development of XB to construct meandering coastlines to ensure the rate of conserved resources of coastlines in the bay area, based on the experience of TB in utilization of coastlines.
(3) On the whole, the intensity of coastal artificialization in XB was significantly increased during the 30 years, while that in TB was slowly increased. Locally, with the progression of coastal development, the degree of concentration of human activities along the coastlines in XB distributed spatially, while that in TB in some sections was basically stable. Hence, a series of actions can be carried out to control the intensity of development and exploitation of coastlines with grades III and IV in XB, including evaluation of sensitivity on resource and environment of coastlines, follow-up survey of water quality index of seawater, and analysis of potential of coastal land use in the bay. Meanwhile, the sinuosity of artificial coastlines should be increased during construction of artificial landscapes, while real-time monitoring of intensity of coastal artificialization and a comprehensive evaluation of potentialization utilization value in corresponding zones should be carried out.
(4) The intensity of coastal artificialization has had a close correlation with the sinuosity of coastlines in a certain period, showing a significant negative correlation. When the intensity of coastal artificialization increased with time, the sinuosity of coastlines decreased correspondingly. Therefore, the principle of reasonable and appropriate exploitation of coastal resources should be carried out. Theoretical research on the relationship between sinuosity and intensity of coastal artificialization should be strengthened, and its result should be applied to the utilization and protection of resource of coastlines.
(5) During the last 30 years, human activities have posed profound impacts on the evolution of landscape patterns in XB and TB, mainly reflecting the changes of spatial configuration, diversity and fragmentation of landscapes in coastal areas. The changes of average area of patches and proportion of landscapes in XB and TB were basically consistent: with the intensity of human activities, the average area of patches decreased. A decrease of landscape diversity in XB was significant, while that in TB concentrated in zones with the weakest and strongest human activities, forming a double-peak mode. The degree of landscape fragmentation in the two bays was closely related to the intensity of human activities; specifically, with the intensity of human activities, the degree of landscape fragmentation increased basically, but decreased in the zone with the most concentrated human activities. Hence, it is important to conserve some natural landscapes during the development and utilization in XB. In particular, when the intensity of development reaches a certain degree, aggregated landscape types and their spatial spreads should be monitored in a wide range, so as to avoid fragmentation of landscapes at a large scale under extraordinary interference by human activities.

The authors have declared that no competing interests exist.

1
Blodget H W, Taylor P T, Roark J H, 1991. Shoreline changes along the Rosetta-Nile promontory: Monitoring with satellite observations. Marine Geology, 99: 67-77.A study to test the effectiveness of satellite data for monitoring shoreline change is reported, the rapidly changing Rosetta Promontory of the Nile Delta, Egypt, being selected as the study area. Landsat multispectral scanner (MSS) image data in the near infrared (0.8–1.1 μm, 80 m resolution) covering a 15 year period (1972–1987) at roughly 3 year intervals were compiled. These were digitally overlain, registered and differenced relative to the initial 1972 shoreline, and composite changes (erosion and accretion) are mapped. The area studied is one undergoing both aggradation and degradation, depending on location, sediment supply and man-made barriers. It was found that the general trend of the regional processes can be monitored with Landsat imagery due to its repetitive coverage and good spectral contrast of land and sea. Improved satellite imagery with higher resolution should be a valuable tool for complementing traditional shoreline monitoring surveys in easily eroded, lowlying areas such as the Nile Delta.

DOI

2
Burningham H, French J, 2017. Understanding coastal change using shoreline trend analysis supported by cluster-based segmentation.Geomorphology, 282: 131-149.Shoreline change analysis is a well defined and widely adopted approach for the examination of trends in coastal position over different timescales. Conventional shoreline change metrics are best suited to resolving progressive quasi-linear trends. However, coastal change is often highly non-linear and may exhibit complex behaviour including trend-reversals. This paper advocates a secondary level of investigation based on a cluster analysis to resolve a more complete range of coastal behaviours. Cluster-based segmentation of shoreline behaviour is demonstrated with reference to a regional-scale case study of the Suffolk coast, eastern UK. An exceptionally comprehensive suite of shoreline datasets covering the period 1881 to 2015 is used to examine both centennial- and intra-decadal scale change in shoreline position. Analysis of shoreline position changes at a 100m alongshore interval along 74km of coastline reveals a number of distinct behaviours. The suite of behaviours varies with the timescale of analysis. There is little evidence of regionally coherent shoreline change. Rather, the analyses reveal a complex interaction between met-ocean forcing, inherited geological and geomorphological controls, and evolving anthropogenic intervention that drives changing foci of erosion and deposition.

DOI

3
Chen Z S, Wu S Y, Wang W H, 2007. The Gulf of China. Beijing: China Ocean Press. (in Chinese)

4
Chu Z X, Yang X H, Feng X Let al., 2013. Temporal and spatial changes in coastline movement of the Yangtze Delta during 1974-2010.Journal of Asian Earth Sciences, 66: 166-174.The evolution of the Yangtze delta, where the largest economic zone (e.g. Shanghai) in China is located, directly affects the regional economic development and ecoenvironment. The mean high tide lines as the coastline delineated from multi-temporal remote sensing data of Landsat during 1974–2010 at intervals of about 8years were used to examine the shoreline progradation and recession of the Yangtze delta in the past four decades. Our results show that significant parts of the shoreline in the Yangtze delta in the past four decades and particularly after the operation of the Three Gorges Reservoir (TGR), the world’s largest hydropower project ever built, experienced continual progradation despite a substantial decrease in the Yangtze sediment input. During 1974–2010, the area of the Yangtze subaerial delta increased by 667km2 with a net progradation rate of 18.5km2/yr, and the maximum progradation occurred at the eastern parts of Chongming Island and Nanhui bank, where the coastline advanced seaward about 8 and 6km, respectively, with mean net progradation rates of 0.22 and 0.17km/yr, respectively. An important (probably dominant) reason for the Yangtze shoreline progradation despite markedly decreased riverine sediment supply is coastal engineering, such as sea reclamation works, filling project, and wharf constructions.

DOI

5
Fan D, Guo H D, Yue H Yet al., 2002. Detection of lake shoreline in SAR image based on wavelet.Journal of Remote Sensing, 6(6): 511-516. (in Chinese)In the field of map production, flood surveillance, and change study of lakeshore, the lake shoreline must be detected. A new method is explored in this paper, which can detect the lake shoreline in SAR images. Using this method, The edge points are detected by Mallat' s Wavelet-based edge detection method firstly, and then the Gradient Vector Flow Active Contour Model is used to connect the edge points. The result of the experiment shows that method presented in this paper can restrain the interference of speckle noise, and detect the lake shoreline precisely.

DOI

6
Ghosh M K, Kumar L, Roy C, 2015. Monitoring the coastline change of Hatiya Island in Bangladesh using remote sensing techniques.ISPRS Journal of Photogrammetry and Remote Sensing, 101: 137-144.A large percentage of the world population is concentrated along the coastal zones. These environmentally sensitive areas are under intense pressure from natural processes such as erosion, accretion and natural disasters as well as anthropogenic processes such as urban growth, resource development and pollution. These threats have made the coastal zone a priority for coastline monitoring programs and sustainable coastal management. This research utilizes integrated techniques of remote sensing and geographic information system (GIS) to monitor coastline changes from 1989 to 2010 at Hatiya Island, Bangladesh. In this study, satellite images from Thematic Mapper (TM) and Enhanced Thematic Mapper (ETM) were used to quantify the spatio-temporal changes that took place in the coastal zone of Hatiya Island during the specified period. The modified normalized difference water index (MNDWI) algorithm was applied to TM (1989 and 2010) and ETM (2000) images to discriminate the land ater interface and the on-screen digitizing approach was used over the MNDWI images of 1989, 2000 and 2010 for coastline extraction. Afterwards, the extent of changes in the coastline was estimated through overlaying the digitized maps of Hatiya Island of all three years. Coastline positions were highlighted to infer the erosion/accretion sectors along the coast, and the coastline changes were calculated. The results showed that erosion was severe in the northern and western parts of the island, whereas the southern and eastern parts of the island gained land through sedimentation. Over the study period (1989 2010), this offshore island witnessed the erosion of 6476 hectares. In contrast it experienced an accretion of 9916 hectares. These erosion and accretion processes played an active role in the changes of coastline during the study period.

DOI

7
Guo L, Du S H, Xue D Yet al., 2009. Spatiotemporal variation of landscape patterns during rapid urbanization in Guangzhou City.Acta Scientiarum Naturalium Universitatis Pekinensis, 45(1): 129-136. (in Chinese)

8
Jerzy S, 2009. Spatial context of urbanization: Landscape pattern and changes between 1950 and 1990 in the Warsaw metropolitan area Poland.Landscape and Urban Planning, 93(2): 250-261.This paper reports on the changes in the spatial structure of landscape in the years 1950 1990 within the Warsaw metropolitan area. The analysis was aimed at identification of (a) the influence of the distance from the center of the city and from the transport routes on the values of landscape metrics, (b) changes in time of the landscape metrics of forests and built-up areas, (c) the influence of habitats, transportation network and the distance from the center on the directions and intensity of urban growth. Several landscape metrics were chosen to describe the landscape pattern (spatial share, mean patch size, patch size coefficient of variance, mean shape index, mean nearest neighbor distance, mean proximity index, and interspersion and juxtaposition index). The majority of changes in land cover took place in the years 1950 1970, but relations between landscape metrics and the distance from the center of Warsaw as well as from the transport routes, had a persistent character over the entire period studied. The influence of the habitat differentiation (expressed in categories of potential natural vegetation) in land cover is relatively unimportant in the vicinity of the city center and in the direct neighborhood of roads, while it would become the dominating factor in the periphery. The landscape metrics enable the description of the spatial regularities and trends, and constitute useful indirect indicators of the impact of urbanization on cultural (rural) landscape and of the general ecosystem disturbance.

DOI

9
Joseph T, Ioannis N, Vogiatzakis, 2011. Processes and patterns of landscape change on a small Aegean island: The case of Sifnos Greece.Landscape and Urban Planning, 99(1): 58-64.The Mediterranean island landscape is a mosaic of land-cover types that manifest the historical interaction between physical and anthropogenic processes that have affected significantly landscape composition and spatial configuration. The aim of this study is to investigate the processes and patterns of landscape changes in small Mediterranean islands as exemplified by the Aegean island of Sifnos, Greece. Satellite imagery was used to measure land-cover changes from 1987 to 1999. A suite of landscape metrics was employed to quantify changes in landscape structure. The results show that cropland suffered the highest area loss through conversions to semi-natural vegetation or settlements. The maquis vegetation of Research highlights?·Between 1987 and 1999 Sifnos’ landscape became less fragmented and more homogeneous. ?·Maquis vegetation expanded and there are no signs of desertification on the island. ? The main drivers of landscape change were agricultural decline and tourism. ?·Landscape polarization has increased due to spatially co-occurring processes. ? Agriculture and tourism do not represent competing economic sectors.

DOI

10
Kannan R, Ramanamurthy M V, Kanungo A, 2016. Shoreline change monitoring in Nellore coast at east coast Andhra Pradesh district using remote sensing and GIS.Journal of Fisheries and Livestock Production, 4(1): 161. doi: 10.4172/2332-2608.1000161.

11
Lantuit H, Pollard W H, 2008. Fifty years of coastal erosion and retrogressive thaw slump activity on Herschel Island, southern Beaufort Sea, Yukon Territory, Canada.Geomorphology, 95(1/2): 84-102.Patterns of coastal erosion in the Arctic differ dramatically from those coasts in more temperate environments. Thick sea ice and shore-fast ice limit wave-based erosional processes to a brief open water season, however despite this, permafrost coasts containing massive ice, ice wedges and ice-bonded sediments tend to experience high rates of erosion. These high rates of erosion reflect the combined thermal–mechanical processes of thawing permafrost, melting ground ice, and wave action. Climate change in the Arctic is expected to result in increased rates of coastal erosion due to warming permafrost, increasing active layer depths and thermokarst, rising sea levels, reduction in sea ice extent and duration, and increasing storm impacts. With the most ice-rich permafrost in the Canadian Arctic, the southern Beaufort Sea coast between the Tuktoyaktuk Peninsula and the Alaskan border is subject to high rates of erosion and retrogressive thaw slump activity. Under many climate change scenarios this area is also predicted to experience the greatest warming in the Canadian Arctic. This paper presents results of a remote sensing study on the long-term patterns of coastal erosion and retrogressive thaw slump activity for Herschel Island in the northern Yukon Territory. Using orthorectified airphotos from 1952 and 1970 and an Ikonos image from 2000 corrected with control points collected by kinematic differential global positioning system and processed using softcopy photogrammetric tools, mean coastal retreat rates of 0.6102m/yr and 0.4502m/yr were calculated for the periods 1952–1970 and 1970–2000, respectively. The highest coastal retreat rates are on north–west facing shorelines which correspond to the main direction of storm-related wave attack. During the period 1970–2000 coastal retreat rates for south to south–east facing shorelines displayed a distinct increase even though these are the most sheltered orientations. However, south to south–east facing shorelines correspond to the orientations where the highest densities of retrogressive thaw slumps are observed. Differences in rates of headwall retreat of retrogressive thaw slumps and coastal erosion results in the formation of larger thermokarst scars and the development of polycyclic thaw slumps on south to south–east exposures. The number and the total area of retrogressive thaw slumps increased by 125% and 160%, respectively, between 1952 and 2000. As well, the proportion of active retrogressive thaw slumps increased dramatically. Polycyclic retrogressive thaw slumps appear to develop in a periodic fashion, related to retrogressive thaw slump stage and maximum inland extent.

DOI

12
Li C C, 1986. Geomorphic characteristics of the harbor coasts in south China.Acta Geographica Sinica, 41(4): 311-369. (in Chinese)This paper analysed the main factors of the coastal formation in South China, i.e. the geological structures, the geographical conditions of the mainland coast, the raise of the sea-level during Holocene, the tide, the wave, the longshore drift and so on. The coast in South China is characterized by the pattern of barrier-lagoon (or bay), because the tide range is small and the sediment transported by wave is rather strong. The mud-sand of most part of the barriers was derived from inner shelf, and moved landward with sea-level rise in Holocene. The author described in full details of the morphology about the two patterns of harbour-coasts (i.e. submerged valley and barrier-lagoon). The characteristics of the harbour of barrier-lagoon are as follows: 1.A harbour with the barrier-lagoon is commonly independent from the adjacent coastal systems; 2.Either the pluvial-alluvial terraces and the erosion platforms or the hills always lie at the back of the barrier-lagoon (or bay) systems; 3.During the Holocene, the barriers had evolved continuously by retreat, progradation and return. That correspondingly caused the changes of the other morphology, such as the area of lagoon, the mud flat, the tidal inlet and its sand bodies; 4. The foreshorelines of most barriers have tended to the logarithmic spiral plan shape; 5. The morphodynamics of beach may be divided into three sections; 6. The throat-position of the tidal inlet is always situated in the apex of Z-shaped headland-bay and is generally stable.

13
Li J L, Yang L, Pu R Let al., 2017. A review on anthropogenic geomorphology.Acta Geographica Sinica, 27(1): 109-128. (in Chinese)With the continuous development of man ability to reshape nature, human activities have become the third geomorphologic agent in the modern geomorphological process. Man-made landform is a landform unit characterized by human activities and is a result of synergizing human and nature geomorphologic agents under the physical geographical background. This article provides an overview on the major progresses in research on anthropogenic geomorphology from aspects like the origin of anthropogenic geomorphology, man-made landform agents and classification, man-made landform evolution and its influencing mechanism, map presentation of man-made landform, and environmental impact of man-made landforms. In addition, in the article, the future development of anthropogenic geomorphology is forecasted. It is pointed out that future studies on anthropogenic geomorphology should pay more attention to the following directions: construction of discipline system of anthropogenic geomorphology, material composition and morphological features of man-made landforms, spatial expansion process and development laws of man-made landforms, regional disparity and accumulative environmental effects of man-made landforms, and environmental management on man-made landforms and comparative analyses of relevant international management policies.

DOI

14
Li X, Zhang L P, Ji C Get al., 2014. Spatiotemporal changes of Jiangsu coastline: A remote sensing and GIS approach.Geographical Research, 33(3): 414-426. (in Chinese)

15
Li Y, Wang Y L, Peng Jet al., 2009. Research on dynamic changes of coastline in Shenzhen City based on Landsat image.Resources Science, 31(5): 875-883. (in Chinese)

16
Lin G L, Zuo Y H, 2006. Cumulative ecological effects assessment on resource exploitation and utilization in bay.Journal of Natural Resources, 21(3): 432-440. (in Chinese)The cumulative ecological effects(CEE) of natural resource exploitation and utilization in bay,including accumulative action of the same characteristic effects and cooperative action of different characteristic effects,has brought about rapid changes in productivity and eco-service function of bay ecosystem.Base on fuzzy-correlation analysis,six indices,which are cumulative effects on topographical and geomorphological environment,water dynamical environment,water and sediment quality environment,ecological environment,landscape environment,and the potential incurrence effect on disaster,are selected as indices of CCE in bay.The grey model(GM) of CCE assessment is built and applied to monitor the cumulative effects arising from regular resource exploitation and utilization in bay,and Xiamen Bay is taken as a study case.The result indicated that the six indices of CCE in bay are pro-correlated with intensity of resource exploitation and utilization,while wetland area reduction,coastal topographical and geomor-phological change,water quality and sediment quality deterioration,bio-diversity decrease,landscape pattern break,etc.,are caused mostly by resource exploitation and utilization.And the score of GM assessment on Xiamen Bay in the 50 years is 0.56,which can be taken as a reference background of CCE in bay.This result of CCE has led to changes in the structure of resource and environment system in bay to a certain extent,consequently,the intensity and frequency of disaster and potential loss is increasing,the productivity and eco-service function of natural ecosystem is impaired,and the sustainability of development will be limited eventually.It is suggested that pattern of eco-city planning should be referred to and rational distribution of eco-source,eco-patch and eco-passage shoule be practised so as to prevent the occurrence of ecological desert in the sea sector due to constant increase in resources utilization.

DOI

17
Lin G L, Zuo Y H, 2007. PRED regulation of Xiamen bay in the process of urbanization.Acta Geographica Sinica, 62(2): 137-146. (in Chinese)Population, resource, environment and development (PRED) is a focus question of human-earth relationship and an everlasting subject of geographic research. The theory of synergism of five rules in PRED and conceptual mathematical model of PRED evolution trajectory were analyzed, then the controlling macro-model of integration of six factors and its grey index assessment system in bay area were proposed whereby. Also the regulation programs for PRED of bay area evolved in a well-ordered way was devised. The synergism of five rules, refers to the coupling of natural rule, social rule, economic rule, environmental rule and technical rule. The integration of six factors means organizing of ecotype, safety, health, landscaping, culture and profit. The reciprocity of synergism of five rules and integration of six factors is interdependent. Take the Xiamen Bay as an example. The city of Xiamen has reached a highly developed stage, whose first industry has nearly been replaced by the secondary and tertiary industries, but oceanic species like Chinese dolphin, lancelet, etc. and mangrove wetland were preserved. The grey assessment result of integration of six factors is 75.725, indicating that main limiting factors of PRED in the Xiamen Bay are artificial coastline, seawater pollution and shipping channel siltation. The focus of PRED regulation should be: protect coastal eco-source, prevent port and shipping channel from silting, curtail pollution from land, improve landscape of coastline and islands, keep the predominance of sea transportation industry and travel industry and expand to new high-tech oceanic industries. The study shows that the theory of synergism of five rules and integration of six factors brings a general idea and oriental guide for PRED in bay area, and planning foreseeingly on resource utilization and environmental protection is an exercisable controlling means. Based on the continually comparison and adjustment of six factors among several representative bays, each factor of PRED will keep in a well-ordered way, the conceptual mathematical curve of PRED evolution trajectory will keep ascending, and the distinction of PRED of each bay will be revealed.

DOI

18
Lisa M, Olsen V H, Dale T F, 2007. Landscape patterns as indicators of ecological change at Fort Benning Georgia USA.Landscape and Urban Planning, 79(2): 137-149.This research examined landscape indicators that signal ecological change in both intensely used and lightly used lands at Fort Benning, Georgia. Changes in patterns of land cover through time affect the ecological system by altering the proportion and distribution of habitats for species that these cover types support. Landscape patterns, therefore, are important indicators of land-use impacts, past and present, upon the landscape. This analysis of landscape pattern began with a landscape characterization based on witness tree data from 1827 and the 1830s and remotely sensed data from 1974, 1983, 1991, and 1999. The data from the early 1800s, although coarse, were useful in characterizing the historical range of variability in ecological conditions for the area. The steps for the analysis involved the creation of a land-cover database and a time series of land-cover maps, computation of landscape metrics, and evaluation of changes in those metrics over time as evidenced in the land-cover maps. We focused on five cover types (bare/developed land, deciduous forest, mixed forest, pine forest, and non-forest vegetated land), for they reveal information important to resources management at Fort Benning. An examination of land-cover class and landscape metrics, computed from the maps, indicated that a suite of metrics adequately describes the changing landscape at Fort Benning, Georgia. The most appropriate metrics were percent cover, total edge (km), number of patches, descriptors of patch area, nearest neighbor distance, the mean perimeter-to-area ratio, shape range, and clumpiness. Identification of such ecological indicators is an important component of building an effective environmental monitoring system.

DOI

19
Ma L J, Yang X G, Qi Y Let al., 2014. Oceanic area change and contributing factor of Jiaozhou bay.Scientia Geographica Sinica, 34(3): 365-369. (in Chinese)Based on previous results, using the topographic map, nautical chart and remote sensing data, six different periods(1863, 1935, 1969, 1987, 2002 and 2012)coastline position of Jiaozhou Bay were extracted. Also, we calculated the area change of Jiaozhou Bay in these five periods and making chanegs of sea areas in differetn periods and land area distribution map of different development and utilization types according to the way of the development and utilization. It is showed that, in the past 150 years, oceanic area of Jiaozhou Bay decreased by 41% from 578.5 km2in 1863 to 343.09 km2in 2012. In past 70 years, oceanic area of Jiaozhou Bay reduces sharply, and the rates are 3.08 km2/a, 2.78 km2/a, 3.71 km2/a and 1.68 km2/a, respectively. Oceanic area change of Jiaozhou Bay is 129.2 km2and is controlled entirely by natural factor before 1863. Between 1863 and 1935, oceanic area change of Jiaozhou Bay is 15.1 km2, and the main factor of area change is natural factor. Only 9.4% of the area change is due to human activities. In1935-1969, oceanic area change of Jiaozhou Bay is 104.78 km2, and the area change caused by human activities is 87%. In 1969-1987, oceanic area change of Jiaozhou Bay is 49.99 km2, and the area change caused by human activities is 89%. Between 1987 and 2002, Oceanic area change of Jiaozhou Bay is 55.62 km2, the area change due to human activities is 90%. Between 2002 and 2012, oceanic area change of Jiaozhou Bay is 16.76 km2, and 99% of the area are caused by human activities. In 1935-2012, 93.89% of area change is caused by human activities, which is the main controlling factor. The way of development and utilization, such as sea reclamation, result in the area of Jiaozhou Bay increase in1863-2012. The maximum appears in 1987 to 2012 and the maximal area is 27.67 km2. In 1987-2002, land reclamation reaches the maximum scale; in 1935-1969, area of saltern achieves the largest. The impact of this way of development and utilization is devastating and irreversible.

DOI

20
Parcerisas L, Marull J, Pino Jet al., 2012. Land use changes, landscape ecology and their socioeconomic driving forces in the Spanish Mediterranean coast (ElMaresme County, 1850-2005).Environmental Science and Policy, 23(11): 120-132.A set of landscape metrics is used to study the long-term environmental transformation of a typical coastal Mediterranean area from 1850 to 2005. Our figures show a dramatic environmental deterioration between 1950 and 2005. The main proximate drivers of this landscape degradation are the effects of urban sprawl on former agricultural areas located in the coastal plains, together with the abandonment and reforestation of hilly slopes intercepted by low-density residential areas, highways, and other linear infrastructures. Then, a statistical redundancy analysis (RDA) is carried out to identify certain ultimate socioeconomic and political drivers of these environmental impacts. The results confirm, from a quantitative perspective, our main hypothesis that some ultimate geographical endowments and socioeconomic or political drivers have determined land cover changes which, in turn, have altered both structural and functional landscape properties.

DOI

21
Paterson K S, David K L, 2014. The human dimension of changing shorelines along the U.S. North Atlantic Coast.Coastal Management, 42(1): 17-20.Shoreline change has serious implications for coastal communities and policymakers at all levels of government. The purpose of this study was to examine existing knowledge on the social effects of erosion and accretion along the North Atlantic Coast. Initially, a comprehensive annotated bibliography of peer-reviewed literature was undertaken from which trends and themes were identified. A gap analysis matrix was developed using social variables and measurable parameters. Findings showed that overall, the quantity, breadth, and depth of literature were limited, and neglected the interdisciplinary perspective necessary to understand the social implications of shoreline change.

DOI

22
Qin X D, Min Q W, 2007. Application of cellular automata in landscape pattern optimization.Resources Science, 29(4): 85-91. (in Chinese)General treatment of landscape pattern spatial optimizations is in its infancy.Among various modes of landscape pattern optimization,the most advanced and sophisticated one is a mode that searches optimal solutions in state space of simulation results of landscape changes.It has exhibited many advantages such as relatively high objectivity and automaticity of optimization.However,at present,there are no enough quantitative theories of interactions between pattern and process in landscape for extensive use of this optimization mode.Fortunately,due to inherent advantages of cellular automata(CA),the spatial explicit model based on CA is likely to bring the optimization mode into operation,on condition that a series of technical problems are conquered.In in paper,principles of cellular automata and its applications in landscape ecology were introduced.A CA has three essential characteristics: spatial discreteness of expressions of states,temporal discreteness of changes of states,spatial correlation of rules of state transformation.Therefore,it has not only general advantages for analysis and simulation of spatial-temporal development,but also relative advantages for spatial simulation of landscape changes.The reasons for both aspects of advantages in the applicability of CA into landscape pattern optimization were elucidated in the paper.The former is that a CA model is constructed "from bottom to top",based on interactions of microscopic individual units,so that it can simulate landscape changes directly at a relatively small scale,regardless of quantitative laws at landscape scale.The latter is that its definition of neighborhood and associated rules of transformation can naturally meet the requirement of landscape ecology that attach much importance to horizontal processes.The challenges of application of CA into landscape pattern optimization were analyzed,among which the two most distinguished are as fellows: one is contradictions between its simplicities of construction and complexities of landscape change.The other is how to define rules of transformation that can reflect natural and human factors during landscape change.Other problems in application of CA into landscape pattern optimization include definition of scales,calibration of temporal paces,and computational complexity.Some partial and tentative solutions to these problems were presented.Firstly,the conception of CA model was expanded with most generalized expressions so as to enable CA to simulate complex landscape changes.Secondly,models of dominant ecological process were integrated into rules of state transformation.Last but not least,in order to reduce computational complexity and ensure the mode to be practically operated,some computer algorithms and techniques of software engineering,such as search strategies and calculation multiplexing,were utilized.An architecture and flow chart for the landscape pattern optimization mode,centering on generalized-CA based spatial explicit model,was proposed.

23
Ryu J H, Choi J K, Lee Y Ket al., 2014. Potential of remote sensing in management of tidal flats: A case study of thematic mapping in the Korean tidal flats.Ocean and Coastal Management, 102: 458-470.61A comprehensive study is required to fully understand the tidal flat environment.61Landsat TM/ETM+ is still widely used for thematic map generation.61Thematic maps based on remote sensing techniques can help inform policy decisions.61Specific case studies of tidal flats in Korea were examined.

DOI

24
Sun W F, Ma Y, Zhang Jet al., 2011. Study of remote sensing interpretation keys and extraction technique of different types of shoreline.Bulletin of Surveying and Mapping, (3): 41-44. (in Chinese)Key Words】:

DOI

25
Tian G J, Zhang Z X, Zhang G Pet al., 2002. Landscape dynamic change pattern of Haikou City by TM imagery and GIS.Acta Ecologica Sinica, 22(7): 1028-1034. (in Chinese)Urbanization is perhaps one of the most important human activities that creats enormous impacts on environment at the local, regional and global scales. The urbanization process is the urban sprawl and the absorption of adjacent villages into the city. From the 1950s to the 1980s in China there were restrictions on the migration of people from rural to urban areas of the country. These restrictions were due to “the registered permanent residence policy” which in turn limited employment opportunities in Chinese cities. Thus in China the urbanization process was different from that in developed countries. In 1988 the provincial administration and special economic zone were built, a great amount of capital from abroad and other areas of China was invested in Hainan with the favorable tax policies. As the capital, political, economic, cultural and transportation center, the built-up area expanded quickly in Haikou city accompanying with the rapid development of the economy and the real estates. The purpose of the paper was to study the landscape dynamic change pattern during the rapid urbanization process.Haikou is latitude 19°57′04″~20°05′11″ north and longitude 110°10′18″~110°23′05″ east. It is in north Hainan island and border to Qiongzhou strait. The climate is tropical monsoon with the annual precipitation of 1639 mm and average temperature is 23.8℃. Mesa is the main topography, high in south, low in north. In 1998 the total population was 527900 and GNP (Gross National Product) was 1.1 billion Yuan with 20 387 Yuan per capita, 3.3 times of the national and 3.48 times of the provincial. In other words the average economic level of the population in Haikou was higher than that of either the national or the provincial average. Three separate dates of the Landsat TM(Thematic Mapper) imageries in 1986-11-01, 1996-10-01 and 2000-04-30 were interpreted. The path and row of the imagery was 124-46 and weather condition was cloud free. Using the terms of the national land use classification system, landscape was divided into the following categories: forest, grass, cultivated land, water, city, rural settlement, construction site and sand. The topography map of 1∶100 000 in 1996 was based on to interpret the imagery by remote sensing and geographic information system software MGE. The imagery in 1986 and 2000 were interpreted to get the dynamic change map during 1986~1996 and 1996~2000. If the landscape kept stable, the sign was same; if changed, the sign was changed too. For example, 2051 was signed when the landscape of forest was converted into city. The data sets were processed by ARC/INFO.Landscape structure changed dramatically during the past 15 years. During the first period, from 1986~1996, agricultural field, water area and sand decreased rapidly with the increment of urban, rural settlement and construction land. During the second period, from 1996~2000, the forest and water decreased while agricultural field, urban, rural settlement and construction land increased. Thus pattern of change in the landscape structure was the conversion of agricultural field, forest, water, sand into urban, rural settlement, construction land. In sum natural landscape in addition to agricultural fields was converted into human settlement and construction landscape. The total area of 1996 increased because 96.99 hm 2 sea was filled into urban land. Fragmentation F_i ,separation N_i ,lacunarity (r) and diversity index H are each applied to study the landscape spatial change in the periods from 1986 to 1996 and 1996 to 2000. (1) Forest. During the first period F_i decreased and N_i kept stable with the plantation of man-made forest. During the second period forest acreage decreased by 15.65% with the conversion of agricultural field, urban and construction land, so F_i and N_i increased. Forest lacunarity index decreased slowly in the first period and increased in the second. It was accordant with the fragmentation law. When the dimension was 300~1500 m, the index decreased quickly. As a result larger forest patch

DOI

26
Tirkey N, Biradar R S, 2005. A study on shoreline changes of Mumbai coast using remote sensing and GIS.Journal of the Indian Society of Remote Sensing, 33(1): 85-88.No Abstract available for this article.

DOI

27
Verbutg P H, Soepboer W, Veldkamp Aet al., 2002. Land use change modeling at the regional scale.The Clues Environmental Management, 30: 391-405.

28
Wan K, Bao X W, Yao Z Get al., 2014. Tidal and residual current characteristics at mouth of Shangchenggang channel.Oceanologia et Limnologia Sinica, 45(4): 669-675. (in Chinese)Based on shipboard ADCP measurements at the mouth of the Shachenggang Channel in South Fujian, China(120°10.74′—120°26.57′E; 27°08.37′—27°09.07′N; mostly 15 m deep and max. 45 m deep), the time series of tidal current at 10 sites along transection were constructed. The hydrological factors such as tidal current, residual current, and tidal transport are analyzed to understand the tidal and residual current characteristics in this region. The tidal currents are identified as regular semidiurnal tidal flows. Tidal flood currents appear first in lower layers ~30 min ahead to upper layers currents in flood phase, while ebb currents first show up in upper layers about 30 min ahead in ebb phase. The tidal currents in the channel are alternating currents, in which M2 and S2 constituents have relatively stronger speed and mainly flow along the principal axis of the channel. A two-layered structure is found in residual currents at the transection, with southeastward outflows centered at the south section in the upper 10 m and northwestward inflows centered at the middle section blow the 10 m depth. The approximate tidal transports between the channel and open sea through transection are 1.63×10⁸ m3.

29
Wang M Y, Li J L, Xu L Het al., 2014. Beach farmland reclamation from landscape pattern change: Dongtai County, Jiangsu Province as a case study.Journal of Ningbo University (NSEE), 27(4): 60-65. (in Chinese)Agricultural development is most important in exploiting beaches which turn out to be one of the most natural resources in Jiangsu coastal area after reclamation. This paper selects Dongtai county as a study area which covers a number of beaches and has a long history of land reclamation. Using the remote sensing images in 1990, 2000 and 2010, the landscape pattern data about land-use in different periods are extracted, and the changes of landscape pattern of Dongtai are closely examined. The results show that:(1) From 1990 to 2010, the sampled area was mainly covered by farmland accounting for 80% in the total area. The area of settlement and agriculture land increased and mudflats area reduced. Area of grassland was expanded significantly. The order of land reclamation is as follows: sea area mudflats grassland farmland construction land and aquaculture land.(2) Dominance index of artificial landscape has dropped. Other artificial landscapes show a strong expansion trend, and the aquaculture land is particularly prominent. Because of the erosion with the artificial landscape, fragmentation process of natural landscapes and instability of the ecological become more worrisome.(3)The landscape pattern tends to be more fragmentary and isolative; a number of patches and average unit area become smaller; the shape of patches becomes more diverse; the distance between patches increases and interaction between patches becomes weaker. Both the evenness and diversity index of landscape type increase while the dominance index decreases.

30
Wang X H, Zhu X D, Li Y Fet al., 2007. Dynamic assessment of the cumulative ecological effects from Xiamen Bay city development.Acta Ecologica Sinica, 27(6): 2375-2381. (in Chinese)Rapid urbanization in the Xiamen Bay area has greatly changed ecosystem productivity and other eco-service function of wetland ecosystems. A simulation model was developed based on system dynamics and analytical causal-loop feedbacks to quantify the cumulative ecological effects of the change for the Xiamen Bay City, including its hydrological dynamics, water quality, ecological characteristics, geomorphic features, and landscape structure. The cumulative ecological effects of alternative policies were simulated by adjusting the decision-making variables and their combinations, and quantitatively assessed by using the grey model (GM), followed by model verification and sensitivity analysis. The consequences of three scenarios for future management were simulated and compared, including baseline scenario (BS), the eleventh Five-Year Plan scenario (S1), and the eco-city scenario(S2). The cumulative ecological effects indices were 0.61, 0.37, and 0.30, respectively, for the BS, S1, and S2 scenario. The cumulative ecological effects under S2 scenario was 50% of the BS scenario. Consequently, we recommend Xiamen adopt the eco-city (S2) model for its future development.

DOI

31
Wang Y, Ji X M, 2011. Environmental characteristics and changes of coastal ocean as land-ocean transitional zone of China. Scientia Geographica Sinica, 31(2): 129-135. (in Chinese)Coastal ocean is the transitional zone between the land and the ocean.It extends from coastal Zone to the outer edge of the continental shelves,then continues to continental slopes and continental rises.Approximately matching the region that has been alternately flooded and exposed during the sea level fluctuations of the late Quaternary period,and has covered relatively complete zones with land and ocean interactions.It is an independent environment system which is different from the land and the deep ocean,and is closely related to human living activities.Since he United Nations Law of Sea Convention took effect in 1994,coastal ocean has become a hotspot of the earth sciences domain because of the requirement of maritime sovereignty and resources development.Located on the interaction zone of Asia and the Pacific Ocean,Chinese coast is of various types.The coastal ocean environment and processes are unique due to the river-sea interaction and the influence of human activities.Evolution of China coast reflects the influence of geology,rivers,climate,typhoons,waves,tides,shelf currents,and sea level changes.While tectonics control the broad scale appearance of the coast(either embayed bedrock in emergent regions or plain coast in subsiding regions),rivers dominate the supply of sediment to the sea and help control erosional/accretionary trends.The influence of global change and human activities on river drainage areas also appears in coastal ocean area and affects marine environment remarkably due to the transfixion action of the rivers.The coastal classification was applied to dividing the coast of China into four major sectors.The impact of rivers,waves and tides on coastal processes in each of these sectors varies widely,ranging from river-dominated in the Bohai Sea sector,to wave-dominated in the southern Guangdong/Guangxi sector.The characteristics and problems in the coastal development are analyzed taking the plain coast as an example.The eastern coast has been a living and multiplying place of China for a long time.However,the characteristics of the environmental system of the land-ocean transitional zone have not been well understood.The contemporary large scale development induced a series of problems.The negative effects such as seawater pollution caused the decline of precipitation and freshwater quality,with frequent red tide disasters,and endanger human life.Therefore,more attention should be paid to the study of the environmental characteristics of the land-ocean transitional zone.It is very important to understand the variability of the environmental factors and to standardize the development activities.Historical and realistic examples show that people should investigate the environmental features of the study area,explore the mechanism of its dynamical processes,illustrate the trend of its development,and design projects within the threshold limits to avoid human-induced disasters.

DOI

32
Wu J S, Wang Z, Zhang L Qet al., 2012. Research progresses on driving forces of the changes of landscape pattern.Progress in Geography, 31(12): 1739-1746. (in Chinese)Research on driving forces of the changes of landscape pattern is a basis for understanding the relationship between human activities and evolution of landscape pattern.In recent years,a large number of case studies at home and abroad have done qualitative or quantitative analysis on the driving forces.This paper provides an overview of the categorization of driving factors,analyzes the effects of dominant driving factors in terms of time scale,spatial scale and landscape themes,and discusses research progresses(or lack thereof) on interactions of the driving factors,identification of the driving mechanisms,and adaptation and feedback of landscape systems to the driving factors.The methods of driving force identification have been going through the change from qualitative analysis to quantitative and semi-quantitative analysis,and sample collection methods are in fast-paced improvement,thanks to the progress on remote sensing technology.Multidisciplinary integration has become an inevitable trend in the research on driving forces of landscape patterns.With the characteristics of a problem-oriented landscape research,this field lacks cross-time,cross-space,multi-factor comparisons for a specific type of driving force.Thus,cross-board studies on the changes of landscape pattern would help with a better understanding of the mechanisms of the types of driving forces such as political systems and culture.

DOI

33
Xu J Y, Zhang Z X, Zhao X Let al., 2013. Spatial-temporal analysis of coastline changes in northern China from 2000 to 2012.Acta Geographica Sinica, 68(5): 651-660. (in Chinese)This study examined the spatial distribution of the continent coastline in northern China using remote sensing and GIS techniques,and calculated the fractal dimension of the coastline by box-counting method,with a time span from 2000 to 2012.Moreover,we analyzed the characteristics of spatial-temporal changes in the coastline's length and fractal dimension,the relationship between the length change and fractal dimension change,and the driving forces of coastline changes in northern China.During the research period,the coastline of the study area increased by 637.95 km,at an annual rate of 53.16 km.On the regional level,the most significant change of coastline length was observed in Tianjin and Hebei.Temporally,the northern China coastline extended faster after 2008.The most dramatic growth was found between 2010 and 2011,with an annual rate of 2.49%.The fractal dimension of the coastline in northern China was increasing during the research period,and the most dramatic increase occurred in the Bohai Rim.There is a strong positive linear relationship between the historical coastline length and fractal dimension,with the correlation coefficient being 0.9962.Through statistical analysis of a large number of local coastline changes,it can be found that the increase(or decrease) of local coastline length will,in most cases,lead to the increase(or decrease) of the whole coastline fractal dimension.Civil-coastal engineering construction was the most important factor driving the coastline change in northern China.

DOI

34
Xu L H, Gong H B, Li J L, 2015a. Comprehensive suitability assessment of coastline resources of Zhejiang province, China.Philippine Agricultural Scientist, 98(2): 224-236.ABSTRACT Coastlines are an important land resource in the 21st century, the marine century. A scientific and reasonable assessment of coastline resources will benefit the formulation of coastal development strategy and increase the comprehensive use efficiency of coastline resources. The use of remote sensing (RS) and geographic information system (GIS) helped to establish the system of indicators for the comprehensive suitability assessment of coastline resources with emphasis on production, human life and ecological protection. Of the total continental coastline of Zhejiang, the coastline with top priority given to production accounted for 4.9%; the coastline with moderate development, 10.3%; the coastline for residence and tourism, 21.9%; the coastline under ecological protection, 1.5%; and the reserve coastline, 61.4%. The coastlines have good port construction conditions and are located at the junction zone coast section of Pinghu City and Haiyan City, the southern mouth of the Yongjiang River, Ningbo to the north bank of Beilun, the coast of Xiangshangang Bay. These coastline sections are suitable for priority development or moderate development. The coastline sections that are suitable for urbanization or tourism development are located east of Haiyan City and northwest of Cixi City. Part of the coastline sections in the east of Xiangshan County and in the middle of Sanmen County need to be strictly protected due to its unique ecological service value.

35
Xu L H, Li J L, Yang Let al., 2015b. Integrated suitability evaluation on mainland coastline resources in Zhejiang province.China Land Sciences, 29(5): 49-56. (in Chinese)The purpose of this paper is to evaluate the coastline resource scientifically and reasonably, given the coastline resources becoming one of the important territorial resources in 21 st century(ocean century). It is not only benefit for making the coastal development strategy, but also can improve the efficiency of comprehensive utilization of coastline resources. Based on RS and GIS, an index system is established for evaluating the integrated suitability coastline resources in Zhejiang Province. The results show that 1) 4.9% of the mainland coastline in Zhejiang Province have the priority of developing; 10.3% coastline should be developed moderately; 21.9% coastline is suitable for travel and life; 1.5% coastline should be protected strictly; and 61.4% could be used as reserve bank. 2) The coastlines, such as between Pinghu and Haiyan City, south of Yong river in Ningbo City, Ningbo City coast of the Xiangshan port and Xiangshan coastline, have the excellent conditions for port construction, so they can be priority or moderate developed. 3) The coastline of east Haiyan and north-west Cixi City are suitable for the development of urban or tourism. 4) Some coastline of east Xiangshan, and middle of Sanmen County should be protected strictly because of the Special ecological service value.

36
Xu Y, Zhong Y X, Feng X Het al., 2017. Response of landuse change to the human activities in Jiangxi province.Research of Soil and Water Conservation, 24(1): 181-193. (in Chinese)

37
Yao X J, Gao Y, Du Y Yet al., 2013. Spatial and temporal changes of Hainan coastline in the past 30 years based on RS.Journal of Natural Resources, 18(1): 114-125. (in Chinese)Understanding of changes of coastline has significance in developing and protecting coastal resources.In this paper,based on the technology of GIS and RS,coastlines in the year of 1980,1990,2000 and 2010 of Hainan Island were interpreted from remote sensing images using baseline method.The analysis of spatial and temporal changes of coastlines and the driving forces shows that: Hainan Island coastline changes are mainly affected by human factors;the total length of the coastline had increased by 55.4 km in the past 30 years,which is evidently in the changes of artificial coastline;and the temporal and spatial variation that is mainly reflected in aquaculture reclamation,industrial land use,town and port construction,was significant,especially in southern region where is relatively flat.These results imply that the changes of Hainan Island might lead to a set of environment problems such as coastline erosion,and it is really particularly important to develop coastlines and use the coastal resources reasonably.

38
Yuan Q X, Li J L, Xu L Het al., 2014. Quantitative analysis of river morphological features in Xiangshangang Bay Basin.Journal of Marine Sciences, 32(3): 50-57. (in Chinese)

39
Yuan Q X, Li J L, Xu L Het al., 2015. Temporal and spatial variations of shoreline in tidal inlet system of Xiangshangang Bay and its relation to human activities in the past 40a.Journal of Applied Oceanography, 34(2): 279-290. (in Chinese)

40
Zhang Q M, Zheng D Y, Li S Net al., 1995. A study on the sediment dynamics of ebb-tidal delta of Zhanjiang harbor tidal inlet.Acta Geographica Sinica, 50(5): 421-429. (in Chinese)

41
Zhao Z Z, 2013. Mainland Shoreline Change Analysis of Fujian Province of 30 Years on Remote Sensing. Qingdao: Shandong University of Science and Technology. (in Chinese)

42
Zhou J, Chen B, Yu W W, 2011. Landscape pattern analysis and dynamic change in Quanzhou Bay.Marine Environmental Science, 30(3): 370-375. (in Chinese)Based on GIS-tech,landscape patterns in Quanzhou Bay of time series(1975~2008) were elaborated from the satelite images and charts.The landscape dynamic were analyzed by calculating landscape metrics,conversion matrix and landscape dynamic degree.The area of natural landscape diminished gradually,while artificial landscape(land for construction) was increased.Both landscape fragmentation and diversification intensified in the time period.Most of the natural landscape were transformed into the artificial landscape,and mangroves,rice grass and tidal flats had the most dramatic changes.With the impetus of population growth,economic benefit and policy guidence,human ativities intensified greatly,such as port construction,reclamation,aquaculture,which may be the main reason for the landscape change in QuanZhou Bay.

DOI

43
Zhu C G, Zhang X, Luo J Cet al., 2013. Automatic extraction of coastline by remote sensing technology based on SVM and auto-selection of training samples.Remote Sensing for Land and Resources, 25(2): 69-74. (in Chinese)The timely and accurate automatic extraction of coastline from satellite remote sensing imagery is one of the important applications of remote sensing technology and has great significance for management planning of the sea area.Because the spectral characteristics of coastal water are susceptible to regional environment,the traditional method of normalized difference water index(NDWI)threshold segmentation may easily misclassify water as land in the process of separation of land and water,which will seriously affect the accuracy of shoreline extraction.In this paper,on the basis of NDWI model,the authors proposed an automatic coastline extraction method based on classification sample auto-selection and support vector machine(SVM).Firstly,through the NDWI calculation and global threshold segmentation,the initial water distribution information is obtained.And then,the classification samples are selected automatically under the control of NDWI information.Thirdly,the water are separated from the land by using SVM classifier.The last step is to fill small terrestrial water body units and track coastline automatically.The experimental results show that this method can effectively enhance the capability of coastal water identification and improve the accuracy and automation of the coastline extraction from remote sensing imager.

DOI

Outlines

/