
Journal of Geographical Sciences >
Determination of land salinization causes via land cover and hydrological process change detection in a typical part of Songnen Plain
Author: Wang Zhiyong (1988-), PhD Candidate, specialized in water and salt cycle. E-mail: wangzy8809@gmail.com
Received date: 2017-10-12
Accepted date: 2018-01-26
Online published: 2018-08-10
Supported by
Key Deployment Project of CAS, No.KFZD-SW-314;National Natural Science Foundation of China, No.91547114
Copyright
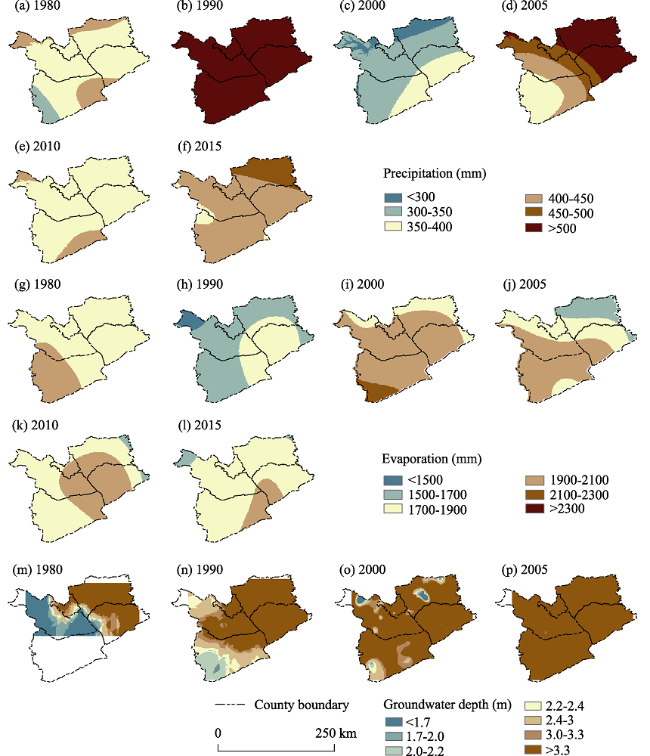
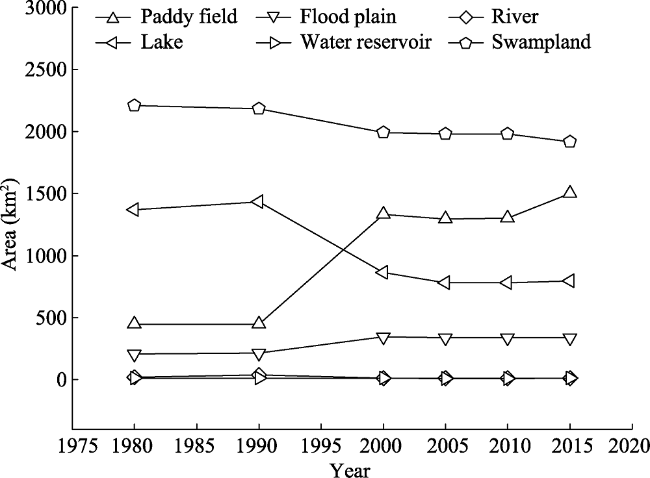
Causes of land salinization were determined via land cover and hydrological process change detection in a typical part of Songnen Plain. The area of saline land increased from 4627 km2 in 1980 to 5416 km2 in 2000, and then decreased to 5198 km2 in 2015. The transformation between saline land and other land covers happened mainly before 2000, and saline land had transformation relationship mainly with cropland, grassland, and water body. From 1979 to 2007, groundwater depth fluctuated to increase and was mainly deeper than 3.3 m. Spatially, the area of the region where groundwater depth was deeper than 3.3 m increased from 46.7% in 1980 to 84% in 2000, while the area of the region almost occupied the whole region after 2000. Precipitation and evaporation changed little, while runoff decreased substantially. Shallow groundwater, change of cropland, grassland, and water body induced from human activities and decrease of runoff and increase of irrigation and water transfer from outer basin were the main reasons for land salinization before 2000. After 2000, groundwater with relatively great depth could not exert great influence on land salinization. Protection of grassland and wetland prevented the increase of the area of saline land.
Key words: change detection; hydrological process; land cover; land salinization; Songnen Plain
WANG Zhiyong , LI Lijuan . Determination of land salinization causes via land cover and hydrological process change detection in a typical part of Songnen Plain[J]. Journal of Geographical Sciences, 2018 , 28(8) : 1099 -1112 . DOI: 10.1007/s11442-018-1544-3
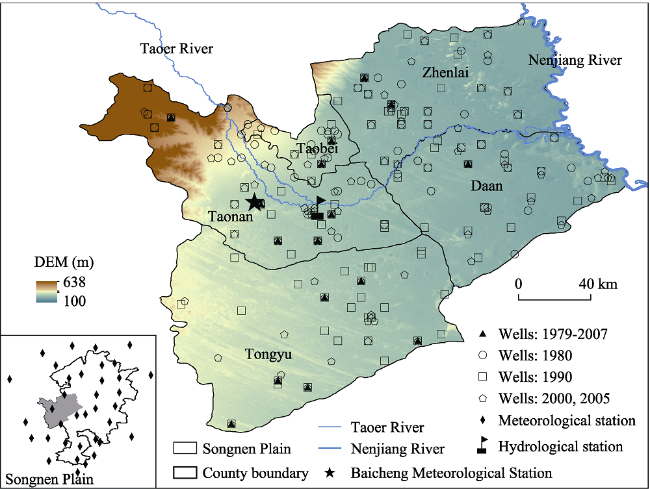
Figure 1 Location of the typical part of Songnen Plain |
Table 1 Area of land covers in the typical part of Songnen Plain (km2) |
| Year | Cropland | Woodland | Grassland | Water body | Built-up land | Unused land | Saline land |
|---|---|---|---|---|---|---|---|
| 1980 | 9259 | 572 | 6447 | 3769 | 531 | 459 | 4627 |
| 1990 | 9382 | 388 | 5856 | 3845 | 552 | 504 | 5137 |
| 2000 | 11816 | 1205 | 3325 | 3185 | 567 | 150 | 5416 |
| 2005 | 12003 | 1194 | 3363 | 3067 | 565 | 150 | 5322 |
| 2010 | 11983 | 1193 | 3363 | 3066 | 586 | 150 | 5323 |
| 2015 | 13278 | 1202 | 3327 | 1896 | 613 | 150 | 5198 |
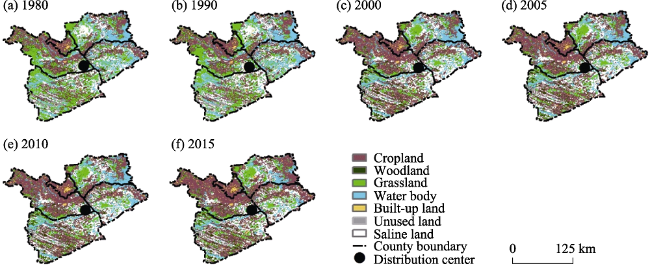
Figure 2 Land covers of the typical part of Songnen Plain |
Table 2 Transfer matrix of land covers in the typical part of Songnen Plain (km2) |
| Cropland | Woodland | Grassland | Water body | Built-up land | Unused land | Saline land | Total | ||
|---|---|---|---|---|---|---|---|---|---|
| 1990 | |||||||||
| 1980 | Cropland | 6521 | 130 | 1016 | 419 | 291 | 51 | 831 | 9259 |
| Woodland | 203 | 126 | 135 | 27 | 6 | 8 | 67 | 572 | |
| Grassland | 1125 | 69 | 3595 | 450 | 78 | 86 | 1044 | 6447 | |
| Water body | 472 | 16 | 372 | 2439 | 28 | 34 | 408 | 3769 | |
| Built-up land | 295 | 4 | 62 | 23 | 74 | 12 | 61 | 531 | |
| Unused land | 62 | 7 | 49 | 10 | 5 | 247 | 79 | 459 | |
| Saline land | 704 | 36 | 627 | 477 | 70 | 66 | 2647 | 4627 | |
| Total | 9382 | 388 | 5856 | 3845 | 552 | 504 | 5137 | 25664 | |
| 2000 | |||||||||
| 1990 | Cropland | 7022 | 366 | 478 | 364 | 308 | 13 | 831 | 9382 |
| Woodland | 168 | 132 | 37 | 11 | 4 | 1 | 35 | 388 | |
| Grassland | 2333 | 432 | 1625 | 380 | 67 | 54 | 965 | 5856 | |
| Water body | 705 | 54 | 336 | 2016 | 26 | 4 | 704 | 3845 | |
| Built-up land | 319 | 16 | 50 | 19 | 82 | 1 | 65 | 552 | |
| Unused land | 243 | 55 | 31 | 16 | 12 | 55 | 92 | 504 | |
| Saline land | 1026 | 150 | 768 | 379 | 68 | 22 | 2724 | 5137 | |
| Total | 11816 | 1205 | 3325 | 3185 | 567 | 150 | 5416 | 25664 | |
| 2005 | |||||||||
| 2000 | Cropland | 11765 | 5 | 19 | 10 | 1 | 0 | 16 | 11816 |
| Woodland | 14 | 1187 | 3 | 0 | 0 | 0 | 1 | 1205 | |
| Grassland | 56 | 1 | 3221 | 8 | 0 | 0 | 39 | 3325 | |
| Water body | 121 | 0 | 19 | 3008 | 0 | 0 | 37 | 3185 | |
| Built-up land | 3 | 0 | 0 | 0 | 564 | 0 | 0 | 567 | |
| Unused land | 0 | 0 | 0 | 0 | 0 | 150 | 0 | 150 | |
| Saline land | 44 | 1 | 101 | 41 | 0 | 0 | 5229 | 5416 | |
| Total | 12003 | 1194 | 3363 | 3067 | 565 | 150 | 5322 | 25664 | |
| 2010 | |||||||||
| 2005 | Cropland | 11974 | 0 | 5 | 0 | 23 | 0 | 2 | 12003 |
| Woodland | 1 | 1193 | 0 | 0 | 0 | 0 | 0 | 1194 | |
| Grassland | 5 | 0 | 3358 | 0 | 0 | 0 | 0 | 3363 | |
| Water body | 1 | 0 | 0 | 3066 | 0 | 0 | 0 | 3067 | |
| Built-up land | 2 | 0 | 0 | 0 | 563 | 0 | 0 | 565 | |
| Unused land | 0 | 0 | 0 | 0 | 0 | 150 | 0 | 150 | |
| Saline land | 1 | 0 | 0 | 0 | 0 | 0 | 5321 | 5322 | |
| Total | 11983 | 1193 | 3363 | 3066 | 586 | 150 | 5323 | 25664 | |
| Cropland | Woodland | Grassland | Water body | Built-up land | Unused land | Saline land | Total | ||
| 2015 | |||||||||
| 2010 | Cropland | 11874 | 26 | 21 | 14 | 23 | 0 | 25 | 11983 |
| Woodland | 17 | 1173 | 1 | 0 | 2 | 0 | 0 | 1193 | |
| Grassland | 88 | 0 | 3261 | 4 | 3 | 0 | 7 | 3363 | |
| Water body | 1162 | 2 | 11 | 1867 | 1 | 0 | 23 | 3066 | |
| Built-up land | 20 | 0 | 1 | 0 | 565 | 0 | 0 | 586 | |
| Unused land | 0 | 0 | 0 | 0 | 1 | 149 | 0 | 150 | |
| Saline land | 117 | 1 | 32 | 11 | 18 | 1 | 5143 | 5323 | |
| Total | 13278 | 1202 | 3327 | 1896 | 613 | 150 | 5198 | 25664 | |
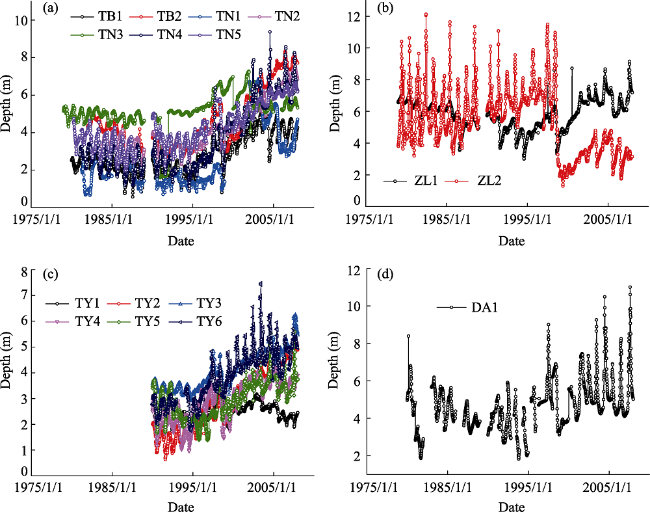
Figure 3 Temporal distribution of groundwater depth in the typical part of Songnen Plain |
Table 3 Ratio between data number in typical groundwater depth interval and the whole data number in one well (%) |
| Well number | Groundwater depth | ||||||
|---|---|---|---|---|---|---|---|
| <1.7 m | 1.7-2.0 m | 2.0-2.2 m | 2.2-2.4 m | 2.4-3 m | 3-3.3 m | >3.3 m | |
| DA1 | 0 | 0.7 | 1.2 | 0.8 | 5.0 | 2.5 | 89.8 |
| TB1 | 14.6 | 10.9 | 9.5 | 8.9 | 20.7 | 4.6 | 30.8 |
| TB2 | 0 | 0 | 0 | 0 | 10.0 | 16.0 | 74.0 |
| TN1 | 47.5 | 8.2 | 4.2 | 4.2 | 5.8 | 7.2 | 23.0 |
| TN2 | 0 | 0 | 0 | 1.1 | 11.9 | 13.7 | 73.4 |
| TN3 | 2.3 | 1.4 | 0 | 0 | 0 | 0 | 96.3 |
| TN4 | 3.7 | 7.8 | 8.4 | 7.8 | 19.6 | 8.7 | 43.9 |
| TN5 | 0 | 0 | 0.1 | 1.8 | 12.2 | 9.4 | 76.6 |
| TY1 | 0 | 5.1 | 14.8 | 23.1 | 51.2 | 5.6 | 0.2 |
| TY2 | 18.8 | 8.3 | 5.9 | 6.1 | 13.4 | 3.4 | 44.2 |
| TY3 | 0 | 0 | 0 | 0 | 1.7 | 11.6 | 86.7 |
| TY4 | 8.8 | 7.9 | 6.7 | 5.1 | 20.9 | 11.3 | 39.3 |
| TY5 | 3.2 | 4.0 | 6.5 | 12.7 | 23.4 | 13.7 | 36.4 |
| TY6 | 0 | 0 | 2.0 | 5.1 | 16.0 | 11.4 | 65.6 |
| ZL1 | 0 | 0 | 0 | 0 | 0 | 0.4 | 99.6 |
| ZL2 | 0.2 | 1.4 | 2.5 | 1.9 | 7.6 | 4.1 | 82.1 |
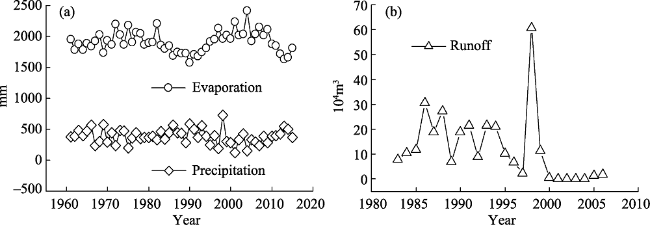
Figure 4 Temporal distribution of evaporation, precipitation and runoff in the typical part of Songnen Plain |
Figure 5 Spatial distribution of precipitation, evaporation and groundwater depth in the typical part of Songnen Plain |
Table 4 Groundwater depth threshold induced for soil salinization in Songnen Plain (Geological Survey Institute of Jilin Province, 2006) |
| Soil texture | Soil salinization level | Groundwater depth threshold (m) |
|---|---|---|
| Sandy loam | Non | >3.3 |
| Light | 2.4-3.3 | |
| Middle | 2.0-2.4 | |
| Heavy | <2.0 | |
| Clay loam | Non | >3.0 |
| Light | 2.2-3.0 | |
| Middle | 1.7-2.2 | |
| Heavy | <1.7 |
Figure 6 Change of area of region covered by water in the typical part of Songnen Plain |
The authors have declared that no competing interests exist.
| 1 |
|
| 2 |
|
| 3 |
|
| 4 |
FAO, 2007. Extent and causes of salt-affected soils in participating countries. AGL: Global Network on Integrated Soil Management for Sustainable Use of Salt-affected Soils. .
|
| 5 |
|
| 6 |
Geological Survey Institute of Jilin Province (GSIJP), 2006. Evaluation of groundwater resources and environmental problems in Songnen Plain. (in Chinese)
|
| 7 |
|
| 8 |
|
| 9 |
|
| 10 |
|
| 11 |
|
| 12 |
|
| 13 |
|
| 14 |
|
| 15 |
|
| 16 |
|
| 17 |
|
| 18 |
|
| 19 |
|
| 20 |
|
| 21 |
|
| 22 |
|
| 23 |
|
| 24 |
|
| 25 |
|
| 26 |
|
| 27 |
UNEP, 1991. Status of desertification and implementation of the United Nations plan of action to combat desertification. Nairobi, Kenya.
|
| 28 |
|
| 29 |
|
| 30 |
|
| 31 |
|
| 32 |
|
| 33 |
|
| 34 |
|
/
| 〈 |
|
〉 |