研究论文

Characteristic of tradeoffs between timber production and carbon storage for plantation under harvesting impact: A case study of Huitong National Research Station of Forest Ecosystem

  • ZHU Jianjia , 1, 2 ,
  • DAI Erfu , 1, 2, * ,
  • ZHENG Du 1, 2 ,
  • WANG Xiaoli 1, 2, 3
Expand
  • 1. Key Laboratory of Land Surface Pattern and Simulation, Institute of Geographic Sciences and Natural Resources Research, CAS, Beijing 100101, China
  • 2. University of Chinese Academy of Sciences, Beijing 100049, China
  • 3. National Marine Data and Information Service Center, Tianjin 300171, China
*Corresponding author: Dai Erfu (1972-), PhD and Professor, specialized in climate change and its regional response, and simulation of LUCC. E-mail:

Author: Zhu Jianjia (1987-), PhD, E-mail:

Received date: 2017-07-25

  Accepted date: 2017-08-30

  Online published: 2018-08-10

Supported by

The National Basic Research Program of China (973 Program), No.2015CB452702;National Natural Science Foundation of China, No.41571098, No.41530749;Key Programs of Chinese Academy of Sciences, ZDRW-ZS-2016-6-4-4;Major Consulting Project of Strategic Development Institute, Chinese Academy of Sciences, No.Y02015003;China Clean Development Mechanism Fund Grant Program (Climate Change Risk and Countermeasures in Xinjiang Region)

Copyright

Journal of Geographical Sciences, All Rights Reserved

Abstract

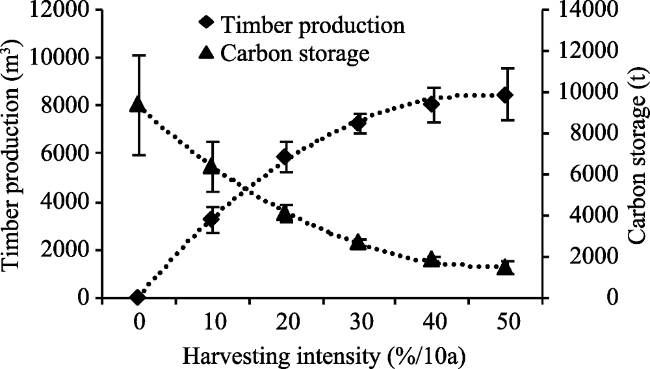
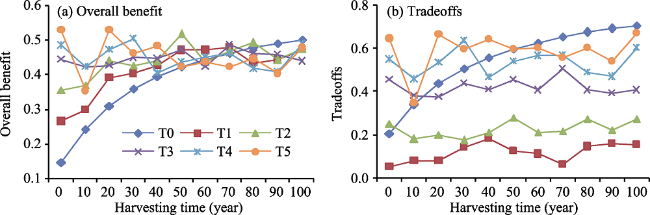
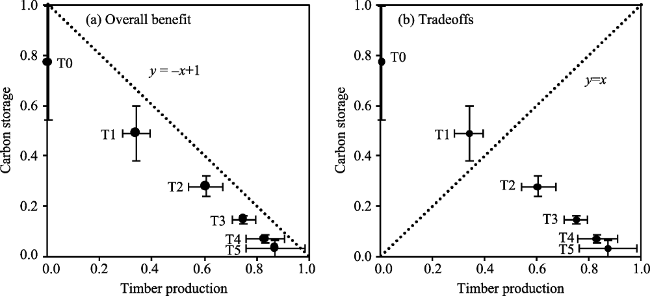
The tradeoffs and optimizations of ecosystem services are the key research fields of ecology and geography. It is necessary to maximize the overall benefit of timber production and carbon storage for forest ecological development in China. We selected the Huitong National Research Station of Forest Ecosystem as our study area, and used InVEST model to evaluate timber production and carbon storage quantitatively. The results showed that: (1) While timber production increased with harvesting intensity over the planning horizon, carbon storage decreased. There were tradeoffs between timber production and carbon storage according to the significant negative relationship. (2) While the overall benefit of timber production and carbon storage increased with harvesting intensity, the value of tradeoffs decreased. T1 and T2 scenarios, with harvesting intensity of 10%-20% every 10 years, are the optimum management regimes for the two ecosystem services to gain more benefit and less tradeoffs. (3) The current harvesting intensity in Huitong County was slightly higher than the optimum harvesting intensity. On practical dimension, these findings suggested that obvious objectives are needed to formulate the corresponding countermeasures of tradeoffs, in order to realize the improvement of ecosystem services and the optimization of ecosystem structures.

Cite this article

ZHU Jianjia , DAI Erfu , ZHENG Du , WANG Xiaoli . Characteristic of tradeoffs between timber production and carbon storage for plantation under harvesting impact: A case study of Huitong National Research Station of Forest Ecosystem[J]. Journal of Geographical Sciences, 2018 , 28(8) : 1085 -1098 . DOI: 10.1007/s11442-018-1543-4

1 Introduction

Ecosystem services provide manifold products and services for humanity and are a foundation for the survival and development of human society (Fu et al., 2009; Ouyang and Zheng, 2009). Costanza (1997) assessed the total value of global ecosystem services, causing the public to be cognizant of the integrality of ecosystem services and consequently leading to an upsurge in domestic and foreign scholarly research on ecosystem services. In early stages of research, the main focus should be on aspects such as the concept and classification system of ecosystem services (Daily, 1997; de Groot et al., 2002; MA, 2005) and the evaluation of the quality and value of ecosystem services (Ouyang et al., 1999; Nelson et al., 2009; Bangash et al., 2013). With more and more in-depth research, people have discovered that, in the case of increasingly prominent constraints on natural resources, the increase of ecosystem services often leads to a reduction in other services (Tallis et al., 2008), especially those providing services increased at the cost of regulating services, cultural services, and biodiversity loss (Rodríguez et al., 2006; Bennett and Balvanera, 2007). In other words, there is a tradeoff relationship between different services (Li et al., 2013; Zheng et al., 2016; Feng et al., 2016; Wang et al., 2016). Clarifying the relationship and process of tradeoffs between various ecosystem services and maximizing the ecological and economic benefits, in order to provide important scientific basis for regional ecosystem management and sustainable forest management.
The total area of Chinese plantations is 0.79 × 10⁸ hm2, which is 28.4% of the total global plantation area and 38% of the total area of forest resources in China, making China the top contributing country to total global plantation area (CSFA, 2014; Payn et al., 2015). Also, the plantation area of China has increased rapidly by 0.44 × 10⁸ hm2 during 2005-2013, and in 2100, the addition of carbon storage was predicted 1.5 times of the total forest carbon sinks over the last 20 years. Thus, plantation in China has a huge potential of carbon sequestration in the future (Fang et al., 2015; Liao et al., 2016). With the area of natural forest dwindling, plantations not only have to provide timber, but also take an important responsibility for multiple ecosystem services including carbon storage, water retention, water quality purification, soil conservation and so on. It becomes the crux of sustainable forest management that how to obtain more timber products while preventing the destruction of ecological and environmental quality as far as possible (Baskent et al., 2008).
At present, domestic and foreign scholars have carried out much research on the tradeoffs between providing and regulating services of forest ecosystem and multi-objective forest management. For example, Baskent (2008) used linear programming mathematical models (LP-based models) to maximize the net present value (NPV) of carbon storage, timber production, and oxygen release. Using the LINGO software, Rong (2012) established a programming model with the goal of maximizing the amount of NPV for timber production and aboveground carbon, he also found an increase in carbon storage came at the expense of a reduction in timber production. Fotakis (2012) proposed a type of Spatial Non-Sorting Genetic Algorithm (Spatial NSGA), established a forest management model targeted towards maximization of timber production and minimization of soil erosion, and analyzed the tradeoff relationship between the two. However, the above models are mostly based on complex mathematical methods and modeling frameworks, and forest managers and policy makers have difficulty using them extensively. Bradford and D’Amato (2012) constructed a simple multi-objective management model, using both overall benefits (means) and tradeoffs (standard deviations) to formulate the optimal management plan in order to provide forest managers and policy makers with a simple and feasible model.
The southern red-soil hilly area is one of the major plantation regions in China, and the plantation stocking volume makes up about 50% of China’s total plantation stocking volume, which is a significantly important research area (MWRC et al., 2010; CSFA, 2014). Huitong county of Hunan province is a central production region of one of the main Chinese plantation tree species, Cunninghamia lanceolata. We chose the Huitong National Research Station of Forest Ecosystem (Huitong eco-station) with long-term observational data on the Moshao Forest Farm as the study area with two kinds of ecosystem services, timber production and carbon storage, as the typical representatives of providing and regulating services, respectively. By setting up forest management regimes with different harvesting intensities, analyzing trends during the planning period of providing and regulating services, and calculating the overall benefit and tradeoffs of them under different management regimes, we can select a forest management program that will maximize the overall benefits of local forest ecosystem, thus helping us for the formulation of tradeoffs strategies to consider the sustainable management of plantations in southern China.

2 Study area

The Moshao Forest Farm in Huitong Eco-station, with a total area of 98.24 hm2, is situated on the Yunnan-Guizhou Plateau towards the transitional zone of the hilly region south of the Yangtze River with low mountain landform at an elevation of 300-580 m and a slope between 25 and 35 degrees; the terrain shows a gradual decline from northwest to southeast. The area belongs to a humid subtropical monsoon climate. The average annual temperature from 1998-2013 was 16.36℃, and the average annual precipitation is 1137.32 mm (according to the observational data from Huitong eco-station’s automatic weather station). The soil is mountainous yellow soil, and the soil layer thickness is generally 80 cm. According to eco-geographical regionalization, the study area lies in the mid-subtropical humid zone of the Hunan-Guizhou plateau’s mountainous region in a broad-leaved evergreen forest region. The natural zonal vegetation mainly consists of Castanopsis and Lithocarpus, subtropical evergreen broad-leaved forests (Zheng et al., 2008).
The forest vegetation map of the study area was compiled based on from a Pléiades satellite image with a 0.5 m × 0.5 m resolution. The forest farm contains natural forests of 51.68 hm2 and plantations of 46.56 hm2. The dominant species are Castanopsis fargesii, Cyclobalanopsis glauca and Machilus pauhoi in natural broad-leaved forest, Cunninghamia lanceolata and Pinus massoniana in the planted forest (Figure 1).
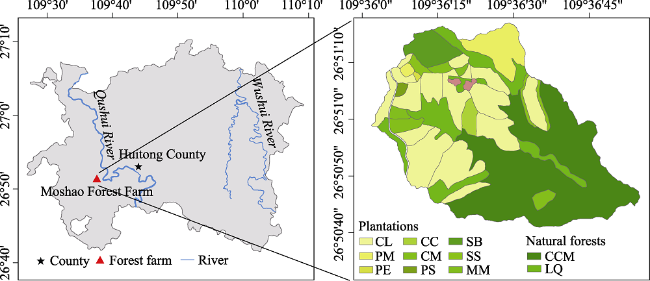
Figure 1 Location and forest vegetation map of Moshao Forest Farm in Huitong eco-station. CL=Cunninghamia lanceolata, PM=Pinus massoniana, PE=Pinus elliottii, CC=Cunninghamia lanceolata and Cinnamomum camphora, CM=Cunninghamia lanceolata and Michelia macclurei, PS=Pinus massoniana and Schima superba, SS=Schima superba, MM=Michelia macclurei, LQ=Liquidambar formosana and Quercus fabri, SB=Schima superba and Bretschneidera sinensis, and CCM=Castanopsis fargesii, Cyclobalanopsis glauca and Machilus pauhoi.

3 Data and methods

Synthetically using the tradeoffs method provided by Bradford and D’Amato (2012) and Integrated Valuation of Ecosystem Services and Tradeoffs (InVEST) model, we proposed a conceptual framework of forest ecosystem service tradeoffs between providing service (timber production) and regulating service (carbon storage) under the influence of harvesting (Figure 2). First of all, we selected typical forest farm and evaluated timber production and carbon storage quantitatively by InVEST model. Then, we constructed several tradeoffs scenarios of different harvesting intensities, tradeoffs method based on mean and standard deviation was used to clarify the tradeoffs mechanism between providing and regulating services. Finally, we revealed the tradeoffs characteristics of multiple ecosystem services under different harvesting intensities.
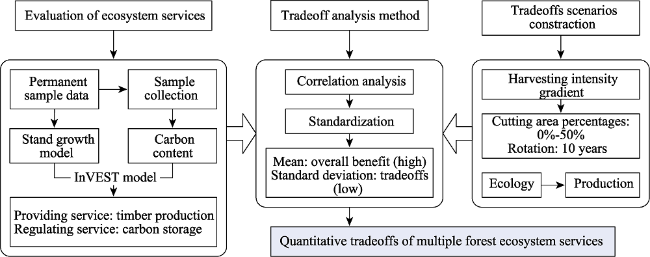
Figure 2 Conceptual framework of forest ecosystem service tradeoffs

3.1 Stand growth model simulation

Because growth rate of trees shows a “slow-fast-slow-end” trend with increasing age, the S-shaped curve can be used to describe it (Vonbertalanffy, 1957; Richards, 1959; Zeide, 1989).
From 1983-1990, Moshao Forest Farm in Huitong eco-station on the established different types of plantations, and set the fixed sample plot size to 10 m × 20 m. Since the establishment of the stand, the diameter and height of the trees within the plots have been measured year after year. Our research chose the Michelia macclurei forest planted in 1983, the Cuninghamia lanceolata forest planted in 1983, the Cuninghamia lanceolata-Michelia macclurei mixed forest planted in 1983, the Schima superba forest planted in 1987, the Pinus massoniana forest planted in 1987, the Pinus massoniana-Schima superba mixed forest planted in 1987, the Cuninghamia lanceolata forest planted in 1990, and the Cuninghamia lanceolata-Cinnamomum camphora mixed forest planted in 1990. These eight forests were used to simulate the growth equations of the main tree species on the Moshao Forest Farm. Based on these permanent sample plot data, we tried to use power function equation, logarithmic equation, logistic equation, Richards equation and S-curve equation to fit stand growth model, and we found that S-curve equation (y=eb0+b1k.) (with the highest significance level) was a logical choice for the stand growth equations in this study.
First, the biomass of each species’ various organs (stem, branch, leaf, bark, root) was calculated year after year in accordance with the biomass models of different tree species (Sun et al., 2012). Then, the S-shaped curve equation was applied to fit the annual changing curve of the biomass of each species’ various organs, thereby obtaining the growth models (Table 1).
Table 1 Growth models of main tree species of Moshao Forest Farm in Huitong eco-station
Forest types Organs Stand growth models Correlation coefficient and
significance level
Number of trees
of stand plots
Pinus massoniana Stem y=e5.666-33.687/x R2 = 0.994, P < 0.001 42
Branch y=e4.851-42.961/x R2 = 0.994, P < 0.001
Leaf y=e4.557-45.786/x R2 = 0.994, P < 0.001
Bark y=e3.404-33.639/x R2 = 0.994, P < 0.001
Root y=e4.911-39.678/x R2 = 0.994, P < 0.001
Michelia macclurei Stem y=e5.485-27.760/x R2 = 0.991, P < 0.001 37
Branch y=e4.626-26.297/x R2 = 0.991, P < 0.001
Leaf y=e3.191-24.898/x R2 = 0.991, P < 0.001
Bark y=e3.340-23.831/x R2 = 0.991, P < 0.001
Root y=e4.536-23.927/x R2 = 0.991, P < 0.001
Schima superba Stem y=e5.025-32.623/x R2 = 0.990, P < 0.001 37
Branch y=e4.191-30.904/x R2 = 0.990, P < 0.001
Leaf y=e2.632-25.874/x R2 = 0.991, P < 0.001
Bark y=e2.946-28.006/x R2 = 0.990, P < 0.001
Root y=e4.140-28.119/x R2 = 0.990, P < 0.001
Cunninghamia lanceolata Stem y=e5.462-22.408/x R2 = 0.982, P < 0.001 20
Branch y=e3.606-23.411/x R2 = 0.982, P < 0.001
Leaf y=e4.692-18.100/x R2 = 0.982, P < 0.001
Bark y=e3.248-15.805/x R2 = 0.982, P < 0.001
Root y=e2.459-10.460/x R2 = 0.975, P < 0.001
Cinnamomum camphora Stem y=e6.810-43.013/x R2 = 0.994, P < 0.001 24
Branch y=e5.881-40.748/x R2 = 0.994, P < 0.001
Leaf y=e4.450-39.484/x R2 = 0.991, P < 0.001
Bark y=e4.478-36.926/x R2 = 0.994, P < 0.001
Root y=e5.678-37.075/x R2 = 0.994, P < 0.001

3.2 Assessment of ecosystem services

3.2.1 Timber production
We chose the Timber module of InVEST model to calculate timber production at Moshao Forest Farm. The InVEST model is the most widely applied ecosystem service evaluation model and has been successfully applied to multiple regions, including China, the Mediterranean, Sumatra, and the USA (Bangash et al., 2013; Delphin et al., 2013; Bhagabati et al., 2014; Pan et al., 2015). The following equation was used to calculate timber production volume:
$TVolume=\underset{x=1}{\overset{n}{\mathop \sum }}\,Parcl\_are{{a}_{x}}\times \frac{Perc\_har{{v}_{x}}}{100}\times Harv\_mas{{s}_{x}}\times \frac{1}{{{D}_{x}}}$ (1)
where TVolume is the total timber production volume of the xth forest (m3); Parcl_areax is the area of the xth forest (hm2); Harv_massx is the stem biomass of the xth forest (t/hm2); and Dx is the average timber density of the xth forest (g/cm3).
The stem biomass for each forest type can be calculated with growth models above-mentioned (Table 1). Then, the biomass of timber production was converted to the forest stock volume using the average basic density of the timber. The average basic density of timber was found in the timber density table of the major tree species (RIWI and CAF, 1982).
3.2.2 Carbon storage of trees
In July 2014, 131 samples containing stem, branch, leaf, bark, and root were collected for the dominant tree species of each forest stand (the top three, ranked by quantity); each sample was about 300 g. The samples were dried and then ground; the organic carbon content was subsequently determined using the potassium dichromate sulfuric acid oxidation method (Dong et al., 1997).
The amount of carbon storage in the tree layer (stem, branch, leaf, bark, and root) was determined by multiplying the biomass per unit area by the corresponding carbon content, which was then multiplied by the stand area (Equation 2). The tree layer biomass of each component was obtained according to the tree age and the growth model; the carbon content of different organs was observed data.
$TOC=\sum\limits_{i=1}^{n}{({{B}_{i}}\times {{C}_{i}})\times \frac{1}{1000}}$ (2)
where TOC is the carbon density of tree layer (t/hm2); Bi is the biomass per unit area of the ith component; Ci is the carbon content of the ith component; 1/1000 is the coefficient of unit conversion.

3.3 Methods for ecosystem services tradeoffs

Tradeoffs relationship between timber production and carbon storage was quantified according to the conceptual framework of forest ecosystem service tradeoffs (Figure 2). First, using the Person correlation coefficient method to analyze the interactive relationship between the two ecosystem services. Second, because each ecosystem service dimension is not the same, in order to calculate the overall benefit and tradeoffs of multiple ecosystem services, data must be standardized, making the data range between 0 and 1 (Equation 3). The overall benefit of multiple ecosystem services is the average value of the ecosystem services after standardization. The magnitude of the tradeoffs between more ecosystem services is represented by a standard deviation. Finally, with the help of the diagonal graphic method, the optimal management regime should be determined by intuition. The objective of multi-objective forest management in this study is to maximize the overall benefit of timber production and carbon storage and to minimize the tradeoffs.
${{B}_{A}}=\frac{A-{{A}_{\min }}}{{{A}_{\max }}-{{A}_{\min }}}$ (3)
where BA is the benefit for ecosystem service A after standardization; A is the benefit for ecosystem service A; Amax and Amin are the maximum value and minimum value for ecosystem A, respectively.
Figure 3a shows the overall benefit of timber production and carbon storage. The point on the diagonal line y =-x+1 gives 0.5 as the overall benefit: the closer to the upper right corner, the higher the overall benefit. Figure 3b shows the tradeoffs between timber production and carbon storage. The point on the diagonal line y=x indicates the two are equal, so the tradeoffs is zero. On the upper left part of the diagonal line, carbon storage is greater than timber production. On the lower right corner of the diagonal line, timber production is greater than carbon storage. The closer the distance to the diagonal line, the smaller the tradeoffs. Therefore, combining Figures 3a and 3b, we can conclude that the closer to the upper right corner and the closer to the diagonal line y=x, the higher the overall benefit of timber production and carbon storage, the smaller the tradeoffs.
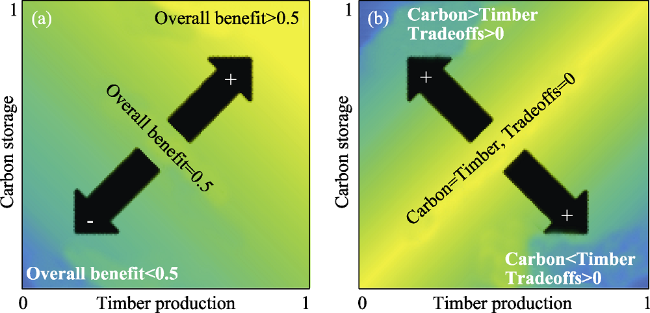
Figure 3 Illustration of overall benefit and tradeoffs between timber production and carbon storage (Modified from Bradford and D'Amato, 2012)

3.4 Forest management regimes identification

The previous studies found that provisioning services first increase and then decrease with the amplification of harvesting intensity; the regulating services and the supporting services gradually decrease; when the harvesting intensity remains at a low level, the cultural services of the forest ecosystem are the greatest (Braat and ten Brink, 2008). The realization of the sustainable management of forests must take environmental protection, biodiversity enhancement, economic benefit, and social function into consideration (Baskent et al., 2008). Therefore, tradeoffs scenarios of different management regimes were created by considering harvesting intensity gradient. With the amplification of cutting intensity, the production function of the forest increased, whereas the ecological function gradually decreased.
Based on the statistical data came from Forestry Department in Huitong County from 2010 to 2014, the local harvesting intensity is harvesting 2.26% of the plantation area every year, which is approximate equivalent to harvesting 22.6% of the plantation area every 10 years. By extending the local harvesting intensity, six management regimes were created to represent combinations of possible management criteria: cutting area percentages of 0%-50%; rotation is 10 years; harvesting principles of small-area clear-cutting (≤ 5 hm2) (Table 2). The harvesting intensity increased from T0 to T5, and each of these management regimes was applied over a 100 year planning horizon. According to government regulations (Technical Survey and Design Requirements for the Forest Harvesting Area in Hunan Province, China), cutting rotation of all plantation species were regulated as follows: 18 years for Pinus elliottii, 21 years for Cunninghamia lanceolata, 26 years for Pinus massoniana and Schima superba, 41 years for Cinnamomum camphora and Michelia macclurei.
Table 2 Potential management regimes of Moshao Forest Farm in Huitong eco-station
Management regimes Cutting area percentages/% Rotations/year Harvest principles
T0 0 10 small-area clear-cutting (cutting areas ≤5 hm2 and interval areas between cutting areas ≥cutting area)
T1 10
T2 20
T3 30
T4 40
T5 50

4 Results

4.1 Variations in timber production and carbon storage due to harvesting time

Under different management regimes, timber production and carbon storage showed different change characteristics dependent upon harvesting time (Figure 4). Under the T0 management regime, without harvesting activities, timber production was zero; with the natural growth of the forest, the tree biomass gradually increased. Carbon storage also showed an S-shaped curve. Changes in timber production and carbon storage are closely related to forest growth; consequently, they increase with increased harvesting intensity. From harvesting 10% of the total area every 10 years to harvesting 50% of the total area every ten years, the two kinds of ecosystem services show different change characteristics depending on the harvesting time. Under the T1 and T2 management regimes with relatively low harvesting intensities, timber production increased slightly with harvesting time, and carbon storage still showed an S-shaped curve over time. Under the T4 and T5 management regimes with relatively high harvesting intensities, timber production and carbon storage both showed a downward trend in correlation with the harvesting time. Under the T3 management regimes, timber production and carbon storage were relatively stable in correlation to time. Corresponding to increases in harvesting intensity, the fluctuation in timber production gradually became more and more severe.
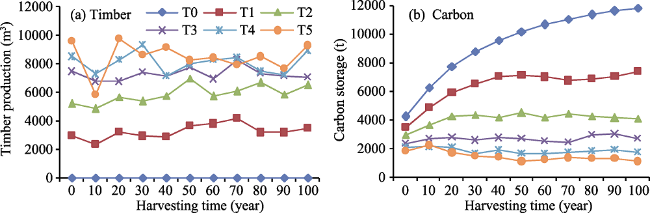
Figure 4 The variance of timber production (a) and carbon storage (b) with harvesting time

4.2 Variations in timber production and carbon storage due to harvesting intensity

There was a significant correlation between the two ecosystem services and the harvesting intensity for each of the 10 years in which the range of harvesting intensity produced a total harvested area of 0%- 50% (Figure 5). Due to the impact of forest growth, timber production and carbon storage showed a curve variation in relation to harvesting intensity. Timber production increased with the increase of harvesting intensity, while carbon storage decreased. The forest’s timber production service was the highest under the T5 management regime, while the forest’s carbon storage service was the highest under the T0 management regime. Timber production and carbon storage were significantly negatively correlated (R=-0.907, P<0.001) and showed a strong tradeoffs relationship.
Figure 5 The relationship between harvesting intensities and timber production (a) and carbon storage (b). Error bar represents the standard deviation.
Binomial regression equation of timber production with harvesting intensity:
y = -3.873x2 + 359.719x + 51.044 (R² = 0.999, P < 0.001)
Binomial regression equation of carbon storage with harvesting intensity:
y = 3.363x2 - 323.710x + 9319.317 (R² = 0.999, P < 0.001)

4.3 Overall benefit and tradeoffs of timber production and carbon storage

The average overall benefit of timber production and carbon storage was 0.43 ± 0.07, and the average tradeoffs value was 0.41 ± 0.19. With the lack of harvesting activities under the T0 management regime, the overall benefit and the tradeoffs value both increased with the increase of harvesting time and reached the maximum in 100 years. Under the T1 and T2 management regimes, the overall benefits of timber production and carbon storage in the first 50 years showed an increasing trend corresponding to the harvesting time, and the changes were steady and unvaried after 50 years. The overall benefits under the T3, T4, and T5 management regimes and the tradeoffs values under the T1-T5 management regimes fluctuated in correlation to the harvesting times and did not show a significant upward or downward trend.
In this study with six management regimes of different intensities, the overall benefit of timber production and carbon storage increased with increased harvesting intensities. The overall benefit of the T0 management regime was the lowest, with an average of 0.39 ± 0.11. The overall benefit of the T5 management regime was the highest, with an average of 0.45 ± 0.05. The tradeoffs values of the two regimes correlate to the harvesting intensity, first falling and then rising; going from big to small, the values were as follows (Figure 6): T5 (0.59 ± 0.09) > T0 (0.55 ± 0.16)> T4 (0.54 ± 0.06) > T3 (0.42 ± 0.04) > T2 (0.23 ± 0.04) > T1 (0.12 ± 0.04).
Figure 6 The overall benefits (a) and tradeoffs (b) of timber production and carbon storage

5 Discussion

5.1 Tradeoffs between providing and regulating services

The numerous ecosystem services that human society relied on are not independent of each other, and that the relationships between them are tradeoffs and synergies of different degrees (Rodriguez et al., 2006; Bennett et al., 2009). Our study found that tradeoffs between providing services (timber production) and regulating services (carbon storage) existed at regional scale under the impact of forest harvesting management. The increase of timber production was at the expense of forest loss, which resulting in the reduction of carbon storage directly. These results are consistent with Feng et al. (2016) and Wang et al. (2017), the implementation of China’s Grain-for-Green Programme (GFGP) increased forest area, leading to increase of regulating services such as soil conservation and carbon storage, and decrease of providing services such as water yield. However, the interactive relationships were more complex in the study of ecosystem services based on the present situation. For example, synergies relationship instead of tradeoffs between water providing and regulating services were found in some studies (Bai et al., 2011; Qiu and Turner, 2013), and the relationships among non-production services were not always synergies (Dixon et al., 1993). It proved that the relationships among ecosystem services were complex, and the tradeoffs and synergies may be driven mainly by regional differences and human activity (Raudsepp-Hearne et al., 2010).

5.2 Identifying the multi-objective forest management regime

The six management regimes all fell on the lower left corner of the diagonal line, y=-x+1. The overall benefit was< 0.5, and the differences in overall benefits between the different management regimes were relatively small (Figure 7a). Two of the management regimes, T0 and T1, were situated on the upper left corner of the diagonal line, y=x, where the carbon storage was greater than timber production. This illustrated that a relatively low harvesting intensity was beneficial to the accumulation of forest carbon storage, while simultaneously limiting the development of timber production. The T2-T5 management regimes were situated on the lower right corner of the y=x diagonal line, where the timber production was greater than carbon storage. This illustrated that under a relatively high harvesting intensity, the ability of the forest to provide timber was comparatively strong. However, due to the decrease in the forest stand, carbon storage services also subsequently decreased. Looking at the range of the diagonal line, y=x, the tradeoffs between timber production and carbon storage under the T1 and T2 management regimes was relatively small (Figure 7b). Combining the results of the overall benefit and tradeoffs, it may be concluded that the tradeoff relationship between timber production and carbon storage is obvious, with comparatively low overall benefit, and the management regimes that are relatively suitable for the coordinated development of these two ecosystem services are the T1 and T2 management regimes.
Figure 7 The relationship between individual benefits of timber production and carbon storage. Error bar represents the standard deviation.
By comparing results of multiple forest management regimes and the investigation of local harvesting regime, the deviation of ecosystem services tradeoffs method was used to quantitatively analyze the overall benefit and tradeoffs between multiple ecosystem services, then the tradeoffs mechanism between timber production and carbon storage was exhibited with the help of the diagonal graphic method. We found that the current harvesting intensity of Huitong County (22.6% of the total area of plantations harvested every 10 years) was slightly higher than the optimum harvesting intensity. In future development of plantations, more benefits from forests can be obtained by reducing the harvesting intensity appropriately. Using the tradeoffs method provided by Bradford and D’Amato as a reference, we proposed a conceptual framework of forest ecosystem service tradeoffs between timber production and carbon storage which can achieve the quantitative tradeoffs between providing and regulating services. Therefore, according to our conclusions, forest management objectives should be made clear, then by using the deviation of ecosystem services tradeoffs method, corresponding countermeasures of tradeoffs will be formulated in order to realize the improvement of ecosystem services.

5.3 Limitations and future research prospects

We simulated future ecosystem services, assuming that tree growth was only influenced by harvesting activities, and the regeneration method was artificial regeneration. However, climate change and forest fires were also main factors that affect forest growth. Future research should consider changes in more factors and try to simulate the change characteristics of forest ecosystem services under naturally regenerating circumstances, focusing on doing large-scale simulations on plantations in southern China, then realizing ecosystem services tradeoffs across space. In the simulation of the tree growth equation, the interference of harvesting, climate change, fire, and other factors (Wang, 2013) should be taken into account to reduce error in the simulation results. In addition, the key point of sustainable forest management is to try to give full play to the ecological functions of the forest while simultaneously acquiring forest timber products (Baskent et al., 2008). We chose timber production and carbon storage to analyze the tradeoffs between providing and regulating services. The focus of future work is to use more forest ecosystem services (such as water conservation, soil retention, windbreak and sand fixation, and biodiversity, etc.) as multi-object¬ive management targets to create a more comprehensive balance between forest production and ecological functions.

6 Conclusions

Setting the forest providing service (timber production) and regulating service (carbon storage) as forest management objectives, using Moshao Forest Farm in Huitong eco-station as the study area, and looking at the overall benefit and tradeoffs of timber production and carbon storage, optimal management regimes for local forest growth rules could be clearly determined. A scientific basis for the sustainable management of the plantations of the red-soil hilly region of southern China can be provided. The main conclusions are as follows:
(1) As harvesting intensifies, timber production continuously increases, and carbon storage continuously decreases. Due to the impact of forest growth, the two show a curve variation in relation to harvesting intensity. There is a significant negative correlation between timber production and carbon storage (R=-0.907, P<0.001) and also a strong tradeoffs relationship.
(2) The overall benefit of timber production and carbon storage increases as harvesting intensity increases. The T5 management regime with a harvesting intensity of 50% every 10 years has the highest overall benefit; the tradeoffs correlates to the harvesting intensity, first falling and then rising. The T1 management regime with a harvesting intensity of 10% every 10 years has the lowest tradeoffs value. The management regimes with harvesting intensities between 10%-20% every 10 years can realize the coordinated development of timber production and carbon storage.
(3) The current harvesting intensity in Huitong County is above the optimal harvesting intensity, more benefits from forests can be obtained by reducing the harvesting intensity appropriately. While drafting a future forest management regime for southern China, forest management objectives should be made clear, and formulating corresponding tradeoffs countermeasures in order to achieve forest ecosystem services enhancement and structure optimization.

The authors have declared that no competing interests exist.

1
Bai Y, Zhuang C W, Ouyang Z Yet al., 2011. Spatial characteristics between biodiversity and ecosystem services in a human-dominated watershed.Ecological Complexity, 8(2): 177-183.Biodiversity and ecosystem services are intrinsically linked. Since human activities have both intensive and extensive impacts on the environment, it is critical to understand spatial relationships between conservation priorities for biodiversity and ecosystem services. The manner in which various aspects of biodiversity relate to ecosystem services and the spatial congruence between biodiversity and these services, is, however, unclear. In the present study in the Baiyangdian watershed, China, we investigated spatial characteristics of biodiversity and ecosystem services using correlation, overlap, and principal component, analyses. The spatial correlations between biodiversity and ecosystem services were found to be high. Biodiversity was positively correlated with soil retention, water yield and carbon sequestration and negatively correlated with N/P retention and pollination. Pairwise overlap was found to be the highest between N and P retention, biodiversity and carbon sequestration, and biodiversity and water yield. Other couples indicated moderate or small overlap. Principal component analysis indicated that biodiversity and six ecosystem services could be divided into two groups, which could be managed and conserved separately. It can be concluded that biodiversity priorities co-occur with water yield, soil retention and carbon sequestration, and do not co-occur with N/P retention and pollination. Conservation of a biodiversity hotspot was associated with maintaining 45.02% of a carbon sequestration hotspot, 42.05% of a water yield hotspot, and 23.29% of a soil retention hotspot, indicating that conserving biodiversity will also result in the protection of these services. The bundling of biodiversity and ecosystem services is thus both possible and practical. Our findings provide valuable information on congruence and divergence among conservation hotspots and the protection of ecosystem services. They also indicate that a systematic and comprehensive approach that can have wide-ranging policy implications in terms of optimizing conservation strategies for multiple ecosystem services.

DOI

2
Bangash R F, Passuello A, Sanchez-Canales Met al., 2013. Ecosystem services in Mediterranean river basin: Climate change impact on water provisioning and erosion control. Science of the Total Environment, 458: 246-255.61Mediterranean hydrological ecosystem services (HES) are threatened by climate change.61Provisioning (water) services are expected to decrease between 3 and 49%.61Regulating (erosion control) services are expected to decrease between 5 and 43%.61Pyrenees mountains are a significant contributor in Llobregat basin's water yield.61The mean sediment retention is decreasing from upper to lower part of the basin.

DOI PMID

3
Baskent E Z, Keles S, Yolasigmaz H A, 2008. Comparing multipurpose forest management with timber management, incorporating timber, carbon and oxygen values: A case study. Scandinavian Journal of Forest Research, 23(2): 105-120.This paper comparatively examines two forest management planning approaches: multipurpose forest management and traditional timber management, with carbon, timber and oxygen production objectives in mind. The effects of both approaches on carbon and oxygen values were estimated with an oxygen and carbon flow matrix, while timber production was modelled through a growth and yield model. The estimated values were simultaneously integrated into a linear programming model developed for this study. The objective was to maximize the net present value (NPV) of the profits of timber, oxygen and carbon under the constraints of an even flow of timber production and ending forest inventory for each planning approach. The results showed that the ecological and environmental regulations in multipurpose management substantially decreased the NPV of timber production even though they increased the NPV of carbon and oxygen flow. The results also indicated that over a 100 year planning horizon the total NPV of all forest ecosystem values including carbon, timber and oxygen is almost the same (only 1.9% reduction in multipurpose management approach) in both management approaches. Although multipurpose management creates more NPV of carbon and oxygen than timber management does, the latter provides better results in terms of timber production. It is therefore important to take into account the NPV of all apparent and quantifiable forest values in preparing forest management plans, particularly in developing new management planning approaches.

DOI

4
Bennett E M, Balvanera P, 2007. The future of production systems in a globalized world. Frontiers in Ecology and the Environment, 5(4): 191-198.

DOI

5
Bennett E M, Peterson G D, Gordon L J, 2009. Understanding relationships among multiple ecosystem services.Ecology Letters, 12(12): 1394-1404.Ecosystem management that attempts to maximize the production of one ecosystem service often results in substantial declines in the provision of other ecosystem services. For this reason, recent studies have called for increased attention to development of a theoretical understanding behind the relationships among ecosystem services. Here, we review the literature on ecosystem services and propose a typology of relationships between ecosystem services based on the role of drivers and the interactions between services. We use this typology to develop three propositions to help drive ecological science towards a better understanding of the relationships among multiple ecosystem services. Research which aims to understand the relationships among multiple ecosystem services and the mechanisms behind these relationships will improve our ability to sustainably manage landscapes to provide multiple ecosystem services.Ecology Letters (2009) 12: 1394鈥1404

DOI PMID

6
Bhagabati N K, Ricketts T, Sulistyawan T B Set al., 2014. Ecosystem services reinforce Sumatran tiger conservation in land use plans. Biological Conservation, 169: 147-156.Ecosystem services have clear promise to help identify and protect priority areas for biodiversity. To leverage them effectively, practitioners must conduct timely analyses at appropriate scales, often with limited data. Here we use simple spatial analyses on readily available datasets to compare the distribution of five ecosystem services with tiger habitat in central Sumatra. We assessed services and habitat in 2008 and the changes in these variables under two future scenarios: a conservation-friendly Green Vision, and a Spatial Plan developed by the Indonesian government. In 2008, the range of tiger habitat overlapped substantially with areas of high carbon storage and sediment retention, but less with areas of high water yield and nutrient retention. Depending on service, location and spatial grain of analysis, there were both gains and losses from 2008 to each scenario; however, aggregate provision of each ecosystem service (except water yield) and total area of tiger habitat were higher in the Vision than the Plan, likely driven by an increase in forest cover in the Vision. Sub-watersheds with high levels of several ecosystem services contained substantially more tiger habitat than random subsets of sub-watersheds, suggesting that prioritizing ecosystem services could benefit tiger conservation. Our analyses provided input to government-led spatial planning and strategic environmental assessments in the study area, indicating that even under time and data constraints, policy-relevant assessments of multiple ecosystem services are feasible.

DOI

7
Braat L C, ten Brink P, 2008. The Cost of Policy Inaction (COPI): The case of not meeting the 2010 biodiversity target. Wageningen: Alterra.

8
Bradford J B, D’Amato A W, 2012. Recognizing trade-offs in multi-objective land management. Frontiers in Ecology and the Environment, 10(4): 210-216.As natural resource management and conservation goals expand and evolve, practitioners and policy makers are increasingly seeking options that optimize benefits among multiple, often contradictory objectives. Here, we describe a simple approach for quantifying the consequences of alternative management options in terms of benefits and trade-offs among multiple objectives. We examine two long-term forest management experiments that span several decades of stand (forest tree community) development and identify substantial trade-offs among carbon cycling and ecological complexity objectives. In addition to providing improved understanding of the long-term consequences of various management options, the results of these experiments show that positive benefits resulting from some management options are often associated with large trade-offs among individual objectives. The approach to understanding benefits and trade-offs presented here provides a simple yet flexible framework for quantitatively assessing the consequences of different management options.

DOI

9
China’s State Forestry Administration (CSFA), 2014. China’s Forest Resources Report, 2009-2013. Beijing: China Forestry Publishing House. (in Chinese)

10
Costanza R, dArge R, deGroot Ret al., 1997. The value of the world’s ecosystem services and natural capital. Nature, 387(6630): 253-260.

DOI

11
Daily G C, 1997. Nature’s Services: Societal Dependence on Natural Ecosystems. Washington, D.C.: Island Press.

12
de Groot R S, Wilson M A, Boumans R M J, 2002. A typology for the classification, description and valuation of ecosystem functions, goods and services. Ecological Economics, 41(3): 393-408.

DOI

13
Delphin S, Escobedo F J, Abd-Elrahman Aet al., 2013. Mapping potential carbon and timber losses from hurricanes using a decision tree and ecosystem services driver model. Journal of Environmental Management, 129: 599-607.61A model was developed to quantify the effects of drivers on ecosystem services.61Available hurricane, forest, and tree-level data were used to model effects.61Potential forest carbon and timber losses were quantified using a decision-tree.61The framework identified and mapped hurricane-forest damage risks zones.61Approach can assess effects of disturbance and management on ecosystem services.

DOI PMID

14
Dixon J A, Scura L F, Vanthof T, 1993. Meeting ecological and economic goals: Marine parks in the Caribbean.Ambio, 22(2/3): 117-125.Abstract Marine parks are increasingly being established to protect endangered marine ecosystems and the biological diversity that they support. Trade-offs exist between protection and use, and ways must be found to produce economic benefits from marine areas while still yielding protection benefits, a question of particular importance to poorer countries that can ill afford to forego development benefits by enforcing strict protection measures. This paper examines these issues in the context of Caribbean marine parks. A number of countries that have established marine protected areas also rely on ocean-based tourism as an important, sometimes central, component of their economy. Can protection and direct use be compatible? Bonaire Marine Park is examined in some detail and monetary estimates are presented. Initial results indicate that proper management can yield both protection and development benefits but questions of ecosystem carrying capacity and national retention of revenues raise important issues for longer term sustainability. -Authors

DOI

15
Dong Ming, Wang Yifeng, Kong Fanzhi et al., 1997. Survey, observation and analysis of terrestrial biocommunities. Beijing: China Standards Press. (in Chinese)

16
Fang Jingyun, Yu Guirui, Ren Xiaoboet al., 2015. Carbon sequestration in China’s terrestrial ecosystems under climate change: Progress on ecosystem carbon sequestration from the CAS Strategic Priority Research Program.Bulletin of Chinese Academy of Sciences, 30(6): 848-857. (in Chinese)

17
Feng X M, Fu B J, Piao S Let al.2016. Revegetation in China’s Loess Plateau is approaching sustainable water resource limits.Nature Climate Change, 6(11): 1019-1022.Revegetation of degraded ecosystems provides opportunities for carbon sequestration and bioenergy production. However, vegetation expansion in water-limited areas creates potentially conflicting demands for water between the ecosystem and humans. Current understanding of these competing demands is still limited. Here, we study the semi-arid Loess Plateau in China, where the `Grain to Green large-scale revegetation programme has been in operation since 1999. As expected, we found that the new planting has caused both net primary productivity (NPP) and evapotranspiration (ET) to increase. Also the increase of ET has induced a significant (p < 0.001) decrease in the ratio of river runoff to annual precipitation across hydrological catchments. From currently revegetated areas and human water demand, we estimate a threshold of NPP of 400 +/- 5 g C myrabove which the population will suffer water shortages. NPP in this region is found to be already close to this limit. The threshold of NPP could change by -36% in the worst case of climate drying and high human withdrawals, to +43% in the best case. Our results develop a new conceptual framework to determine the critical carbon sequestration that is sustainable in terms of both ecological and socio-economic resource demands in a coupled anthropogenic-biological system.

DOI

18
Fotakis D G, Sidiropoulos E, Myronidis Det al., 2012. Spatial genetic algorithm for multi-objective forest planning. Forest Policy and Economics, 21: 12-19.78 Spatial operator for GAs introduced improving multi-objective spatial problems. 78 Comparison with a standard GA in a spatial forest planning problem. 78 Better Pareto front, better trade off solutions and more compact patterns.

DOI

19
Fu Bojie, Zhou Guoyi, Bai Yongfeiet al., 2009. The main terrestrial ecosystem services and ecological security in China.Advances in Earth Science, 24(6): 571-576. (in Chinese)Ecosystem service has become a hot topic in international ecological research with two major trends of advancing ecosystem service mechanism and regional integration methodologies.At the same time,terrestrial ecosystem service research is a great national science and strategic need for ecological restoration,ecological functional regionalization,ecological compensation,and sustaining ecological security.Targeting this necessity and the international research frontiers of ecosystem service,this project takes main terrestrial ecosystems in China as the object of research.There are three scientific themes that will be tackled: ①the interaction between ecosystem structure,process and services;spatiotemporal coupling and scale effects of ecosystem service;③regional ecosystem service assessment and integration modeling.Through the above,it is managed to promote the development of ecosystem service theory and applications to scientifically support national ecological rehabilitation and environmental protection.

DOI

20
Li Shuangcheng, Zhang Caiyu, Liu Jinlonget al., 2013. The tradeoffs and synergies of ecosystem services: Research progress, development trend, and themes of geography.Geographical Research, 32(8): 1379-1390. (in Chinese)Due to the diversity of ecosystem services,the heterogeneity of the spatial distribution and the selectivity of human use,the mutual relationships between ecosystem services show the dynamic variation under the influence of human activities and natural factors,which are characterized by different patterns such as reciprocal tradeoffs and mutual gain synergies.Understanding types,formation mechanism,scale dependence and regional differences of tradeoffs and synergies among the ecosystem services has great significance on formulating "win-win" policies and the implementation of measures for regional development and ecological protection.Therefore,the domestic and international research progress and limitation in interactions and nonlinear relationships,types,formation mechanism,scale effects,methods and tools,and uncertainty of ecosystem services were systematically reviewed in this paper.Furthermore,the research trend was identified,and the research issues on the tradeoffs and synergies of ecosystem services were put forward from a geographic perspective including spatial-temporal heterogeneity,formation mechanism,scale-dependence and regional differences.This paper will help to expand the research depth and breadth on tradeoffs and synergies of ecosystem services,and promote the level of geography comprehensive study.

21
Liao Lianglin, Zhou Lei, Wang Shaoqianget al., 2016. Carbon sequestration potential of biomass carbon pool for new afforestation in China during 2005-2013.Acta Geographica Sinica, 71(11): 1939-1947. (in Chinese)Accurate estimation of the carbon sequestration potential of afforestation helps us better understand the carbon cycle in China and provides the guide for national forest policies.Forest data from China Forestry Statistical Yearbook were used to estimate carbon stocks and explore the carbon sequestration potential in China's forests in the next 100 years. In this study,we estimate the forest biomass carbon storage and carbon sequestration potential of new afforestation in China over the next 100 years based on new afforestation area from China Forestry Statistical Yearbook during 2005- 2013 and forest type map in 2010 derived from remote sensing information. In the consideration of annual forest survival rate, carbon pools of the new afforestation are estimated with the forest growth equations for different forest types.The potential changes in China's forest biomass carbon storage between 2005 and 2100 were estimated with reconstructed forest areas. The results show that the total new afforestation area of China are 4394 10~4hm~2 from 2005 to 2013. With the assumption of continuous natural forest growth, the volume of new afforestation during 2005- 2013 will increase to 16.8 billion m~3. The biomass and carbon pool will increase to 1.6 Pg and 0.76 Pg C by 2020, respectively.The new afforestation biomass carbon storage will increase by 2.11 Pg C during 2005- 2100.The carbon storage of new afforestation over the next 100 years are about 25% of current biomass carbon stocks in forests and are about 1.5 times of total forest carbon sink of the past20 years. Furthermore, the biomass carbon density of China's afforestation will reach 48.1 Mg C/hm~2 by 2100. In China, the new afforestation has played an important role in the increase of forest carbon storage and has a great potential for carbon sequestration. Therefore, forest management in China is of importance to mitigate increases in greenhouse gas emissions.

DOI

22
Millennium Ecosystem Assessment, 2003. Ecosystems and Human Well-Being: A Framework for Assessment. Washington, DC: Island Press.

23
Ministry of Water Resources of China, Chinese Academy of Sciences, Chinese Academy of Engineering (MWRC-CAS-CAE), 2010. Water and Soil Conservation and Ecological Security in the Red-soil Hilly Region of South China. Beijing: Science Press. (in Chinese)

24
Nelson E, Mendoza G, Regetz Jet al., 2009. Modeling multiple ecosystem services, biodiversity conservation, commodity production, and tradeoffs at landscape scales. Frontiers in Ecology and the Environment, 7(1): 4-11.

DOI

25
Ouyang Zhiyun, Wang Xiaoke, Miao Hong, 1999. Aprimary study on Chinese terrestrial ecosystem services and their ecological-economic values.Acta Ecologica Sinica, 19(5): 607-607. (in Chinese)Ecosystem services are the conditions and processing through which the natural ecosystems and the species,that make them up,sustain and fulfill the human life.They not only supply to the human being with the production of ecosystem goods,but also perform the fundamental life support services,which include the purification of air and water,detoxification and decomposition of wastes,regulation of climate,regeneration of soil fertility,and production and maintenance of biodiversity,mitigation of floods and droughts.The Chinese ecosystem services and their indirect economic values were estimated based on ecological function analysis.The study showed that the indirect economic values in RMB of organic matter production,CO 2 fixation,O 2 release,nutrient recycle,soil protection,water holding capacity and environmental purification were 1 57×10 13 Yuan/a,2 84×10 2 Yuan/a,2 84×10 12 Yuan/a,3 24×10 11 Yuan/a,5 69×10 12 Yuan/a,2 71×10 11 Yuan/a,4 90×10 12 Yuan/a,respectively.

26
Ouyang Zhiyun, Zheng Hua, 2009. Ecological mechanisms of ecosystem service.Acta Ecologica Sinica, 29(11): 6183-6188. (in Chinese)

27
Pan T, Wu S H, Liu Y J, 2015. Relative contributions of land use and climate change to water supply variations over Yellow River source area in Tibetan Plateau during the past three decades. PLoS One, 10(4): 1-19.中国科学院机构知识库(CAS IR GRID)以发展机构知识能力和知识管理能力为目标,快速实现对本机构知识资产的收集、长期保存、合理传播利用,积极建设对知识内容进行捕获、转化、传播、利用和审计的能力,逐步建设包括知识内容分析、关系分析和能力审计在内的知识服务能力,开展综合知识管理。

DOI PMID

28
Payn T, Carnus J-M, Freer-Smith Pet al., 2015. Changes in planted forests and future global implications. Forest Ecology and Management, 352: 57-67.This paper focuses on an analysis of planted forests data from the 2015 Forests Resources Assessment of the U.N. Food and Agriculture Organisation (FRA 2015). It forms one of a series of papers in the FRA 2015 special issue of this journal. While total forest area decreased from 4.28 billion hectares to 3.99 billion hectares from 1990 to 2015, with percent global forest cover dropping from 31.85% to 30.85%, the area of planted forests increased from 167.5 to 277.9 million hectares or 4.06% to 6.95% of total forest area. Increase was most rapid in the temperate zone, and regionally in East Asia, followed by Europe, North America, and Southern and Southeast Asia. However the annualised rate of increase in area of planted forests slowed in the 2010 2015 period to 1.2%, below the 2.4% rate suggested is needed to supply all of the world timber and fibre needs. The majority of planted forests comprised native species with only 18 19% of the total area being of introduced species. Introduced species were dominant in the southern hemisphere countries of South America, Oceania and Eastern and Southern Africa where industrial forestry is dominant. Twenty countries accounted for 85% of planted forest area and a different 20 countries for 87% of planted forest roundwood supply. As with forest area, roundwood supply from planted forests also showed an increasing trend although this was based on minimal data. There was a mismatch in composition and rankings of the top 20 countries with top forest area and roundwood production suggesting that there are substantial opportunities to increase roundwood production in the future, especially in China which has the largest area but is currently ranked 3rd in roundwood production. Outlook statements were developed for the FAO sub regions based on past changes in planted forest area, population growth, and climate and forest health risks to identify key issues for the future. The overall view from this study suggests that climate impacts, especially from extreme climatic events will affect planted forests in the future and that forest health impacts can also be expected to increase. Outlooks vary regionally. Europe and North America are likely to be most concerned with climate and health risks; Asia will experience population pressure that will impact on land availability for new forests and risks from extreme weather events, and will need to make the most of its existing forests; Africa will need to increase planted forest area to offset continuing deforestation and rapid population growth; and Oceania, the Caribbean, Central and South America are likely to be most concerned with climate impacts. To ensure the continued contribution of planted forests, a number of responses will be required to both maintain existing and also to develop new forests. Intensification of production in existing forests will lessen the need for greater forest areas and offset any land use conflicts related to food security; climate adaptation strategies will need to be developed as a matter of urgency, and forest health focus must remain a priority for research. Establishment of new forests will be eased through greater community and stakeholder engagement. Application of models such as WWF New Generation Plantations, which recognises the importance of society and the need to consider the full range of forest products and services within the wider landscape and spectrum of land uses, will be important. We recommend that to enable deeper analysis related to planted forests future FRA Assessments consider ways to better gather data specific to planted forests such as productivity so that this important component of global forests can be better understood.

DOI

29
Qiu J X, Turner M G, 2013. Spatial interactions among ecosystem services in an urbanizing agricultural watershed.Proceedings of the National Academy of Sciences of the United States of America, 110(29): 12149-12154.Understanding spatial distributions, synergies, and tradeoffs of multiple ecosystem services (benefits people derive from ecosystems) remains challenging. We analyzed the supply of 10 ecosystem services for 2006 across a large urbanizing agricultural watershed in the Upper Midwest of the United States, and asked the following: (i) Where are areas of high and low supply of individual ecosystem services, and are these areas spatially concordant across services? (ii) Where on the landscape are the strongest tradeoffs and synergies among ecosystem services located? (iii) For ecosystem service pairs that experience tradeoffs, what distinguishes locations that are "win-win" exceptions from other locations? Spatial patterns of high supply for multiple ecosystem services often were not coincident; locations where six or more services were produced at high levels (upper 20th percentile) occupied only 3.3% of the landscape. Most relationships among ecosystem services were synergies, but tradeoffs occurred between crop production and water quality. Ecosystem services related to water quality and quantity separated into three different groups, indicating that management to sustain freshwater services along with other ecosystem services will not be simple. Despite overall tradeoffs between crop production and water quality, some locations were positive for both, suggesting that tradeoffs are not inevitable everywhere and might be ameliorated in some locations. Overall, we found that different areas of the landscape supplied different suites of ecosystem services, and their lack of spatial concordance suggests the importance of managing over large areas to sustain multiple ecosystem services.

DOI PMID

30
Raudsepp-Hearne C, Peterson G D, Bennett E M, 2010. Ecosystem service bundles for analyzing tradeoffs in diverse landscapes.Proceedings of the National Academy of Sciences of the United States of America, 107(11): 5242-5247.A key challenge of ecosystem management is determining how to manage multiple ecosystem services across landscapes. Enhancing important provisioning ecosystem services, such as food and timber, often leads to tradeoffs between regulating and cultural ecosystem services, such as nutrient cycling, flood protection, and tourism. We developed a framework for analyzing the provision of multiple ecosystem services across landscapes and present an empirical demonstration of ecosystem service bundles, sets of services that appear together repeatedly. Ecosystem service bundles were identified by analyzing the spatial patterns of 12 ecosystem services in a mixed-used landscape consisting of 137 municipalities in Quebec, Canada. We identified six types of ecosystem service bundles and were able to link these bundles to areas on the landscape characterized by distinct social cological dynamics. Our results show landscape-scale tradeoffs between provisioning and almost all regulating and cultural ecosystem services, and they show that a greater diversity of ecosystem services is positively correlated with the provision of regulating ecosystem services. Ecosystem service-bundle analysis can identify areas on a landscape where ecosystem management has produced exceptionally desirable or undesirable sets of ecosystem services.

DOI PMID

31
Research Institute of Wood Industry, Chinese Academy of Forestry (RIWI-CAF), 1982. Study on Wood Physical and Mechanical Properties of the Dominant Tree Species in China. Beiijng: China Forestry Publishing House. (in Chinese)

32
Richards F J, 1959. A flexible growth function for empirical use.Journal of Experimental Botany, 10(29): 290-300.The application of an extended form of von Bertalanffy's growth function to plant data is considered; the equation has considerable flexibility, but is used only to supply an empirical fit. In order to aid the biological analysis of such growth data as are capable of representation by the function, general rate parameters are deduced which are related in a simple manner to its constants.

DOI

33
Rodríguez J P, Beard T D, Bennett E Met al., 2006. Trade-offs across space, time, and ecosystem services. Ecology and Society, 11(1): 28.

34
Rong Jiantao, Lei Xiangdong, Zhang Huiruet al., 2012. Forest management planning incorporrating values of timber and carbon.Journal of Northwest Forestry University, 27(2): 155-162. (in Chinese)

35
Sun Honglie, Yu Guirui, Ouyang Zhu et al., 2012. Chinese Ecosystem Observation and Research Dataset· Forest Ecosystem Volume: Hunan Huitong Station (1960-2006). Beijing: China Agricultural Press. (in Chinese)

36
Tallis H, Kareiva P, Marvier Met al., 2008. An ecosystem services framework to support both practical conservation and economic development. Proceedings of the National Academy of Sciences of the United States of America, 105(28): 9457-9464.The core idea of the Millennium Ecosystem Assessment is that the human condition is tightly linked to environmental condition. This assertion suggests that conservation and development projects should be able to achieve both ecological and social progress without detracting from their primary objectives. Whereas "win-win" projects that achieve both conservation and economic gains are a commendable goal, they are not easy to attain. An analysis of World Bank projects with objectives of alleviating poverty and protecting biodiversity revealed that only 16% made major progress on both objectives. Here, we provide a framework for anticipating win-win, lose-lose, and win-lose outcomes as a result of how people manage their ecosystem services. This framework emerges from detailed explorations of several case studies in which biodiversity conservation and economic development coincide and cases in which there is joint failure. We emphasize that scientific advances around ecosystem service production functions, tradeoffs among multiple ecosystem services, and the design of appropriate monitoring programs are necessary for the implementation of conservation and development projects that will successfully advance both environmental and social goals. The potentially bright future of jointly advancing ecosystem services, conservation, and human well-being will be jeopardized unless a global monitoring effort is launched that uses the many ongoing projects as a grand experiment.

DOI PMID

37
Vonbertalanffy L, 1957. Quantitative laws in metabolism and growth. Quarterly Review of Biology, 32(3): 217-231.

DOI

38
Wang J T, Peng J, Zhao M Yet al., 2017. Significant trade-off for the impact of Grain-for-Green Programme on ecosystem services in north-western Yunnan, China.Science of The Total Environment, 574: 57-64.61Ecosystem services trade-offs due to GFGP are assessed.61Soil conservation was potentially increased with the implementation of GFGP.61Increasing extent of GFGP implementation resulted in the decrease of NPP and water yield at sub watershed scale during the period.61Recovery of soil conservation lagged behind recovery of net primary production.

DOI PMID

39
Wang Xiaoming, 2013. Application of multi-objective spatial forest planning based on FPS-ATLAS [D]. Changchun: Northeast Forestry University. (in Chinese)

40
Zeide B, 1989. Accuracy of equations describing diameter growth. Canadian Journal of Forest Research, 19(10): 1283-1286.ABSTRACT The investigation of the structure of growth equations shows that most of them describe the growth decline by a negative exponential function. This decline can also be described by a power function. It was found that the equation based on this assumption is the best available model of diameter growth. Some applications of this equation are discussed.

DOI

41
Zheng Du, Yang Qinye, Wu Shaohong et al., 2008. Study on the Eco-geographical Region System of China. Beijing: The Commercial Press. (in Chinese)

42
Zheng Z M, Fu B J, Feng X M, 2016. GIS-based analysis for hotspot identification of tradeoff between ecosystem services: A case study in Yanhe Basin, China. Chinese Geographical Science, 26(4): 466-477.Although the quantification and valuation of ecosystem services have been studied for a long time, few studies have specifically focused on the quantification of tradeoffs between ecosystem services and tradeoff hotspots. Based on previous studies of ecosystem service assessment, we proposed a feasible method to analyze the tradeoffs between ecosystem services, including determination of their relationship, quantification of tradeoffs, and identification of tradeoff hotspots. Potential influencing factors were then further analyzed. The Yanhe Basin in the Loess Plateau was selected as an example to demonstrate the application process. Firstly, the amounts of net primary production (NPP) and water yield (WY) in 2000 and 2008 were estimated by using biophysical models. Secondly, correlation analysis was used to indicate the tradeoffs between NPP and WY. Thirdly, tradeoff index (TINPP/WY) was established to quantify the extent of tradeoffs between NPP and WY, and the average value of TI NPP/WY is 24.4 g/(mm m 2 ) for the Yanhe Basin between 2000 and 2008. Finally, the tradeoff hotspots were identified. The results indicated that the area of lowest tradeoff index concentrated in the middle part of the Yanhe Basin and marginal areas of the southern basin. Map overlapping was used for preliminary analysis to seek potential influencing factors, and the results showed that shrub was the best suited for growing in the Yanhe Basin, but also was a potential influencing factor for formulation of the tradeoff hotspots. The concept of tradeoff index could also be used to quantify the degree of synergy between different ecosystem services. The method to identify the tradeoff hotspots could help us to narrow the scope of study area for further research on the relationship among ecosystem services and concentrate on the potential factors for formation of tradeoff between ecosystem services, enhance the capacity to maintain the sustainability of ecosystem.

DOI

Outlines

/