
Journal of Geographical Sciences >
Applying energy theory to understand the relationship between the Yangtze River and Poyang Lake
Author: Chen Mofei, PhD Candidate, E-mail: chenmf0810@163.com
Received date: 2018-01-12
Accepted date: 2018-03-02
Online published: 2018-08-10
Supported by
State Key Program of National Science Foundation of China, No.41331174;Science and Technology Planning Project of Jiangxi Province, No.20051BBG70044
Copyright
The complex relationship between the Yangtze River and Poyang Lake controls the exchange of water and sediment between the two, and exerts effects on water resources, flooding, shipping, and the ecological environment. The theory of energy is applied in this paper to investigate the physical mechanisms that determine the nature of the contact between the Yangtze River and Poyang Lake and to establish an energy difference (Fe) index to quantify the interactions between the two systems. Data show that Fe values for this interaction have increased since the 1950s, indicating a weakening in the river effect while the lake effect has been enhanced. Enclosure of the Three Gorges Reservoir (TGR) has also significantly influenced the relationship between the river and the lake by further reducing the impacts of the Yangtze River. The river effect also increases slightly during the dry season, and decreases significantly at the end of the flooding period, while interactions between the two to some extent influence the development of droughts and floods within the lake area. Data show that when the flow of the five rivers within this area is significant and a blocking effect due to the Yangtze River is also clearly apparent, floods occur easily; in contrast, when the opposite is true and the flow of the five rivers is small, and the Yangtze River can accommodate the flow, droughts occur frequently. Construction and enclosure of the TGR also means that the lake area is prone to droughts during September and October.
CHEN Mofei , DENG Jinyun , FAN Shaoying , LI Yitian . Applying energy theory to understand the relationship between the Yangtze River and Poyang Lake[J]. Journal of Geographical Sciences, 2018 , 28(8) : 1059 -1071 . DOI: 10.1007/s11442-018-1541-6
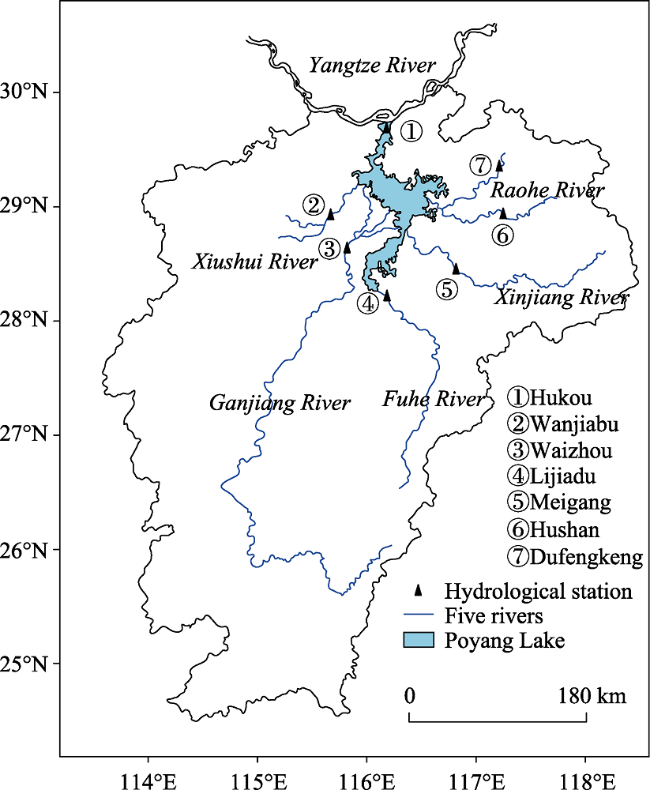
Figure 1 Map showing the location of the study area discussed in this paper |
Figure 2 Map showing the location of Poyang Lake and associated hydrological stations |
Table 1 Theories and forms of expression of the river-lake relationship |
| Effect | Theory | Indication | |
|---|---|---|---|
| Yangtze River | Blocking effect | Flow discharge and energy of the Yangtze River increases | Increase in ES hinders outflow |
| Poyang Lake | Recharging effect | Flow discharges and energies of the five rivers increase | Increase in ED favors outflow |
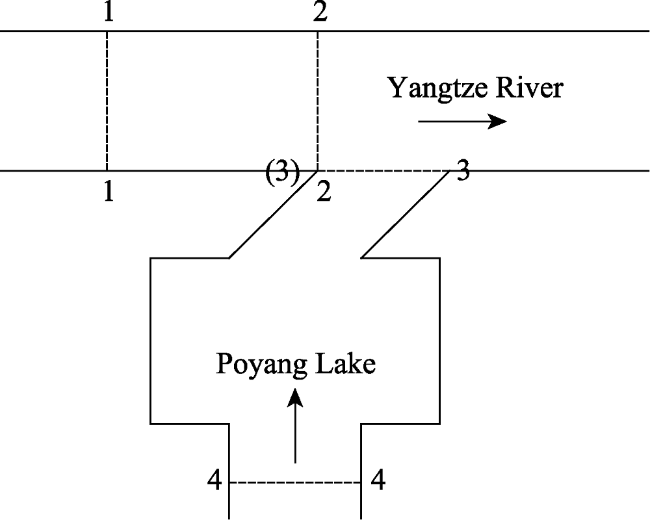
Figure 3 Sketch to show the nature of interactions between the Yangtze River and Poyang Lake |
Figure 4 Graph showing Fe variation between 1953 and 2015 |
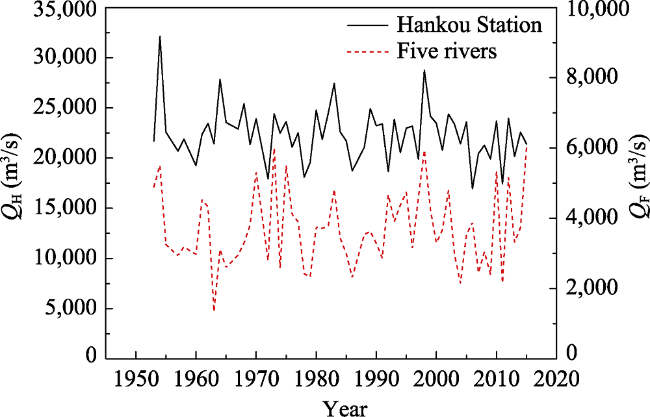
Figure 5 Graph showing variation in annual average discharge between 1953 and 2015 |
Table 2 Fe values over the time period of this study |
| Date | Fe | Date | Fe | Date | Fe | Date | Fe | Date | Fe |
|---|---|---|---|---|---|---|---|---|---|
| 1953 | 0.009 | 1967 | ‒0.011 | 1980 | ‒0.022 | 1993 | ‒0.012 | 2006 | 0.062 |
| 1954 | ‒0.025 | 1968 | ‒0.024 | 1981 | ‒0.009 | 1994 | 0.014 | 2007 | 0.009 |
| 1955 | ‒0.009 | 1969 | 0.006 | 1982 | ‒0.027 | 1995 | 0.013 | 2008 | 0.010 |
| 1956 | 0.002 | 1970 | 0.005 | 1983 | ‒0.030 | 1996 | ‒0.017 | 2009 | 0.010 |
| 1957 | 0.004 | 1971 | ‒0.004 | 1984 | ‒0.010 | 1997 | 0.026 | 2010 | 0.025 |
| 1958 | 0.005 | 1972 | 0.019 | 1985 | ‒0.015 | 1998 | ‒0.006 | 2011 | 0.030 |
| 1959 | 0.025 | 1973 | 0.005 | 1986 | 0.005 | 1999 | 0.009 | 2012 | 0.020 |
| 1960 | 0.018 | 1974 | ‒0.018 | 1987 | ‒0.009 | 2000 | ‒0.010 | 2013 | 0.029 |
| 1961 | 0.016 | 1975 | 0.000 | 1988 | 0.010 | 2001 | 0.015 | 2014 | 0.009 |
| 1962 | 0.012 | 1976 | 0.010 | 1989 | ‒0.029 | 2002 | 0.006 | 2015 | 0.028 |
| 1963 | ‒0.028 | 1977 | ‒0.002 | 1990 | ‒0.029 | 2003 | ‒0.014 | ||
| 1964 | ‒0.049 | 1978 | 0.014 | 1991 | ‒0.032 | 2004 | ‒0.008 | ||
| 1965 | ‒0.025 | 1979 | 0.002 | 1992 | 0.024 | 2005 | ‒0.005 |
Figure 6 Graph showing average monthly Fe over time |
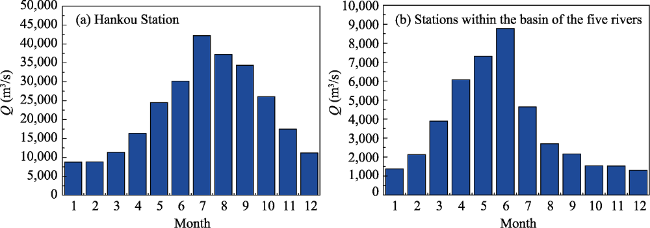
Figure 7 Averaged monthly discharges measured at Hankou Station and the other six stations on the five tributaries of Poyang Lake |
Table 3 Backward flow conditions at Hukou Station between 1953 and 2015 |
| Month | Days | Volume (108 m3) | Month | Days | Volume (108 m3) | Month | Days | Volume (108 m3) |
|---|---|---|---|---|---|---|---|---|
| Jan | 0 | 0 | May | 0 | 0 | Sep | 251 | 454 |
| Feb | 0 | 0 | June | 13 | 15 | Oct | 59 | 80 |
| Mar | 0 | 0 | July | 204 | 540 | Nov | 14 | 13 |
| Apr | 0 | 0 | Aug | 186 | 336 | Dec | 2 | 0.4 |
Figure 8 Variations in Fe before, and after, TGR construction and enclosure |
Table 4 Comparison of average monthly discharge data for Hankou Station both before (1953-2002) and after (between 1953-2002) construction of the TGR |
| Month | 1953 and 2002 | 1953-2002 | Variation rate (%) | Month | 1953-2002 | 2004-2015 | Variation rate (%) |
|---|---|---|---|---|---|---|---|
| Jan | 8,320 | 10,252 | 23 | July | 43,482 | 37,022 | ‒15 |
| Feb | 8,400 | 10,389 | 24 | Aug | 38,137 | 33,883 | ‒11 |
| Mar | 10,737 | 13,202 | 23 | Sep | 34,891 | 30,003 | ‒14 |
| Apr | 16,401 | 16,296 | ‒1 | Oct | 27,438 | 19,588 | ‒29 |
| May | 24,585 | 23,148 | ‒6 | Nov | 17,827 | 16,079 | ‒10 |
| June | 30,009 | 30,753 | 2 | Dec | 11,045 | 11,561 | 5 |
Table 5 Results of a reasonableness analysis for Fe using hydrological data from 2011 |
| Month | IFJ | IFW | Fe | IQJ | IQW | Month | IFJ | IFW | Fe | IQJ | IQW |
|---|---|---|---|---|---|---|---|---|---|---|---|
| Jan | 0.32 | 0.39 | 0.066 | 0.10* | 0.08* | July | 0.29 | 0.09 | ‒0.049 | 0.73 | 0.28 |
| Feb | 0.31 | 0.43 | 0.077 | 0.04 | 0.06 | Aug | 0.52 | 0.14 | ‒0.065 | 0.63 | 0.10 |
| Mar | 0.30 | 0.46 | 0.091 | 0.06 | 0.09 | Sep | 0.54 | 0.24 | ‒0.020 | 0.41 | 0.07 |
| Apr | 0.35 | 0.44 | 0.066 | 0.10* | 0.08* | Oct | 0.30 | 0.31 | 0.026 | 0.23 | 0.10 |
| May | 0.29 | 0.46 | 0.084 | 0.10 | 0.12 | Nov | 0.48* | 0.32* | 0.019 | 0.26* | 0.07* |
| June | 0.33 | 0.34 | 0.023 | 0.60* | 0.37* | Dec | 0.34 | 0.41 | 0.069 | 0.05* | 0.05* |
Abbreviations: IFJ, and IFW denote energy departures between the main stream of the Yangtze River and the five tributary rivers, respectively; IQJ and IQW denote flow departures between the main stream of the Yangtze River and the five tributary rivers, respectively; * refers to results when relative size does not match Fe values. |
The authors have declared that no competing interests exist.
| 1 |
|
| 2 |
|
| 3 |
|
| 4 |
|
| 5 |
|
| 6 |
|
| 7 |
|
| 8 |
|
| 9 |
|
| 10 |
|
| 11 |
|
| 12 |
|
| 13 |
|
| 14 |
|
| 15 |
|
| 16 |
|
| 17 |
|
| 18 |
|
| 19 |
|
| 20 |
|
| 21 |
|
| 22 |
|
| 23 |
|
| 24 |
|
| 25 |
|
| 26 |
|
| 27 |
|
| 28 |
|
/
| 〈 |
|
〉 |


