
Journal of Geographical Sciences >
Characteristics of dry-wet abrupt alternation events in the middle and lower reaches of the Yangtze River Basin and the relationship with ENSO
Author: Shan Lijie, PhD Candidate, specialized in extreme hydrologic events. E-mail: shanlijie0701@163.com
Received date: 2017-12-06
Accepted date: 2018-02-27
Online published: 2018-08-10
Supported by
National Key Research and Development Program in China, No.2017YFA0603704;National Natural Science Foundation of China, No.51339004
Copyright
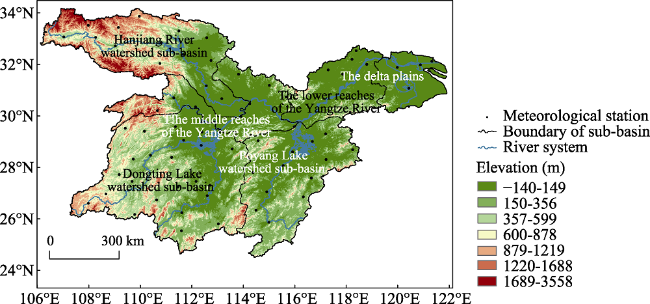
During recent decades, more frequent flood-drought alternations have been seen in China as a result of global climate change and intensive human activities, which have significant implications on water and food security. To better identify the characteristics of flood-drought alternations, we proposed a modified dry-wet abrupt alternation index (DWAAI) and applied the new method in the middle and lower reaches of the Yangtze River Basin (YRB-ML) to analyze the long-term spatio-temporal characteristics of dry-wet abrupt alternation (DWAA) events based on the daily precipitation observations at 75 rainfall stations in summer from 1960 to 2015. We found that the DWAA events have been spreading in the study area with higher frequency and intensity since 1960. In particular, the DWAA events mainly occurred in May and June in the northwest of the YRB-ML, including Hanjiang River Basin, the middle reaches of the YRB, north of Dongting Lake and northwest of Poyang Lake. In addition, we also analyzed the impact of El Niño Southern Oscillation (ENSO) on DWAA events in the YRB-ML. The results showed that around 41.04% of DWAA events occurred during the declining stages of La Niño or within the subsequent 8 months after La Niño, which implies that La Niño events could be predictive signals of DWAA events. Besides, significant negative correlations have been found between the modified DWAAI values of all the rainfall stations and the sea surface temperature anomalies in the Nino3.4 region within the 6 months prior to the DWAA events, particularly for the Poyang Lake watershed and the middle reaches of the YRB. This study has significant implications on the flood and drought control and water resources management in the YRB-ML under the challenge of future climate change.
SHAN Lijie , ZHANG Liping , SONG Jiyun , ZHANG Yanjun , SHE Dunxian , XIA Jun . Characteristics of dry-wet abrupt alternation events in the middle and lower reaches of the Yangtze River Basin and the relationship with ENSO[J]. Journal of Geographical Sciences, 2018 , 28(8) : 1039 -1058 . DOI: 10.1007/s11442-018-1540-7
Figure 1 The location of the middle and lower reaches of the Yangtze River Basin in China. The black dots denote the meteorological stations. Boundaries of sub-basins (black lines) and first-order streams in the basin (in blue) are shown. |
Table 1 The “transition” degree of events that alter from dry to wet according to different values of parameter a |
| No. | SPA | “Transition” degree | ||||||||||
|---|---|---|---|---|---|---|---|---|---|---|---|---|
| Pre- phase | Post- phase | a=0.8 | a=1.0 | a=1.2 | a=1.3 | a=1.4 | a=1.6 | a=1.8 | a=2.0 | a=2.5 | a=3.0 | |
| 1 | -1 | 1 | 4.00 | 4.00 | 4.00 | 4.00 | 4.00 | 4.00 | 4.00 | 4.00 | 4.00 | 4.00 |
| 2 | -1 | 2 | 11.25 | 9.00 | 7.50 | 6.92 | 6.43 | 5.63 | 5.00 | 4.50 | 3.60 | 3.00 |
| 3 | -1 | 3 | 25.00 | 16.00 | 11.11 | 9.47 | 8.16 | 6.25 | 4.94 | 4.00 | 2.56 | 1.78 |
| 4 | -2 | 1 | 11.25 | 9.00 | 7.50 | 6.92 | 6.43 | 5.63 | 5.00 | 4.50 | 3.60 | 3.00 |
| 5 | -2 | 2 | 16.00 | 16.00 | 16.00 | 16.00 | 16.00 | 16.00 | 16.00 | 16.00 | 16.00 | 16.00 |
| 6 | -2 | 3 | 31.25 | 25.00 | 20.83 | 19.23 | 17.86 | 15.63 | 13.89 | 12.50 | 10.00 | 8.33 |
| 7 | -2 | -3 | -15.26 | -5.00 | -2.01 | -1.35 | -0.93 | -0.48 | -0.26 | -0.16 | -0.05 | -0.02 |
| 8 | 2 | 3 | 15.26 | 5.00 | 2.01 | 1.35 | 0.93 | 0.48 | 0.26 | 0.16 | 0.05 | 0.02 |
Table 2 Years and comparison of normalized precipitation values for the 10 highest LDFAI values |
| Year | LDFAI | May-June | July-August | Year | LDFAI | May-June | July-August |
|---|---|---|---|---|---|---|---|
| 1963 | 5.06 | -2.31 | 1.00 | 2010 | 1.74 | -0.56 | 0.91 |
| 1969 | 3.77 | -0.75 | 2.43 | 2006 | 1.45 | -1.11 | 0.38 |
| 1998 | 2.77 | -0.57 | 1.83 | 2003 | 1.26 | -0.54 | 0.61 |
| 1994 | 2.33 | -1.88 | 0.45 | 1962 | 1.18 | 0.00 | 1.91 |
| 1997 | 1.85 | -1.86 | 0.30 | 1991 | 0.93 | 0.40 | 1.99 |
Table 3 Years and comparison of SPA values for the 10 highest DWAAI values |
| Year | Abrupt alternation date | Pre-phase SPA | Post-phase SPA | “Urgency” degree | “Alternation” degree | DWAAI |
|---|---|---|---|---|---|---|
| 2000 | May 24 | -1.93 | 2.21 | 6.69 | 15.99 | 22.68 |
| 1988 | May 6 | -1.79 | 3.19 | 4.99 | 17.19 | 22.18 |
| 2008 | May 3 | -1.50 | 3.61 | 5.75 | 15.02 | 20.77 |
| 2011 | June 10 | -1.66 | 4.96 | 1.74 | 18.41 | 20.15 |
| 1961 | June 7 | -1.29 | 3.49 | 5.33 | 12.82 | 18.15 |
| 2007 | May 24 | -1.64 | 2.88 | 2.60 | 14.70 | 17.30 |
| 1984 | June 7 | -1.49 | 2.69 | 2.97 | 12.73 | 15.70 |
| 1982 | June 19 | -0.76 | 3.76 | 4.74 | 9.29 | 14.03 |
| 1998 | July 17 | -0.78 | 5.81 | 1.77 | 11.60 | 13.37 |
| 1994 | July 12 | -1.26 | 2.22 | 3.90 | 9.39 | 13.29 |
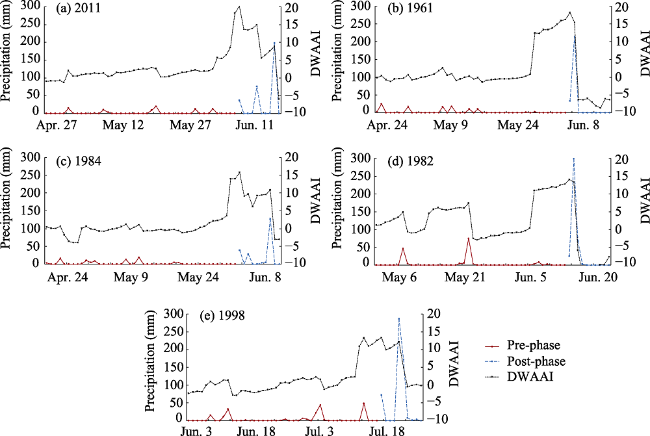
Figure 2 Precipitation and DWAAI sequences of DWAA events in the high DWAAI years (i.e., (a) 2011, (b) 1961, (c) 1984, (d) 1982 and (e) 1998). Red lines and blue dashed lines represent the precipitation during periods of the pre-phase and post-phase, respectively. Black dotted lines represent the calculated DWAAI values during the whole event. |
Table 4 Comparison of DWAA events selected by the LDFAI and DWAAI |
| Stations | Sub-basins | DWAA events selected by LDFAI | DWAA events (abrupt alternation date) selected by DWAAI |
|---|---|---|---|
| Tianmen | Hanjiang River watershed sub-basin | 1963, 1968 | 1961 (June 8), 1968 (July 14), 1969 (June 9), 1982 (May 12). 1997 (June 6), 2000 (May 24) |
| Jingzhou | The middle reaches of the Yangtze River | 1968, 1991, 2007 | 1968 (July 13), 1981 (May 27), 1991 (July 1), 2000 (May 24), 2011 (June 13) |
| Shimen | Dongting Lake watershed sub-basin | 1991, 1993, 2007, 2008, 2014 | 1982 (May 26), 1986(June 4), 1988 (May 5), 1991 (July 1), 1996 (May 31), 2006 (May 5), 2011 (June 10) |
| Zhangshu | Poyang Lake watershed sub-basin | _ | 1982 (June 14), 1985 (June 4), 1988 (May 9), 2011 (June 3) |
| Huangshan | The lower reaches of the Yangtze River | 1965, 1987, 1997, 2009 | 1992 (August 26), 1994 (June 8), 1996 (June 3), 2000 (May 25), 2008 (June 8), 2009 (July 24), 2011 (June 4) |
| Nantong | Delta plains | 1965, 1980, 1982, 1987, 1997, 2003, 2006, 2007, 2010, 2014 | 1971 (May 17), 1974 (May 4), 1981 (June 24), 2003 (June 29), 2010 (July 3) |
Boldface and underlined font indicate that the events that occurred in the same year were identified by both indices |
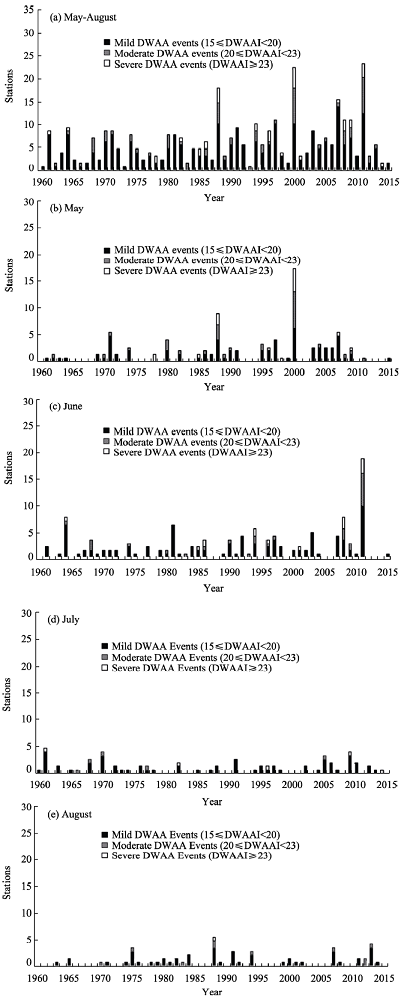
Figure 3 Statistics of stations where summer DWAA events occurred in the YRB-ML. White, reticular and black rectangles represent the number of stations with severe, moderate and mild DWAA events, respectively |
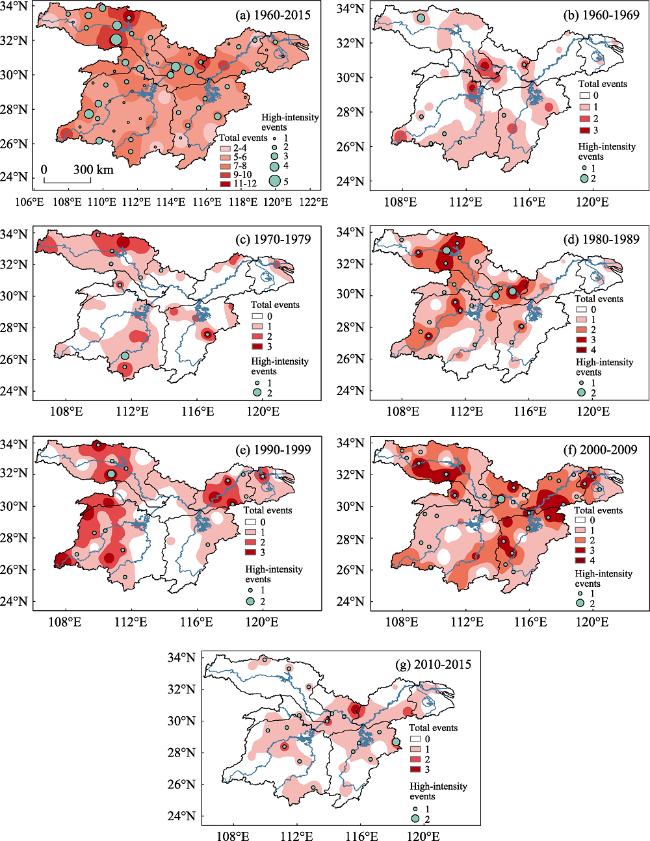
Figure 4 Spatial distributions of the interdecadal frequencies of summer DWAA events in the YRB-ML. All of the stations with DWAA events are shaded, and stations with high-intensity DWAA events are marked by green dots. |
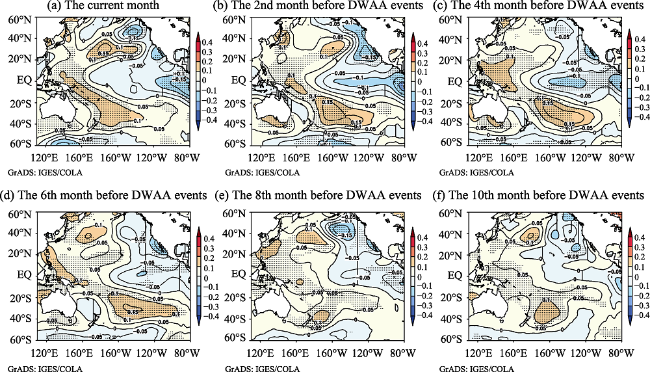
Figure 5 Spatial distributions of Pacific SST anomalies before mild DWAA events. The dotted regions indicate values that are significant at the 0.1 level |
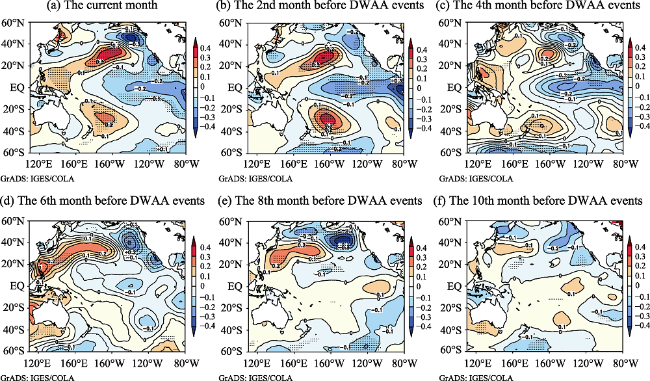
Figure 6 Spatial distributions of Pacific SST anomalies before moderate DWAA events. The dotted regions indicate values that are significant at the 0.1 level |
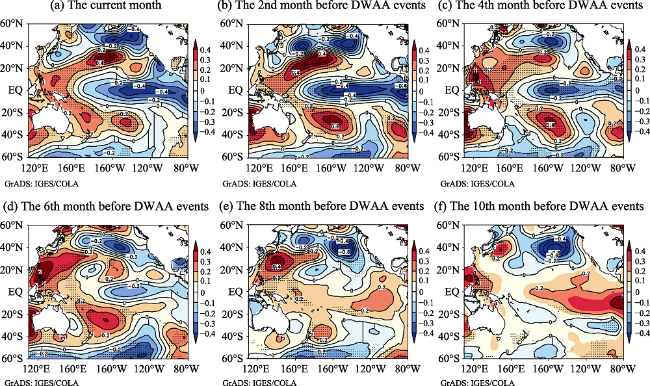
Figure 7 Spatial distributions of Pacific SST anomalies before severe DWAA events. The dotted regions indicate values that are significant at the 0.1 level |
Table 5 Abnormal conditions of SST in the Nino3.4 region within 1 year before DWAA events |
| SST abnormal conditions | Occurrence frequency | Percentage (%) |
|---|---|---|
| La Niño | 181 | 41.04 |
| SST anomalies persistently less than 0 (La Niño has not formed yet) | 52 | 11.79 |
| El Niño | 62 | 14.06 |
| SST anomalies persistently larger than 0 (El Niño has not formed yet) | 36 | 8.16 |
| Other | 110 | 24.95 |
Table 6 Statistics of DWAA events that occurred during the declining stages of La Niño events or within the first 8 months after La Niño events ended |
| Intensity of events | Occurrence frequency | Months with the coldest SST in the Nino3.4 region before DWAA events occurred | Percentage (%) | ||||||||
|---|---|---|---|---|---|---|---|---|---|---|---|
| 1st month | 2nd month | 3rd month | 4th month | 5th month | 6th month | 7th month | 8th month and above | Total number of times | |||
| Mild | 330 | 4 | 4 | 1 | 19 | 32 | 20 | 18 | 18 | 116 | 35.15 |
| Moderate | 74 | 2 | 1 | 0 | 16 | 14 | 2 | 2 | 6 | 43 | 58.11 |
| Severe | 37 | 1 | 0 | 0 | 6 | 8 | 3 | 1 | 3 | 22 | 59.46 |
| Total | 441 | 7 | 5 | 1 | 41 | 54 | 25 | 21 | 27 | 181 | 41.04 |
Table 7 Correlations between DWAAI values and SST anomalies in the Nino3.4 region before DWAA events |
| Sub-basins | Occur. frequency | Months before DWAA events occurred | |||||
|---|---|---|---|---|---|---|---|
| 1st month | 2nd month | 3rd month | 4th month | 5th month | 6th month | ||
| Hanjiang River watershed | 103 | 0.06 | 0.09 | 0.03 | 0.00 | 0.00 | 0.00 |
| Dongting Lake watershed | 144 | -0.06 | -0.04 | -0.06 | -0.05 | -0.07 | -0.06 |
| Poyang Lake watershed | 80 | -0.23 | -0.31 | -0.39 | -0.38 | -0.37 | -0.34 |
| Middle reaches of the Yangtze River | 47 | -0.44 | -0.42 | -0.36 | -0.23 | -0.20 | -0.18 |
| Lower reaches of the Yangtze River | 47 | -0.21 | -0.20 | -0.24 | -0.26 | -0.22 | -0.20 |
| Delta plains | 20 | -0.19 | -0.20 | -0.26 | -0.24 | -0.22 | -0.25 |
| Total basin | 441 | -0.12 | -0.12 | -0.15 | -0.14 | -0.14 | -0.12 |
Boldface and underline font indicate the correlations that are significant at the 0.05 level. |
Table 8 Correlations between DWAAI values and IEP/ICP before DWAA events |
| Sub-basins | Occur. frequency | Indices | Months before DWAA events occurred | |||||
|---|---|---|---|---|---|---|---|---|
| 1st month | 2nd month | 3rd month | 4th month | 5th month | 6th month | |||
| Hanjiang River watershed | 103 | IEP | 0.13 | 0.12 | 0.03 | 0.04 | 0.05 | 0.05 |
| ICP | 0.02 | 0.02 | 0.03 | -0.02 | -0.04 | -0.04 | ||
| Dongting Lake watershed | 144 | IEP | 0.03 | 0.10 | 0.04 | 0.09 | 0.02 | 0.01 |
| ICP | -0.11 | -0.13 | -0.08 | -0.15 | -0.16 | -0.14 | ||
| Poyang Lake watershed | 80 | IEP | -0.05 | -0.05 | -0.12 | -0.26 | -0.33 | -0.28 |
| ICP | -0.29 | -0.41 | -0.39 | -0.40 | -0.22 | -0.20 | ||
| The middle reaches of the Yangtze River | 47 | IEP | -0.19 | -0.25 | -0.39 | -0.26 | -0.23 | -0.27 |
| ICP | -0.24 | -0.30 | -0.25 | -0.11 | -0.08 | -0.00 | ||
| The lower reaches of the Yangtze River | 47 | IEP | -0.01 | -0.06 | -0.13 | -0.32 | -0.30 | -0.25 |
| ICP | -0.25 | -0.23 | -0.19 | -0.06 | -0.07 | -0.06 | ||
| Delta plains | 20 | IEP | 0.23 | 0.20 | -0.03 | -0.25 | -0.23 | -0.29 |
| ICP | -0.37 | -0.43 | -0.36 | -0.12 | -0.14 | -0.13 | ||
| Total basin | 441 | IEP | 0.01 | 0.02 | -0.05 | -0.07 | -0.10 | -0.09 |
| ICP | -0.15 | -0.18 | -0.14 | -0.12 | -0.10 | -0.09 | ||
Boldface and underline font indicate the correlations that are significant at the 0.05 level |
The authors have declared that no competing interests exist.
| 1 |
|
| 2 |
|
| 3 |
|
| 4 |
|
| 5 |
|
| 6 |
|
| 7 |
|
| 8 |
|
| 9 |
|
| 10 |
|
| 11 |
|
| 12 |
|
| 13 |
|
| 14 |
|
| 15 |
|
| 16 |
|
| 17 |
|
| 18 |
|
| 19 |
|
| 20 |
|
| 21 |
|
| 22 |
|
| 23 |
|
| 24 |
|
| 25 |
|
| 26 |
|
| 27 |
|
| 28 |
|
| 29 |
QX/T 370-2017. Identification Standard for El Niño/La Niño Events.
|
| 30 |
|
| 31 |
|
| 32 |
|
| 33 |
|
| 34 |
|
| 35 |
|
| 36 |
|
| 37 |
|
| 38 |
|
| 39 |
|
| 40 |
|
| 41 |
|
| 42 |
|
| 43 |
|
| 44 |
|
| 45 |
|
| 46 |
|
| 47 |
|
| 48 |
|
| 49 |
|
/
| 〈 |
|
〉 |