Special Issue: Land system dynamics: Pattern and process

Spillover effect offsets the conservation effort in the Amazon

  • DOU Yue 1 ,
  • Ramon Felipe Bicudo da SILVA 2 ,
  • YANG Hongbo 1 ,
  • LIU Jianguo , 1, *
Expand
  • 1. Center for Systems Integration and Sustainability, Michigan State University, East Lansing 48823, USA
  • 2. Center for Environmental Studies and Research, State University of Campinas, Campinas, 13083, Brazil
*Corresponding author: Liu Jianguo, University Distinguished Professor, specialized in sustainability and telecoupling. E-mail:

Author: Dou Yue (1987-), Postdoctoral Research Associate, specialized in land use and land cover changes and modeling. E-mail: yuedou@msu.edu

Received date: 2017-09-01

  Accepted date: 2018-01-15

  Online published: 2018-11-20

Supported by

US National Science Foundation Award, No.1518518

Complex Dynamics of Telecoupled Human and Natural System

Michigan AgBioResearch

São Paulo Research Foundation, No.15/25892-7

Copyright

Journal of Geographical Sciences, All Rights Reserved

Abstract

Diverse conservation efforts have been expanding around the globe, even under the stress of increasing agricultural production. A striking example is the supply-chain agreements put upon the Amazon forest which had reduced deforestation by 80% from the early 2000s (27,772 km2) to 2015 (6207 km2). However, evaluation of these conservation efforts usually focused on the impacts within the Amazon biome only, while the effects that spill over to other areas (e.g., displacement of environmental pressure from one area to another) were rarely considered. Ignoring spillover effects may lead to biased or even wrong conclusions about the effectiveness of these conservation efforts because the hidden cost outside the target area of conservation may offset the achievement within it. It is thus important to assess the spillover effects of these supply-chain agreements. In this study, we used the two supply-chain agreements (i.e., Soy Moratorium and zero-deforestation beef agreement) implemented in the Amazon biome as examples and evaluated their spillover effects to the Cerrado. To achieve a holistic evaluation of the spillover effects, we adopted the telecoupling framework in our analysis. The application of the telecoupling framework includes the interactions between distant systems and extends the analytical boundaries beyond the signatory areas, which fill the gap of previous studies. Our results indicate that the supply-chain agreements have significantly reduced deforestation by half compared to projections within the sending system (i.e., Pará State in the Amazon, which exports soybeans and other agricultural products), but at the cost of increasing deforestation in the spillover system (i.e., a 6.6 time increase in Tocantins State of the Cerrado, where deforestation was affected by interactions between the Amazon and other places). Our study emphasizes that spillover effects should be considered in the evaluation and planning of conservation efforts, for which the telecoupling framework works as a useful tool to do that systematically.

Cite this article

DOU Yue , Ramon Felipe Bicudo da SILVA , YANG Hongbo , LIU Jianguo . Spillover effect offsets the conservation effort in the Amazon[J]. Journal of Geographical Sciences, 2018 , 28(11) : 1715 -1732 . DOI: 10.1007/s11442-018-1539-0

1 Introduction

Conflicts between global food demands and limited land resources is one of the greatest challenges for humankind (Foley et al., 2005; Wu et al., 2011; Yao et al., 2017). One example is the striking increase of deforestation in the largest tropical forest, the Amazon biome in Brazil, since the late 2000s (Nepstad et al., 2014). Brazil is one of the leading global producers of agricultural commodities, where soybean holds a dominant role with its high economic return(http://atlas.media.mit.edu/en/visualize/tree_map/hs92/export/bra/all/show/2015/, last access, June 14, 2017). The global soybean demand from fast socio-economic development prompted farmers to clear Amazon forest for soybean production. A peak of deforestation in the Amazon occurred before 2005 when soybean fields expanded by one million hectares in the biome (Morton et al., 2006; Macedo et al., 2012). The rising deforestation rate caused environmental and ecological concerns about the associated increase in carbon emission, biodiversity loss, and regional discharge imbalance (Brando et al., 2013).
To address the conflicting demands for limited land resources for food production and ecosystem conservation, a wide range of initiatives have been implemented worldwide and achieved many ecological gains, including the deceleration of deforestation in Amazon (Nepstad et al., 2014; Gibbs et al., 2015). In addition to the conventional approaches (e.g., establishment of protected areas which has set aside 80% of the land for conservation), studies show that the voluntary interventions from commodity chains also play an important role in reducing deforestation in the Amazon. The Soy Moratorium was the first agreement in the tropical forest, signed by major agro-business traders (e.g., three companies, Cargill, ADM, and Bunge, control more than 60% of finance, production, and trading of soybean in Brazil) to stop purchasing soybean grown on lands deforested after July 2006. The cattle sector adopted a similar supply-chain agreement. Major beef buyers signed a zero-deforestation agreement and committed to sourcing beef raised only on land deforested before 2009. Due to these and other conservation efforts, the annual deforestation area in the Amazon biome decreased from 27,772 km2 in the early 2000s to 6207 km2 in 2015, an 80% reduction(http://www.obt.inpe.br/prodes/index.php, last access, June 14, 2017).
While deforestation in the Amazon has slowed down in the past decade, the deforestation rate in the Cerrado biome (i.e., tropical savanna) has surged, mainly due to the expansion of soybean land and pasture land (Soares-filho et al., 2014, Gibbs et al., 2015). Due to its gentle typography, affordable land price, and less strict environmental regulation, the Cerrado has always been an important destination for soybean producers. As the largest savanna biome in South America, the Cerrado covers more than 20% of Brazil. There is still around 40 million hectares of natural land in the Cerrado without legal protection, of which more than 20 million is suitable for agricultural production (Lambin et al., 2013). The Cerrado also has important biodiversity value. It is home to over 10,000 species of plants, almost half of which are endemic (Bond and Parr, 2010). Its endemic amphibians are higher than the Amazon (Bond and Parr, 2010). Therefore, the speeding deforestation trend in the Cerrado is alarming and calls for evaluation of possible causes and consequences.
Spillover effects are the effects caused by the human-nature interactions between different regions (Lambin and Meyfroidt, 2011; Liu et al., 2013, 2018). Conservation actions are often designed and implemented for a specific region or biome and their impacts are often evaluated without considering potential spillover effects to other places (Meyfroidt and Lambin, 2009; Lapola et al., 2010; Lambin and Meyfroidt, 2011). For instance, supply-chain agreements aimed at reducing environmental pressure in the Amazon biome may raise deforestation rates in neighbouring biomes and countries. The spillover effect, in this context, is the extra deforestation in the Cerrado that is caused by the voluntary agreements in the agreement-effective region. Although there are scholars who suspect the deforestation in the Amazon and Cerrado is associated, quantitative evidence on the possible spillover effects is lacking. Research is needed to diagnose if the agricultural and pasture land expansion in the Cerrado is accelerated by rules imposed inside the Amazon biome. Without considering the additional cost outside the boundary brought by the spillover effect, policy makers may be overly optimistic about the environmental achievement within the targeted area. Therefore, we urge a holistic evaluation of these agreements, including the spillover effects on the Cerrado biome outside of the Amazon biome, before these agreements are used as model examples to other regions under similar pressure.
Previous studies often frame and study spillover effects as indirect land uses on the targeted area (Lapola et al., 2010; Arima et al., 2011; Macedo et al., 2012), which neglect causes from other systems that can be essential. For instance, studies of indirect land uses of the Amazon or Cerrado rarely consider countries that import soybeans in their analyses. Without these countries’ demand for agricultural products, there would not be as much displaced environmental pressure from the Amazon to the Cerrado. To fill this gap, we use the telecoupling framework (Liu et al., 2013), which places coupled human-natural systems that are connected through flows (e.g., movements of commodity, information) as sending, receiving, and spillover systems. It provides a stage for scientists to systematically investigate the spillover effect caused by the supply-chain agreements in the Amazon. There are at least two advantages over previous studies: (1) The displaced environmental pressure is affected by both the reduction of available land in the targeted area as well as the increasing demand from the global market, hence the spillover effect is a joint result of the interactions between sending and receiving systems to the spillover system. (2) The telecoupling framework identifies systems, flows, causes, effects, as well as agents, which provides a more comprehensive evaluation of the spillover effect.
Using the telecoupling framework (application introduced in details in Section 2), this paper aims to diagnose and evaluate the spillover effect in the spillover system under the flows from both sending system (i.e., displaced land use pressure by the voluntary environmental agreements) and receiving system (e.g., the soybean demand from global market). We focus on two voluntary supply-chain agreements (i.e., Soy Moratorium-SoyM, G4 Zero Beef Deforestation) in this study, because they have been proven effective at reducing deforestation inside the Amazon, and they are likely to be adopted in similar places (Gibbs et al., 2015). The results of this paper (in Section 3) include the transferred environmental cost to the Cerrado biome due to the supply chain initiatives inside the Amazon biome. It is a coherent evaluation of the environmental implication beyond its effective boundary, bringing attention to the potential consequences to other regions that may offset the achievement within the targeted area. Deforestation process and other possible factors are included in discussion as well as the flows between the systems. With better understanding of the effects for both inside and outside the targeted area of supply-chain agreements, policy-makers can be more confident to implement similar approaches from supply-chain sector in other places. This work is also a demonstration of a type of spillover effects and how to apply the telecoupling framework to study and evaluate the effect.

2 Framework, data and method

2.1 Overview of a telecoupling framework for spillover effects

The telecoupling framework has been used by various cases to study sustainability and environmental issues (Wang and Liu, 2016; Sun et al., 2017, 2018). It naturally extends the concept of coupled human-natural systems and internalizes the feedbacks between distant systems by tracking the movements of money, commodities, and information as flows (Liu et al., 2013). Each place (e.g., a biome, or a soybean-importing country) is viewed as a coupled human-natural system with sending, receiving, and spillover roles, and important relevant factors and their interactions within and between the coupled systems (i.e., causes, effects, and agents) are also presented by the framework (Liu et al., 2007; 2013). One of its great potentials is that it emphasizes spillover systems and effects (Liu et al., 2015a; Yang et al., 2016) . Furthermore, the telecoupling framework is a systems approach for scientists to identify and analyze spillover effects that may be inadequately represented in other frameworks (Liu et al., 2016; Hulina et al., 2017). Details of the telecoupling framework can be found in Liu et al. (2013) and a few articles of applications (Deines et al., 2015; Wang and Liu, 2016; Yang et al., 2016; Hulina et al., 2017; Sun et al., 2017). Here we illustrate the agricultural expansion and deforestation issues using the telecoupling framework (Figure 1).
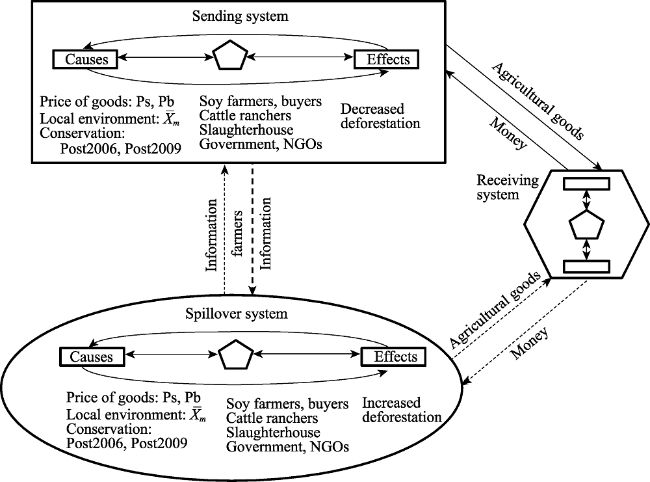
Figure 1 Spillover effects to Cerrado biome. The flow between sending and receiving systems is regulated by the agreements, but not the flow between spillover and receiving systems. We hypothesized the implementation of the conservation policies and agreements in the sending system may have increased the flow of information from sending system to the spillover system, causing more deforestation in the Cerrado than before as a spillover. Explanation of variables can be found in the following section.

2.2 Applying the telecoupling framework to deforestation in the Amazon and Cerrado

The Amazon biome is viewed as the sending system in this telecoupled system, because it exports soybeans and other agricultural products (Figure 1). Receiving systems are countries and regions that import agricultural products (e.g., soybean and beef) from the Amazon, the sending system. The demand from receiving systems significantly drives the price of these agricultural products which are sent from the sending system to the receiving system while money flows in the opposite direction. The flow from sending to receiving systems is soybean, beef, and other agricultural products. Soybean grown on land deforested after 2006 is more difficult to form a flow between sending and receiving systems because major trading companies will not purchase them based on the agreements. So is beef raised on land deforested after 2009. The flow of agricultural goods is regulated by these agreements.
The Cerrado biome is viewed as a spillover system in this telecoupled system, because its land-use dynamics might be affected by the interactions between the sending and receiving systems. The flows between the receiving system and the spillover system are also the agricultural goods and money. The flows between the sending system and the spillover system are the information of policy, agreements, and market, perhaps also the migration of farmers or crops to less regulated areas (Gibbs et al., 2016). The role of each place and system in a telecoupled system can change based on the directions of flows and research questions. For instance, the Cerrado is an important agricultural region in Brazil, so it can be considered as a sending system in other telecoupled cases when one is interested in the soybean export from the Cerrado to other countries. Because our focus is the displaced deforestation from the Amazon to the Cerrado, we view the Cerrado as a spillover system.
In the sending and spillover systems, we chose one state each as a representative. We use Pará from the Amazon biome as the targeted area of supply chain interventions and Tocantins from the Cerrado as the representative of the spillover system (Figure 2), because these two states have experienced drastic land use changes and are in the agricultural frontiers in the two biomes. The area of Pará is 1,247,690 km2, 14% of the Brazilian territory (Santos and Oliveira, 2017) and 64% of which was covered by forest in 2015 (i.e., 794,383 km2 of forest in 2015 based on INPE data). The population of Pará is 7.8 million in 2012, ranking ninth in the country. However, its per capita gross domestic production (GDP) only ranks 22nd out of 27 in the country. Pará had a rapid deforestation rate that peaked in 2004, reaching 8870 km2, which is 0.7% of the entire state area. The main driving factors for forest loss in Pará are expansion of pasture land, crop area, and logging (Morton et al., 2006). Pará State within the Amazon Basin (nearly 70% of its territory) has concentrated rainfall from October to April and a spatial variability in annual precipitation ranging from 1500 mm to 3000 mm (Bastos and Pachêco, 2005). The state’s elevation varies from the sea level in the coastal zone to terrains up to 850 m in the north of Pará formed by crystalline basement morphostructural units (Furtado and Ponte, 2013).
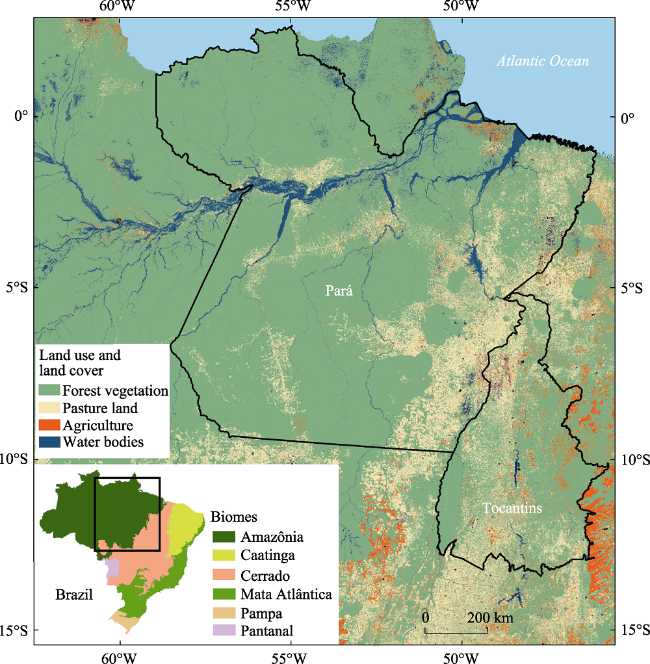
Figure 2 Location of Pará (sending system) and Tocantins (spillover system) in Brazil. Pará is in the Amazon biome. Tocantins is on the edge of Amazon and Cerrado, 87% of its area is in Cerrado biome that strict Brazilian Amazon regulation does not apply.
Located in central Brazil, Tocantins was established in 1988 and has an area of 277,621 km2 (Figure 2), 87% of its area is Cerrado and not applicable for the SoyM or other Amazon-related environmental policies. Based on land cover data from LAPIG (Laboratório de Processamento de Imagens e Geoprocessamento in Portuguese, Laboratory of image processing and geoprocessing), 65.9% of the state was still covered by Cerrado native vegetation in 2013, which is known as the Brazilian savanna (Klink and Machado, 2005; Santopuoli et al., 2016). The planted soybean area in the state increased from 660 km2 in 2000 to 8496 km2 in 2014, but the state still has 14,140 km2 of natural vegetation that can be legally converted to soybean or range field. The gross production value of soybean in Tocantins was almost 2 billion Reais (Brazilian currency, equivalent to 615 million USD) in 2014 and comprises 37% of the state’s GDP. Tocantins is in Aw climate zone according to the Köppen system with humid summers and dry winters (Almeida, 2012). There are five regional climatic areas with a distribution of total annual precipitation ranging from 1300 mm in the south to 2100 mm in the middle-west (Almeida, 2012) within the state. Half of the state’s topography is smaller than 10% (Almeida, 2012), suitable for mechanized agricultural practices such as soy and maize (Silva et al., 2016).

2.3 Spillover effects on land cover: data and empirical methods

There are a few studies of the deforestation phenomenon and some on indirect land use, from which we selected several cases that discuss the deforestation in the Cerrado and Amazon (Table 1). However, none of these studies provided concrete evidence on the spillover effects, specifically the effects to the Cerrado after the implementation of the agreements with the soybean and beef industries, despite speculation (Nepstad et al., 2014; Gibbs et al., 2015). These studies have not been able to investigate flows and causes and effects in a comprehensive way. To address these limitations, we focus on the effects of the two voluntary agreements in the spillover system - the Tocantins state in the Cerrado biome - using the telecoupling framework. This study is the first attempt to put spillover effects of the two agreements under the telecoupling framework. It utilizes the telecoupling framework to achieve a systematic view over the spillover effects and can be used as a foundation for further studies that include agents in the telecoupled system and evaluates more causes and effects.
Table 1 Contexts and methods used to study deforestation and land use in Brazil in current literatures
Reference Region Temporal period Land use and land cover changes Control variables Model or method Analytical framework
Macedo et al., 2012 Mato Grosso 2001-2010 Post-deforestation land use, indirect land use Market trends
Climate variability
Yield
Cost of
production
Correlation No framework used, identified policies and market trends as external factors to land use changes in MT.
Richards et al., 2014 Amazon 2002-2011 Deforestation, indirect land
use
Market trends
Local effects
Indirect agricultural influence
Spatial regression No framework used, indirect influence was calculated as weighted distance.
Arima et al., 2011 Legal Amazon 2003-2008 Deforestation, indirect land
use
Soybean planted area
Cattle herd
Precipitation
Farm gate price for cattle
Fixed effect spatial regression No framework used, distance was measured in the regression.
Barona et al., 2010 Legal Amazon 2001-2006 Deforestation, indirect land use Pasture land change,
Cropland change
Linear regression No framework
Spera et al., 2014 Mato Grosso 2001-2011 Land use
transition
Land characters t-test No framework
Most case studies use regression to investigate the statistical relationship between explanatory factors (e.g., soybean price change, rainfall level) and deforestation trends as the dependent variable. Following the common practice on this issue, our analysis is an application of panel socio-economic (i.e., the price of agricultural goods) as well as the environmental characteristics (e.g., road network density, size of available land) of each municipality to explain its deforestation magnitudes under the framework of telecoupling. These socio-economic and environmental characteristics are the causes in the sending and spillover systems (Figure 1). We use time-series data from 2003 to 2015 to demonstrate the deforestation trajectories in both study sites so that we can identify changes responding to the policies and regulation in the Amazon as the effects in the sending and spillover systems (Figure 1).
The deforestation rate was aggregated at the municipality level (i.e., 144 municipalities in Pará, the sending system, and 139 municipalities in Tocantins, the spillover system), using the spatial deforestation data retrieved from PRODES (Monitoramento da Floresta Amazônica Brasileira por Satélite) and LAPIG. Socio-economic data and transportation data are acquired from Brazil Institute of Geography and Statistics (IBGE). Specifically, we first analyzed the deforestation trends in the sending and spillover systems in three time periods: before SoyM in 2006, after SoyM before beef agreement (2006-2009), and after beef agreement (since 2009), to understand the general patterns of deforestation dynamics. Both aggregated deforestation areas and deforest parcels in sending and spillover systems were compared for a thorough picture of deforestation dynamics.
Furthermore, we modeled (Equation 1) deforestation (Dm,t , in log model for normality) as a function of soybean and cattle market influence (ps, pc), policy influence (Post2006, Post2009), and of spatial variation (${{\bar{X}}_{m}}$), as well as random error (ε). We represented the effects from the two interventions as dummy variables that interact with the market, following a similar conceptual model from Assunção et al. (2015). We included receiving systems using current and lagged prices, because changes in price will have a delayed impact from the decision of deforestation to the action of deforestation. Spatial variations of municipalities were represented by local variables (i.e., the available land size in each municipality, and road density) and the distal effect (i.e., the distance of roads from the municipality to the nearest port).
$\begin{align} & \log ({{D}_{m,t}})={{a}_{1}}{{p}_{s,t}}Post\text{2006+}{{a}_{\text{2}}}{{p}_{s\text{,}t-\text{1}}}Post2006+{{a}_{3}}{{p}_{c,t}}Post\text{2009+}{{a}_{\text{4}}}{{p}_{c\text{,}t-\text{1}}} \\ & \ \ \ \ \ \ \ \ \ \ \ \ \ \ \ \ Post2009+{{a}_{5}}{{{\bar{X}}}_{m}}+\varepsilon \\ \end{align} (1)$
The model was applied in both sending system (Pará) and spillover system (Tocantins). In the model applications of both systems, the variable of key interests is the coefficients of price and policy (i.e., a1, a2). However, they have different meanings. In the application of Pará, this coefficient shows if the agreements are effective at reducing deforestation. Meanwhile, this coefficient is the spillover effect in Tocantins, outside the protected region. We run the model at both systems in order to (1) prove the effectiveness of these agreements in the sending system, and (2) to evaluate the magnitude of the spillover effect and to what degree the effectiveness is offset in the spillover system.
While no direct method is available to quantify the avoided deforestation in the sending system and spillover deforestation in the Cerrado, it can be approximated by establishing baseline rates (business as usual) of forest loss prior to the implementation of SoyM and project these forward as if they had not been implemented, under the alternative condition Post2006=0 and Post2009=0. We then accumulate the deforestation across all municipalities for each year in each system to calculate the total deforestation over time in the absence of such agreements and compare with the observed deforestation.

3 Results

3.1 The pattern of land cover dynamics in sending and spillover systems

3.1.1 Deforestation patterns in the two systems
Total deforestation shows opposite patterns in the two systems, which are a downward trend in Pará, the sending system, but an increasing trend in Tocantins, the spillover system. In 2003, the total deforested area in the sending system (Pará) was 11,271 km2. The annual deforestation rate reached a record low in 2012 at 1714 km2 and remained the same until 2015. The annual deforestation percentage (i.e., the deforested area at this year compared to the total available vegetation area) in Pará dropped from 7.8% in 2003 to 2.5% in 2015 (Figure 3). Especially since the implementation of the beef agreement in 2009, the annual deforested area has been less than a quarter of the forest-loss size in 2003 (e.g., from 11,271 km2 in 2002 to average of 2272 km2 since 2009).
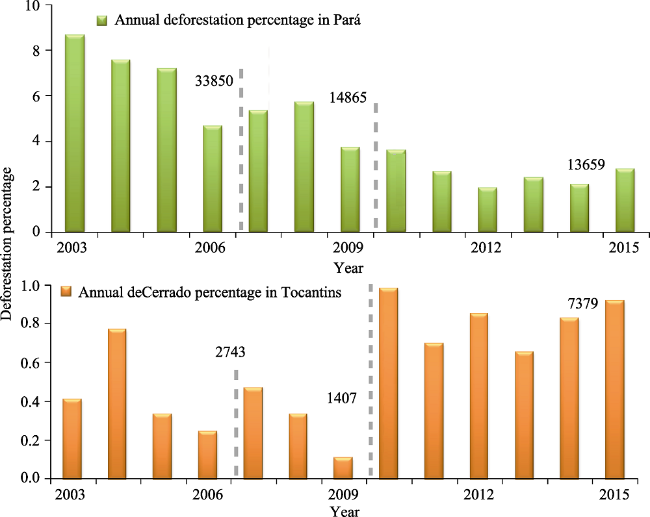
Figure 3 Annual deforestation rate in sending (Pará in Amazon) and spillover (Tocantins in Cerrado) systems
In the spillover system, however, the annual deforestation rate in Tocantins shows an upward trend, growing from 0.36% in 2003 to 0.8% in 2015. From 2003 to 2015, the average annual deforested area in Tocantins was 645 km2 (0.6 %). However, the average annual deforestation area after 2009 (i.e., 1230 km2) was almost twice the size before SoyM (i.e., 686 km2).
3.1.2 Patterns of deforested parcels in the sending and spillover systems
The parcels being cleared also show different patterns in the sending and spillover systems (Figure 4). The size of deforested parcels in the sending system keeps decreasing. The mean size of deforested parcels before SoyM in 2006 was 59.2 km2 (standard deviation 144.9). This number dropped to 34.6 km2 (standard deviation 86.0) for the period of 2007-2009 and was only 15.9 (standard deviation 38.2) after the beef agreement in 2009. Parcels deforested after 2009 were less than 1/3 the size of parcels being deforested before 2006.
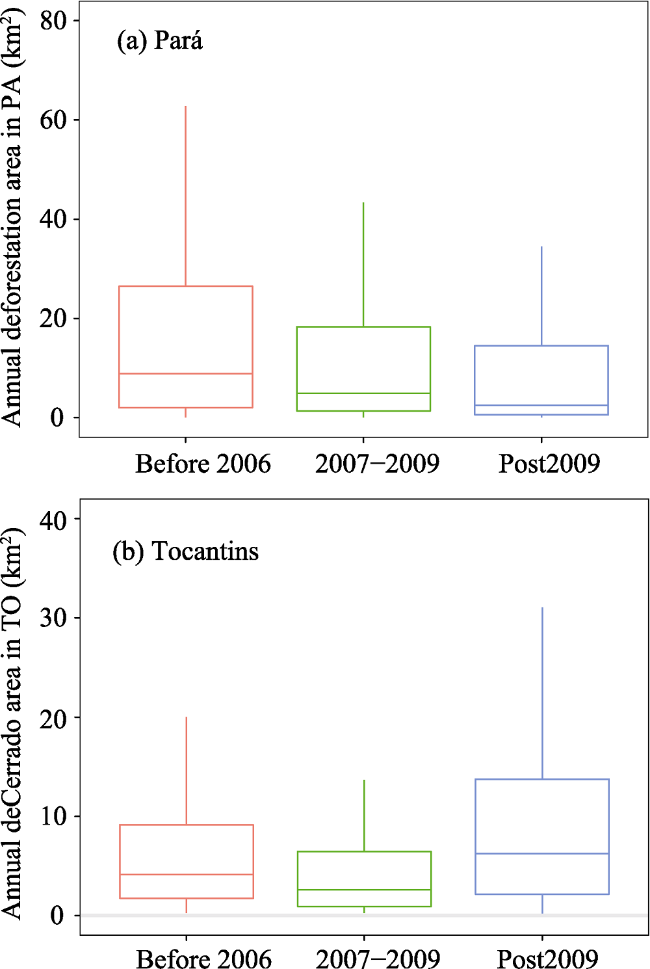
Figure 4 Descriptive statistics of deforested parcels in the sending (Pará) and spillover systems (Tocantins)
In the spillover system, the mean size of deforested parcels increased from 4.9 km2 (standard deviation 10.3) before 2006 to 8.8 km2 (standard deviation 13.9) since 2009. The parcels being cleared in the sending system are significantly different in size across the three periods, confirmed by Analysis of Variance (ANOVA) and paired comparison. Same statistical significance also exists in the spillover system.

3.2 Supply-chain agreements on deforestation in the sending and spillover systems

Factors such as commodity price, agreements, and bio-physical and socio-economic variations of municipalities can affect deforestation (Table 2). The coefficient on the dummy variable of SoyM (Post2006) is positive in the sending system but not statistically significant. It is statistically significant and negative in the spillover system. The estimated coefficients on current soybean price (i.e., soybean price at the same year with deforestation rate) are statistically significant in both sending and spillover systems. More important, the coefficients on the interaction term between soyM (i.e., the dummy variable of Post2006) and current soybean price are significant and opposite in the two systems. Specifically, for every extra one USD increase in soybean price when holding other variables constant, we see deforestation reduction by 9.12 km2 (i.e., -1.74 of the interaction effect and 0.78 from the current soybean price) in the sending system, but deforestation increase by 5.01 km2 (i.e., 4.05 of the interaction effect and -3.35 from the current soybean price) in the spillover system.
Table 2 Significance and coefficient of variables to deforestation in sending (Pará) and spillover (Tocantins) systems
PA coefficient P-value TO coefficient P-value
(Intercept) -2.44 *** -0.46
Soybean price lagged -0.30 0.12
Soybean price current 0.78 * -3.35 ***
Post2006 0.46 -0.70 **
Soybean price lagged: Post2006 0.59 -0.84
Soybean price current: Post2006 -1.74 *** 4.05 ***
Beef price current 0.06 -0.04
Beef price lagged -0.10 * -0.19 **
Post2009 -0.59 * -0.85 **
Beef price current: Post2009 -0.10 0.01
Beef price lagged: Post2009 0.18 . 0.29 ***
Road density 0.61 *** -1.32 *
Distance to closest major ports 0.00 *** 0.00
Available area 0.39 *** 0.76 ***
R-square 0.53 0.34

Significance codes: 0 ‘***’, .001 ‘**’, 0.01 ‘*’, 0.05 ‘.’, and 0.1 ‘ ’ 1

In the beef sector, the coefficient of zero-deforestation agreement is statistically significant and negative in both sending and spillover systems. Specifically, for every extra one-unit increase in beef price when holding other variables constant, we will see deforestation reduction by 1.2 km2 (i.e., 0.18 of the interaction effect and -0.10 from the lagged beef price) in the sending system, deforestation increase by 1.26 km2 (i.e., 0.29 of the interaction effect and -0.19 from the lagged beef price) in the spillover system.

3.3 Statistical projections of deforestation in the absence of agreements

Forest loss without the agreements will be much higher in the sending system and lower in the spillover system based on the projections. The observed deforestation in the sending system (Pará) totaled 28,524 km2 since the first implementation of SoyM (Figure 5, through 2007 to 2015). We estimated that, had the conservation actions introduced in 2006 and 2009 not been adopted, this total would have equaled 58,966 km2, a 30,442 km2 more (107% increases). Deforestation in the sending system would have kept an upward trend if there were no agreements.
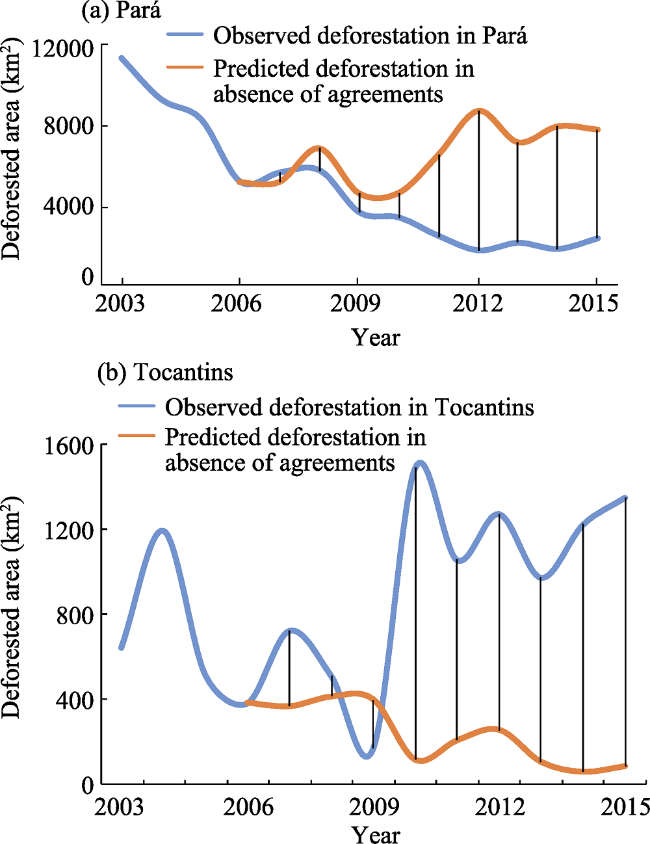
Figure 5 Projection of deforestation in the absence of agreements: (a) observed and predicted deforestation in sending system (Pará); (b) observed and predicted deforestation in spillover system (Tocantins)
On the other hand, the observed deforestation in the spillover system (Tocantins) since the implementation of the SoyM has been in a growing trend, with a sum of 7944 km2 through 2007 to 2015. The estimated deforestation in the spillover system without the two agreements in the sending system, however, would be 1206 km2. The deforestation that is introduced to this spillover system due to the displaced land clearing pressure is more than five times the projected deforestation.

4 Discussion

4.1 The role of soybean and beef expansion in deforestation

Our regression aims to explain the deforestation patterns in the sending and spillover systems. In this section, we discuss the magnitude of soybean planted areas, pasture land, and the correlation with deforestation and other factors, to explore the deforestation process caused by spillover effects. We also did a robust check on the regressions to prove the rigor of our analysis. The benefits of using the telecoupling framework to study spillover effect are also discussed.
4.1.1 Soybean planted areas in the sending and spillover systems
The soybean planted area has expanded in both sending and spillover systems (Figure 6). The total land planted with soybean in 2015 was bigger in the spillover system, which was 8096 km2 (i.e., 0.65% of Pará’s total area) compared to the 3248 km2 in the sending system (i.e., 1.2% of Tocantins’ total area). However, the overall growth rate of soybean planted area in the sending system was twice the growth rate in the spillover system. In both states, the soybean planted area went through a plateau period until 2009 before the expansion started again.
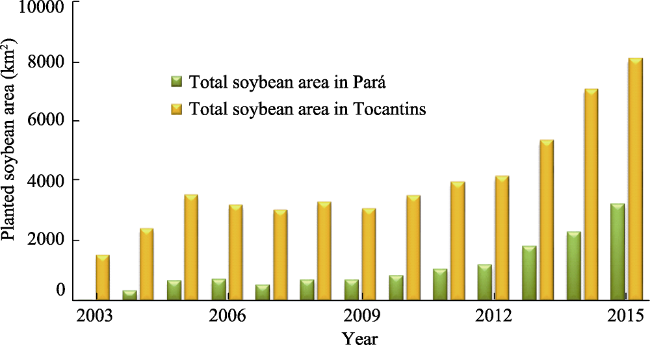
Figure 6 Planted soybean area in the sending (Pará) and spillover (Tocantins) systems from 2003 to 2015
4.1.2 Soybean and deforestation in the sending and spillover systems
Previous literatures have shown that pastures is the primary driver for deforestation in the Amazon (Nepstad et al., 2014). During the soybean boom, soybean and other crops expanded directly into the forest and took over degraded pastures. Since the SoyM, direct expansion has been stopped by the agroindustry-led initiative. However, the soybean-planted area in the Amazon keeps growing, which is likely land converted from the pastures. This may push the pastures displaced in other plots or other regions to clear forest at a lower cost. We did a correlation test between soybean-planted area with deforestation area at current year and year before (Table 3) in each municipality in the two states. Results show that soybean-planted area at current year (t) is positively correlated with area cleared two years ago (t-2). It is also positively correlated with soybean yield, but not significantly correlated with soybean price. This may be explained by the fact that the deforested land in the Amazon is first used for cattle ranching, and after two-years preparation then can be used to plant soybeans.
Table 3 Soybean planted area and its correlation with deforestation and other factors
Pará Tocantins
Correlation Significance Correlation Significance
Deforestation t + ***
Deforestation t-1
Deforestation t-2 + **
Soybean yield + *** + ***
Soybean price t + ***
Soybean price t-1 + ***

Note: Significance codes: 0 ‘***’, .001 ‘**’; '+' means positive correlation.

However, the land use process can be different in the Cerrado, particularly due to the spillover effect from the restriction of environmental regulation. The soybean-planted area is positively correlated with area cleared at current year in the Cerrado. Similar to the Amazon, it is also positively correlated with soybean yield, but also significantly correlated with current and lagged soybean price. The deforested area in Tocantins might be used to plant soybeans directly, without the ranching process, hence it is significantly correlated with current soybean price and yield.
4.1.3 Pasture land and deforestation in the sending and spillover systems
Pasture land has expanded in both sending and spillover systems (Figure 7), increasing from 7.2% to 11.5% in the sending system (Pará) and 20.5% to 22.6% in the spillover system (Tocantins) from 2003 to 2015. However, the expansion of pasture land in the two systems shows different temporal patterns and they fit well with the implementation of the agreements. For example, before SoyM, pasture land increased in both sending and spillover systems. After SoyM, the increasing of pasture land in Pará slowed down and pasture even decreased in Tocantins. This might be because soybean land took over the expansion of pasture land in the Cerrado, causing a decrease of pasture land in Tocantins. Other reasons such as the shrinkage of the global soybean market may explain the overall reduction of deforestation from 2006-2009 in Tocantins.
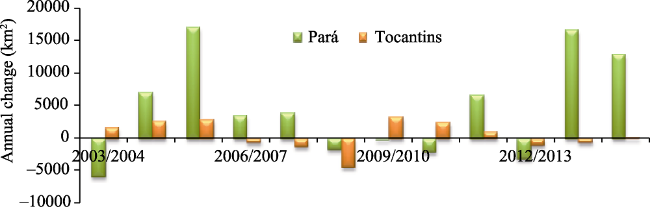
Figure 7 Annual change of pasture land size in the sending system (Pará) and the spillover system (Tocantins) from 2003 to 2015
After the implementation of zero beef deforestation agreement in 2009 until 2013, the pasture land in the sending system had a decreasing trend while the spillover system had another rapid expansion period, which fit the agreement and the spillover effects. However, after 2013, the trends in the two systems have swapped: it roared as high as before 2006 in the sending system and decreases in the spillover system. According to the latest estimation from INPE(http://www.inpe.br/noticias/noticia.php?Cod_Noticia=4344), the deforestation in the Amazon is going back up fast. It could be due to the high demand of soybean and beef from the global market while policy regulation and voluntary agreements are becoming less effective, which needs further investigation.
4.1.4 Hypothetical deforestation process in the sending and spillover systems
Based on previous studies and the deforestation patterns that we identified in this paper, it is possible that the soybean expansion and pasture expansion were displaced from the sending system to the spillover system (Figure 8). For instance, the deforestation caused by the soybean boom has been stopped or slowed down by the implementation of SoyM. However, new soybean plots have replaced old pasture land and then have displaced pasture land to other forest plots as well as to the Cerrado biome where restriction is not as strictly implemented. Moreover, the implementation of voluntary agreements in the beef sector leaves no legal space for further deforestation. Legally, unless the yield increasing or agricultural intensification in both soybean and beef sectors can meet the market demand at current available agricultural land level, the pressure of expansion is likely to be released to the spillover system that is also in the market (Macedo et al., 2012).
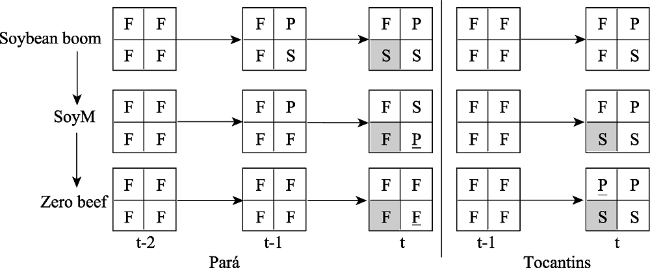
Figure 8 Possible deforestation processes before and after agreements in the sending (Pará) and spillover (Tocantins) systems. F is short for Forest, P for Pasture land, and S for Soybean land. The left section is the land use processes in Pará, the Amazon biome while on the right is the land use processes in Tocantins, the Cerrado biome, with pattern filling indicating displaced soybean land use (or saved forest) and underline indicating displaced pasture.

4.2 Robust check of the analysis

4.2.1 Other factors may affect deforestation
There are other factors that may affect farmers’ decisions on expanding the ranch land and agricultural land by interacting with the agreements. For instance, the intensification of soybean and beef has been shown to be the path of decoupling deforestation and agricultural expansion, which is more environmental friendly (Macedo et al., 2012; Lapola et al., 2014). This may facilitate the effectiveness of the two agreements on reducing deforestation. The soybean industry has helped develop local economies (Garrett and Rausch, 2016). The development of local infrastructure and economy, in turn, can improve the accessibility to new land hence facilitate more deforestation. We ran a few alternative models with these factors including soybean yield and GDP industry (Table 4). However, the soybean yield is not presented in all municipalities and GDP industry is not available after 2013. Based on the alternative regression, both factors are not statistically significant with deforestation increment in sending and spillover systems. In addition, for a higher R2 by including the two factors, the trade-offs are a much smaller sample size. Therefore, we believe the original regression is robust to interpret the deforestation pattern on both sample size and representative.
Table 4 Alternative models of deforestation
Sending (Pará) Sample size Soybean yield
impact
R2
Current model 748 Not applicable 0.59
Soybean yield 203 Not significant 0.63
GDP industry t & t-1 543 Not significant 0.59
Spillover
(Tocantins)
Sample size Soybean yield
impact
R2
Current model 1186 Not applicable 0.35
Soybean yield 580 Not significant 0.36
GDP industry t & t-1 782 Not significant 0.32
4.2.2 Other factors in soybean trading may have affected deforestation
Global trading of agricultural commodities is complex and many factors in the trading process may affect deforestation. A large proportion of agricultural production in Brazil is exported to other countries and is traded in US dollars. The soybean price in the Chicago Board of Trade (CBOT) fluctuates daily and the price changes to local currency when it reaches local market. The price of soybean commodity depends on the global market as well as the exchange rate between US dollars and Brazilian currency, thus local farmers’ soybean planting and expansion decisions are influenced by the fluctuations in the exchange rate and soybean price at CBOT. Due to data limitations, the price proxy we used in the regression in this study is the average annual soybean price in US dollars, which can’t represent the full complexity of global trading at a local level (Figure 9). The soybean price here shows a downward trend from 2006 to 2008 in another period from 2010 to 2012. The timing of these two declines fits the timing of the two agreements, which may have contributed to the negative coefficients of the agreement implementation that we got from the regression. Therefore, the spillover effect of the agreements might still be positive in the spillover system but due to the price decline, the regression model may be too conservative at predicting the saved deforestation.
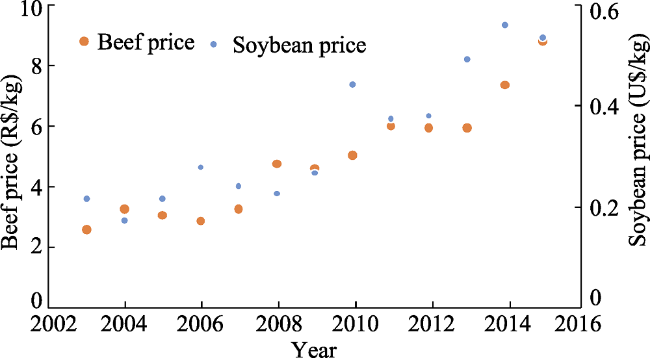
Figure 9 Soybean and beef price used in regression of deforestation with other factors in Equation 1
Besides the currency fluctuation in trading, the time lag from farmers’ decision to their action may also affect deforestation and land use processes and patterns. Due to magnitude of the farm operation and the increasing cost of agricultural input, soybean farmers often sign contracts with international agribusiness companies a year ahead of the actual plant and harvest year in order to get loans. For simplicity, we only use current and one-year lagged soybean and beef price, which may not fully reflect the economic incentives that farmers have when they make the expansion or deforestation decision in a time span such as three years or longer. In the next step, we can further identify and place these factors in the telecoupling framework, to link these factors with deforestation patterns and processes so that we can explore means to reduce deforestation and spillover effects.
4.2.3 Policy interacting with agreements
The recent success to combat deforestation in the Amazon is believed to be a collective effort from multiple actors, including government agencies, research institutes, and supply chains. There is a growing body of literature that recognizes the contribution of policy changes and supply-chain agreements leading to the recent success of environmental conservation in the Amazon biome (Macedo et al., 2012; Nepstad et al., 2014; Gibbs et al., 2015). However, it is hard to disentangle the effect of a single policy or agreement. Before the 2006 SoyM, Brazil had launched the Action Plan for the Prevention and Control of Deforestation in the Legal Amazon in 2004. The action coordinated a large set of federal, state and municipal governments, along with key organizations, including the National Institute of Spatial Research (INPE) to enforce strict monitoring activities (e.g., real-time remote-sensing forest monitoring technology). The first turning point of deforestation trajectory, in fact, occurred in the 2004, before the implementation of any supply-chain agreement. Therefore, the hypothesis of our regression (i.e., the spillover effect is caused by the implementation of two voluntary supply-chain agreements) is under the influence of the implemented policies. We want to point out that no single force could successfully slow down the deforestation. Our test of the spillover effect proves effectiveness of agreements (i.e., the periods of agreements being implemented) and does not disprove the effectiveness of policies such as the Action Plan.
Policies and agreements can play different roles in slowing down deforestation or have different levels of effectiveness. For instance, SoyM is less likely to be violated because there are a limited number of soybean buyers and it is easy to enforce. However, the Forest Code, a government policy itself is not sufficient enough to enforce the property registration and prevent further clearing of forest (Gibbs et al., 2015). On the other hand, the beef voluntary agreement is also easy to violate due to the mobility of cattle. A study of beef agreement participants demonstrates the possibility that ranchers sell to neighboring slaughterhouses that are not in the agreement (Gibbs et al., 2016). Therefore, both voluntary agreements and government policies should be in place for environmental success (Lapola et al., 2014).

4.3 Benefits of using the telecoupling framework

4.3.1 Identifying possible environmental consequences of spillover effect using the framework
Following our results and an estimation of carbon emissions due to deforestation in the Amazon and Cerrado biomes (Lapola et al., 2010), we did an estimation of the carbon emission associated with the deforestation in the two biomes. The carbon emission saved by the reduced deforestation in the Amazon could be offset by 22.4% due to the spillover effect to the Cerrado. We caution that while the conservation efforts from various sectors in the Amazon biome may lead to a downturn of forest loss, however, it may have displaced the environmental pressure outside of the targeted area hence cause more unknown environmental problems.
When using the agreements as a model example to design market-led or other similar conservation plans, the telecoupling framework can be used for a thorough investigation of the patterns and processes in distantly connected systems in order to have a more comprehensive evaluation of potential spillover effects.
4.3.2 Connecting distant systems by flows in the telecoupled system
Another main advantage of the telecoupling framework is that it provides a stage to study the flows between systems over a great distance (Deines et al., 2015; Liu et al., 2015b) where other studies are missing (Zhang et al., 2016). The flow between sending and spillover systems is hard to quantify, so here we demonstrate the flows of soybean traded from the sending and spillover systems to the receiving system (Figure 10). The conservation efforts in the sending system have not hindered the flow’s growth. The flow of soybean from the sending system to the receiving system has increased drastically from 2003 to 2015. For instance, the flow of soybean exported by the sending system (Pará) increased from 67,000 tons in 2003 to 830,000 tons in 2015, a 12-fold growth. It had been through a slow increase from 2006 to 2009, but has maintained a stable increasing trend since then. This could be caused by the soybean recession or the implementation of SoyM, which regulates the soybean producers in the Amazon from expansion of land to intensification with yield growth.
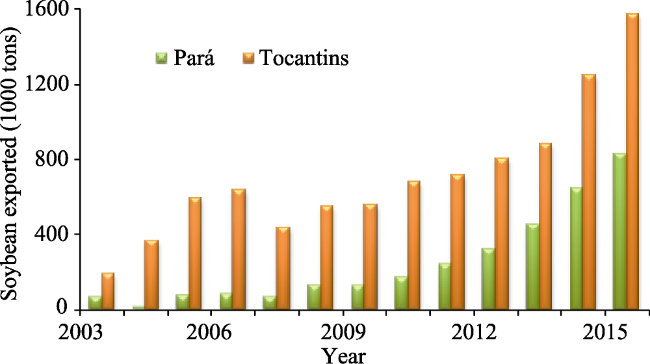
Figure 10 Soybean exported from the sending (Pará) and spillover (Tocantins) systems
The flow of soybean from the spillover system to the receiving system, however, has declined almost 200,000 tons from 2006 to 2007 (Figure 10). It was not until 2010 that soybean export from Tocantins to other countries went back to the level in 2006. This decline matches the global soybean market fluctuation. We also observe the decline of deforestation and pasture land in Tocantins during the same period. Another possible reason for the decline of soybean export from this spillover system to receiving system is climate events. Crops in Cerrado are vulnerable to droughts and hot weather. In the future, we plan to track the flow and explore how it affects the spillover effects through changing agents’ behaviors in the two systems.

5 Conclusion

Our results first demonstrated decreases in both aggregated area and parcel sizes of deforestation in the sending system, which confirms the positive effect from the implementation of the two voluntary agreements. However, with the help of the telecoupling framework, we investigated the simultaneous deforestation patterns in the Amazon and Cerrado biomes and identified the deforestation pressure displaced outside. The two regression analyses show that in the global market of soybeans, the implementation of the voluntary agreements is positive at reducing the deforestation in the sending system, from projected 58,966 km2 to observed 28,524 km2 in Pará State in the Amazon. Meanwhile, the agreements also have spillover effects of increased deforestation occurring outside the targeted area, the spillover system, when the market has increasing demand. Deforestation in Tocantins State of the Cerrado has increased from projected 1206 km2 to 7944 km2 through 2007 to 2015.
Deforestation in the tropics has complicated causes and processes. Besides the regression used, we also collected and presented data in the telecoupling framework to support our results from the regression. The pattern of soybean planted area and pasture land could explain the deforestation process in the sending and spillover systems, particularly after the implementation of the supply-chain agreements. Besides the factors used in the regression, other possible causes of the deforestation (e.g., the fluctuation of soybean price, policies, and time lags) in the telecoupled system were discussed. The demonstration of soybean flow from the sending and spillover systems to the receiving system again proves the advantage of using telecoupling framework, which binds comprehensive information in a systematic way.

Acknowledgements

We thank Sue Nichols for her constructive comments and edits, and Dr. Mateus Batistella for his helpful critiques and insights.

The authors have declared that no competing interests exist.

[1]
Almeida L B, 2012. Zoneamento Geoambiental do Estado do Tocantins. Rio Claro, Sao Paulo.

[2]
Arima E Y, Richards P, Walker R et al., 2011. Statistical confirmation of indirect land use change in the Brazilian Amazon.Environmental Research Letters, 6(2): 1-7.Expansion of global demand for soy products and biofuel poses threats to food security and the environment. One environmental impact that has raised serious concerns is loss of Amazonian forest through indirect land use change (ILUC), whereby mechanized agriculture encroaches on existing pastures, displacing them to the frontier. This phenomenon has been hypothesized by many researchers and projected on the basis of simulation for the Amazonian forests of Brazil. It has not yet been measured statistically, owing to conceptual difficulties in linking distal land cover drivers to the point of impact. The present article overcomes this impasse with a spatial regression model capable of linking the expansion of mechanized agriculture in settled agricultural areas to pasture conversions on distant, forest frontiers. In an application for a recent period (2003-2008), the model demonstrates that ILUC is significant and of considerable magnitude. Specifically, a 10% reduction of soy in old pasture areas would have decreased deforestation by as much as 40% in heavily forested counties of the Brazilian Amazon. Evidently, the voluntary moratorium on primary forest conversions by Brazilian soy farmers has failed to stop the deforestation effects of expanding soy production. Thus, environmental policy in Brazil must pay attention to ILUC, which can complicate efforts to achieve its REDD targets.

DOI

[3]
Assunção J, Gandour C, Rocha R, 2015. Deforestation slowdown in the Brazilian Amazon: Prices or policies? Pages 1-5 Environment and Development Economics.

[4]
Bastos T X, Pachêco N A, 2005. Freqüências de Chuva no Estado do Pará no Plano Microrregional. Page Boletim de Pesquisa e Desenvolvimento. Belem, Para.

[5]
Bond W J, Parr C L, 2010. Beyond the forest edge: Ecology, diversity and conservation of the grassy biomes.Biological Conservation, 143(10): 2395-2404.

DOI

[6]
Brando P M, Coe M T, DeFries R et al., 2013. Ecology, economy and management of an agroindustrial frontier landscape in the southeast Amazon.Philosophical Transactions of the Royal Society of London. Series B, Biological Sciences, 368(1619): 1-9.The papers in this special issue address a major challenge facing our society: feeding a population that is simultaneously growing and increasing its per capita food consumption, while preventing widespread ecological and social impoverishment in the tropics. By focusing mostly on the Amazon's most dynamic agricultural frontier, Mato Grosso, they collectively clarify some key elements of achieving more sustainable agriculture. First, stakeholders in commodity-driven agricultural Amazonian frontiers respond rapidly to multiple forces, including global markets, international pressures for sustainably produced commodities and national-, state- and municipality-level policies. These forces can encourage or discourage deforestation rate changes within a short time-period. Second, agricultural frontiers are linked systems, land-use change is linked with regional climate, forest fires, water quality and stream discharge, which in turn are linked with the well-being of human populations. Thus, land-use practices at the farm level have ecological and social repercussions far removed from it. Third, policies need to consider the full socio-economic system to identify the efficacy and consequences of possible land management strategies. Monitoring to devise suitable management approaches depends not only on tracking land-use change, but also on monitoring the regional ecological and social consequences. Mato Grosso's achievements in reducing deforestation are impressive, yet they are also fragile. The ecological and social consequences and the successes and failures of management in this region can serve as an example of possible trajectories for other commodity-driven tropical agricultural frontiers.

DOI PMID

[7]
Deines J M, Liu X, Liu J, 2015. Telecoupling in urban water systems: An examination of Beijing’s imported water supply.Water International, 41(2): 251-270.Urban centres increasingly have difficulties meeting water needs within their hydrologic basins. To sustain urban water supply, cities and water source regions have increased telecouplings (socio-economic and environmental interactions over distances). To analyse these complex interactions, we apply the new telecoupling framework to the water-stressed megacity of Beijing’s imported water supply. We found that Beijing’s remote water sources have lower risk than local supply, but connections impact the sending systems. The telecoupling framework provides a standard, systematic and flexible tool for evaluating the sustainability of urban water supply. It also identifies a number of research gaps for future quantification efforts.

DOI

[8]
Foley J A, Defries R, Asner G P et al., 2005. Global consequences of land use.Science, 309(5734): 570-574.

DOI

[9]
Furtado A M M, Ponte F C, 2013. Mapeamento de Unidades de Relevo do Estado do Pará.Revista GeoAmazônica, 2(2): 56-67.

[10]
Garrett R D, Rausch L L, 2016. Green for gold: Social and ecological tradeoffs influencing the sustainability of the Brazilian soy industry.The Journal of Peasant Studies, 43(2): 461-493.In this study we assess the sustainability of the Brazilian soy industry over the past 40 years in comparison to alternative land uses. We conclude that Brazilian soy production performs as well as or better than sugarcane or cattle production in a number of areas, including macroeconomic contributions, local economic development and land use efficiency, though it involves similar tradeoffs between growth and equity, and food production and conservation. While there is no evidence that soy has reduced food security in Brazil, tax redistributions and value-added activities from soy remain limited, particularly in comparison to sugarcane production. Emerging environmental governance measures have helped to reduce the land cover impacts from soy; however, little effort has been taken to minimize the impacts of intensification.

DOI

[11]
Gibbs H K, Munger J, L’Roe J et al., 2016. Did Ranchers and slaughterhouses respond to zero-deforestation agreements in the Brazilian Amazon?Conservation Letters, 9(1): 32-42.Abstract New supply chain interventions offer promise to reduce deforestation from expansion of commercial agriculture, as more multinational companies agree to stop sourcing from farms with recent forest clearing. We analyzed the zero???deforestation cattle agreements signed by major meatpacking companies in the Brazilian Amazon state of Par?? using property???level data on beef supply chains. Our panel analysis of daily purchases by slaughterhouses before and after the agreements demonstrates that they now avoid purchasing from properties with deforestation, which was not the case prior to the agreements. Supplying ranchers registered their properties in a public environmental registry nearly 2 years before surrounding non???supplying properties, and 85% of surveyed ranchers indicated that the agreements were the driving force. In addition, supplying properties had significantly reduced deforestation rates following the agreements. Our results demonstrate important changes in the beef supply chain, but the agreements??? narrow scope and implementation diminish outcomes for forest conservation.

DOI

[12]
Gibbs H K, Rausch L, Munger J et al., 2015. Brazil’s Soy Moratorium.Science, 347(6220): 377-378.

DOI

[13]
Hulina J, Bocetti C, Campa III H et al., 2017. Telecoupling framework for research on migratory species in the Anthropocene.Elementa Science of the Anthroponcene, 5(5): 23.

[14]
Klink C A, Machado R B, 2005. Conservation of the Brazilian Cerrado.Conservation Biology, 19(3): 707-713.Abstract: The Cerrado is one of the world's biodiversity hotspots. In the last 35 years, more than 50% of its approximately 2 million km 2 has been transformed into pasture and agricultural lands planted in cash crops. The Cerrado has the richest flora among the world's savannas (>7000 species) and high levels of endemism. Species richness of birds, fishes, reptiles, amphibians, and insects is equally high, whereas mammal diversity is relatively low. Deforestation rates have been higher in the Cerrado than in the Amazon rainforest, and conservation efforts have been modest: only 2.2% of its area is under legal protection. Numerous animal and plant species are threatened with extinction, and an estimated 20% of threatened and endemic species do not occur in protected areas. Soil erosion, the degradation of the diverse Cerrado vegetation formations, and the spread of exotic grasses are widespread and major threats. The use of fire for clearing land and to encourage new growth for pasture has also caused damage, even though the Cerrado is a fire-adapted ecosystem. Ecosystem experiments and modeling show that change in land cover is altering the hydrology and affecting carbon stocks and fluxes. Cerrado agriculture is lucrative, and agricultural expansion is expected to continue, requiring improvements in and extension of the transportation infrastructure, which will affect not only the Cerrado but also the Amazon forest. Large-scale landscape modification and threats to numerous species have led to renewed interest from various sectors in promoting the conservation of the Cerrado, particularly through strengthening and enlarging the system of protected areas and improving farming practices and thus the livelihoods of local communities.

DOI

[15]
Lambin E F, Gibbs H K, Ferreira L et al., 2013. Estimating the world’s potentially available cropland using a bottom-up approach.Global Environmental Change, 23(5): 892-901.Previous estimates of the land area available for future cropland expansion relied on global-scale climate, soil and terrain data. They did not include a range of constraints and tradeoffs associated with land conversion. As a result, estimates of the global land reserve have been high. Here we adjust these estimates for the aforementioned constraints and tradeoffs. We define potentially available cropland as the moderately to highly productive land that could be used in the coming years for rainfed farming, with low to moderate capital investments, and that is not under intact mature forests, legally protected, or already intensively managed. This productive land is underutilized rather than unused as it has ecological or social functions. We also define potentially available cropland that accounts for trade-offs between gains in agricultural production and losses in ecosystem and social services from intensified agriculture, to include only the potentially available cropland that would entail low ecological and social costs with conversion to cropland. In contrast to previous studies, we adopt a ottom-up approach by analyzing detailed, fine scale observations with expert knowledge for six countries or regions that are often assumed to include most of potentially available cropland. We conclude first that there is substantially less potential additional cropland than is generally assumed once constraints and trade offs are taken into account, and secondly that converting land is always associated with significant social and ecological costs. Future expansion of agricultural production will encounter a complex landscape of competing demands and tradeoffs.

DOI

[16]
Lambin E F, Meyfroidt P, 2011. Global land use change, economic globalization, and the looming land scarcity.Proceedings of the National Academy of Sciences, 108(9): 3465-3472.

DOI

[17]
Lapola D M, Martinelli L A, Peres C A et al., 2014. Pervasive transition of the Brazilian land-use system.Nature Climate Change, 4(1): 27-35.Abstract Agriculture, deforestation, greenhouse gas emissions and local/regional climate change have been closely intertwined in Brazil. Recent studies show that this relationship has been changing since the mid 2000s, with the burgeoning intensification and commoditization of Brazilian agriculture. On one hand, this accrues considerable environmental dividends including a pronounced reduction in deforestation (which is becoming decoupled from agricultural production), resulting in a decrease of ~40% in nationwide greenhouse gas emissions since 2005, and a potential cooling of the climate at the local scale. On the other hand, these changes in the land-use system further reinforce the long-established inequality in land ownership, contributing to rural rban migration that ultimately fuels haphazard expansion of urban areas. We argue that strong enforcement of sector-oriented policies and solving long-standing land tenure problems, rather than simply waiting for market self-regulation, are key steps to buffer the detrimental effects of agricultural intensification at the forefront of a sustainable pathway for land use in Brazil.

DOI

[18]
Lapola D M, Schaldach R, Alcamo J et al., 2010. Indirect land-use changes can overcome carbon savings from biofuels in Brazil.Proceedings of the National Academy of Sciences, 107(8): 3388-3393.

DOI

[19]
Liu J, Dietz T, Carpenter S R et al., 2007. Complexity of coupled human and natural systems.Science, 317(5844): 1513-1516.Integrated studies of coupled human and natural systems reveal new and complex patterns and processes not evident when studied by social or natural scientists separately. Synthesis of six case studies from around the world shows that couplings between human and natural systems vary across space, time, and organizational units. They also exhibit nonlinear dynamics with thresholds, reciprocal feedback loops, time lags, resilience, heterogeneity, and surprises. Furthermore, past couplings have legacy effects on present conditions and future possibilities.

DOI PMID

[20]
Liu J, Dou Y, Batistella M et al., 2018. Spillover systems in a telecoupled Anthropocene: Typology, methods, and governance for global sustainability.Current Opinion in Environmental Sustainability, 33: 58-69.

DOI

[21]
Liu J, Hull V, Batistella M et al., 2013. Framing sustainability in a telecoupled world.Ecology and Society, 18(2): 26.

[22]
Liu J, Hull V, Luo J et al., 2015a. Multiple telecouplings and their complex interrelationships.Ecology and Society, 20(3): 44.

[23]
Liu J, Mooney H, Hull V et al., 2015b. Systems integration for global sustainability.Science, 347(6225): 963-973.Abstract Global sustainability challenges, from maintaining biodiversity to providing clean air and water, are closely interconnected yet often separately studied and managed. Systems integration—holistic approaches to integrating various components of coupled human and natural systems—is critical to understand socioeconomic and environmental interconnections and to create sustainability solutions. Recent advances include the development and quantification of integrated frameworks that incorporate ecosystem services, environmental footprints, planetary boundaries, human-nature nexuses, and telecoupling. Although systems integration has led to fundamental discoveries and practical applications, further efforts are needed to incorporate more human and natural components simultaneously, quantify spillover systems and feedbacks, integrate multiple spatial and temporal scales, develop new tools, and translate findings into policy and practice. Such efforts can help address important knowledge gaps, link seemingly unconnected challenges, and inform policy and management decisions. Copyright 08 2015, American Association for the Advancement of Science.

DOI PMID

[24]
Liu J, Yang W, Li S, 2016. Framing ecosystem services in the telecoupled Anthropocene.Frontiers in Ecology and the Environment, 14(1): 27-36.Abstract Around the globe, previously isolated localities are rapidly forming connections over increasing spatial extents, through the flow of ecosystem services (ES). With the intensification of human demands, systematic research on ES over distances is urgently needed. We apply a new integrated framework of telecoupling (ie socioeconomic and environmental interactions between different places) to analyze the causes, effects, agents, and dynamics of ES flows. We focus on the world's largest water-transfer project – China's South–North Water Transfer Project – as a basis for discussion about the broad utility of the telecoupling framework and important implications for effective governance of ES across telecoupled human and natural systems. Integration through the use of the telecoupling framework holds promise for creating sustainable solutions and avoiding unintended negative effects across multiple systems in an interconnected world. This paper is the first in an occasional series: Ecosystem Services in China.

DOI

[25]
Macedo M N, DeFries R S, Morton D C et al., 2012. Decoupling of deforestation and soy production in the southern Amazon during the late 2000s.Proceedings of the National Academy of Sciences, 109(4): 1341-1346.From 2006 to 2010, deforestation in the Amazon frontier state of Mato Grosso decreased to 30% of its historical average (1996 2005) whereas agricultural production reached an all-time high. This study combines satellite data with government deforestation and production statistics to assess land-use transitions and potential market and policy drivers associated with these trends. In the forested region of the state, increased soy production from 2001 to 2005 was entirely due to cropland expansion into previously cleared pasture areas (74%) or forests (26%). From 2006 to 2010, 78% of production increases were due to expansion (22% to yield increases), with 91% on previously cleared land. Cropland expansion fell from 10 to 2% of deforestation between the two periods, with pasture expansion accounting for most remaining deforestation. Declining deforestation coincided with a collapse of commodity markets and implementation of policy measures to reduce deforestation. Soybean profitability has since increased to pre-2006 levels whereas deforestation continued to decline, suggesting that antideforestation measures may have influenced the agricultural sector. We found little evidence of direct leakage of soy expansion into cerrado in Mato Grosso during the late 2000s, although indirect land-use changes and leakage to more distant regions are possible. This study provides evidence that reduced deforestation and increased agricultural production can occur simultaneously in tropical forest frontiers, provided that land is available and policies promote the efficient use of already-cleared lands (intensification) while restricting deforestation. It remains uncertain whether government-and industry-led policies can contain deforestation if future market conditions favor another boom in agricultural expansion.

DOI PMID

[26]
Meyfroidt P, Lambin E F, 2009. Forest transition in Vietnam and displacement of deforestation abroad.Proceedings of the National Academy of Sciences, 106(38): 16139-16144.In some countries across the globe, tropical forest cover is increasing. The national-scale reforestation of Vietnam since 1992 is assumed to contribute to this recovery. It is achieved, however, by the displacement of forest extraction to other countries on the order of 49 (34-70) M m , or 39% of the regrowth of Vietnam's forests from 1987 to 2006. Approximately half of wood imports to Vietnam during this period were illegal. Leakage due to policies restricting forest exploitation and displacement due to growing domestic consumption and exports contributed respectively to an estimated 58% and 42% of total displacement. Exports of wood products from Vietnam also grew rapidly, amounting to 84% of the displacement which is a remarkable feature of the forest transition in Vietnam. Attribution of the displacement and corresponding forest extraction to Vietnam, the source countries or the final consumers is thus debatable. Sixty-one percent of the regrowth in Vietnam was, thus, not associated with displacement abroad. Policies allocating credits to countries for reducing deforestation and forest degradation should monitor illegal timber trade and take into account the policy-induced leakage of wood extraction to other countries.

DOI PMID

[27]
Morton D C, DeFries R S, Shimabukuro Y E et al., 2006. Cropland expansion changes deforestation dynamics in the southern Brazilian Amazon.Proceedings of the National Academy of Sciences of the United States of America, 103(39): 14637-14641.

DOI

[28]
Nepstad D, Mcgrath D, Stickler C et al., 2014. Slowing Amazon deforestation through public policy and interventions in beef and soy supply chains.Science, 344(6188): 1118-1123.The recent 70% decline in deforestation in the Brazilian Amazon suggests that it is possible to manage the advance of a vast agricultural frontier. Enforcement of laws, interventions in soy and beef supply chains, restrictions on access to credit, and expansion of protected areas appear to have contributed to this decline, as did a decline in the demand for new deforestation. The supply chain interventions that fed into this deceleration are precariously dependent on corporate risk management, and public policies have relied excessively on punitive measures. Systems for delivering positive incentives for farmers to forgo deforestation have been designed but not fully implemented. Territorial approaches to deforestation have been effective and could consolidate progress in slowing deforestation while providing a framework for addressing other important dimensions of sustainable development.

DOI PMID

[29]
Santopuoli G, Marchetti M, Giongo M, 2016. Supporting policy decision makers in the establishment of forest plantations, using SWOT analysis and AHPs analysis: A case study in Tocantins (Brazil).Land Use Policy, 54: 549-558.Following the increased extension of forest plantations in Brazil, new challenges for landowners, forest technicians and policy and decision makers have emerged in order to ensure the provision of the ecosystem goods and services. Nevertheless, fire represents one of the most important limited factors of forest plantation growth and production in Brazil, especially in theCerradobiome. This work focuses on the evaluation of the priority of the variables that landowners take into account during forest plantation establishment. The combined use of SWOT analysis and Analytic Hierarchical Process facilitates the priority ranking, allowing the assessment of the variables regarding fire-related aspects. The study highlights that landowners recognize fire as a hindering factor for forest plantation production adopting some preventative actions, even though these are poorly organized and rather made by default. Improving the awareness of landowners, promoting the local market of forest productions, and reducing costs for plantation establishment represent the main challenges highlighted in this study. The combined methodology applied represents a helpful tool for decision makers, offering them the possibility to assess the current gaps in plantation establishment with a particular focus on fire-related aspects.

DOI

[30]
Santos C A C, Oliveira V G, 2017. Trends in extreme climate indices for Pará State, Brazil.Revista Brasileira de Meteorologia, 32(1): 13-24.

DOI

[31]
Silva R F B D, Batistella M, Moran E F, 2016. Drivers of land change: Human-environment interactions and the Atlantic forest transition in the Paraíba Valley, Brazil.Land Use Policy, 58: 133-144.Human societies constantly interact with the environment through mutual feedbacks and adaptations. The aim of this research was to analyze human and environmental dimensions so as to understand how the dynamic processes of land use and land cover change are contributing to the increase of forest cover observed between 1985 and 2011 in the Paraíba Valley, Brazil. The forestry sector, based on eucalyptus plantations, is given particular attention due to its role in these change processes. Multi-layer perception neural network (MPNN) models were adopted to evaluate the influence of independent variables in the process of the forest transition. Based on the model's results, we conclude that the process is conditioned by a set of biophysical and socioeconomic variables that operate during different historical periods and in different landscape settings. The proximity of Atlantic forest remnants was influential in the forest transition for the three periods analyzed: 1985–1995, 1995–2005, and 2005–2011. In the first period of change (1985–1995), topography was most influential. Between the periods of 1995–2005 and 2005–2011, the proximity to eucalyptus plantations was an important factor, indicating a high probability of native forest recovery occurring in the vicinity of these monocultural areas. The forest transition tends to occur in areas less suitable for agriculture at the outset, but as these areas are replaced by forest cover, socioeconomic drivers such as farm credit and economic development play important roles in forest recovery.

DOI

[32]
Soares-filho B, Rajão R, Macedo M et al., 2014. Cracking Brazil’s forest code.Science, 344(6182): 363-364.

DOI

[33]
Sun J, Mooney H, Wu W B et al., 2018. Importing food damages domestic environment: Evidence from global soybean trade.PNAS, 115(21): 5415-5419.Abstract Protecting the environment and enhancing food security are among the world's Sustainable Development Goals and greatest challenges. International food trade is an important mechanism to enhance food security worldwide. Nonetheless, it is widely concluded that in international food trade importing countries gain environmental benefits, while exporting countries suffer environmental problems by using land and other resources to produce food for exports. Our study shows that international food trade can also lead to environmental pollution in importing countries. At the global level, our metaanalysis indicates that there was increased nitrogen (N) pollution after much farmland for domestically cultivated N-fixing soybeans in importing countries was converted to grow high N-demanding crops (wheat, corn, rice, and vegetables). The findings were further verified by an intensive study at the regional level in China, the largest soybean-importing country, where the conversion of soybean lands to corn fields and rice paddies has also led to N pollution. Our study provides a sharp contrast to the conventional wisdom that only exports contribute substantially to environmental woes. Our results suggest the need to evaluate environmental consequences of international trade of all other major goods and products in all importing countries, which have significant implications for fundamental rethinking in global policy-making and debates on environmental responsibilities among consumers, producers, and traders across the world.

DOI PMID

[34]
Sun J, Tong Y, Liu J, 2017. Telecoupled land-use changes in distant countries.Journal of Integrative Agriculture, 16(2): 368-376.

DOI

[35]
Wang F, Liu J, 2016. Conservation planning beyond giant pandas: The need for an innovative telecoupling framework.Science China Life Sciences, 60(5): 1-4.正Meeting human needs while sustaining ecosystems and the benefits they provide is a global challenge.A major barrier to achieve sustainable development goals is the lack of sufficient knowledge on the complex relationships between humans and nature(Loucks et al.,2001;Liu et al.,2007).Different parts of the world have never been as closely connected through all means of flows(e.g.information,labor,

DOI PMID

[36]
Wu W, Tang H, Yang P et al., 2011. Scenario-based assessment of future food security.Journal of Geographical Sciences, 21(1): 3-17.

DOI

[37]
Yang W, Hyndman D W, Winkler J A et al., 2016. Urban water sustainability: Framework and application.Ecology and Society, 21(4): 14.

[38]
Yao Z, Zhang L, Tang S et al., 2017. The basic characteristics and spatial patterns of global cultivated land change since the 1980s.Journal of Geographical Sciences, 27(7): 771-785.In this paper,we analyzed the spatial patterns of cultivated land change between 1982 and 2011 using global vector-based land use/land cover data.(1)Our analysis showed that the total global cultivated land area increased by 528.768× 10⁴ km2 with a rate of 7.920× 10⁴ km2/a,although this increasing trend was not significant.The global cultivated land increased fastest in the 1980s.Since the 1980s,the cultivated land area in North America,South America and Oceania increased by 170.854×10⁴ km2,107.890×104 km2,and 186.492×10⁴ km2,respectively.In contrast,that in Asia,Europe and Africa decreased by 23.769×10⁴ km2,4.035×104 km2 and 86.76x10⁴ km2,respectively.Furthermore,the cultivated land area in North America,South America and Oceania exhibited significant increasing trends of 7.236× 10⁴ km2/a,2.780×104 km2/a and 3.758×10⁴ km2/a,respectively.On the other hand,that of Asia,Europe and Africa exhibited decreasing trend rates of-5.641x10⁴ km2/a,-0.831×104 km2/a and-0.595×10⁴ km2/a,respectively.Moreover,the decreasing trend in Asia was significant.(2) Since the 1980s,the increase in global cultivated lands was mainly due to converted grasslands and woodlands,which accounted for 53.536% and 26.148% of the total increase,respectively.The increase was found in southern and central Africa,eastern and northern Australia,southeastern South America,central US and Alaska,central Canada,western Russia,northern Finland and northern Mongolia.Among them,Botswana in southern Africa experienced an 80%-90% increase,making it the country with the highest increase worldwide.(3) Since the 1980s,the total area of cultivated lands converted to other types of land was 1071.946×104 km2.The reduction was mainly converted to grasslands and woodlands,which accounted for 57.482% and 36.000%,respectively.The reduction occurred mainly in southern Sudan in central Africa,southern and central US,southern Russia,and southern European countries including Bulgaria,Romania,Serbia and Hungary.The greatest reduction occurred in southern Africa with a 60% reduction.(4) The cultivated lands in all the continents analyzed exhibited a trend of expansion to high latitudes.Additionally,most countries displayed an expansion of newly increased cultivated lands and the reduction of the original cultivated lands.

DOI

[39]
Zhang J, Zhao N, Liu X et al., 2016. Global virtual-land flow and saving through international cereal trade.Journal of Geographical Sciences, 26(5): 619-639.With intense urbanization and sustained population growth, securing food production with limited land sources has increasingly become a pressing issue. Based on an analysis of international cereal (i.e., barley, buckwheat, maize, oats, rice, rye, sorghum, soybean, and wheat) trade and differences in yields of the cereal between export and import countries over the period of 2007 to 2011, we explore the great potential of land saving through the international cereal trade. By ‘land saving’, we refer to the reduced global total of lands required to produce a necessary amount of cereal when cereal is exported from a country with relatively large yield of the cereal to a country with relatively small yield of the cereal. Our scenario analysis suggests that international cereal trade would help mitigate the shortage of domestic arable land for many island countries (e.g., Japan) and countries in the arid Middle East and North Africa (e.g., Syria and Morocco). Furthermore, international cereal trade has the potential to generate ‘land saving’ of 50,092,284 ha of land per year, which is roughly the size of Spain. Drawing upon the definition of a similar concept — virtual water (Hoekstra and Hung 2002), we define virtual land as the area of land resources used for the production of goods. Through introducing the concept of virtual land, we believe land resources that are traditionally considered as stationary resources can flow with anthropogenic socioeconomic activities. The largest virtual-land flows (> 3,000,000 ha/year) exist between the United States (US) to China, Brazil to China, the US to Japan, the US to Mexico, and Argentina to China. However, not all virtual-land flows necessarily result in land saving. Thus, more endeavors are needed to plan the virtual-land flows for a larger land saving at the global scale.

DOI

Outlines

/