Special Issue: Land system dynamics: Pattern and process

Changes in production potentials of rapeseed in the Yangtze River Basin of China under climate change:A multi-model ensemble approach

  • TIAN Zhan 1, 2, 3 ,
  • JI Yinghao 1, 2 ,
  • SUN Laixiang 4, 5 ,
  • XU Xinliang , 7, * ,
  • FAN Dongli , 1, * ,
  • ZHONG Honglin 4 ,
  • LIANG Zhuoran 6 ,
  • FICSHER Gunther 5
Expand
  • 1. Shanghai Institute of Technology, Shanghai 200030, China
  • 2. Shanghai Climate Center, Shanghai Meteorological Bureau, Shanghai 200030, China
  • 3. School of Environmental Science and Engineering, Southern University of Science and Technology, Shenzhen 518055, Guangdong, China
  • 4. Department of Geographical Sciences, University of Maryland, College Park, MD 20742, USA
  • 5. International Institute for Applied Systems Analysis (IIASA), A-2361 Laxenburg, Austria
  • 6. Hangzhou Meteorological Bureau, Hangzhou 310051, China
  • 7. Institute of Geographic Sciences and Natural Resources Research, CAS, Beijing 100039, China
*Corresponding author: Fan Dongli, Associate Professor, E-mail: ; Xu Xinliang, Professor, E-mail:

Author: TIan Zhan, E-mail: tianz@lreis.ac.cn

Received date: 2017-03-06

  Accepted date: 2017-09-20

  Online published: 2018-11-20

Supported by

National Natural Science Foundation of China, No.41671113, No.51761135024, No.41601049, No.41475040

China’s National Science & Technology Pillar Program, No.2016YFC0502702

Copyright

Journal of Geographical Sciences, All Rights Reserved

Abstract

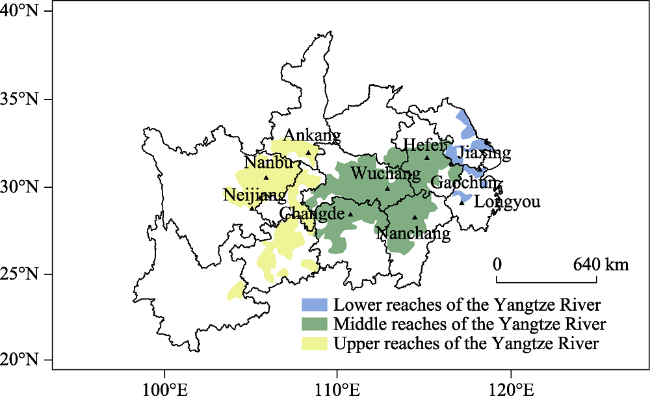
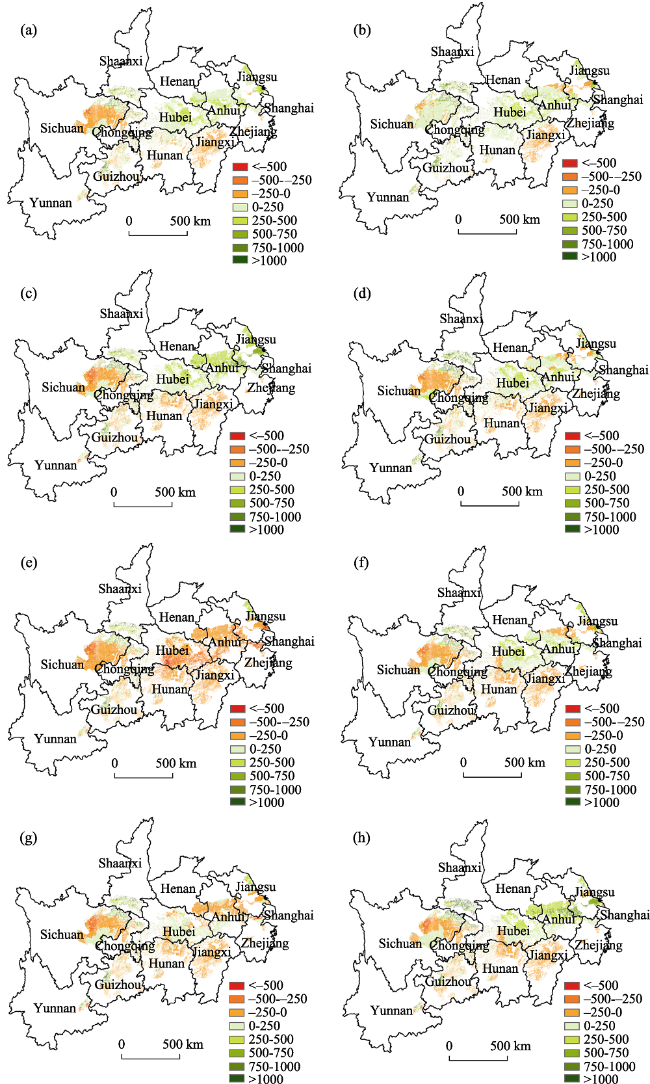
Rapeseed is one of the major oil crops in China and it is very sensitive to climate change. The Yangtze River Basin is the main rapeseed production area in China. Therefore, a better understanding of the impact of climate change on rapeseed production in the basin is of both scientific and practical importance to Chinese oil industry and food security. In this study, based on climate data from 5 General Circulation Models (GCMs) with 4 representative concentration pathways (RCPs) in 2011-2040 (2020s), 2041-2070 (2050s) and 2071-2100 (2080s), we assessed the changes in rapeseed production potential between the baseline climatology of 1981-2010 and the future climatology of the 2020s, 2050s, and 2080s, respectively. The key modelling tool - the AEZ model - was updated and validated based on the observation records of 10 representative sites in the basin. Our simulations revealed that: (1) the uncertainty of the impact of climate change on rapeseed production increases with time; (2) in the middle of this century (2050s), total rapeseed production would increase significantly; (3) the average production potential increase in the 2050s for the upper, middle and lower reaches of the Yangtze River Basin is 0.939, 1.639 and 0.339 million tons respectively; (4) areas showing most significant increases in production include southern Shaanxi, central and eastern Hubei, northern Hunan, central Anhui and eastern Jiangsu.

Cite this article

TIAN Zhan , JI Yinghao , SUN Laixiang , XU Xinliang , FAN Dongli , ZHONG Honglin , LIANG Zhuoran , FICSHER Gunther . Changes in production potentials of rapeseed in the Yangtze River Basin of China under climate change:A multi-model ensemble approach[J]. Journal of Geographical Sciences, 2018 , 28(11) : 1700 -1714 . DOI: 10.1007/s11442-018-1538-1

1 Introduction

Rapeseed is the third most important oilseed produced globally, and production has expanded remarkably in most of the major producing nations in recent years (FAOSTAT, 2015). Growing population, expanding affluence, rapid urbanization, and changing dietary preferences have driven the increase in global demand for edible oil products (Foley et al. 2005; Kastner et al. 2012). It has been estimated that global production of vegetable oils must nearly double by 2050 to meet FAO projections for food, fuel and industrial demands (FAO, 2003). China is the largest producer and consumer of rapeseed oil in the world, with more than 50% of the edible oil (being rapeseed oil) consumed in the country as a result of the dietary habit of the Chinese. The country is expected to import more than 15 million tons of edible oil to meet domestic consumer demand by 2030 (Tian et al., 2014a). This heavy dependence of edible oil on imports has attracted great concerns about the domestic supply capability and the associated food security risk for China. Rapeseed is mainly distributed in the Yangtze River Basin, which is the world’s largest rapeseed production area and accounts for more than 80% of national total production in China. Therefore, an in-depth study on the impact of future climate change on rapeseed production in the Yangtze River Basin is of great significance for Chinese edible oil industry and food security.
Supply capability concerns are further amplified by climate change, because rapeseed production is very sensitive to climate conditions. To address the concerns on rapeseed production capability under future climate change, this paper employs the well-known Agro-Ecological Zone (AEZ) model to simulate the impact of future climate change on rapeseed production potential in the Yangtze River Basin in China. The simulations are carried out for the climate change predictions of 5 General Circulation Models (GCMs) with 4 representative concentration pathways (RCPs) in 2011-2040 (2020s), 2041-2070 (2050s) and 2071-2100 (2080s). The ensemble outputs of the AEZ simulations give a probabilistic assessment of the changes in production potentials of rapeseed in the Yangtze River Basin under climate change.
Crop simulation models are useful tools in climate impact studies as they can integrate the soil-plant-atmosphere continuum and trace how multiple climate factors interact with crop growth and yield processed (Challinor et al., 2014). Many crop models have been developed and applied in climate impact assessment, production estimation, cultivation and management for rapeseed, including APSIM (Agricultural Production Systems Simulator), CSM-CROPGRO-Canola, EPIC (Environmental Policy Integrated Climate), and the AEZ model. The APSIM model (Holzworth et al., 2014) simulates crop growth processes and accounts for farming system management, soil processes, and climate in a dynamic way across sites and seasons. Farre et al. (2002) concluded that the APSIM-Canola model, together with long-term weather data, can be reliably used to quantify yield expectation for different cultivars, sowing dates, and locations in the grain belt of Western Australia. The APSIM-Canola model was applied to simulate the impacts of future climatic changes on the growth and yield of rapeseed in China under the regional climate model PRECIS, showing a decrease in rapeseed yields in each considered period (Zhang et al., 2011). EPIC is a cropping system model that has been widely used for estimating soil productivity in the world since it was published in 1985. Based on the EPIC model and the RegCM3 model, the impact of climate change on the major grain and oil crops in the Loess Plateau of China was analyzed and rapeseed yield in the semi-humid region of the Loess Plateau found to increase between 2001-2050 compared to the 1961-2000 baseline (Wang et al., 2011). The CSM-CROPGRO model (Boote et al., 1998) was adapted in the DSSAT (Decision Support System for Agro-technology Transfer) to simulate spring canola (Saseendran et al., 2010). The DSSAT model (Deligios et al., 2013) was used to simulate the development, growth and distribution of rapeseed in the Mediterranean environment, showing high accuracy.
However, most of the previous studies and simulation models have focused on site-level analysis and not paid sufficient attention to cultivars adaptation at a large scale. The Yangtze River Basin is vast and significant differences exist in observed climatic changes in the upper, middle and lower reaches (Tian et al., 2013). In addition, because of the spatial variability of climate and soil, there are often mismatches between the crop varieties (with their respective growth calendar) in the model and the actual varieties in the area. Existing simulations of rapeseed production potentials have shown a lack of attention to cultivars adaptation under the historical and forthcoming climate change. The AEZ model, which is an agro-ecological productivity model, has been extensively used in the impact assessment literature for agriculture. It can speedily assess the impact of climate, soil, and other factors on production potentials across grid cells of a large area. The AEZ model was used to analyze China’s rapeseed production potential in different periods (Cai, 2007; Cai et al., 2009). However, these estimations were based on the default cultivar parameters of the 2002 version of the AEZ, which represented prevailing rapeseed cultivars in the 1970s and included only one variety for winter and spring oilseed respectively. In this research, we enrich and update the rapeseed cultivars in the AEZ model based on the observation records of 10 representative sites in the Yangtze River Basin.
It should be noted that the estimates of climate change impacts on the growth and development of crops are characterized by large uncertainties, mainly because of the choice of carbon emission scenarios, climate models, and crop models (Trnka et al., 2014). By considering the uncertainties of climate change forecasting, the multi-model ensemble simulation method can be used to describe a range of possibility for future climate projection (Yang et al., 2017). Many studies have used this approach to construct a set of probability estimation, so as to express and assess the impact of climate change on agriculture (Hansen et al., 2006; Tao et al., 2009; Tebaldi et al., 2008). Tang et al. (2015) used the projections derived from four global gridded crop models (GGCropMs) to assess the effects of future climate change on the yields of major crops (i.e., maize, rice, soybean and wheat) in China. Masutomi et al. (2009) used a combined set of 49 GCMs in three emission scenarios to assess the impact of climate change on rice production. Yang et al. (2017) assessed the effects of heat stress on wheat yields in China using the ensemble method with climate projections based on 30 Atmosphere-Ocean General Circultaion Models (AOGCMs) under representative concentration pathway scenarios in the Coupled Model Inter-Comparison Project Phase 5 (CMIP5). However, most of Multi-Model climate prediction methods are applied to simulate the impact of climate change on food crops. There are still few studies on the possible impact of climate change on future rapeseed production in China with this ensemble method.
We develop a probabilistic estimation of the effects of climate change on rapeseed in the Yangtze River Basin by making use of multi-model ensemble output. More specifically, we use 5 GCMs under 4 RCP scenarios in the CMIP5 of the IPCC Fifth Assessment Report, for a total of 20 climate change scenarios in the 2020s, 2050s, and 2080s. In this way, we provide scientifically robust information for supporting the future regional planning of oilseed production in China.

2 Materials and methods

2.1 Study area

The Yangzte River Basin is located between 24º-35º and 90º-122ºE. The Qinghai-Tibet Plateau section of the Yangtze River basin is characterized by a plateau mountain climate, while the rest of the basin has a subtropical monsoon climate. Due to the rich agricultural climate resources such as sunshine, temperature, water and soil, the Yangtze River Basin has played an important role in China’s grain production and has made important contributions to China’s national economic development and social stability.
Our research area corresponds to the rapeseed dominant planting zone in China (Xiao, 2009). It is one of the most important winter rapeseed planting regions in China and includes the provinces of Sichuan, Yunnan, Guizhou, Chongqing, Shaanxi, Hubei, Hunan, Henan, Jiangxi, Anhui, Jiangsu, Zhejiang and Shanghai. It covers more than 2.2 million square kilometers and can be divided into upper, middle and lower reaches according to the climate and land resources (Figure 1). The humidity and temperature are very suitable for winter rapeseed growth.
Figure 1 Distribution of rapeseed observation stations in China

2.2 Dataset

2.2.1 Observation stations
Ten agro-meteorological observation stations are selected out of 49 observation sites based on the following criteria: (1) representative sites in each section of the Yangtze River Basin; and (2) more than 15 years observations of rapeseed crop management information. General information on these stations is shown in Table 1.
Table 1 The location information of selected 10 stations
Station Province Latitude Longitude
Neijiang Sichuan 29°35′N 105°5′E
Nanbu Sichuan 31°21′N 106°3′E
Ankang Shaanxi 32°43′N 109°2′E
Changde Hunan 29°3′N 111°41′E
Wuchang Hubei 30°21′N 114°19′E
Nanchang Jiangxi 28°33′N 115°57′E
Hefei Anhui 31°52′N 117°14′E
Gaochun Jiangsu 31°19′N 118°53′E
Longyou Zhejiang 29°2′N 119°11′E
Jiaxing Zhejiang 30°47′N 120°44′E
The crop growth records at the 10 agro-meteorological observation stations in the Yangtze River Basin are from the Chinese Meteorological Administration (CMA) and cover the period 1981-2010. The records include detailed information on crop calendar, such as sowing date, emergence date, blossom date, and harvest date. They also include yield information, such as seed weight, the ratio between seed and stem, theoretical productivity and actual yield per unit area. These records can be used to update the cultivar parameters of the AEZ model.
2.2.2 Climate data
CMIP5 used a ‘representative concentration pathways (RCPs)’ radiation forcing scenario that contains four radiation forcing concentrations, RCP 2.6, RCP 4.5, RCP 6.0 and RCP 8.5, respectively (Moss et al., 2010). The RCP 2.6 scenario refers to radiation forcing reaching 2.6 W/m2 in 2100, while temperature is expected to rise between 1.6-3.6℃. RCP 4.5 is an intermediate stable path, under which the radiation forcing will stabilize at 4.5 W/m2, the equivalent of 650 ppm of CO2 concentration. Under RCP 8.5, radiation forcing will be greater than 8.5 W/m2 while CO2 concentration will exceed 1370 ppm (Taylor et al., 2012).
The climate scenario data included outputs from five global climate models (GFDL-ESM2M, HadGEM2-ES, IPSL-CM5A-LR, MIROC-ESM-CHEM and NorESM1-M) driven by the above four RCPs. Each global climate model has 7 climate variables, as included in the Inter-Sectoral Impact Model Inter-comparison Project (ISI-MIP) dataset: surface air temperatures, precipitation, surface radiation (short and long wave down welling), near surface wind speed, surface air pressure, near surface relative humidity and CO2 concentration (Warszawski et al., 2014).
2.2.3 Soil data
Harmonized World Soil Database (HWSD) is employed as the soil input data into the AEZ model. The HWSD was developed by the Land Use Change and Agriculture Program of the International Institute for Applied Systems Analysis (IIASA) and the Food and Agriculture Organization of the United Nations (FAO). The HWSD provides reliable and harmonized soil information at the grid cell level for the world, with a resolution of 1 km × 1 km for China (FAO/IIASA/ISRIC/ISSCAS/JRC, 2009). The China-AEZ Model evaluates crop- specific yield reduction due to limitations imposed by soil and terrain conditions.
2.2.4 Land use data
The cultivated land distribution data comes from the National Land Use Database of Resources and Environment Data Center of Chinese Academy of Sciences. The database is a multi-temporal land use dataset of 1:10000 scale covering the whole land area of China, which is supported by the National Science and Technology Support Program and the Knowledge Innovation Project of the Chinese Academy of Sciences. With the support of many major science and technology projects, the database has been established for a number of years (Liu et al., 2000; Liu et al., 2003; Liu et al., 2005). The dataset uses Landsat terrestrial satellite remote sensing image as the main data source, and is generated by artificial visual interpretation. The land use types include six primary types (i.e., cultivated land, forest land, grassland, water area, residential land and unused land) and 25 secondary types. Through field investigation and field verification, the comprehensive evaluation accuracy of the land use type has reached 94.3% (Liu et al., 2003; Liu et al., 2010; Liu et al., 2014). In this study, the spatial distribution data of cultivated land in the Yangtze River Basin were extracted from the land use datasets in 2015, overlaid with the rapeseed dominant planting zone in China (Xiao, 2009).

2.3 Model and methodology

2.3.1 The AEZ Model
The AEZ model was jointly developed by IIASA and FAO (Fischer et al., 2002). AEZ Ver. 3.0 (IIASA/FAO, 2012) employs simple and robust crop models and provides standardized crop-modeling and environmental matching procedure to identify crop-specific limitations of prevailing climate, soil and terrain resources under assumed levels of inputs and management conditions. The standardized crop-modeling and environmental matching procedure in the AEZ makes it well suited for crop productivity assessment at regional, national and global scales. In this research, crop cultivar parameters in Land Utilization Types (LUTs) from the AEZ are enriched and updated based on the observation data.
Because of the spatial variability of climate and soil, there are often big differences between the crop varieties modelled and the actual varieties planted in the study area. A lack of attention to such differences would severely undermine the performance of the model simulations (Luo et al., 2008). We detected such differences for the AEZ model as well. To enrich the crop cultivar parameters in land utilization types of the AEZ, it is necessary to improve the accumulated temperature thresholds and temperature demand distribution equation in the AEZ. In this study we carried out the modification of physiological and ecological parameters of rapeseed, including length of growth period, harvest index, accumulated temperature threshold and temperature distribution equation. Information on these factors was directly related to the growth and yield of rapeseed cultivars under different environments.
Temperature is a major determinant of crop growth and development. In the AEZ model, the effect of temperature on crops is characterized in each grid cell by thermal regimes, and the temperature demand distribution equation is an important one in thermal regimes. Based on our detailed observations and historical climate data, we reduced the proportion of the high temperature stage in the rapeseed growth stage in the temperature demand equation, and assigned specific temperature distribution requirements to newly added Chinese subtropical rapeseed varieties. In addition, we have also made improvements in the following aspects, as shown in Table 2. First of all, we added spring rapeseed varieties in Chinese subtropical rape-producing areas. Second, the length before (Cya) and after hibernation (Cyb) for winter rapeseed varieties was adjusted and the harvest index (HI) of spring rapeseed varieties increased. Finally, in view of the consistency with the correction of the temperature distribution, we reduced the minimum threshold (TS1n) and the maximum threshold (TS1x) of the optimum accumulated temperature during the growth period, so that the demand for high temperature during the growth period is reduced and the lower temperature conditions begun to adapt to rapeseed cultivation. The above enrichments lead to significant improvement in the ability and accuracy of the AEZ simulation at the site level, as we present in more details in Section 3.1.
Table 2 Comparison of cultivar parameters
Cultivar Original parameters New parameters
Cya+Cyb HI TS1n TS1x Cya+Cyb HI TS1n TS1x
Wrs 1 35+105 0.25 1500 2100 55+85 0.25 1100 1600
Wrs 2 40+120 0.25 1600 2400 65+90 0.25 1200 1800
Wrs 3 45+135 0.25 1700 2700 75+95 0.25 1300 1950
Wrs 4 45+150 0.25 1800 3000 85+100 0.25 1400 2100
Srs 1 0+150 0.20 1400 1850 0+105 0.23 1200 2150
Srs 2 0+120 0.21 1500 2100 0+120 0.23 1300 2300
Srs 3 0+135 0.22 1600 2350 0+135 0.23 1400 2400
Srs 4 0+150 0.23 1700 2600 0+150 0.23 1500 2500
New 1 0+150 0.25 1500 2500
New 2 0+165 0.25 1650 2600
New 3 0+180 0.24 1800 2700
New 4 0+195 0.24 2000 2800
New 5 0+210 0.23 2150 2900
New 6 0+225 0.23 2300 3000

Wrs: Winter rapeseed; Srs: Spring rapeseed; New: newly added Chinese subtropical rapeseed varieties; Cya: the length before hibernation; Cyb: the length after hibernation; HI: harvest index; TS1n: the minimum threshold of the optimum accumulated temperature during the growth period; TS1x: the maximum threshold of the optimum accumulated temperature during the growth period.

2.3.2 Procedure
The physiological and ecological parameters of rapeseed including length of growth period, harvest index, accumulated temperature threshold and temperature distribution equation are calibrated and validated using the observations. Future climate impact on rapeseed production under 20 climate change projections are simulated in the 10 representative sites. Climate change in the Yangtze River Basin and its impact on rapeseed production in the 2050s is obtained with 2 global climate models under 4 RCP scenarios and used to provide scientific basis for rapeseed planting adaptation policy in the Yangtze River Basin. Figure 2 summarizes the procedure of our work.
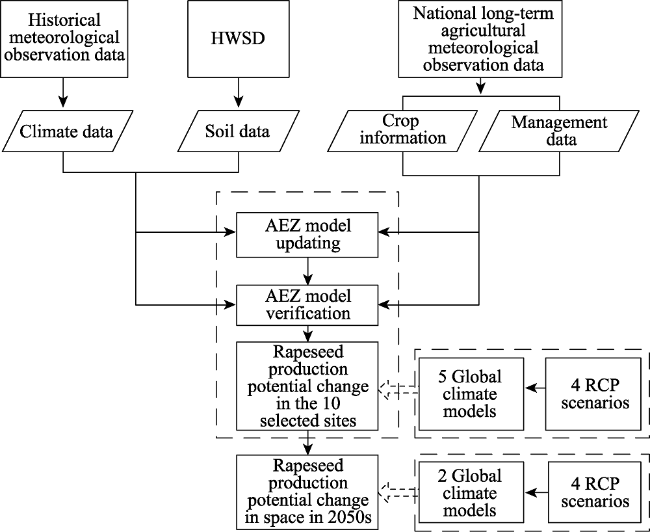
Figure 2 Technological roadmap

3 Results

3.1 Model validation

We calibrated and validated the new AEZ rapeseed cultivar parameters under observed historical climate conditions. In order to validate the simulation capability of the AEZ model, four sites with long time series were extracted from the simulation results. By comparing the variation trend of simulated yield and observed yield with time, the simulation ability of the updated AEZ model is further evaluated. As Figure 3 shows, Changde, Wuchang, Hefei and Gaochun were selected as the verification sites in our study. The overall trend for the AEZ simulated production potential and the actual yield in 1981-2010 is basically the same, showing a significant correlation, which means that the improved AEZ model performs very well in these stations.
Figure 3 Comparison of simulated attainable yields with observed yields

3.2 Changes in the rapeseed productive potentials at the station level under the
future climate scenarios

Figure 4 shows the ensemble yield changes relative to the baseline under the rain-fed condition. In the early 21st century (2020s), Neijiang and Ankang show increasing production possibilities relative to the baseline, while Nanbu, Changde, Nanchang and Longyou have a significance probability of yield reduction. In the mid-21st century (2050s), the production of 8 stations is expected to increase relative to the 2020s, especially at the Hefei station, where the median value of rapeseed production will exceed the baseline. By the end of the 21st century (2080s), 6 of the 10 stations have a big possibility in production increasing relative to baseline. It also shows that the length of the histogram increases with time, which means that the range of fluctuation in rapeseed production changes is increasing, implying an increase in the uncertainty associated with the impact of climate change on rapeseed.
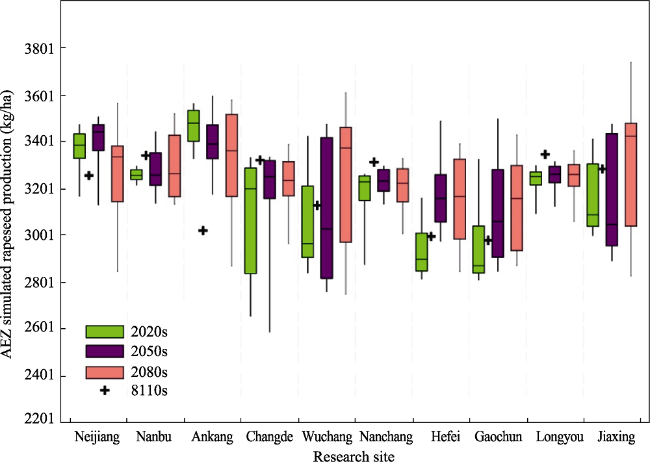
Figure 4 The ensemble yields of rain-fed winter rapeseed in the 2020s (green), 2050s (purple), and 2080s (red). The plus represents the 30-year average rain-fed rapeseed yield from 1981 to 2010 simulated with the observation data as the baseline. The horizontal line denotes the ensemble median.
Based on the rapeseed production simulated by the AEZ model with 5 GCMs and 4 RCPs under 3 future periods at the ten stations, we conduct a t-test analysis of potential impact of future climate change on rapeseed production. The results are reported in Table 3. T-test uses T-distribution theory to infer the occurrence probability of differences, to determine whether the difference between the two mean value is statistically significant or not. Based on Figure 4 and Table 3, we find that t-test results of Changde, Nanchang and Longyou are significant at the 1% level for all three periods, indicating that these three sites are significantly affected by future climate change and have a high likelihood of yield reduction. The significant level at Neijiang, Nanbu, Ankang and Jiaxing is less than 5% in the 2020s and 2050s, while not significant under the climate condition of the 2080s, the latter of which indicated statistically insignificant difference between the 2080s and baseline. Neijiang and Ankang show a yield increase in the 2020s and 2050s, whereas Nanbu and Jiaxing may experience yield decrease in these two periods. Compared to the baseline, there is no significant differences for the rapeseed yield in Hefei and Gaochun during the 2020s, while it is more likely to increase in the 2050s and 2080s. The t-test results at Wuchang station show a significance at 10% level for the 2080s only, indicating a moderately significant chance for this station to have yield increase in that period.
Table 3 T-test analysis of rapeseed yield variation in the Yangtze River Basin under future climatic conditions
Sites Baseline (kg/ha) Scenarios Sig Significance
2020s 5.37E-04 ***
Neijiang 3252 2050s 1.41E-06 ***
2080s 8.52E-01
2020s 9.59E-14 ***
Nanbu 3338 2050s 7.27E-03 ***
2080s 1.28E-01
2020s 9.75E-16 ***
Ankang 3207 2050s 1.53E-07 ***
2080s 1.04E-01
2020s 3.19E-04 ***
Changde 3317 2050s 9.57E-03 ***
2080s 7.26E-03 ***
2020s 1.05E-01
Wuchang 3125 2050s 7.30E-01
2080s 5.35E-02 *
2020s 1.65E-04 ***
Nanchang 3309 2050s 2.13E-04 ***
2080s 1.44E-04 ***
2020s 6.54E-02 *
Hefei 2992 2050s 5.69E-06 ***
2080s 1.34E-03 ***
2020s 5.92E-01
Gaochun 2975 2050s 1.71E-02 **
2080s 1.60E-03 ***
2020s 9.98E-09 ***
Longyou 3342 2050s 4.33E-08 ***
2080s 3.06E-03 ***
2020s 1.47E-03 ***
Jiaxing 3280 2050s 1.95E-02 **
2080s 5.04E-01

Note: *, **, and *** denote the level of significance at 10%, 5%, and 1%, respectively.

3.3 Changes in rapeseed production potential in the Yangtze River Basin by the 2050s

Table 4 shows the changes in total rapeseed production potential for the upper, middle and lower reaches of the Yangtze River Basin under 2 GCMs driven by 4 RCP scenarios in the 2050s relative to the baseline.
Table 4 Total rapeseed production changes for the upper, middle and lower reaches of the Yangtze River in the 2080s (million tons)
Scenarios climate models Upper reaches (mt) Middle reaches (mt) Lower reaches (mt)
RCP2.6 GFDL-ESM2M 0.826 2.528 0.507
NorESM1-M 1.911 2.583 0.385
RCP4.5 GFDL-ESM2M 0.802 3.316 0.927
NorESM1-M 1.441 2.263 0.223
RCP6.0 GFDL-ESM2M -0.122 -2.333 -0.217
NorESM1-M 0.748 1.705 0.241
RCP8.5 GFDL-ESM2M 0.779 0.240 -0.005
NorESM1-M 1.130 2.810 0.648
Average 0.939 1.639 0.339
In the upper reaches of the Yangtze River Basin, except for climate model GFDL-ESM2M driven by RCP 6.0, our simulations under all other scenarios show a yield increase compared with the results in baseline. The average increase in total production potential of the 8 combinations for the upper reaches is 0.939 million tons. The largest increase is 1.911 million tons under the NorESM1-M and RCP 2.6 scenario.
In the middle reaches of the Yangtze River Basin, our simulations under 7 of the 8 combinations show an increase. The average increase in total production potential is 1.639 million tons, while the largest increase is 3.316 million tons under the GFDL-ESM2M and RCP4.5 scenario. NorESM1-M produces an increase with all 4 RCPs scenarios.
In the lower reaches of the Yangtze River Basin, which include Jiangsu, Zhejiang and Shanghai, our simulations under 6 of the 8 combinations show an increase. The average increase is 0.339 million tons. The NorESM1-M once again produces an increase with all of the 4 RCPs scenarios. The largest increase in production potential is 0.927 million tons under the GFDL-ESM2M and RCP4.5 combination.
The above results indicate that our simulations under the GFDL-ESM2M and RCPs scenarios show more variation than under the NorESM1-M and RCPs scenarios in terms of rapeseed production in the Yangtze River Basin in the 2050s.
Figure 5 shows the changes in rapeseed yield at the grid-cell level between the baseline and the middle of the 21st century produced under the combined scenarios of RCPs and GFDL-ESM2M and NorESM1-M, respectively. In the upper reaches of the Yangtze River Basin, our simulations under almost all of the 8 combinations show a yield increase in southern Shaanxi and northern Chongqing. In contrast, except for the climate model NorESM1-M driven by RCP 2.6, our simulations under all other combinations show a slight yield decrease (0-250 kg/ha) in the east of Sichuan Province.
Figure 5 Rapeseed yield change from the baseline to the mid-21st century (2050s) under RCP2.6, RCP4.5, RCP6.0 and RCP8.5 scenarios produced with GFDL-ESM2M (a-d) and NorESM-M (e-h) climate models
In the middle reaches of the Yangtze River Basin, our simulations under all 8 combinations of GCMs and RCPs show a yield increase in central and eastern Hubei, northern Hunan and central Anhui. In Jiangxi Province, nevertheless, the rapeseed yield is expected to slightly decrease under the 8 combinations in the 2050s.
In the lower reaches of the Yangtze River Basin, the upper coastal part of Jiangsu Province shows a significant yield increase under the 8 combinations by the end of the century. In the rest of the regions, rapeseed yield may keep a relatively stable level or slight decrease, in comparison with the baseline.

4 Discussion and conclusion

In this study, the cultivar parameters of rapeseed in the AEZ model were calibrated and validated using the observations in 10 representative sites in the Yangtze River Basin. Based on the updated AEZ model, we simulated rapeseed production in the future under 20 sets of climate change projections. We first estimated the probability of change in rapeseed production potentials relative to the baseline for the 10 representative sites, and then we assessed the total rapeseed production change for the whole basin and yield changes across grid-cells of the basin in the 2050s. We found that the uncertainty of the impact of climate change on rapeseed production increases with time. There are some differences between the different scenarios and climate models, but the production change in space was overall consistent across these climate predictions. In the middle of the century, the average increase in the total production potential under the 8 scenario combinations for the upper reaches will be 0.939
million tons, mainly distributed in southern Shaanxi and northern Chongqing. For the middle reaches, there will be a significance possibility of increasing rapeseed production in central and eastern Hubei, northern Hunan and central Anhui. As for the lower reaches of the Yangtze River Basin, our simulations under 6 of the 8 scenario combinations show an increase in yield, mainly distributed in eastern Jiangsu Province along the coast. Deniel et al. (2009) examined the potential climate change impacts on the productivity of five major crops in eastern China: canola, corn, potato, rice and winter wheat. Their simulations are performed with and without the enhanced CO2-fertilization effect. Their results indicate that aggregated potential productivity increases by 8.3% for canola. However, without the enhanced CO2-fertilization effect, potential productivity declines by 2.5% to 12%. Wang et al. (2014) selected 3 experimental sites in the Yangtze River Basin, and analyzed the changes of rapeseed production potential in the future (2021-2050) relative to the reference period (1959-2009) based on the A2, B2 and A1B emission scenarios in the SRES report and the multi-year daily projected meteorological data. They showed that biomass and yield at these sites increased to different extents. Our research also showed a significant probability of increase in total production potentials for rapeseed in the Yangtze River Basin in the future.
Some limitations of this study are worth mentioning and could be overcome by future research. Firstly, the observation-based calibration method of the AEZ model on rapeseed varieties needs to be improved. Results show that the performance of the new AEZ model is not satisfactory at some sites in some years, which needs to be further improved. The crop mechanism model, which simulates the dynamic growth process of crops, can be coupled with the AEZ model to improve the AEZ varieties parameters. Secondly, improvements can be done with respect to the climate model selection. This paper uses the GCM-RCPs scenario data proposed in the IPCC AR5, which show some improvements compared to CMIP3 in mode resolution and experimental design. However, large uncertainties remain in the model simulation results, and the application of these data in agricultural production research is still far from mature. Some of the concentration pathways may need to be further explored. Finally, monthly climatic factors are used in the study (for example, monthly cumulative rainfall and monthly mean temperature) and changes in production potential do not include the effects of extreme weather events, which should also be explored in the future research.

Acknowledgement

We thank Elisa Calliari from Ca’Foscari University of Venice for providing valuable advice on the revision of the article.

The authors have declared that no competing interests exist.

[1]
Cai C Z, 2007. Rape yield potential analysis of cropping system regions in China based on AEZ model.Chinese Journal of Agricultural Resources and Regional Planning, 28(1): 37-37. (in Chinese)According to AEZ model jointly developed by FAO and IIASA based on the statistical data from 1961 to 1997(through revision by many sides),this paper calculates rape yield potential of 41 cropping system sub-regions in China by GIS platform,and points out the region location where the single yield potential is the highest.Research results show that the highest yield potential of rape in China will be 2-3 times of the present yield.This is of important reference significance for high yield breeding and cultivation of rape in China.

[2]
Cai C Z, Liang Y, 2009. An analysis on the yield per uint of Chinese Cole based on yield potential prediction.Guizhou Agricultural Sciences, 37(6): 57-59. (in Chinese)The light utilization efficiency,the variation tendency of production in the past 45 years,and the Agricultural Ecology Zone(AEZ) model of Cole were used to predict the yield potential and to discuss the highest theoretical increase of yield per unit in China.Results showed that the highest increase of yield per unit were 10%,9%,8%,7% and 6% in 1961 to 1985,1988,1994,1999 and 2004 separately.Any Cole cultivar or plantation technique that were claimed to harvest more could be inaccuracy.

[3]
Challinor A J, Watson J, 2014. A meta-analysis of crop yield under climate change and adaptation.Nature Climate Change, 4(4): 287-291.Feeding a growing global population in a changing climate presents a significant challenge to society1, 2. The projected yields of crops under a range of agricultural and climatic scenarios are needed to assess food security prospects. Previous meta-analyses3 have summarized climate change impacts and adaptive potential as a function of temperature, but have not examined uncertainty, the timing of impacts, or the quantitative effectiveness of adaptation. Here we develop a new data set of more than 1,700 published simulations to evaluate yield impacts of climate change and adaptation. Without adaptation, losses in aggregate production are expected for wheat, rice and maize in both temperate and tropical regions by 2 C of local warming. Crop-level adaptations increase simulated yields by an average of 7鈥15%, with adaptations more effective for wheat and rice than maize. Yield losses are greater in magnitude for the second half of the century than for the first. Consensus on yield decreases in the second half of the century is stronger in tropical than temperate regions, yet even moderate warming may reduce temperate crop yields in many locations. Although less is known about interannual variability than mean yields, the available data indicate that increases in yield variability are likely.

DOI

[4]
Daniel R, César I, Allison M, 2009. Long-term climate change impacts on agricultural productivity in eastern China.Agricultural and Forest Meteorology, 149(6/7): 1118-1128.Increasing atmospheric greenhouse gas concentrations are expected to induce significant climate change over the next century and beyond, but the impacts on society remain highly uncertain. This work examines potential climate change impacts on the productivity of five major crops in eastern China: canola, corn, potato, rice, and winter wheat. In addition to determining domain-wide trends, the objective is to identify vulnerable and emergent regions under future climate conditions, defined as having a greater than 10% decrease and increase in productivity, respectively. Data from the ICTP RegCM3 regional climate model for baseline (1961–1990) and future (2071–2100) periods under A2 scenario conditions are used as input for the EPIC agro-ecosystem simulation model in the domain [30°N, 108°E] to [42°N, 123°E]. Simulations are performed with and without the enhanced CO 2-fertilization effect. Results indicate that aggregate potential productivity (i.e. if the crop is grown everywhere) increases 6.5% for rice, 8.3% for canola, 18.6% for corn, 22.9% for potato, and 24.9% for winter wheat, although with significant spatial variability for each crop. However, without the enhanced CO 2-fertilization effect, potential productivity declines in all cases ranging from 2.5 to 12%. Interannual yield variability remains constant or declines in all cases except rice. Climate variables are found to be more significant drivers of simulated yield changes than changes in soil properties, except in the case of potato production in the northwest where the effects of wind erosion are more significant. Overall, in the future period corn and winter wheat benefit significantly in the North China Plain, rice remains dominant in the southeast and emerges in the northeast, potato and corn yields become viable in the northwest, and potato yields suffer in the southwest with no other crop emerging as a clear beneficiary from among those simulated in this study.

DOI

[5]
Deligios P A, Farci R, Sulas L, 2013. Predicting growth and yield of winter rapeseed in a Mediterranean environment: Model adaptation at a field scale.Field Crops Research, 144(6): 100-112.The DSSAT Cropping System Model (CSM-CROPGRO) was used to adapt a new model for rapeseed (Brassica napus L var. oleifera D.C.) and to evaluate it at a field scale under Mediterranean conditions. Model coefficients used to describe growth and development of soybean [Glycine max (L) Men.] were chosen as initial reference values. Information on rapeseed from the literature was then used to replace the parameters of the model. Phenology, growth, and partitioning were evaluated using experimental data from two locations of Sardinia (Italy) that were collected in 2007 and 2008. The simulated crop cycle (flowering, first pod, first seed and maturity date), leaf area index (LA!), specific leaf area (SLA), aboveground biomass and pod mass production, yield components, and grain yield and composition (oil and nitrogen content) of rapeseed were compared with specific observations for the early maturity cultivar Kabel, chosen among the most promising under Mediterranean conditions. Base temperatures for processes of this species are typically between 0 and 5 degrees C for photosynthetic, vegetative, and reproductive processes while corresponding optimum temperatures vary from 21 to 25 degrees C. Crop cycle was simulated with a RMSE of 0.8 days (d-index = 0.96). Mean predicted aboveground biomass at final harvest was 3825 kg ha(-1), with a RMSE of 1582 kg ha(-1) (d-index = 0.92). The model estimated SLA with a RMSE of 42.3 cm(2) g(-1) (d-index = 0.78). Predicted grain yield of rapeseed was 2791 kg ha(-1) and was in agreement with the observed data. The results obtained from this model adaptation for rapeseed revealed satisfactory predictions of phenology, growth, and yield of rapeseed and hence suggested that the CSM-CROPGRO model can be used for simulation of rapeseed production in Mediterranean environments although further evaluation for water and nitrogen limiting environments is needed. (C) 2013 Elsevier B.V. All rights reserved.

DOI

[6]
FAO, 2003. World Agriculture: Towards 2015/2030: An FAO perspective. Available at: www.fao.org/docrep/005/y4252e/y4252e00.htm.

[7]
FAO/IIASA/ISRIC/ISSCAS/JRC, 2009. Harmonized World Soil Database (version 1.1).

[8]
FAOSTAT, 2015. Available at: .

[9]
Fischer G, Van V H T, Shah M M, 2002. Global agro-ecological assessment for agriculture in the 21st century: Methodology and results. IIASA Research Report.

[10]
Hansen J W, Challinor A J, Ines A, 2006. Translating climate forecasts into agricultural terms: Advances and challenges.Climate Researh, 33(1): 27-41.Seasonal climate prediction offers the potential to anticipate variations in crop production early enough to adjust critical decisions. Until recently, interest in exploiting seasonal forecasts from dynamic climate models (e.g. general circulation models, GCMs) for applications that involve crop simulation models has been hampered by the difference in spatial and temporal scale of GCMs and crop models, and by the dynamic, nonlinear relationship between meteorological variables and crop response. Although GCMs simulate the atmosphere on a sub-daily time step, their coarse spatial resolution and resulting distortion of day-to-day variability limits the use of their daily output. Crop models have used daily GCM output with some success by either calibrating simulated yields or correcting the daily rainfall output of the GCM to approximate the statistical properties of historic observations. Stochastic weather generators are used to disaggregate seasonal forecasts either by adjusting input parameters in a manner that captures the predictable components of climate, or by constraining synthetic weather sequences to match predicted values. Predicting crop yields, simulated with historic weather data, as a statistical function of seasonal climatic predictors, eliminates the need for daily weather data conditioned on the forecast, but must often address poor statistical properties of the crop limate relationship. Most of the work on using crop simulation with seasonal climate forecasts has employed historic analogs based on categorical ENSO indices. Other methods based on classification of predictors or weather types can provide daily weather inputs to crop models conditioned on forecasts. Advances in climate-based crop forecasting in the coming decade are likely to include more robust evaluation of the methods reviewed here, dynamically embedding crop models within climate models to account for crop influence on regional climate, enhanced use of remote sensing, and research in the emerging area of 'weather within climate.'

DOI

[11]
Holzworth D P, Huth N I, 2014. APSIM-evolution towards a new generation of agricultural systems simulation.Environmental Modelling & Software, 62: 327-350.61APSIM is an agricultural modelling framework used extensively worldwide.61It can simulate a wide range of agricultural systems.61It begins its third decade evolving into an agro-ecosystem framework.

DOI

[12]
IIASA/FAO, 2012. Global Agro-Ecological Zones (GAEZ v3.0).

[13]
Liu J Y, Buheaosier, 2000. Study on spatial-temporal feature of modern land-use change in China: Using remote sensing techniques.Quaternary Sciences, 20(3): 229-239. (in Chinese)

[14]
Liu J Y, Kuang W H, Zhang Z X, 2014. Spatiaotemporal characteristics, patterns and causes of land-use changes in China since the late 1980s.Geographical Sciences, 24(2): 195-210. (in Chinese)Land-use/land-cover changes (LUCCs) have links to both human and nature interactions. China's Land-Use/cover Datasets (CLUDs) were updated regularly at 5-year intervals from the late 1980s to 2010,with standard procedures based on Landsat TM\ETM+ images. A land-use dynamic regionalization method was proposed to analyze major land-use conversions. The spatiotemporal characteristics,differences,and causes of land-use changes at a national scale were then examined. The main findings are summarized as follows. Land-use changes (LUCs) across China indicated a significant variation in spatial and temporal characteristics in the last 20 years (1990-2010). The area of cropland change decreased in the south and increased in the north,but the total area remained almost unchanged. The reclaimed cropland was shifted from the northeast to the northwest. The built-up lands expanded rapidly,were mainly distributed in the east,and gradually spread out to central and western China. Woodland decreased first,and then increased,but desert area was the opposite. Grassland continued decreasing. Different spatial patterns of LUC in China were found between the late 20th century and the early 21st century. The original 13 LUC zones were replaced by 15 units with changes of boundaries in some zones. The main spatial characteristics of these changes included (1) an accelerated expansion of built-up land in the Huang-Huai-Hai region,the southeastern coastal areas,the midstream area of the Yangtze River,and the Sichuan Basin;(2) shifted land reclamation in the north from northeast China and eastern Inner Mongolia to the oasis agricultural areas in northwest China;(3) continuous transformation from rain-fed farmlands in northeast China to paddy fields;and (4) effectiveness of the "Grain for Green" project in the southern agricultural-pastoral ecotones of Inner Mongolia,the Loess Plateau,and southwestern mountainous areas. In the last two decades,although climate change in the north affected the change in cropland,policy regulation and economic driving forces were still the primary causes of LUC across China. During the first decade of the 21st century,the anthropogenic factors that drove variations in land-use patterns have shifted the emphasis from one-way land development to both development and conservation.The "dynamic regionalization method" was used to analyze changes in the spatial patterns of zoning boundaries,the internal characteristics of zones,and the growth and decrease of units. The results revealed "the pattern of the change process," namely the process of LUC and regional differences in characteristics at different stages. The growth and decrease of zones during this dynamic LUC zoning,variations in unit boundaries,and the characteristics of change intensities between the former and latter decades were examined. The patterns of alternative transformation between the "pattern" and "process" of land use and the causes for changes in different types and different regions of land use were explored.

DOI

[15]
Liu J Y, Liu M L, Tian H Q, 2005. Spatial and temporal patterns of China's cropland during 1990-2000: An analysis based on Landsat TM data.Remote Sensing of Environment, 98(4): 442-456. (in Chinese)There are large discrepancies among estimates of the cropland area in China due to the lack of reliable data. In this study, we used Landsat TM/ETM data at a spatial resolution of 30 m to reconstruct spatial and temporal patterns of cropland across China for the time period of 1990鈥2000. Our estimate has indicated that total cropland area in China in 2000 was 141.1 million hectares (ha), including 35.6 million ha paddy land and 105.5 million ha dry farming land. The distribution of cropland is uneven across the regions of China. The North-East region of China shows more cropland area per capita than the South-East and North regions of China. During 1990 2000, cropland increased by 2.79 million ha, including 0.25 million ha of paddy land and 2.53 million ha of dry farming land. The North-East and North-West regions of China gained cropland area, while the North and South-East regions showed a loss of cropland area. Urbanization accounted for more than half of the transformation from cropland to other land uses, and the increase in cropland was primarily due to reclamation of grassland and deforestation. Most of the lost cropland had good quality with high productivity, but most gained cropland was poor quality land with less suitability for crop production. The globalization as well as changing environment in China is affecting land-use change. Coordinating the conflict between environmental conservation and land demands for food will continue to be a primary challenge for China in the future.

DOI

[16]
Liu J Y, Zhang Z X, Xu X L, 2010. Spatial patterns and driving forces of land use change in China during the early 21st century. Journal of Geographical Sciences, 20(4): 483-494. (in Chinese)Land use and land cover change as the core of coupled human-environment systems has become a potential field of land change science (LCS) in the study of global environmental change. Based on remotely sensed data of land use change with a spatial resolution of 1 km × 1 km on national scale among every 5 years, this paper designed a new dynamic regionalization according to the comprehensive characteristics of land use change including regional differentiation, physical, economic, and macro-policy factors as well. Spatial pattern of land use change and its driving forces were investigated in China in the early 21st century. To sum up, land use change pattern of this period was characterized by rapid changes in the whole country. Over the agricultural zones, e.g., Huang-Huai-Hai Plain, the southeast coastal areas and Sichuan Basin, a great proportion of fine arable land were engrossed owing to considerable expansion of the built-up and residential areas, resulting in decrease of paddy land area in southern China. The development of oasis agriculture in Northwest China and the reclamation in Northeast China led to a slight increase in arable land area in northern China. Due to the “Grain for Green” policy, forest area was significantly increased in the middle and western developing regions, where the vegetation coverage was substantially enlarged, likewise. This paper argued the main driving forces as the implementation of the strategy on land use and regional development, such as policies of “Western Development”, “Revitalization of Northeast”, coupled with rapidly economic development during this period.

DOI

[17]
Liu J Y, Zhang Z X, Zhang D F, 2003. A study on the spatial-temporal dynamic changes of land-use and driving forces analyses of China in the 1990s.Geographical Research, 22(1): 1-12. (in Chinese)Supported by the key knowledge innovation projects,i.e., a preliminary study on the theories and techniques of the remotely sensed temporal-spatial information and digital Earth; and a study on the integration of national resources and environment and data sharing, the authors have set up a spatial-temporal information platform by the integration of the corresponding scientific and research achievements during the periods of the 8th- and 9th-Five Year Plan, which comprehensively reflected the features of land-use change, designed a series of technical frameworks on the spatial-temporal database construction based on remote sensing techniques, e.g., the construction of remotely sensed database and land-use spatial database of the mid-1980s, the mid-1990s and the end of the 1990s, which laid a foundation for the dynamic monitoring of land-use change and the corresponding studies. In this paper,the authors have analyzed comprehensively the features of land-use change in the 1990s, revealed the spatial-temporal change of land use supported by remote sensing and GIS technologies as well as analyzed the geophysical and socio-economic driving factors.The findings are as follows: the arable land has been increased in total amount, the balance of decrease in the south and increase in the north was resulted from the reclamations of grassland and forest land. On the whole, the forest land area had a process of decrease, and the decreased area was mainly distributed in the traditional forest areas. Areas with plentiful precipitation and heat in the south, however, had distinct effects of reforestation. The rural-urban construction land had a situation of persistent expansion, and the general expansion speed has been slowed down during the last five years of the 1990s with the exception of the Western China where the expansion speed has been accelerated. The land use change in China in the 1990s had distinct temporal and spatial differences due to two main reasons, which were policy control and economic driving. Hereby, conclusions and proposals brought forward by the authors were as follows: the spatial diversity rules of the modern land use change in China must be fully considered in the future land use planning. At the same time, the pertinence of physical geographical zones must be considered during the planning of eco-environment construction. And, based on the increasingly maturity of the infrastructure, the traditional thoughts on planning and management of resources must be shifted so as to fully realize the optimized allocation of land resources at regional scale.

DOI

[18]
Luo Y, Guo W, 2008. Development and problems of crop models.Transactions of the Chinese Society of Agricultural Engineering, 24(5): 307-312. (in Chinese)The development and problems of crop models were reviewed taking CERES-Wheat and Maize models as examples.Simulation of radiation use under condition of different canopy structures and soil water and nitrogen stresses to crop growth should be forth studied to discuss the mechanism and to improve the predicted properties of models simulation.At present,Most of the available crop models have been developed under frame of one dimensional crop-soil-atmospheric systems.It is suggested that the one-dimensional crop model can be extended to three-dimensional ones by incorporating the simulation of biological chemical recycle and the routing approaches of distributed hydrological models,which is the application demand of regional water and soil resources evaluation and management and can accelerate the development of crop models.

DOI

[19]
Masutomi Y, Takahashi K, Harasawa H, 2009. Impact assessment of climate change on rice production in Asia in comprehensive consideration of process/parameter uncertainty in general cirulation models.Agriculture, Ecosystems & Environment, 131(3): 281-291.We assessed the impact of climate change on rice production in Asia in comprehensive consideration of the process/parameter uncertainty in general circulation models (GCMs). After inputting future climate scenarios based on the projections of GCMs for three Special Report on Emissions Scenarios (SRES) (18 GCMs for A1B, 14 GCMs for A2, and 17 GCMs for B1) into a crop model, we calculated the average change in production ( A CP), the standard deviation of the change in production ( SD CP), and the probability of a production decrease ( P PD) for each SRES scenario, taking into account the effect of CO 2 fertilization. In the 2020s, P PD values were high for all SRES scenarios because the negative impacts of climate change were larger than the positive effects of CO 2 fertilization in almost all climate scenarios in the near future. This suggests that it will be necessary to take immediate adaptive actions, regardless of the emission scenario, in the near future. In the 2080s, there were large differences in A CP, SD CP, and P PD among the SRES scenarios. The scenario with the highest atmospheric CO 2 concentration, A2, showed a notable decrease in production and a high P PD in the 2080s compared with the other scenarios, despite having the largest CO 2 fertilization effect. In addition, A2 had the largest SD CP among the SRES scenarios. On the other hand, the scenario with the lowest atmospheric CO 2 concentration, B1, showed a small decrease in production, and a much smaller SD CP and a much lower P PD, than in the case of A2. These results for the 2080s suggest that a reduction in CO 2 emissions in the long term has great potential not only to mitigate decreases in rice production, but also to reduce the uncertainty in these changes.

DOI

[20]
Moss R H, Edmonds J A, Hibbard K A, 2010. The next generation of scenarios for climate change research and assessment.Nature, 463(7282): 747-756.Advances in the science and observation of climate change are providing a clearer understanding of the inherent variability of Earth's climate system and its likely response to human and natural influences. The implications of climate change for the environment and society will depend not only on the response of the Earth system to changes in radiative forcings, but also on how humankind responds through changes in technology, economies, lifestyle and policy. Extensive uncertainties exist in future forcings of and responses to climate change, necessitating the use of scenarios of the future to explore the potential consequences of different response options. To date, such scenarios have not adequately examined crucial possibilities, such as climate change mitigation and adaptation, and have relied on research processes that slowed the exchange of information among physical, biological and social scientists. Here we describe a new process for creating plausible scenarios to investigate some of the most challenging and important questions about climate change confronting the global community.

DOI PMID

[21]
Tang Q H, Yin Y, Liu X, 2015. A multi-model analysis of change in potential yield of major crops in China under climate change.Earth System Dynamics, 6(1): 45-59. (in Chinese)Climate change may affect crop growth and yield, which consequently casts a shadow of doubt over China's food self-sufficiency efforts. In this study, we used the projections derived from four global gridded crop models (GGCropMs) to assess the effects of future climate change on the yields of the major crops (i.e., maize, rice, soybean and wheat) in China. The GGCropMs were forced with the bias-corrected climate data from five global climate models (GCMs) under Representative Concentration Pathway (RCP) 8.5, which were made available through the Inter-Sectoral Impact Model Intercomparison Project (ISI-MIP). The results show that the potential yields of the crops would decrease in the 21st century without carbon dioxide (CO2) fertilization effect. With the CO2 effect, the potential yields of rice and soybean would increase, while the potential yields of maize and wheat would decrease. The uncertainty in yields resulting from the GGCropMs is larger than the uncertainty derived from GCMs in the greater part of China. Climate change may benefit rice and soybean yields in high-altitude and cold regions which are not in the current main agricultural area. However, the potential yields of maize, soybean and wheat may decrease in the major food production area. Development of new agronomic management strategies may be useful for coping with climate change in the areas with a high risk of yield reduction.

DOI

[22]
Tao F, Zhang Z, Liu J, 2009. Modelling the impacts of weather and climate variability on crop productivity over a large area: A new super-ensemble-based probabilistic projection.Agricultural and Forest Meteorology, 149(8): 1266-1278. (in Chinese)Process-based crop models are increasingly being used to investigate the impacts of weather and climate variability (change) on crop growth and production, especially at a large scale. Crop models that account for the key impact mechanisms of climate variability and are accurate over a large area must be developed. Here, we present a new process-based general Model to capture the Crop鈥揥eather relationship over a Large Area (MCWLA). The MCWLA is optimized and tested for spring maize on the Northeast China Plain and summer maize on the North China Plain, respectively. We apply the Bayesian probability inversion and a Markov chain Monte Carlo (MCMC) technique to the MCWLA to analyze uncertainties in parameter estimation and model prediction and to optimize the model. Ensemble hindcasts (by perturbing model parameters) and deterministic hindcasts (using the optimal parameters set) were carried out and compared with the detrended long-term yields series both at the crop model grid (0.5 0.5 ) and province scale. Agreement between observed and modelled yield was variable, with correlation coefficients ranging from 0.03 to 0.88 ( p < 0.01) at the model grid scale and from 0.45 to 0.82 ( p < 0.01) at the province scale. Ensemble hindcasts captured significantly the interannual variability in crop yield at all the four investigated provinces from 1985 to 2002. MCWLA includes the process-based representation of the coupled CO 2 and H 2O exchanges; its simulations on crop response to elevated CO 2 concentration agree well with the controlled-environment experiments, suggesting its validity also in future climate. We demonstrate that the MCWLA, together with the Bayesian probability inversion and a MCMC technique, is an effective tool to investigate the impacts of climate variability on crop productivity over a large area, as well as the uncertainties.

DOI

[23]
Taylor K E, Stouffer R J, Meehl G A, 2012. An overview of CMIP5 and the experiment design,Bulletin of the American Meteorological Society, 93(4): 485-498.

DOI

[24]
Tebaldi C, Lobell D B, 2008. Towards probabilistic projections of climate change impacts on global crop yields,Geographical Research Letters, 35(8): 307-315.There is a widely recognized need in the scientific and policy communities for probabilistic estimates of climate change impacts, beyond simple scenario analysis. Here we propose a methodology to evaluate one major climate change impact - changes in global average yields of wheat, maize, and barley by 2030 - by a probabilistic approach that integrates uncertainties in climate change and crop yield responses to temperature, precipitation, and carbon dioxide. The resulting probability distributions, which are conditional on assuming the SRES A1B emission scenario and no agricultural adaptation, indicate expected changes of +1.6%, -14.1%, -1.8% for wheat, maize, and barley, with 95% probability intervals of (-4.1, +6.7), (-28.0, -4.3), (-11.0, 6.2) in percent of current yields, respectively. This fully probabilistic analysis aims at quantifying the range of plausible outcomes and allows us to gauge the relative importance of different sources of uncertainty.

DOI

[25]
Tian Z, Ding Q Y, Liang Z R, 2014a. Advances of researches in the impact on oil crops under climate change.Chinese Agricultural Science Bulletin, 30(15): 1-6. (in Chinese)Oil crops, as one of the most important crops in China, is significantly sensitive to climate change.In China, the self-sufficiency in edible oil is relative low at present, which results in a severe imbalance between supply and demand. Consequently, edible oil production is dramatically important to food security in China. Observations have shown that climate change have considerable impact on the oil crops production.Therefore, climate change impact estimation on oil crops is becoming more and more important in terms of increasing the self- sufficiency of edible oil and safeguarding the food security. In this study, based on literature review, we summarized climate change impact on Chinese three major oil crops, such as peanut,soybean and rape, including the major methodologies and impacts on the growth and development and yield,the quality and the cropping system of oil crops. Finally, we discussed the deficiencies and the future expectations.

DOI

[26]
Tian Z, Liang Z R, Fischer G, 2013. Analysis of impact on china wheat potential productivity of climate change during 1961-2010.Chinese Agricultural Science Bulletin, 29(9): 61-69. (in Chinese)

[27]
Tian Z, Zhong H L, Shi R H, 2012. Estimating potential yield of wheat production in China based on cross-scale data-model fusion,Frontiers of Earth Science, 6(4): 364-372.The response of the agro-ecological system to the environment includes the response of individual crop’s physiologic process and the adaption of the crop community to the environment. Observation and simulation at the single scale level cannot fully explain the above process. It is necessary to develop cross-scale agro-ecological models and study the interaction of agro-ecological processes across different scales. In this research, two typical agroecological models, the Decision Support System for Agrotechnology Transfer (DSSAT) model and the Agroecological Zone (AEZ) model, are employed, and a framework for effective cross-scale data-model fusion is proposed and illustrated. The national observed data from 36 different agricultural observation stations and historical weather stations (1962–1999) are employed to estimate average crop productivity. Comparison of the two models’ estimations are consistent, which would indicate the possibility ofcross-scale crop model fusion.

DOI

[28]
Tian Z, Zhong H L, Sun L X, 2014b. Improving performance of agro-ecological zone (AEZ) modeling by cross-scale model coupling: An application to japonica rice production in Northeast China.Ecological Modelling, 290: 155-164.The challenges to food security posed by climate change require unprecedented efforts and ability to simulate and predict the interactions between crop growth dynamics, and the environment and crop management at various scales. This calls for model coupling and fusion efforts, which aims to explore the interaction of agro-ecological processes across different scales. In this research, we proposed a coupling framework between two widely used crop models, the process-based and site-specific Decision Support System for Agro-Technology Transfer (DSSAT) model, and the cropping zone centered Agro-Ecological Zone (AEZ) model, with the intention to establish a coupling procedure between them, and to consequently enhance the micro foundation and improve the performance of the AEZ model. The procedure takes three major steps: (1) derive, calibrate and validate the key cultivar parameters using DSSAT, (2) translate these cultivar parameters into AEZ eco-physiological parameters and validate them using AEZ and DSSAT, (3) apply AEZ with these enhanced eco-physiological parameters and compare the new results with the old ones. An illustrative application of this procedure to japonica rice production in Northeast China is carried out for individual year between 1980 and 1999. The application results in a significant improvement in the spatial performance of the AEZ model. Calibration of the crop genetic parameters increases regional average potential yield from 6.5t/ha, which is substantially lower than the observed yield of 7.3t/ha in 2000 to 9.3t/ha. Predicted rice planting areas using the refined AEZ parameterization expands significantly to coincide with the paddy field map of 2000 generated by remote sensing applications. Importantly, the procedure presents a convenient way to update the AEZ model with calibrated genetic parameters, which reflecting observed technological progresses at farm sites.

DOI

[29]
Wang S, 2014. Effect of climate change and management practices on rapeseed production in Australia and China [D]. Yangling: Northwest A&F University. (in Chinese)

[30]
Wang X C, 2011. Simulation of climate change and the response of cropping systems on the Loess Plateau of China [D]. Yangling: Northwest A&F University. (in Chinese)

[31]
Warszawski L, Frieler K, Huber V, 2014. The Inter-Sectoral Impact Model Intercomparison Project (ISI-MIP): project framework.Proceedings of the National Academy of Sciences, 111(9): 3228-3232.The Inter-Sectoral Impact Model Intercomparison Project offers a framework to compare climate impact projections in different sectors and at different scales. Consistent climate and socio-economic input data provide the basis for a cross-sectoral integration of impact projections. The project is designed to enable quantitative synthesis of climate change impacts at different levels of global warming. This report briefly outlines the objectives and framework of the first, fast-tracked phase of Inter-Sectoral Impact Model Intercomparison Project, based on global impact models, and provides an overview of the participating models, input data, and scenario set-up.

DOI

[32]
Xiao J, 2009. The rapeseed that conquered China.Chinese National Geography, (6): 60-73. (in Chinese)

[33]
Yang X, Chen B D, Tian Z, 2013. Uncertainty of ensemble winter wheat yield simulation in North China based on CMIP5. Progess in Geography, 32(4): 627-636. (in Chinese)The uncertainty of the influence of climate change on the North China's winter wheat yield is estimated by using the ensemble climate projections of CMIP5 and the probability of increase or reduction of the wheat yield in main production areas is analyzed.We combined 54 runs of projections from 15 global climate models of CMIP5 under different greenhouse gas emission scenarios in 2006-2030.Meanwhile,the CERES-Wheat was employed to stimulate the North China's winter wheat yield in the future.The results indicate that the projection of precipitation and solar radiation in future climate by the climate models has the largest uncertainty.Take the three representative points as an example: although in some years the yield will increases slightly,the fluctuation of winter wheat yield from year to year can be significant.An increased risk of lower yield is inevitable.And the probabilistic distributions of winter wheat yield in Middle and Eastern China during 2011-2030 over 2000,4000,6000,8000,and 10000 kg/hm2are elaborated.

DOI

[34]
Yang X, Chen B D, Tian Z, 2014. Impacts of climate change on wheat yield in China simulated by CMIP5 multi-model ensemble projections.Scientia Agricultura Sinica, 47(15): 3009-3024. (in Chinese)Objective】 By applying climate projections based on 30 Atmosphere-Ocean General Circulation Models(AOGCMs) under representative concentration pathway(RCP) scenarios in the Coupled Model Inter-comparison Project Phase 5(CMIP5), the effects of climate change on wheat yield in China were assessed in terms of ensemble method. 【Method】 The impact assessment of climate change on crops is typically based on daily data. However, significant uncertainties exist among the AOGCM outputs, particularly in daily data. In this paper, a pseudo global warming(PGW) method was assumed to be a linear coupling of contemporary weather fields and the difference component of climate perturbation signals by AOGCMs. CERES-Wheat model was employed to stimulate the wheat yield in the future and a probabilistic approach is used to address the uncertainties. 【Result】Warming is expected in all representative stations during the wheat growth period. Temperature increase under the RCP8.5 scenario is higher than that under the RCP2.6 scenario. The temperature in the representative stations of winter wheat is projected to increase by 2.7-2.9℃, and increase by 3.0-3.3℃ in the representative stations of spring wheat at the end of the 21 st century. The precipitation rate is projected to significantly increase in the future. Compared with the baseline, the observation data collected from 1996 to 2005 show that the climate-change-induced wheat yield reduced in all representative stations under irrigation conditions. The reduction probabilities increased with climate change. The irrigated yield reduction in the representative stations of spring wheat was greater than that in the representative stations of winter wheat. By the end of the 21 st century, the yield in the representative stations of winter wheat is projected to be decreased by 2% under the RCP 2.6 scenario. The yield reduction will be decreased by approximately 6% under the RCP 4.5 scenario and decreased by 9% under the RCP 8.5 scenario with a probability of 85%. In the representative stations of spring wheat, yield will be decreased by 5% under the RCP 2.6 scenario, by more than 8% under the RCP 4.5 scenario, and by more than 15% under the RCP 8.5 scenario with a probability of 90%. In comparison with the baseline, the rain-fed yield in the representative stations of winter wheat will be increased significantly. By the end of the 21 st century, the yield in winter wheat is projected to be increased by more than 21% under the RCP 2.6 scenario, more than 22% under the RCP 4.5 scenario, and more than 25% under the RCP 8.5 scenario with a probability of 90%.【Conclusion】The ensemble of daily data were obtained through the PGW method, which efficiently reserve the contemporary weather information, particularly that of extreme weather events. Effects of climate change on wheat yield under RCP2.6, RCP4.5, and RCP8.5 scenarios were assessed through the ensemble method. The results indicate that, with the increasing greenhouse gas emissions, the climate-change-induced yield-reduction probabilities of irrigated wheat in China gradually increased. Rain-fed wheat yield will be increased in the future, with large uncertainties.

DOI

[35]
Yang X, Tian Z, Sun L X, 2017. The impacts of increased heat stress events on wheat yield under climate change in China.Climatic Change, 140(3): 605-620.Abstract China is the largest wheat-producing country in the world. Wheat is one of the two major staple cereals consumed in the country and about 60% of Chinese population eats the grain daily. To safeguard the production of this important crop, about 85% of wheat areas in the country are under irrigation or high rainfall conditions. However, wheat production in the future will be challenged by the increasing occurrence and magnitude of adverse and extreme weather events. In this paper, we present an analysis that combines outputs from a wide range of General Circulation Models (GCMs) with observational data to produce more detailed projections of local climate suitable for assessing the impact of increasing heat stress events on wheat yield. We run the assessment at 36 representative sites in China using the crop growth model CSM-CropSim Wheat of DSSAT 4.5. The simulations based on historical data show that this model is suitable for quantifying yield damages caused by heat stress. In comparison with the observations of baseline 1996–2005, our simulations for the future indicate that by 2100 the projected increases in heat stress would lead to an ensemble-mean yield reduction of 617.1% (with a probability of 80%) and 6117.5% (with a probability of 96%) for winter wheat and spring wheat, respectively, under the irrigated condition. Although such losses can be fully compensated by CO2 fertilization effect as parameterized in DSSAT 4.5, a great caution is needed in interpreting this fertilization effect because existing crop dynamic models are unable to incorporate the effect of CO2 acclimation (the growth-enhancing effect decreases over time) and other offsetting forces.

DOI

[36]
Zhang H, Tian Z, Yang J, 2011. Study on Canola yield simulation in Yangtze River Region under the impact of climate change.Chinese Agricultural Science Bulletin, 27(21): 105-111. (in Chinese)It is necessary to check the potential impacts of climate change on canola production in the future.As one of the three Chinese oil-bearing crops,canola has attracted more and more attentions currently primarily due to the growing importance as a bio-energy crop.Climate change and its impacts have brought great concern to canola production,and Yangtze River region is one of the major canola growing zones in China.We assessed canola production of Yangtze River region using regional climate model(PRECIS) and APSIM-Canola crop model.Rain-fed canola growing was simulated with present climate(BS)(1961-1990),and future(2011-2100) under two climate scenarios(A 2 and B 2).Combine with multiple regression statistics method,canola production effects which climate change has caused in the past and will possible cause in the future was analyzed.The results showed that:(1) Rain-fed canola yield has a negative relation with radiation and temperature,but positive relation with precipitation during squaring-bolting stage and bolting-flowering stage.(2) Future simulations indicated that canola yields per unit field under A 2 and B 2 were both show downtrend as time going,and the lowest value appeared in 2080-2089.The variability of Rain-fed canola yields showed a growing trend from 2020 to 2089,and the variability of canola yield under A 2 was much larger than which under B 2 during the same period.(3) Adaptive measurements can be used to relieve the trend of yield reduction such as modifying sowing date and cultivation manner,or changing cultivar of canola.

Outlines

/