Special Issue: Land system dynamics: Pattern and process

Changes of multiple cropping in Huang-Huai-Hai agricultural region, China

  • YAN Huimin , 1, 2 ,
  • LIU Fang 1 ,
  • NIU Zhongen 1, 2 ,
  • GU Fengxue 3 ,
  • YANG Yanzhao 1, 2
Expand
  • 1. Institute of Geographic Sciences and Natural Resources Research, CAS, Beijing 100101, China
  • 2. University of Chinese Academy of Sciences, Beijing 100049, China
  • 3. Institute of Environment and Sustainable Development in Agriculture, Chinese Academy of Agricultural Sciences, Beijing 100081, China

Author: Yan Huimin (1974-), PhD, specialized in land use change. E-mail:

Received date: 2017-02-20

  Accepted date: 2017-09-15

  Online published: 2018-11-20

Supported by

National Natural Science Foundation of China, No.41430861, No.41471453

Strategic Priority Research Program, the Chinese Academy of Sciences (CAS), No.XDA20010202

Copyright

Journal of Geographical Sciences, All Rights Reserved

Abstract

Multiple cropping index (MCI) is the ratio of total sown area and cropland area in a region, which represents the regional time intensity of planting crops. Multiple cropping systems have effectively improved the utilization efficiency and production of cropland by increasing cropping frequency in one year. Meanwhile, it has also significantly altered biogeochemical cycles. Therefore, exploring the spatio-temporal dynamics of multiple cropping intensity is of great significance for ensuring food and ecological security. In this study, MCI of Huang-Huai-Hai agricultural region with intensive cropping practices was extracted based on a cropping intensity mapping algorithm using MODIS Enhanced Vegetation Index (EVI) time series at 500-m spatial resolution and 8-day time intervals. Then the physical characteristics and landscape pattern of MCI trends were analyzed from 2000-2012. Results showed that MCI in Huang-Huai-Hai agricultural region has increased from 152% to 156% in the 12 years. Topography is a primary factor in determining the spatial pattern dynamics of MCI, which is more stable in hilly area than in plain area. An increase from 158% to 164% of MCI occurred in plain area while there was almost no change in hilly area with single cropping. The most active region of MCI change was the intersection zone between the hilly area and plain area. In spatial patterns, landscape of multiple cropping systems tended to be homogenized reflected by a reduction in the degree of fragmentation and an increase in the degree of concentration of cropland with the same cropping system.

Cite this article

YAN Huimin , LIU Fang , NIU Zhongen , GU Fengxue , YANG Yanzhao . Changes of multiple cropping in Huang-Huai-Hai agricultural region, China[J]. Journal of Geographical Sciences, 2018 , 28(11) : 1685 -1699 . DOI: 10.1007/s11442-018-1537-2

1 Introduction

Continued growth in population and food consumption has brought about the great challenge facing global agriculture to ensure a constant food supply while reducing negative environmental impacts (Robertson et al., 2005; Foley et al., 2005; 2011; Godfray et al., 2010; Tilman et al., 2011; Seufert et al., 2012). Cropland use intensity is not only an important characteristic of agricultural land use (Rudel, 2009), but also one of the major causes of environmental change (Foley et al., 2005). On one hand, improved cropland use intensity is one of the important and effective sources of growth in crop production. Seasonal farming produces complex and changeable mosaics at regional scale, which results in new landscape and ecological mechanisms. On the other hand, high agricultural land-use intensity has adjusted exchange rates of biogeochemical processes, altered biological diversity and affected energy flow and water cycling (Godfray et al., 2010; Tilman et al., 2011).
As for China, the largest food consumer, improving resource use efficiency by increasing cropland intensity is an essential pathway for ensuring food security (Shi et al., 2010). Multiple cropping is an effective way for increasing grain production (Liu et al., 2011; Zhang, 2011; Liang et al., 2012) by improving cropland use intensity at time dimension to increase the resource utilization efficiency and agricultural output (Bian et al., 1999). Multiple cropping land in China accounted for more than one-third of the total national cropland in 2002, and its spatial pattern changes with the dynamics of natural and socio-economic status (Qiu et al., 2003; Yan et al., 2005a; Yan et al., 2014). On one hand, potential for extending multiple cropping is investigated to increase agricultural output. On the other hand, multiple cropping rate decreases due to low efficiency of agriculture (Zhu et al., 2007; Jin et al., 2011; Liang et al., 2012; Song et al., 2012; Xu et al., 2013). However, current research reveals the large gaps in knowledge of spatial dynamics of multiple cropping intensity (MCI), which is an important determinant of sown area. Since grain production in China soared to its highest level ever in 1998, crop yield and total production have continually decreased, including a sharp decline in rice and wheat. So China began to face the grand challenge of achieving food security again. Grain output began to grow with increasing harvested areas in 2004, and through policy regulations, it exhibited a continued growth for the following ten years. The growth in the ten years may be due to the following reasons: increases in MCI (Zhang, 2011; Zhang et al., 2011a; Liang et al., 2012), large areas of cropland circulation, or reformation of medium- and low-yield cropland and construction of high-standard cropland (Zhao et al., 2009; Cheng, 2010; Zhang et al., 2011b; Yan et al., 2016). Therefore, it is of great importance to explore the spatio-temporal dynamics of multiple cropping intensity for understanding the impacts of cropland use intensity on agricultural production and ecosystem functions.
Statistical methods based on census data are the primary methods to map MCI for administrative regions (Xie and Liu, 2015). However, it only represents the regional average cropping intensity and fails to provide inter-regional variations (Yan et al., 2014). Satellite remote sensing is the most effective technique to detect large-scale land cover change. Data from remote sensing images have provided critical supports for identifying and monitoring land use change, vegetation dynamics and key phonological transition dates (Defries et al., 2000; Friedl et al., 2002; Xiao et al., 2002a; 2002b; Liu et al., 2003). Ding et al. (2015, 2016) computed MCI of China using SPOT NDVI data and GIMMS NDVI, respectively. MODIS (Moderate Resolution Imaging Spectroradiometer) data has been freely available since 2000. MODIS data has higher spatial resolution than AVHRR and better spectral resolution than SPOT, and is widely applied for vegetation phenology monitoring and multi-cropping practices mapping (Peng et al., 2006; Zuo et al., 2009; Wang et al., 2010; Kalfas et al., 2011). Yan et al. (2014) and Zuo et al. (2014) investigated spatial pattern of multiple cropping practices of China using MODIS data in 2000 and 2005, respectively. The Enhanced Vegetation Index (EVI) time series curve generated from MODIS reflects crop phenological cycles through specific cyclical turning points (peaks and troughs), which has become the primary technique for extracting MCI (Zuo et al., 2009; Wang et al., 2010).
Huang-Huai-Hai agricultural region is an important agricultural region with high irrigated cropping intensity in China. Multiple cropped areas in this region accounted for 30.46% of that in China. Statistical data indicated that grain production in this region increased from 163.37 million tons in 2000 to 203.34 million tons in 2012, with an increment of 39.97 million tons accounting for about one-third of the national increment. Meanwhile, cropland area decreased from 3.47 ×10⁷ ha in 1996 to 3.27 ×10⁷ ha in 2008, while harvested area increased from 5.07 ×10⁷ ha to 5.13 ×10⁷ ha. Qiu et al. (2017) evaluated the cropping intensity trends in the North China plain from 1982-2013. Additionally, Ding et al. (2016) analyzed the spatio-temporal variation in MCI in Northern China using GIMMS NDVI data. The current researches mainly focus on the spatio-temporal variation of cropping intensity but the physical characteristics and landscape pattern of the trends remain weak. The objectives of this study are: 1) to recognize the dynamics of MCI in Huang-Huai-Hai agricultural region during the first 10 years of the 21st century based on the constructed crop time-series growth curves from MODIS 500 m-resolution 8-day composite products (MOD09A1); and 2) to characterize the physical characteristics and landscape pattern of MCI trends.

2 Data and methods

2.1 Study area

Huang-Huai-Hai agricultural region is located in northern China, extending from 112°-121°E to 31°-41°N. Geographically, it comprises all of Beijing, Tianjin, and Shandong Province, most parts of Hebei and Henan provinces, and the northern part of Jiangsu and Anhui provinces. As a typical alluvial plain based on the deposits of the Yellow River, Huaihe River, and Haihe River, the region is characterized by deep soil layers and soil texture suitable for farming (Liu and Long, 2016). The region has a temperate monsoon climate with semi-arid in the north and semi-humid in the south. The mean annual precipitation ranges from 280 to 1050 mm and the average temperature is 11°C to 15°C, with the accumulated temperature ≥10°C ranging from 3800°C to 4900°C (Huang et al., 2016). The region is dominated by double-cropping systems with winter wheat-rice rotation in Jiangsu and Anhui provinces, and winter wheat-summer maize rotation in the other provinces and municipalities (Tao et al., 2017).
According to cropping system zones of China (Liu, 1993), the study area includes the following five sub-regions (Figure 1 and Table 1) with different geomorphic and water conditions (Fan, 2003; Yan, 2007): 1) Piedmonts of Taihang and Yanshan Mountains with irrigated double cropping and single cropping dry land; 2) Heilonggang lower-lying plain with irrigated double cropping and single cropping dry land; 3) Low plain in northwest Shandong and north Henan with irrigated grain double cropping and cotton single cropping land; 4) Shandong hilly region with irrigated double cropping and peanut-cotton single cropping sloping dryland; 5) Nanyang basin of the Huang-Huai Plain with dryland and irrigated double-crop.
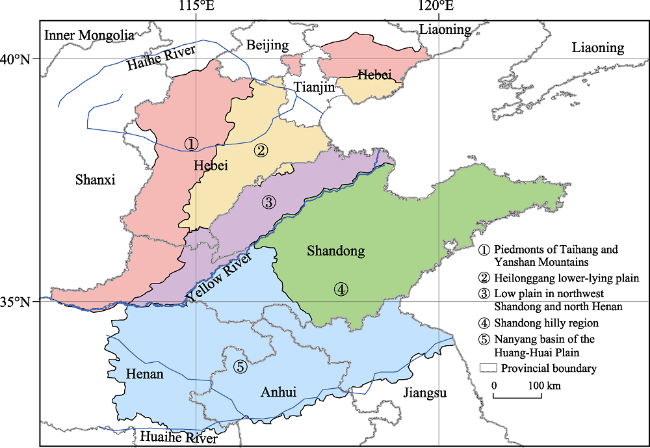
Figure 1 Location and sub-regions of Huang-Huai-Hai agricultural region
Table 1 Physical conditions of sub-regions in Huang-Huai-Hai agricultural region
Sub-region Area of cropland
(×104 ha)
Proportion of cropland (%) Mean annual precipitation
(mm)
≥10℃
accumulated temperature (℃)
Proportion of plain area (%) Proportion of hilly area (%)
Piedmonts of Taihang and Yanshan Mountains 535.61 15.13 600-900 3500-4900 66.69 33.31
Heilonggang lower-lying plain 462.36 13.06 600-750 3400-4500 99.96 0.04
Low plain in northwest Shandong and north Henan 387.20 10.94 700-900 2600-4800 99.68 0.32
Shandong hilly region 749.54 21.17 800-850 3500-4200 45.66 54.34
Nanyang basin of the Huang-Huai Plain 1405.70 39.70 900-1100 3800-5400 92.82 7.18

2.2 Data

Spatial and areal information of cropland in Huang-Huai-Hai agricultural region was from the China’s National Land-Use/Cover Dataset (NLCD) in 2000. NLCD data was derived through visual interpretation using Landsat TM/ETM+ images and validated through extensive field survey datasets (Liu et al., 2014). The area fraction cropland in each 1-km grid cell was calculated based on the vector maps. The 1-km grid cells dominated by cropland were assigned as cropland, and were then resampled to 500 m×500 m for spatial consistency with cropping intensity result.
MODIS EVI datasets (Huete et al., 2002) in 2000 and 2012 used in this study were derived from 8-day MODIS surface reflectance product at 500 m from the MOD09A1 product (http://www.edc.usgs.gov/). EVI is calculated using the following equation:
$EVI=2.5\times \frac{{{\rho }_{nir}}-{{\rho }_{red}}}{{{\rho }_{nir}}+6\times {{\rho }_{red}}-7.5\times {{\rho }_{blue}}+1}$ (1)
where ρnir, ρred and ρblue are the values of reflectance of NIR1, red and blue bands, respectively.

2.3 Multiple cropping index from MODIS EVI time series

Vegetation index such as EVI is a directly remote sensing indicator for crop growth monitoring. An annual time series of EVI data covering 46 time phases reflects crop phonological stages including planting, emergence, heading, maturity and harvest (Jakubauskas et al., 2002; Sakamoto et al., 2007). The dynamic process of rise-peak-fall in EVI time series corresponds to a crop growth cycle. Therefore, the number of peaks in EVI time series in individual grid cell is regarded as the MCI of cropland. Generally, external influences, e.g., sun angles, clouds, atmosphere and soil, cause the abnormal fluctuation of EVI dataset (Gutman, 1991; Yan et al., 2005b). Therefore, Harmonic Analysis of Time Series (HANTS) method was applied in our study to remove these noises and reconstruct smooth and gapless EVI time series data. Based on harmonic analysis, the HANTS program has been proved an effective method for phenological studies (De Jong et al., 2011; Zhou et al., 2015), which uses Fourier transformation and the least square curve fitting method for reconstruction the smooth EVI time series. Crop phenological information provided by agro-meteorological observations was also involved to compute MCI using the peak value detection method (Yan, 2007). MCI is calculated using the following equation:
$MCI=\frac{{{A}_{1}}}{{{A}_{2}}}$ (2)
where MCI refers to the multiple cropping index of cropland; A1 represents total area harvested in a single year; A2 represents total cropland area.

2.4 Landscape metrics calculation

Landscape fragmentation index (LFI) and patch density (PD) were chosen to measure the fragmentation of cropping pattern at regional and landscape scales, respectively. LFI refers to the ratio of the total number of patches to the total landscape area. PD is the ratio of patch number to the total patch type area. Lower LFI and PD values mean less fragmentation, suggesting that the landscape is composed of few large patches. Higher LFI and PD values indicate more fragmentation, that is, the landscape is composed largely of small patches (Wang et al., 1996; Li et al., 2011; Cheng et al., 2005).
$LFI=\frac{N}{S}$ (3)
where N refers to the total number of patches; S refers to the total landscape area.
$PD=\frac{{{N}_{i}}}{{{S}_{i}}}$ (4)
where Ni represents the patch numbers of landscape i; Si represents the area of landscape i.

3 Results

3.1 Changes in intensity of multiple cropping and its regional differences

From 2000-2012, the area proportions of single- and triple-cropping croplands in Huang-Huai-Hai agricultural region dropped from 47.2% and 0.3% to 42.1% and 0.2%, respectively, while the proportion of double-cropping area rose from 52.5% to 57.7%. The average MCI increased from 152.67% to 156.67% was mainly attributed to expansion of double-cropped areas. In space, about 25% and 16% of cropland area suffered an increase and decrease in MCI, respectively. Among the five sub-regions, decreased MCI primarily occurred in piedmonts of Taihang and Yanshan Mountains (region ①, Table 2). In this region, single-cropped area increased from 306 ×104 ha to 320×104 ha and double-cropped area decreased from 227 ×104 ha to 209 ×104 ha. There was 24.54% of cropland with multiple cropping intensity declined and 15.95% of cropland rose at the same time. MCI increased primarily in Low plain in northwest Shandong and north Henan (region ③) and Nanyang basin of the Huang-Huai Plain (region ⑤) with high cropping intensity. In these two regions, average MCI increased from 165.47% and 177.97% to 173.57% and 188.89%, respectively. Multiple cropped areas increased in both regions, with the proportions of multiple cropping land reached about 73% and 90%, respectively. Shandong hilly region (region ④) and Heilonggang lower-lying plain (region ②) have relatively stable MCI (Table 2). Region ④ experienced a slight decline in single-crop land from 545×104 ha to 535×104 ha, as well as a slight expansion in double-crop land from 200×104 ha to 204×104 ha. In region ②, cropland with single-cropping system increased from 353×104 ha to 355×104 ha while double-cropping area decreased from 106×104 ha to 104×104 ha. Similar proportions of croplands suffered the increased and decreased cropping index in both regions.
Table 2 MCI changes and the corresponding croplands proportions in sub-regions in Huang-Huai-Hai agricultural region during 2000-2012
Sub-region Average MCI (%) Proportion of cropland (%)
2000 2012 Change Increased MCI Decreased MCI Stable MCI
Piedmonts of Taihang and
Yanshan Mountains
142.07 137.27 -4.8 15.95 24.54 59.52
Heilonggang lower-lying plain 122.29 121.37 -0.92 16.92 21.71 61.37
Low plain in northwest Shandong and north Henan 165.47 173.57 8.1 29.41 12.42 58.18
Shandong hilly region 126.52 126.22 -0.3 18.43 19.82 61.74
Nanyang basin of the Huang-Huai Plain 177.97 188.89 10.92 33.57 9.91 56.52

3.2 Physical characteristics in the stable or variant regions of multiple cropping change

Topography and hydrothermal conditions are the major potential reasons for trend differences of MCI in different regions. Relief degree of land surface is an important regional topographic index in describing macroscopic landform, which can be represented as maximum height difference in a certain distance. Generally, the regions with a relief degree lower than 30m are defined as plain area and regions with a relief degree higher than 30m are defined as hilly area (Liu et al., 2001; Yan et al., 2016).
In Huang-Huai-Hai agricultural region, MCI in hilly area was more stable than that in plain area (Figure 2). From 2000 to 2012, the average MCI of cropland in plain area increased from 158% to 164%, while that in hilly area remained stable. The cropland area proportions with increased, stable and decreased MCI in plain area were about 27.43%, 56.04%, and 16.53% while the corresponding area proportions in hilly area were 16.46%, 68.80% and 14.74% (Figure 2). According to piedmonts of Taihang and Yanshan Mountains (①) and Shandong hilly region (④) with a large proportion of hilly area (Table 1), croplands with stable cropping intensity in hilly areas were 20.05 and 29.63 points higher than that in plain area (Figure 2). Graphically, 65.19% of cropland with increased MCI was distributed in plain-dominated regions such as low plain in northwest Shandong and north Henan (③) and Nanyang basin of the Huang-Huai Plain (⑤). 49.69% of cropland with decreasing MCI was located in regions ① and ④ (Table 3). The regional average MCI of cropland in both plain and hilly areas increased in regions ③ and ⑤ (Table 4).
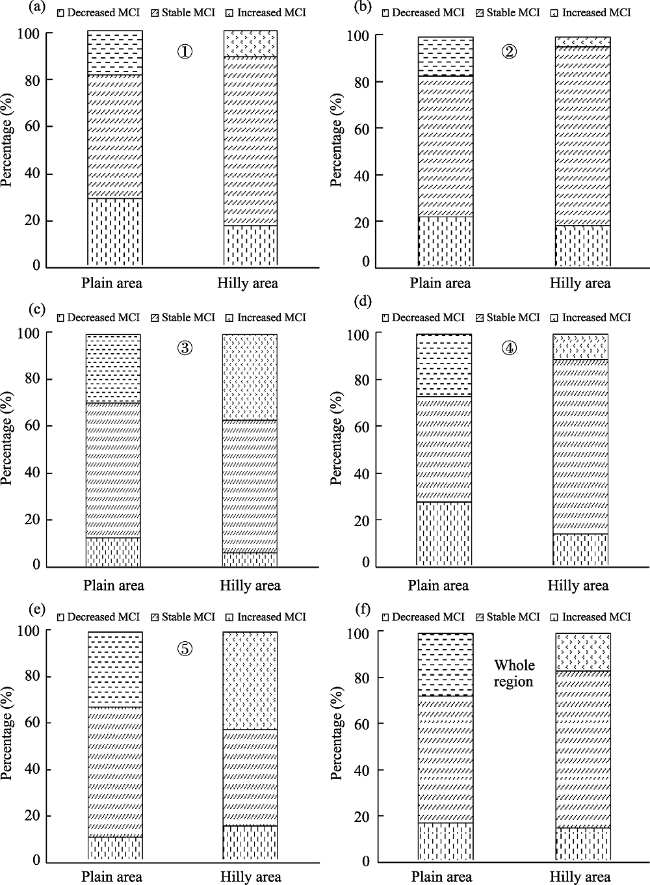
Figure 2 MCI changes in plain area and hilly area of sub-regions and the whole region during 2000-2012
Table 3 Proportions of cropland with increased and decreased MCI in each sub-region in Huang-Huai-Hai agricultural region during 2000-2012 (%)
Sub-region Proportion of increased MCI Proportion of decreased MCI
Plain area Hilly area Plain area Hilly area
Piedmonts of Taihang and Yanshan Mountains 9.96 79.16 20.84 23.63 78.32 21.68
Heilonggang lower-lying plain 9.13 99.99 0.01 18.08 99.97 0.03
Low plain in northwest Shandong and north Henan 13.00 99.65 0.35 8.47 99.85 0.15
Shandong hilly region 15.71 66.78 33.22 26.06 63.52 36.48
Nanyang basin of the Huang-Huai Plain 52.19 91.22 8.78 23.76 90.08 9.92
Table 4 MCI changes in plain area and hilly area of sub-regions in Huang-Huai-Hai agricultural region during 2000-2012 (%)
Sub-region Plain area Hilly area
2000 2012 Change 2000 2012 Change
Piedmonts of Taihang and Yanshan Mountains 157.12 151.75 -5.37 116.15 112.50 -3.65
Heilonggang lower-lying plain 122.59 121.79 -0.80 100.00 95.44 -4.56
Low plain in northwest Shandong and north Henan 166.15 174.31 8.16 178.41 190.72 12.31
Shandong hilly region 145.61 145.18 -0.43 111.76 111.77 0.02
Nanyang basin of the Huang-Huai Plain 180.47 191.13 10.66 151.33 165.86 14.53
Figure 3 shows that cropland with declining MCI in plain area was mostly located in the intersection zone of hills and plains. Cropland with increasing MCI in hilly area was also distributed in boundary zone of hilly and plain area. The MCI of cropland was almost stable in the plain hinterland and the core part of hilly area. Buffer zones of 10, 20 and 30 km around hilly area were identified as piedmont plain area, and the rest of the plain was identified as plain area. Results showed that hilly area had the largest proportion of cropland with stable MCI, followed by plain area and then piedmont plain area. The piedmont plain area had a similar proportion of cropland with increasing cropping intensity to the plain area, as well as a larger proportion of cropland with declining cropping intensity than both hilly area and plain area. It seemed that MCI of cropland in plain area and hilly area was relatively stable and that in piedmont plain area was prone to change (Table 5).
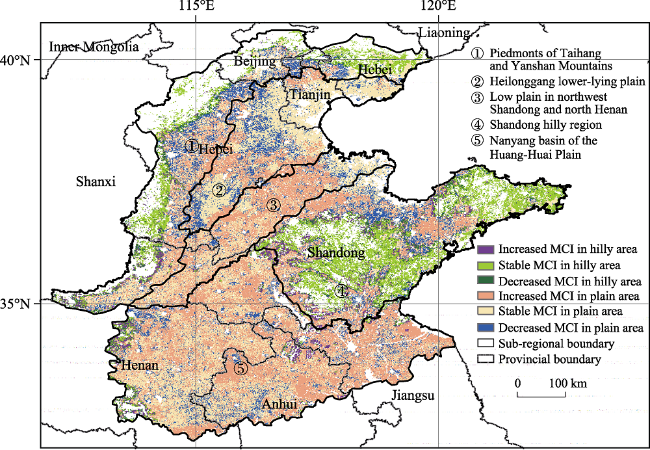
Figure 3 Multiple cropping dynamics with various topographic conditions in Huang-Huai-Hai agricultural region during 2000-2012
Table 5 Proportions of cropland with increased and decreased MCI of plain area, piedmont plain area and hilly area in Huang-Huai-Hai agricultural region during 2000-2012 (%)
Buffer zones Plain area Piedmont plain area Hilly area
Decreased MCI Stable MCI Increased MCI Decreased MCI Stable MCI Increased MCI Decreased MCI Stable MCI Increased MCI
10 km 15.39 57.47 27.15 20.23 52.56 27.21 14.74 68.80 16.46
20 km 14.85 58.72 26.43 19.46 52.26 28.27 14.74 68.80 16.46
30 km 14.56 59.53 25.91 18.79 52.77 28.44 14.74 68.80 16.46
Hydrothermal conditions also affected the spatial pattern of MCI changes. The MCI decreased croplands were mainly distributed in Heilonggang lower-lying plain (②) characterized by low precipitation and groundwater level restricting irrigation agriculture (Figure 3). Cropland with decreased MCI in this region accounted for 18.08% of that in Huang-Huai- Hai agricultural region. In terms of Low plain in northwest Shandong and north Henan (③) with flat terrain and abundant water resources, MCI in plain area increased from 166.15% to 174.31%. According to Nanyang basin of the Huang-Huai Plain (⑤) with favorable hydrothermal conditions, MCI in plain area rose from 180.47% to 191.13%. Good hydrothermal conditions favored a rise in cropping intensity in hilly area in these two regions from 178.41% and 190.72% to 151.33% and 165.86%, respectively. Owing to little limitations to multiple cropping practices in regions ③ and ⑤, cropland with increasing MCI in these regions accounted for 13.00% and 52.19% of that in Huang-Huai-Hai agricultural region, respectively (Table 3).

3.3 Changes in landscape patterns of multiple cropping

Landscape index including landscape fragmentation index (LFI) and patch density index (PD) were calculated to analyze the spatial pattern characteristics of multi-cropped land and non-multi-cropped land from 2000-2012. The MCI of single-cropping land was less than or equal to 100%. MCI of double-cropping land reached values between 100% and 200%. The triple-cropping land usually had MCI more than 200% (Figure 4). The single-, double-and triple-cropping croplands were regarded as three types of landscape.
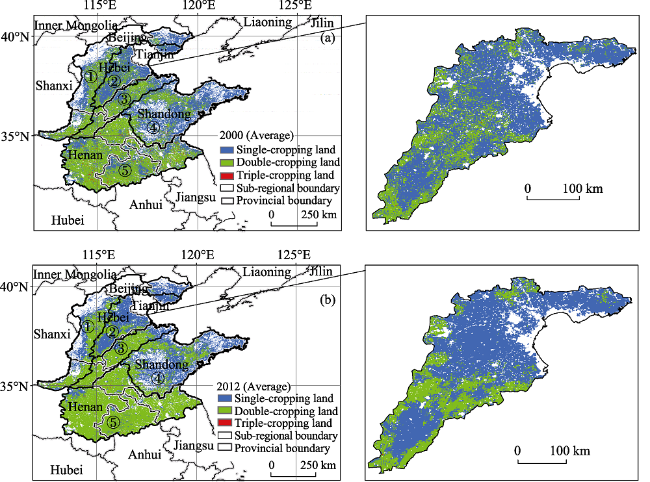
Figure 4 Spatial distribution map of multiple cropping systems in Huang-Huai-Hai agricultural region in 2000 (a) and 2012 (b)
Results showed that fragmentation degree decreased at both regional and landscape scales from 2000 to 2012 (Table 6). Landscape fragmentation index declined by 50%. Patch density of double- and single-cropping land decreased by 50% and 40%, respectively. Triple-cropping land had a minimum reduction in cropland patch density (5%). The decreased fragmentation degree of croplands with various cropping systems in Huang-Huai-Hai agricultural region indicated that croplands with the same cropping systems tended to be spatially aggregately distributed. For example, in the central part of Heilonggang lower-lying plain (②), single- and double-cropping land was largely crossly distributed in 2000 (Figure 4). When it came to 2012, a clearer boundary between single- and double-cropping land was identified, that is, the former was concentrated in the northeast and southwest parts, and the latter was mainly located in southwest of central region. In Nanyang basin of the Huang-Huai Plain (⑤), the scattered and dispersed distribution pattern of single- and triple-cropping land turned to concentratedly distributed around the west boundary of regions ③ and ⑤, which led to the higher connectivity of double-cropping landscape.
Table 6 Patch density and landscape fragmentation index in Huang-Huai-Hai agricultural region in 2000 and 2012
Landscape types 2000 2012
PD LFI PD LFI
Single-cropping land 0.20 0.16 0.12 0.08
Double-cropping land 0.08 0.04
Triple-cropping land 2.96 2.80

4 Conclusions and discussion

4.1 Conclusions

Monitoring MCI dynamics is of great importance for estimating future agricultural production and achieving food security. Compared with the traditional statistical methods, monitoring MCI is faster and more effective based on time-series vegetation index, and can represent the detailed information of spatio-temporal patterns of cropping intensity. In this paper, the 8-day interval MODIS EVI data with a spatial resolution of 500 m was applied to identify multiple cropping changes in Huang-Huai-Hai agricultural region from 2000 to 2012.
The area proportion of single-cropping land declined from 47.2% to 42.1% and the area proportion of double-cropping land increased from 52.5% to 57.7% in Huang-Huai-Hai agricultural region. Regional MCI increased from 152.67% to 156.67% with significant regional variations. MCI increased in 25% of cropland and dropped in 16% of cropland.
Terrain is an important factor affecting spatial pattern of MCI changes. MCI in hilly area was more stable than that in plain area. The average MCI of cropland in plain area increased from 158% to 164%, while that in hilly area remained stable. Some 65.19% of the cropland with increasing cropping index primarily occurred in the low plain in northwest Shandong and north Henan (③) and Nanyang basin of the Huang-Huai Plain (⑤) where plain cropland was dominated. 49.69% of cropland with decreasing MCI was located in regions ① and ④ with a large proportion of hilly area. The intersection zone of hills and plains was more prone to cropping system change. The area proportion of cropland with stable MCI decreased in the order of the piedmont plain area, plain area and hilly area. There was similar area proportion of cropland with increasing MCI in the piedmont plain area and plain area. However, cropland with decreasing MCI in the piedmont plain area was more than that in hilly area and plain area. The piedmont plain area and bordering area of hilly area and plain area were prone to a decline and rise in MCI, respectively. Cropping intensity of the cropland in core area between hilly area and plain area was relatively stable.
Hydrothermal condition is another important factor influencing the dynamics trend of MCI. Decreased MCI tended to occur in the region with scarce precipitation and underwater resources. Heilonggang lower-lying plain (②) suffered declined MCI because costly irrigation forced farmers to give up growing crops (Zhang et al., 2014). 18.08% of the cropland with decreasing cropping intensity in Huang-Huai-Hai agricultural region was distributed in this region. In the low plain in northwest Shandong and north Henan (③) and Nanyang basin of the Huang-Huai Plain (⑤) with favorable hydrothermal conditions and double cropping system, MCI rose from 151.33% and 178.41% to 165.86% and 190.72%, respectively.
Changes in multiple cropping in Huang-Huai-Hai agricultural region was not only represented by MCI changes, but also embodied in significant variations of landscape pattern. According to landscape dynamics of multiple cropping system based on LFI and PD, multiple cropping intensity in this region represented a more uniform trend. The spatial fragmentation degree of multiple cropping cropland decreased, and croplands with the same cropping system tended to be aggregatively distributed, which meant agricultural technology and large-scale farming might be another important reasons for promoting multiple cropping systems change.

4.2 Discussion

The urbanization, agricultural policies and technological advancements have huge influences on the farmers’ enthusiasm and farming practices. The conflict between achieving national food security and farmers seeking to maximize economic benefits is the direct cause of multiple cropping intensity change. The implementations of China’s agricultural support policies have effectively stimulated farmers’ enthusiasm for grain production and slowed down or even reversed the decreased tendency of MCI; the minimum grain purchasing price policies have ensured farmers’ stable income and balanced goals at both national and farm household scales (Zhu et al., 2007; Xu et al., 2013; Liang et al., 2012; Song et al., 2012). Although more farmers are going out as migrant workers due to more employment opportunities resulting from urbanization (Chen et al., 2009; Chen et al., 2014), farmers’ enthusiasm has been significantly encouraged by national policies related grain production, leading to a rise in multiple cropping intensity in Huang-Huai-Hai agricultural region. Regional variations in MCI indicate the constraints of natural environment on policy feasibility. So the development and application of policies should take full account of the timeliness, socio-economic development and natural endowments of different regions (Huang, 2004; Zhu et al., 2007; Song et al., 2012). For example, land resources in the piedmont plain area might face the conversion of agricultural land to nonagricultural uses (Wu et al., 2001). In China, farmland fragmentation due to agricultural land allocation system is an essential limitation to large-scale farming which will promote agricultural mechanization development, facilitate agricultural labor liberation and further increase the cropping intensity (Tan et al., 2006; Liang, 2007). With the implementation of large-scale agricultural mechanization, reasonable and orderly land circulation has been carried out to promote large-scale agricultural mechanization production, develop modern agriculture, make the best use of land resource, realize liberation of agricultural labor to the greatest extent and raise farmers’ income on the premise of food security. However, intensive farming practices will have profound effects on the biogeochemical cycles. High intensity irrigation in agriculture has led to rapid decline in water table and surface subsidence over half the area in Huang-Huai-Hai agricultural region (Zhang et al., 2014; Xu, 2003). Therefore, it becomes a pressing issue for decision makers to create rational policies to ensure grain production without compromising environmental sustainability.
The limitations of MCI trends analysis could come from the cloud cover and low spatial resolution of MODIS data (Jain et al., 2013; Qiu et al., 2017). First, the continuous cloud-free MODIS images for the whole region are unavailable. Qiu et al. (2017) demonstrated the cloud cover ratio of MODIS data showed spatio-temporal variations in Huang-Huai-Hai region from 2001-2013. As the cloud-free images, SAR satellite images are promising choices for higher accuracy of cropping intensity monitoring. Second, some farm plots in the study area are smaller than the size of single MODIS pixel. The heterogeneity of land covers in one pixel will lead to heterogeneous cropping intensity. Therefore, higher spatial resolutions of satellite data are required for more accurate results for smallholder fields. Correspondingly, for our further work, we will combine Landsat TM/ETM+, Landsat 8 OLI and Sentinel-1/2 for improving the cropping intensity monitoring at both spatial and temporal resolutions.

The authors have declared that no competing interests exist.

[1]
Bian X M, Feng J X, 1999. Method of calculating cropping system index of diversified multiple cropping systems.Journal of Nanjing Agricultural University, 22(1): 11-15. (in Chinese)In accordance with the new characteristics of the cropping system in 1990s,the significance of intercropping,relay cropping,multiple cropping and cropping index was analyzed in this paper.The standard of distinguishing intercropping from relay cropping,which includes crop intergrowth period,crop maturing time,crop harvest time and coefficient,was discussed.Finally,some rules and a method of calculating cropping index of diversified multiple cropping systems were proposed.

[2]
Chen M Q, Zhong T Y, Wu Y H, 2014. Effect of agricultural subsidy policy on farmers’ behavior to protect cultivated land.Journal of Agro-Forestry Economics and Management, 13(1): 14-23. (in Chinese)First a theoretical analysis was conducted about farmers' behavior in response to subsidy policies to protect cultivated land,including grain subsidies,good seed subsidies,farm machinery purchase subsidy and the comprehensive agricultural subsidies.Taking the 390 copies of the questionnaire from the special investigation of "Jiangxi Province's agricultural subsidies and changes in agricultural land farming",the effect of agricultural subsidy policies on the behavior of farmers to protect cultivated land was empirically studied.The results show that: the implementation of agricultural subsidy policies has improved the use of agricultural mechanization,low toxicity pesticide and advanced agricultural technology although the effect is different between professional farmers and part-time farmers. Some suggestions to perfect agricultural subsidy policies were put forward including changing the welfare form of agricultural subsidies,improving the policy execution mode and reducing the operation cost,setting up the public participation mechanism and respecting farmers' opinion.

[3]
Chen Y Q, Li X B, Tian Y J et al., 2009. Structural change of agricultural land use intensity and its regional disparity in China.Journal of Geographical Sciences, 19(5): 545-556.Based on the data from the Cost-benefit Data of Farm Produce and the China Agricultural Yearbook, this paper divided the intensity of cultivated land use into labor intensity and capital intensity, and then analyzed their temporal and spatial change at both national and provincial levels between 1980 and 2006. The results showed that: (1) At the national level, labor intensity on food produce decreased from 398.5 day/ha in 1980 to 130.25 day/ha in 2006; and a continuous decrease with a steep decline between 1980 and 1986, a slower decline from 1987 to 1996, and another steep decline from 1997 to 2006. On the contrary, capital intensity shows an increasing trend since 1980. As to the internal composition of capital intensity, the proportion of seed, chemical fertilizer and pesticide input decreased from 90.36% to 73.44% and the proportion of machinery increased from 9.64% to 26.56%. The less emphasis on yield-increasing input and more emphasis on labor-saving input are the main reasons for a slow increase of yield per unit area after 1996. (2) At the provincial level, the developed areas have lower labor intensity and higher capital intensity. The less developed ones have higher labor intensity but lower capital intensity. From the viewpoint of the internal composition of capital intensity, labor-saving input accounts for more proportion in the developed areas than that of other areas. The main reason is that in these developed areas, labor input has become a constraint factor in food production as more and more labors engaged in off-farm work. Farmers increase the labor-saving input for higher labor productivity. However, in the less developed areas, the major constraint is the shortage of capital; food production is still depending on labor and yield-increasing inputs.

DOI

[4]
Cheng J, Wu Z F, Liu P, 2005. Study on the change of agriculture landscape pattern based on GIS: A case study from Mapping Town, Zhangpu County.Chinese Journal of Eco-Agriculture, 13(4): 184-186. (in Chinese)

[5]
Cheng Y Q, 2010. Regional modes and countermeasure on the improvement of medium-low productivity farmland in northeastern China.Journal of Arid Land Resources & Environment, 24(11): 120-124. (in Chinese)It is an effective way for promoting comprehensive grain production capability and guaranteeing national grain security to improvement medium-low yielded farmland.There are 1374.8 105hm2 of medium-low yielded farmland in northeastern China,which take about 2/3 of the whole regional farmland,and it has huge potential by improvement medium-low yielded farmland,and where shall become one of the regions have the biggest potentialof grain increase in China.Different models were planned according to the regional character of black soil region in the Songneng Pain,the Sanjiang Plain,west region of the Songneng Pain and northwest of the Liaohe Plain.Moreover,countermeasures for pushing the improvement of medium-low yielded farmland in northeast China are put forward;the aim is to provide scientifically direction to promote the comprehensive grain production capability of northeast China.

DOI

[6]
De Jong R, de Bruin S, de Wit A et al., 2011. Analysis of monotonic greening and browning trends from global NDVI time-series.Remote Sensing Environment, 115(2): 692-702.78 Phenological variation renders comparisons of NDVI by calendar date unsatisfactory. 78 Seasonal non-parametric model accounts for serial auto-correlation in NDVI data sets. 78 Photosynthetic intensity is helpful to disentangle drivers of greening or browning. 78 Forest biomes show reduced photosynthetic intensity, other biomes show increase. 78 Most-prominent greening (1981–2006) is found in shrub land, savanna and cropland.

DOI

[7]
DeFries R S, Hansen M C, Townshend J R G, 2000. Global continuous fields of vegetation characteristics: A linear mixture model applied to multi-year 8 km AVHRR data.International Journal of Remote Sensing, 21(6/7): 1389-1414.As an alternative to the traditional approach of using predefined classification schemes with discrete numbers of cover types to describe the geographic distribution of vegetation over the Earth''s land surface, we apply a linear mixture model to derive global continuous fields of percentage woody vegetation, herbaceous vegetation and bare ground from 8 km Advanced Very High Resolution Radiometer (AVHRR) Pathfinder Land data. Linear discriminants for input into the mixture model are derived from 30 metrics representing the annual phenological cycle, using training data derived from a global network of scenes acquired by Landsat. We test the stability and robustness of the method by assessing the consistency of results derived independently for each year in the 1982 to 1994 AVHRR data set. For those forested locations where land cover variability would not be expected, the percentage woody estimates displayed standard deviations over the 12 years of less than 10%. Problems with the method occur in high latitudes where snow cover in some years and not others produces inconsistencies in the continuous fields. Overall, the results suggest that the method produces fairly consistent results despite apparent problems with artifacts in the multi-year AVHRR data set due to calibration problems, aerosols and other atmospheric effects, bidirectional effects, changes in equatorial crossing time, and other factors. Comparison of continuous fields with other land cover data sets derived from remote sensing suggests 69% to 84% agreement in the per cent woody field, with the highest agreement when per cent woody is averaged over the 12 years. In comparison with regional data sets for the US and Bolivia, the method overestimates per cent woody vegetation for grassland and sparsely wooded locations. We conclude that the method, with possible refinements and more sophisticated methods to include multiple endmembers, improved estimates of endmember values and nonlinear responses of vegetation to proportional cover, can potentially be used to indicate changes in land cover characteristics over time using multi-year data sets as inputs when perfect calibration and consistency between years cannot be assumed.

DOI

[8]
Ding M J, Chen Q, Xi L et al., 2015. Spatial and temporal variations of multiple cropping index in China based on SPOT-NDVI during 1999-2013.Acta Geographica Sinica, 70(7): 1080-1090. (in Chinese)In this paper, the smooth crops growth NDVI curves from 1999 to 2013 were rebuilt by the S- G techniques, with the combination of 10- day SPOT time- series NDVI data from1998 to 2013 with the spatial resolution of 1 km and land use data in 2000, 2005 and 2010.Spatial and temporal changes of multiple cropping index(MCI) from 1999 to 2013 in China were extracted by a difference algorithm. The results are as follows:(1) The total precision of sample validation based on visual identification was 91.95%, and the slope of linear regression of the MCI between remotely sensed data and statistical data was 0.73(R=0.775, P0.001),suggesting that this method is an effective way to extracting spatial information of the MCI for agricultural and land management.(2) From the north to the south of China, the MCI gradually becomes more and more complex. The percentages of the single, double and triple cropping system occupying the total cropland were 43.48%, 56.39% and 0.13%, respectively in China.(3) From 1999 to 2013, the overall cropping index increased with an annual rate of 1.29%(P0.001) in China, while it exhibited significant differentiation in different zones. The area with a significant decreasing trend occupied 2.12%(P0.1) of the total cropland and was found at the borders of Hebei, Beijing and Tianjin, central Anhui, the Chengdu Plain, the Poyang Lake Plain, northern and southern Hunan, and central Guangxi. The area with a significant increasing trend occupied 16.40%(P0.1) of the total cropland and was distributed in eastern Gansu, the Weihe Plain of Shaanxi, western Shanxi, the borders of Hebei, Shandong and Tianjin, the Shandong Peninsula, and the Jianghan Plain.(4) Terrain and economic development level played an important role in the regional differentiation of MCI change.There is a positive correlation between terrain and the inter- annual changes of MCI, and a negative correlation between economic development level and the inter- annual changes of MCI.

DOI

[9]
Ding M J, Chen Q, Xiao X M et al., 2016. Variation in cropping intensity in northern China from 1982 to 2012 based on GIMMS-NDVI data.Sustainability, 8(11): 1123.

DOI

[10]
Fan J L, 2003. Study on remote sensing methods for monitoring multiple cropping index [D]. Beijing: Chinese Academy of Science. (in Chinese)

[11]
Foley J A, DeFries R, Asner G P et al., 2005. Global consequences of land use.Science, 309(5734): 570-574.

DOI

[12]
Foley J A, Ramankutty N, Brauman K A et al., 2011. Solutions for a cultivated planet.Nature, 478(7369): 337-342.Abstract Increasing population and consumption are placing unprecedented demands on agriculture and natural resources. Today, approximately a billion people are chronically malnourished while our agricultural systems are concurrently degrading land, water, biodiversity and climate on a global scale. To meet the world's future food security and sustainability needs, food production must grow substantially while, at the same time, agriculture's environmental footprint must shrink dramatically. Here we analyse solutions to this dilemma, showing that tremendous progress could be made by halting agricultural expansion, closing 'yield gaps' on underperforming lands, increasing cropping efficiency, shifting diets and reducing waste. Together, these strategies could double food production while greatly reducing the environmental impacts of agriculture.

DOI PMID

[13]
Friedl M A, McIver D K, Hodges J C F et al., 2002. Global land cover mapping from MODIS: Algorithms and early results.Remote Sensing of Environment, 83(1/2): 287-302.Until recently, advanced very high-resolution radiometer (AVHRR) observations were the only viable source of data for global land cover mapping. While many useful insights have been gained from analyses based on AVHRR data, the availability of moderate resolution imaging spectroradiometer (MODIS) data with greatly improved spectral, spatial, geometric, and radiometric attributes provides significant new opportunities and challenges for remote sensing-based land cover mapping research. In this paper, we describe the algorithms and databases being used to produce the MODIS global land cover product. This product provides maps of global land cover at 1-km spatial resolution using several classification systems, principally that of the IGBP. To generate these maps, a supervised classification methodology is used that exploits a global database of training sites interpreted from high-resolution imagery in association with ancillary data. In addition to the IGBP class at each pixel, the MODIS land cover product provides several other parameters including estimates for the classification confidence associated with the IGBP label, a prediction for the most likely alternative class, and class labels for several other classification schemes that are used by the global modeling community. Initial results based on 5 months of MODIS data are encouraging. At global scales, the distribution of vegetation and land cover types is qualitatively realistic. At regional scales, comparisons among heritage AVHRR products, Landsat TM data, and results from MODIS show that the algorithm is performing well. As a longer time series of data is added to the processing stream and the representation of global land cover in the site database is refined, the quality of the MODIS land cover product will improve accordingly.

DOI

[14]
Godfray H C J, Beddington J R, Crute I R et al., 2010. Food security: The challenge of feeding 9 billion people.Science, 327(5967): 812-818.Continuing population and consumption growth will mean that the global demand for food will increase for at least another 40 years. Growing competition for land, water, and energy, in addition to the overexploitation of fisheries, will affect our ability to produce food, as will the urgent requirement to reduce the impact of the food system on the environment. The effects of climate change are a further threat. But the world can produce more food and can ensure that it is used more efficiently and equitably. A multifaceted and linked global strategy is needed to ensure sustainable and equitable food security, different components of which are explored here. 2010 American Association for the Advancement for Science. All Rights Reserved.

DOI PMID

[15]
Gutman G G, 1991. Vegetation indices from AVHRR: An update and future prospects.Remote Sensing of Environment, 35(2/3): 121-136.Procedures that are currently applied to data from Advanced Very High Resolution Radiometer (AVHRR) in deriving vegetation indices are analyzed. It is shown that the type of compositing used has a great impact on the final product. Some misconceptions concerning the global vegetation index (GVI) data set are discussed. Cloud-screened daily data over Kansas prairie during 1 month were used to develop a viewing angle correction for the observed range of sun angles and for that particular surface type. This example indicates that the variability in the calculated vegetation indices could be reduced, thus raising the confidence level in statistical comparisons of observations for different years. The correction developed is applied to a different crop area and improvement in the results is demonstrated. Errors in the calculations are analyzed. Prospects for future improvements in processing vegetation index data are discussed.

DOI

[16]
Huang J K, 2004. Past and future of the agriculture in China.Management World, (3): 95-104. (in Chinese)

[17]
Huang Q, Wang L M, Chen Z X et al., 2016. Effects of meteorological factors on different grades of winter wheat growth in the Huang-Huai-Hai Plain, China.Journal of Integrative Agriculture, 15(11): 2647-2657.The sown area of winter wheat in the Huang-Huai-Hai (HHH) Plain accounts for over 65% of the total sown area of winter wheat in China. Thus, it is important to monitor the winter wheat growth condition and reveal the main factors that influence its dynamics. This study assessed the winter wheat growth condition based on remote sensing data, and investigated the correlations between different grades of winter wheat growth and major meteorological factors corresponding. First, winter wheat growth condition from sowing until maturity stage during 2011鈥2012 were assessed based on moderate-resolution imaging spectroradiometer (MODIS) normalized difference vegetation index (NDVI) time-series dataset. Next, correlation analysis and geographical information system (GIS) spatial analysis methods were used to analyze the lag correlations between different grades of winter wheat growth in each phenophase and the meteorological factors that corresponded to the phenophases. The results showed that the winter wheat growth conditions varied over time and space in the study area. Irrespective of the grades of winter wheat growth, the correlation coefficients between the winter wheat growth condition and the cumulative precipitation were higher than zero lag (synchronous precipitation) and one lag (pre-phenophase precipitation) based on the average values of seven phenophases. This showed that the cumulative precipitation during the entire growing season had a greater effect on winter wheat growth than the synchronous precipitation and the pre-phenophase precipitation. The effects of temperature on winter wheat growth varied according to different grades of winter wheat growth based on the average values of seven phenophases. Winter wheat with a better-than-average growth condition had a stronger correlation with synchronous temperature, winter wheat with a normal growth condition had a stronger correlation with the cumulative temperature, and winter wheat with a worse-than-average growth condition had a stronger correlation with the pre-phenophase temperature. This study may facilitate a better understanding of the quantitative correlations between different grades of crop growth and meteorological factors, and the adjustment of field management measures to ensure a high crop yield.

DOI

[18]
Huete A, Didan K, Miura T et al., 2002. Overview of the radiometric and biophysical performance of the MODIS vegetation indices.Remote Sensing of Environment, 83(1/2): 195-213.We evaluated the initial 12 months of vegetation index product availability from the Moderate Resolution Imaging Spectroradiometer (MODIS) on board the Earth Observing System-Terra platform. Two MODIS vegetation indices (VI), the normalized difference vegetation index (NDVI) and enhanced vegetation index (EVI), are produced at 1-km and 500-m resolutions and 16-day compositing periods. This paper presents an initial analysis of the MODIS NDVI and EVI performance from both radiometric and biophysical perspectives. We utilize a combination of site-intensive and regionally extensive approaches to demonstrate the performance and validity of the two indices. Our results showed a good correspondence between airborne-measured, top-of-canopy reflectances and VI values with those from the MODIS sensor at four intensively measured test sites representing semi-arid grass/shrub, savanna, and tropical forest biomes. Simultaneously derived field biophysical measures also demonstrated the scientific utility of the MODIS VI. Multitemporal profiles of the MODIS VIs over numerous biome types in North and South America well represented their seasonal phenologies. Comparisons of the MODIS-NDVI with the NOAA-14, 1-km AVHRR-NDVI temporal profiles showed that the MODIS-based index performed with higher fidelity. The dynamic range of the MODIS VIs are presented and their sensitivities in discriminating vegetation differences are evaluated in sparse and dense vegetation areas. We found the NDVI to asymptotically saturate in high biomass regions such as in the Amazon while the EVI remained sensitive to canopy variations.

DOI

[19]
Jain M, Mondal P, DeFries R S et al., 2013. Mapping cropping intensity of smallholder farms: A comparison of methods using multiple sensors.Remote Sensing of Environment, 134: 210-223.The food security of smallholder farmers is vulnerable to climate change and climate variability. Cropping intensity, the number of crops planted annually, can be used as a measure of food security for smallholder farmers given that it can greatly affect net production. Current techniques for quantifying cropping intensity may not accurately map smallholder farms where the size of one field is typically smaller than the spatial resolution of readily available satellite data. We evaluated four methods that use multi-scalar datasets and are commonly used in the literature to assess cropping intensity of smallholder farms: 1) the Landsat threshold method, which identifies if a Landsat pixel is cropped or uncropped during each growing season, 2) the MODIS peak method, which determines if there is a phenological peak in the MODIS Enhanced Vegetation Index time series during each growing season, 3) the MODIS temporal mixture analysis, which quantifies the sub-pixel heterogeneity of cropping intensity using phenological MODIS data, and 4) the MODIS hierarchical training method, which quantifies the sub-pixel heterogeneity of cropping intensity using hierarchical training techniques. Each method was assessed using four criteria: 1) data availability, 2) accuracy across different spatial scales (at aggregate scales 250 x 250 m, 1 x 1 km, 5 x 5 km, and 10 x 10 km), 3) ease of implementation, and 4) ability to use the method over large spatial and temporal scales. We applied our methods to two regions in India (Gujarat and southeastern Madhya Pradesh) that represented diversity in crop type, soils, climatology, irrigation access, cropping intensity, and field size. We found that the Landsat threshold method is the most accurate (R-2 >= 0.71 and RMSE = 5 x 5 km (R-2 up to 0.97 and RMSE as low as 0.00). Our model accuracy varied based on the region and season of analysis and was lowest during the summer season in Gujarat when there was high sub-pixel heterogeneity due to sparsely cropped agricultural land-cover. While our results specifically apply to our study regions in India, they most likely also apply to smallholder agriculture in other locations across the globe where the same types of satellite data are readily available. (C) 2013 Elsevier Inc. All rights reserved.

DOI

[20]
Jakubauskas M E, Legates D R, Kastens J H, 2002. Crop identification using harmonic analysis of time-series AVHRR NDVI data. Computers & Electronics in Agriculture, 37(1-3): 127-139.Harmonic analysis of a time series of National Oceanic and Atmospheric Administration (NOAA) advanced very high resolution radiometer normalized difference vegetation index (NDVI) data was used to develop an innovative technique for crop type identification based on temporal changes in NDVI values. Different crops (corn, soybeans, alfalfa) exhibit distinctive seasonal patterns of NDVI variation that have strong periodic characteristics. Harmonic analysis, or Fourier analysis, decomposes a time-dependent periodic phenomenon into a series of constituent sinusoidal functions, or terms, each defined by a unique amplitude and phase value. Amplitude and phase angle images were produced by analysis of the time-series NDVI data and used within a discriminant analysis to develop a methodology for crop type identification. For crops that have a single distinct growing season and period of peak greenness, such as corn, the majority of the variance was captured by the first and additive terms, while winter wheat exhibited a bimodal NDVI periodicity with the majority of the variance accounted for by the second harmonic term.

DOI

[21]
Jin S L, Hou L C, Xu L, 2011. The relationship of multiple cropping index of arable land change and national food security in the middle and lower reaches of Yangtze River.Chinese Agricultural Science Bulletin, 27(17): 208-212. (in Chinese)Food security is the focus in the international community, but focus on the threat of arable land decrease, ignoring the multiple crop index (MCI) change in recent years. The middle and lower reaches of Yangtze River is an important grain production area in China, multiple cropping is an important ways of improving yield over there. That qualitative analysis MCI change for the national grain yield fluctution influence through constructing mathematical model in the middle and lower reaches of Yangtze River, it made a great innovation and breakthrough in theory. Research showed that, the MCI, food and crop planting area drops, grain yields percentage of China, grain sowing area and crops area ratio drops respectively 7.0 and 7.2 percentage points in the middle and lower reaches of Yangtze River during1979-2008, to influence on the national food security. Puts forward improving the level of agricultural mechanization, innovation land system, strengthening grain production of science and technology support system, building and perfecting the grain information early warning system for measures were to solve the problems.

[22]
Kalfas J L, Xiao X M, Vanegas D X et al., 2011. Modeling gross primary production of irrigated and rain-fed maize using MODIS imagery and CO2 flux tower data.Agricultural & Forest Meteorology, 151(12): 1514-1528.Information on gross primary production (GPP) of maize croplands is needed for assessing and monitoring maize crop conditions and the carbon cycle. A number of studies have used the eddy covariance technique to measure net ecosystem exchange (NEE) of CO2 between maize cropland fields and the atmosphere and partitioned NEE data to estimate seasonal dynamics and interannual variation of GPP in maize fields having various crop rotation systems and different water management practices. How to scale up in situ observations from flux tower sites to regional and global scales is a challenging task. In this study, the Vegetation Photosynthesis Model (VPM) and satellite images from the Moderate Resolution Imaging Spectroradiometer (MODIS) are used to estimate seasonal dynamics and interannual variation of GPP during 2001 2005 at five maize cropland sites located in Nebraska and Minnesota of the U.S.A. These sites have different crop rotation systems (continuously maize vs. maize and soybean rotated annually) and different water management practices (irrigation vs. rain-fed). The VPM is based on the concept of light absorption by chlorophyll and is driven by the Enhanced Vegetation Index (EVI) and the Land Surface Water Index (LSWI), photosynthetically active radiation (PAR), and air temperature. The seasonal dynamics of GPP predicted by the VPM agreed well with GPP estimates from eddy covariance flux tower data over the period of 2001鈥2005. These simulation results clearly demonstrate the potential of the VPM to scale-up GPP estimation of maize cropland, which is relevant to food, biofuel, and feedstock production, as well as food and energy security.

DOI

[23]
Li T, Lai H, Zhang S R, 2011. Dynamics analysis of land use and landscape pattern change in Yuechi County.Geospatial Information, 9(4): 111-114. (in Chinese)Based on the software of ERDAS IMAGINE 9.0 and ArcGIS 9.3 and remote sensing data of 1993,2001 and 2007,the landscape changes of Yuechi County was quantitatively analyzed by using supervised classification method and landscape ecology theory.The results showed that the area of arid land,woodland,building land and water body area was increased,and the area of arid land and building land had the biggest amplification in the recent 15 years,increased 110.41 km2 and 47.99 km2,respectively.While the area of arid land and other land use tending to decrease,and the area of arid land had the biggest amplification of 180.03 km2.From 1993 to 2007,the patch density of water body area and other land use decreased,other landscape types increased.Disturbed by human activity,landscape diversity index increased firstly,and then decreased.While the landscape fragmentation index increased.

[24]
Liang S M, 2007. Probing potentials of multiple cropping in the selected provinces in China.Issues in Agricultural Economy, 28(5): 85-90. (in Chinese)The author calculates the historical as well as actual multiple cropping index in China by utilizing spatial analysis function in Geographic Information System (GIS). Potential multiple-cropping indexes are estimated from the view of economic rationalities. Measures in accord with local conditions are advised to explore the potential to practice the multiple-cropping pattern.

DOI

[25]
Liang S Z, Ma W D, Shi P et al., 2012. Monitoring multiple cropping index using MODIS NDVI data. Chinese Journal of Eco-Agriculture, 20(12): 1657-1663. (in Chinese)

[26]
Liu J Y, Kuang W H, Zhang Z X, et al., 2014. Spatiotemporal characteristics, patterns, and causes of land-use changes in China since the late 1980s. Journal of Geographical Sciences, 24(2): 195-210.Land-use/land-cover changes (LUCCs) have links to both human and nature interactions. China's Land-Use/cover Datasets (CLUDs) were updated regularly at 5-year intervals from the late 1980s to 2010,with standard procedures based on Landsat TM\ETM+ images. A land-use dynamic regionalization method was proposed to analyze major land-use conversions. The spatiotemporal characteristics,differences,and causes of land-use changes at a national scale were then examined. The main findings are summarized as follows. Land-use changes (LUCs) across China indicated a significant variation in spatial and temporal characteristics in the last 20 years (1990-2010). The area of cropland change decreased in the south and increased in the north,but the total area remained almost unchanged. The reclaimed cropland was shifted from the northeast to the northwest. The built-up lands expanded rapidly,were mainly distributed in the east,and gradually spread out to central and western China. Woodland decreased first,and then increased,but desert area was the opposite. Grassland continued decreasing. Different spatial patterns of LUC in China were found between the late 20th century and the early 21st century. The original 13 LUC zones were replaced by 15 units with changes of boundaries in some zones. The main spatial characteristics of these changes included (1) an accelerated expansion of built-up land in the Huang-Huai-Hai region,the southeastern coastal areas,the midstream area of the Yangtze River,and the Sichuan Basin;(2) shifted land reclamation in the north from northeast China and eastern Inner Mongolia to the oasis agricultural areas in northwest China;(3) continuous transformation from rain-fed farmlands in northeast China to paddy fields;and (4) effectiveness of the "Grain for Green" project in the southern agricultural-pastoral ecotones of Inner Mongolia,the Loess Plateau,and southwestern mountainous areas. In the last two decades,although climate change in the north affected the change in cropland,policy regulation and economic driving forces were still the primary causes of LUC across China. During the first decade of the 21st century,the anthropogenic factors that drove variations in land-use patterns have shifted the emphasis from one-way land development to both development and conservation.The "dynamic regionalization method" was used to analyze changes in the spatial patterns of zoning boundaries,the internal characteristics of zones,and the growth and decrease of units. The results revealed "the pattern of the change process," namely the process of LUC and regional differences in characteristics at different stages. The growth and decrease of zones during this dynamic LUC zoning,variations in unit boundaries,and the characteristics of change intensities between the former and latter decades were examined. The patterns of alternative transformation between the "pattern" and "process" of land use and the causes for changes in different types and different regions of land use were explored.

DOI

[27]
Liu J Y, Zhuang D F, Luo D et al., 2003. Land-cover classification of China: Integrated analysis of AVHRR imagery and geophysical data.International Journal of Remote Sensing, 24(12): 2485-2500.Over last two decades, numerous studies have used remotely sensed data from the Advanced Very High Resolution Radiometer (AVHRR) sensors to map land use and land cover at large spatial scales, but achieved only limited success. In this paper, we employed an approach that combines both AVHRR images and geophysical datasets (e.g. climate, elevation). Three geophysical datasets are used in this study: annual mean temperature, annual precipitation, and elevation. We first divide China into nine bio-climatic regions, using the long-term mean climate data. For each of nine regions, the three geophysical data layers are stacked together with AVHRR data and AVHRR-derived vegetation index (Normalized Difference Vegetation Index) data, and the resultant multi-source datasets were then analysed to generate land-cover maps for individual regions, using supervised classification algorithms. The nine land-cover maps for individual regions were assembled together for China. The existing land-cover dataset derived from Landsat Thematic Mapper (TM) images was used to assess the accuracy of the classification that is based on AVHRR and geophysical data. Accuracy of individual regions varies from 73% to 89%, with an overall accuracy of 81% for China. The results showed that the methodology used in this study is, in general, feasible for large-scale land-cover mapping in China.

DOI

[28]
Liu X H, 1993. Chinese Cropping System. Beijing: Agriculture Press. (in Chinese)

[29]
Liu X H, Yang Q K, Tang G A, 2001. Extraction and application of relief of China based on DEM and GIS method.Bulletin of Soil & Water Conservation, 21(1): 57-60. (in Chinese)Based on micro scale DEM datum, optimum size of analysis windows of relief, which is 5 km脳5 km, is defined by means of windows analysis and sample statistical method. Relief in soil erosion of China has been extracted using ARC/INFO software and mapped using Arcview. Applicability of relief was analyzed and initially application of relief factor in assessment of Chinese potential soil and water loss is studied.

[30]
Liu Y, Liu Y S, Guo L Y, 2011. Evolvement of spatial pattern of per capita grain possession at county level in the area along Bohai Rim of China.Scientia Geographica Sinica, 31(1): 102-109. (in Chinese)The area along Bohai Rim,including Beijing,Tianjin,Liaoning,Hebei and Shandong,is one of the important grain production bases that guarantee food security in China.With the acceleration of area urbanization in the past 20 years,the grain production and consumption patterns along Bohai Rim have brought about significant changes.Agricultural statistics of the area along Bohai Rim at county-resolution level for the time period of 1990-2008 is collected and the GIS technique as well as other tools such as the Moran I and the Getis-Ord are introduced to describe the spatial changes of per capita grain possession at county level in this area.The conclusions are as the follows.First,per capita grain possession at county level in the area along Bohai Rim shows a significantly trend of positive spatial correlation and similar areas cluster in space.LISA cluster map demonstrates that counties with higher per capita grain possession gathered in Liaohe plain,the Yellow River floodplain in western Shandong Province and alluvial plain of Haihe river,while the lower per capita grain possession gathered in mountainous-hilly areas,tableland areas and densely populated city area.Second,the spatial framework of per capita grain possession growth is likely to be more stochastic and unstable in the aspect of spatial distribution.Hotspot areas are changing frequently without obvious appearance of geographical concentration.Third,Per capita grain possession in most of the counties shows an upward trend,and lower production but faster growth is the main type.The grain production function has been improved significantly in plains and has been weakened as the implementation of Conversion of Cropland to Forest and Grassland Project in mountainous-hilly areas,and it has been shown a strong downward trend in cities and their surrounding counties as the sharp reduction of cultivated land and the swift growth of regional population.At last,the contributing factors for the variation of per capita grain possession are studied using Spatial Lag Model and Spatial Error Model.The empirical results show that the spatial structure of per capita grain possession is affected positively by the per capita grain possession in 1990,per capita cultivated land,multiple cropping indexes,cropping structure and input of agricultural machine power,while affected negatively by the quantity of agriculture labors and per capita GDP in 2007.The driving force of the evolvement of per capita grain possession framework can be identified through the following aspects: the basis of historical development,the policies on regional development and economic factors.Effective regulation and favorable policies can promote per capita grain possession and guarantee regional grain safety.

[31]
Liu Y Q, Long H L, 2016. Land use transitions and their dynamics mechanism: The case of the Huang-Huai-Hai Plain.Journal of Geographical Sciences, 26(5): 515-530.Land use transition refers to changes in land use morphology, including dominant morphology and recessive morphology, of a particular region over a period of time driven by various factors. Recently, issues related to land use transition in China have attracted interest among a wide variety of researchers as well as government officials. This paper examines the patterns of land use transition and their dynamic mechanism in the Huang-Huai-Hai Plain during 2000 2010. First, the spatio-temporal patterns of land use transition, their characteristics and the laws governing them were analyzed. Second, based on the established conceptual framework for analyzing the dynamic mechanism of land use transition, a spatial econometric regression analysis method was used to analyze the dynamic mechanism of the five types of major land use transition in the Huang-Huai-Hai Plain at the county level. Land use pattern changes in the study area were characterized by an increase in construction land, water body and forested land, along with a decrease in farmland, unused land and grassland. The changes during 2000 2005 were much more significant than those during 2005 2010. In terms of factors affecting land use transitions, natural factors form the basis, and they have long-term effects. Socio-economic factors such as population and GDP, however, tend to determine the direction, structure, size and layout of land use transition over shorter time periods. Land law and policy factors play a mandatory guiding and restraining role in land use transitions, so as to improve the overall efficiency of land use. Land resource engineering is also an important tool to control land use transitions. In general, the five types of major land use transition were the result of the combined action of various physical, social and economic factors, of which traffic condition and location condition had the most significant effects, i.e. they were the common factors in all land use transitions. Understanding the spatio-temporal process of land use transitions and their dynamic mechanisms is an important foundation for utilizing land resources, protecting regional ecological environment and promoting sustainable regional socio-economic development.

DOI

[32]
Peng D L, Huang J F, Jin H M, 2006. The monitoring for sequential cropping index of arable land in Zhejiang Province using MODIS-NDVI.Scientia Agricultura Sinica, 39(7): 1352-1357. (in Chinese)Objective】 The sequential cropping index of arable land is an important agricultural information, the objective of this paper is that monitor and analyze this parameter, and supply a reference for guiding agricultural production.【Method】Based on the MODIS (moderate resolution imagine spectroradimeter) vegetation data from NASA(National Aeronautic and Space Administration) in America and the actual land use map with a scale of 1﹕2 500 000, using two times differencing, this paper monitors the cropping index of arable land in Zhejiang Province from 2001 to 2004. 【Result】 Within one year, there are principles of the interaction between the time series of NDVI (normalized difference vegetation index) profile and the growing process of crops, this process can be described as planting, seeding, heading, ripe, harvest and so on, and the peak of the time series of NDVI profile indicates that the colony ground biomass reaches the tiptop, so sequential cropping index can deem that equal to the number of peaks of time series of NDVI profile. Based on this principle, the sequential cropping index of all cities in Zhejiang Province was worked out.【Conclusion】It was found that the sequential cropping index in southwest is bigger than northeast in Zhejiang Province in the space. In the time, the sequential cropping index shows the depressed levels from 2001 to 2003 and the value increaseed to some extent in 2004, but the value was low, so there are much potential for the sequential cropping index of arable land in Zhejiang Province in consideration of the geography and the climate in Zhejiang Province.

[33]
Qiu B W, Lu D F, Tang Z H et al., 2017. Mapping cropping intensity trends in China during 1982-2013.Applied Geography, 79: 212-222.Long range continuous monitoring information of cropping intensity is useful for sustainable agricultural management but still limited. This study filled this information gap through delivering spatiotemporal continuous datasets of cropping intensity in China during the past 30 years. Cropping intensity data were derived by a wavelet features-based method based on the long-term weekly global EVI2 (Enhance Vegetation Index with two bands) at 0.05 spatial resolution (5km) from 1982 to 1999 and 8-day composite 500m Moderate Resolution Imaging Spectroradiometer (MODIS) surface reflectance products from 2001 to 2013. The remote-sensing estimated images in 2013 agreed well with field survey data (overall accuracy=91.63%) and the national agricultural census data (r 2 =0.89). Results revealed that the cropping intensity remarkably increased during 1982 1999 but slightly declined during 2001 2013. The overall cropping intensity increased from 1.34 in the 1980s to 1.41 in the 1990s, and then dropped to an average of 1.36 after 2000. From 1982 to 1999, approximately 93,225km 2 single-cropped areas changed to double-cropping, primarily those located in the North China plain. However, 39,883km 2 double-cropped areas were turned back into single-cropping areas from 2001 to 2013, principally located in the North China plain, the Middle-lower Yangtze River plain, and the hill regions of the southern Yangtze River. This reverse trend of cropping intensity was due to combined effects from the corresponding reverse variations in agricultural population, increasing agricultural mechanical power, positive agricultural policy. The agricultural duty free policy has only immediate effects on stabilizing cropping intensity in croplands with more favorable biophysical conditions.

DOI

[34]
Qiu J J, Tang H J, Frolking S et al., 2003. Mapping single-, double-, and triple-crop agriculture in China at 0.5°×0.5° by combining county-scale census data with a remote sensing-derived land cover map.Geocarto International, 18(2): 3-13.

[35]
Robertson G P, Swinton S M, 2005. Reconciling agricultural productivity and environmental integrity: A grand challenge for agriculture.Frontiers in Ecology & the Environment, 3(1): 38-46.

[36]
Rudel T K, 2009. Tree farms: Driving forces and regional patterns in the global expansion of forest plantations.Land Use Policy, 26(3): 545-550.People have planted trees in rural places with increasing frequency during the past two decades, but the circumstances in which they plant and the social forces inducing them to plant remain unclear. While forests that produce wood for industrial uses comprise an increasing number of the plantations, most of the growth has occurred in Asia where plantations that produce wood for local consumption remain important. Explanations for these trends take economic, political, and human ecological forms. Growth in urban and global markets for forest products, coupled with rural to urban migration, may spur the conversion of fields into tree farms. Government programs also stimulate tree planting. These programs occur frequently in nations with high population densities. Quantitative, cross-national analyses suggest that these forces combine in regionally distinctive ways to promote the expansion of forest plantations. In Africa and Asia plantations have expanded most rapidly in nations with densely populated rural districts, rural to urban migration, and government policies that promote tree planting. In the Americas and Oceania plantations have expanded rapidly in countries with relatively stable rural populations, low densities, and extensive tracts of land in pasture. If, as anticipated, the growing concern with global warming spurs further expansion in forest plantations in an effort to sequester carbon, questions about their social and ecological effects should become more pressing.

DOI

[37]
Sakamoto T, Van Nguyen N, Kotera A et al., 2007. Detecting temporal changes in the extent of annual flooding within the Cambodia and the Vietnamese Mekong Delta from MODIS time-series imagery.Remote Sensing of Environment, 109(3): 295-313.This paper presents the methodology used to detect temporal changes in the extent of annual flooding within the Cambodia and the Vietnamese Mekong Delta (VMD) based on MODIS time-series imagery (Wavelet-based Filter for detecting spatio-temporal changes in Flood Inundation; WFFI). This methodology involves the use of a wavelet-based filter to interpolate missing information and reduce the noise component in the time-series data, as proposed in a previous study. The smoothed time profiles of Enhanced Vegetation Index (EVI), Land Surface Water Index (LSWI), and the Difference Value between EVI and LSWI (DVEL) are obtained from MOD09 8-day composite time-series data (resolution: 500 m; time period: 2000 2005). The proposed algorithm was applied to produce time-series inundation maps (WFFI products) for the five annual flood seasons over the period from 2000 to 2004. The WFFI products were validated via comparisons with Landsat-derived results and inundation maps based on RADARSAT images, hydrological data, and digital elevation model data. Compared with the RADARSAT-derived inundation maps at the province level, the obtained RMSE range from 364 to 443 km 2 and the determination coefficients [ R 2] range from 0.89 to 0.92. Compared with Landsat-derived results at the 10-km grid level, the obtained RMSE range from 6.8 to 15.2 km 2 and the determination coefficients [ R 2] range from 0.77 to 0.97. The inundated area of flooded forests/marsh to the northeast of Tonle Sap Lake were underestimated, probably because of extensive vegetation cover in this area. The spatial characteristics of the estimated start dates, end dates, and duration of inundation cycles were also determined for the period from 2000 to 2004. There are clear contrasts in the distribution of the estimated end dates and duration of inundation cycles between large-scale floods (2000 2002) and medium- and small-scale floods (2003 and 2004). At the regional scale, the estimated start dates for the southern part of An Giang Province during 2003 and 2004 was distinctly later than that for surrounding areas. The results indicate that these triple-cropping areas enclosed by dikes increased in extent from 2003 to 2004. In contrast, the estimated end dates of inundation at the Co Do and Song Hau State Farms were clearly earlier than those for surrounding areas, although the estimated start dates were similar. Temporal changes in the inundation area of Flood pixels in the Dong Thap and Long An Provinces are in excellent agreement with daily water-level data recorded at Tan Chau Station. The estimated area of Long-term water body increased in size from 2000 to 2004, especially in coastal areas of the Ca Mau and Bac Lieu Provinces. Statistical data for Vietnam indicate that this trend may reflect the expansion of shrimp-farming areas. The WFFI products enable an understanding of seasonal and annual changes in the water distribution and environment of the Cambodia and the VMD from a global viewpoint.

DOI

[38]
Seufert V, Ramankutty N, Foley J A, 2012. Comparing the yields of organic and conventional agriculture.Nature, 485(7397): 229-232.Numerous reports have emphasized the need for major changes in the global food system: agriculture must meet the twin challenge of feeding a growing population, with rising demand for meat and high-calorie diets, while simultaneously minimizing its global environmental impacts. Organic farming--a system aimed at producing food with minimal harm to ecosystems, animals or humans--is often proposed as a solution. However, critics argue that organic agriculture may have lower yields and would therefore need more land to produce the same amount of food as conventional farms, resulting in more widespread deforestation and biodiversity loss, and thus undermining the environmental benefits of organic practices. Here we use a comprehensive meta-analysis to examine the relative yield performance of organic and conventional farming systems globally. Our analysis of available data shows that, overall, organic yields are typically lower than conventional yields. But these yield differences are highly contextual, depending on system and site characteristics, and range from 5% lower organic yields (rain-fed legumes and perennials on weak-acidic to weak-alkaline soils), 13% lower yields (when best organic practices are used), to 34% lower yields (when the conventional and organic systems are most comparable). Under certain conditions--that is, with good management practices, particular crop types and growing conditions--organic systems can thus nearly match conventional yields, whereas under others it at present cannot. To establish organic agriculture as an important tool in sustainable food production, the factors limiting organic yields need to be more fully understood, alongside assessments of the many social, environmental and economic benefits of organic farming systems.

DOI PMID

[39]
Shi Q H, Wang H, Chen F et al., 2010. The spatial-temporal distribution characteristics and yield potential of medium-low yielded farmland in China. Chinese Agricultural Science Bulletin, 26(19): 369-373. (in Chinese)Improving medium-low yielded farmland is one of the most important ways to realize total arable land equilibrium and protect food security of China. In this study, we use the national agricultural sub-county data and the second national soil survey data to investigate the type, spatial-temporal distribution characteristics and yield potential of medium-low yielded farmland in China. The results showed that the farmland quality had increased gradually from 1985 to 2008. Low-yield farmland ' proportion had decreased form 50.01% to 28.61%; the proportion of medium-yield farmland ' s had increased from 24.86% to 37.91%; high-yield farmland ' proportion had increased from 25.13% to 33.48% . The main distribution areas of medium-low yielded farmland are northeast China, north China and the lower-middle reaches of Yangtze River. The main types were barren land, arid land, sloping land, water logging paddy land, water logging dry land, saline-alkali land, aeolian sandy land and so on. We also calculated the production potential and proposed the technical countermeasures, future research direction and policy recommendations to improve the medium-low yielded farmland.

[40]
Song X Q, Ouyang Z, 2012. Key influencing factors of food security guarantee in China during 1999-2007.Acta Geographica Sinica, 67(6): 793-803. (in Chinese)

[41]
Tan S, Heerink N, Qu F, 2006. Land fragmentation and its driving forces in China. Land Use Policy, 23(3): 272-285.Fragmentation of landholdings is commonly regarded as a major obstacle to agricultural production growth in China. This study analyses the factors contributing to land fragmentation, and uses household- and village-level data from 11 villages in Jiangxi Province to test these factors empirically. Our analysis shows that land fragmentation in China is caused to a large extent by the egalitarian principles used in distributing and reallocating land use rights to households. Land within each village is classified into different classes, with each household receiving land from each class. Moreover, land is basically assigned on the basis of household size, with large households receiving substantially more (and slightly bigger) plots than small households. We further find that incomes from off-farm employment and land rental markets are associated with lower land fragmentation. Limited market access does not induce land fragmentation. Instead, we find that landholdings in suburban areas are more fragmented, probably because farmers cultivate a wider range of (high value-added) crops in these areas. We conclude that, although land fragmentation has slightly declined during the 1990s, it is likely to remain high in China if the current principles underlying land distribution within villages are maintained. Three policy options for reducing land fragmentation are suggested.

DOI

[42]
Tao F L, Xiao D P, Zhang S et al., 2017. Wheat yield benefited from increases in minimum temperature in the Huang-Huai-Hai Plain of China in the past three decades.Agricultural and Forest Meteorology, 239(28): 1-14.Our understanding of climate impacts and adaptations on crop growth and productivity can be accelerated by analyzing historical data over the past few decades. We used crop trial and climate data from 1981 to 2009 at 34 national agro-meteorological stations in the Huang-Huai-Hai Plain (HHHP) of China to investigate the impacts of climate factors during different growth stages on the growth and yields of winter wheat, accounting for the adaptations such as shifts in sowing dates, cultivars, and agronomic management. Maximum ( T max ) and minimum temperature ( T min ) during the growth period of winter wheat increased significantly, by 0.4 and 0.602°C/decade, respectively, from 1981 to 2009, while solar radiation decreased significantly by 0.202MJ/m 2 /day and precipitation did not change significantly. The trends in climate shifted wheat phenology significantly at 21 stations and affected wheat yields significantly at five stations. The impacts of T max and T min differed in different growth stages of winter wheat. Across the stations, during 1981–2009, wheat yields increased on average by 14.5% with increasing trends in T min over the whole growth period, which reduced frost damage, however, decreased by 3.0% with the decreasing trends in solar radiation. Trends in T max and precipitation had comparatively smaller impacts on wheat yields. From 1981 to 2009, climate trends were associated with a02≤0230% (or ≤1.0% per year) wheat yield increase at 23 stations in eastern and southern parts of HHHP; however with a02≤0230% (or ≤1.0% per year) reduction at 11 other stations, mainly in western part of HHHP. We also found that wheat reproductive growth duration increased due to shifts in cultivars and flowering date, and the duration was significantly and positively correlated with wheat yield. This study highlights the different impacts of T max and T min in different growth stages of winter wheat, as well as the importance of management (e.g. shift of sowing date) and cultivars shift in adapting to climate change in the major wheat production region.

DOI

[43]
Tilman D, Balzer C, Hill J et al., 2011. Global food demand and the sustainable intensification of agriculture.Proceedings of the National Academy of Sciences of the United States of America, 108(50): 20260-20264.Global food demand is increasing rapidly, as are the environmental impacts of agricultural expansion. Here, we project global demand for crop production in 2050 and evaluate the environmental impacts of alternative ways that this demand might be met. We find that per capita demand for crops, when measured as caloric or protein content of all crops combined, has been a similarly increasing function of per capita real income since 1960. This relationship forecasts a 100—110% increase in global crop demand from 2005 to 2050. Quantitative assessments show that the environmental impacts of meeting this demand depend on how global agriculture expands. If current trends of greater agricultural intensification in richer nations and greater land clearing (extensification) in poorer nations were to continue, 651 billion ha of land would be cleared globally by 2050, with CO2-C equivalent greenhouse gas emissions reaching 653 Gt y-1 and N use 65250 Mt y-1 by then. In contrast, if 2050 crop demand was met by moderate intensification focused on existing croplands of underyielding nations, adaptation and transfer of high-yielding technologies to these croplands, and global technological improvements, our analyses forecast land clearing of only 650.2 billion ha, greenhouse gas emissions of 651 Gt y-1, and global N use of 65225 Mt y-1. Efficient management practices could substantially lower nitrogen use. Attainment of high yields on existing croplands of underyielding nations is of great importance if global crop demand is to be met with minimal environmental impacts.

DOI PMID

[44]
Wang L H, Huang J L, Sun J Y, 2010. Monitoring for multiple cropping index of cultivated land in central China using time series of MODIS-EVI.Resources & Environment in the Yangtze Basin, 19(5): 529-534. (in Chinese)Multiple Cropping Index is a very important indicator in agricultural statistic in China,which represents the degree of utilizing agriculture resources at time scale and the situation of arable land effective using.The time series of EVI contain the rhythm of vegetation growth and wilting,and can accurately reflect the biophysical processes of planting,seedling,elongating,heading and harvesting of agricultural crops.The objective of this paper is monitoring Multiple Cropping Index of Central China according to the period of time series of MODIS-EVI after Savitzky-Golay filter processing from 2005 to 2008.The results revealed that this method could provide an effective way to monitor Multiple Cropping Index.Results are accurate and stable.The slope of linear regression of the Multiple Cropping Index between remote sensing data and statistical data was 1.109 7(R2=0.759,P0.000 1).The total precision of sample validation based on visual identification was 92.4% and precision of sampling areas based on visual identification was 97.91%,suggesting that according to the period of time series of MODIS-EVI it could provide an effective way to extracting spatial information of the Multiple Cropping Index for management department of agriculture.

DOI

[45]
Wang X L, Bu R C, Hu Y M et al., 1996. Analysis on landscape fragment of Liaohe delta wetlands.Chinese Journal of Applied Ecology, 7(3): 299-304. (in Chinese)In this essay we studied the landscape patterns and its heterogeneity of the LiaoheDelta with the help of Remote sensing and GIS. The result showed that the study area wascomposed of large patches mainly distributed in clusters. The main components of the land-scape are paddy field, weed field and beach, and the paddy field is the most important oneThe contagion indices of artificial wetland, natural wetland and semi-natural wetland were0. 924, 0. 897 and 0. 870, respectively. There were 1213 patches in the studied region, andthe largest one was 1401. 38 km2, which was 3600 times of the smallest one (0. 394 km2).This showed that the difference of patch areas was very large. The shapes of patches were reg-ular in the area, and the difference of patches in the same type was very small. A concentratedcorridor system was another characteristic of the area. With the increasing disturbances, thelandscape diversity decreased and the domnaced increased.

DOI

[46]
Wu K, Huang R J, 2001. The sustainable evaluations, the development potentialities and the countermeasures of water and land resources use in the Huang-Huai-Hai Plain.Scientia Agricultura Sinica, 21(5): 390-395. (in Chinese)The Huang-Huai-Hai Plain is a serious water-lacking area in China, especially the low plain in the Haihe River, in which water resources per hectare in the cultivated land are 25 per cent of the average of the country, the existing water-lacking rate is 19.3 per cent, and the sustainable comprehensive evaluating index of water resources belongs to a medium level on the low side. The sustainable evaluating index of land resources for the planting in the area belongs to a critical sustainable condition, in which the evaluating index was lowest in the plain in front of a mountain and it is possible that the land is further transformed from the cultivated land into the non-agricultural one. The amount of water supply in the area in 2010 will be increased by the factor of 22.4 per cent of that in 2000 and the cultivated land area will be maintained by the level in 1998. The water and land resources matches have the obvious region dif ferences in the area: small development potentialities for water resources and the land use restricted by water-lacking in the plain in front of a mountain and the low plain in the Haihe River, in which the utilization rate of water resources was more than 86 per cent and the amount of utilizable water resources per hectare was less than 2500 m 3/ha; the bigger development potentialities for water and land resources in the Huang-Huai Plain and the low plain nearby a sea, in which the utilization rate of water resources was less than 50 per cent and the amount of utilizable water resources per hectare was 3330 and 7020 m 3/ha respectively. Some countermeasures of water-land resources use should be used in the area, in which opening the new water resources for the irrigation (the predicted water-transferring amount from outside basins and the reuse of treated sewage water and application of slight saline water will make up 20.2 per cent and 4.9 per cent of the water supply in 2010 respectively), developing the new techniques of the water-saving irrigation, transforming the cultivated land with the middle-low yield, by which the yield-increasing amount of grain was 1950 kg/ha, and constructing the cultivated land with the high yield and implementing the key region development distributions including stabilizing the grain production in the north part, raising that in the middle part and developing that in the south part of the area, for the sustainable development of the agriculture and the countryside.

[47]
Xiao X, Boles S, Frolking S et al., 2002a. Landscape-scale characterization of cropland in China using vegetation and Landsat TM images.International Journal of Remote Sensing, 23(18): 3579-3594.In this landscape-scale study we explored the potential for multitemporal 10-day composite data from the Vegetation sensor to characterize land cover types, in combination with Landsat TM image and agricultural census data. The study area (175 km by 165 km) is located in eastern Jiangsu Province, China. The Normalized Difference Vegetation Index (NDVI ) and the Normalized Difference Water Index (NDWI ) were calculated for seven 10-day composite (VGT-S10) data from 11 March to 20 May 1999. Multi-temporal NDVI and NDWI were visually examined and used for unsupervised classification. The resultant VGT classification map at 1 km resolution was compared to the TM classification map derived from unsupervised classification of a Landsat 5 TM image acquired on 26 April 1996 at 30 m resolution to quantify percent fraction of cropland within a 1 km VGT pixel; resulting in a mean of 60% for pixels classified as cropland, and 47% for pixels classified as cropland/natural vegetation mosaic. The estimates of cropland area from VGT data and TM image were also aggregated to county-level, using an administrative county map, and then compared to the 1995 county-level agricultural census data. This landscape-scale analysis incorporated image classification (e.g. coarse-resolution VGT data, fineresolution TM data), statistical census data (e.g. county-level agricultural census data) and a geographical information system (e.g. an administrative county map), and demonstrated the potential of multi-temporal VGT data for mapping of croplands across various spatial scales from landscape to region. This analysis also illustrated some of the limitations of per-pixel classification at the 1 km resolution for a heterogeneous landscape.

DOI

[48]
Xiao X, Boles S, Frolking S et al., 2002b. Observation of flooding and rice transplanting of paddy rice fields at the site to landscape scales in China using VEGETATION sensor data. International Journal of Remote Sensing, 23(15): 3009-3022.A unique physical feature of paddy rice fields is that rice is grown on flooded soil. During the period of flooding and rice transplanting, there is a large proportion of surface water in a land surface consisting of water, vegetation and soils. The VEGETATION (VGT) sensor has four spectral bands that are equivalent to spectral bands of Landsat TM, and its mid-infrared spectral band is very sensitive to soil moisture and plant canopy water content. In this study we evaluated a VGT-derived normalized difference water index (NDWI VGT =(B3-MIR)/ (B3+MIR)) for describing temporal and spatial dynamics of surface moisture. Twenty-seven 10-day composites (VGT- S10) from 1 March to 30 November 1999 were acquired and analysed for a study area (175 km by 165 km) in eastern Jiangsu Province, China, where a winter wheat and paddy rice double cropping system dominates the landscape. We compared the temporal dynamics and spatial patterns of normalized difference vegetation index (NDVI VGT ) and NDWI VGT . The NDWI VGT temporal dynamics were sensitive enough to capture the substantial increases of surface water due to flooding and rice transplanting at paddy rice fields. A land use thematic map for the timing and location of flooding and rice transplanting was generated for the study area. Our results indicate that NDWI and NDVI temporal anomalies may provide a simple and effective tool for detection of flooding and rice transplanting across the landscape.

DOI

[49]
Xie H L, Liu G Y, 2015. Spatiotemporal differences and influencing factors of multiple cropping index in China during 1998-2012.Journal of Geographical Sciences, 25(11): 1283-1297.Raising the level of the multiple cropping index (MCI) plays a critical role in food production of China. Therefore, exploring the spatiotemporal differences and factors of the MCI in China is of important practical significance. This paper examines the trend of multiple cropping index (MCI) changes in China at the national, regional and provincial levels during 1998–2012. Based on the Theil index, this paper explores the spatiotemporal differences of the MCI in China. Additionally, a spatial econometric model is used to identify the determinants of the spatiotemporal differences of the MCI from a behavioral perspective. The results are summarized as follows: (1) From the national perspective, the MCI shows an increasing trend year by year, rising from 120.1% in 1998 to 134.26% in 2012; (2) at the regional level, the northeastern region is the fastest growing area in terms of MCI, whereas the central region is the slowest growing area. The central region has the highest MCI level, whereas the northeastern region is connected to the lowest MCI level; (3) according to the Theil index value, the differences in the MCI show a narrowing trend from 0.11 in 1998 to 0.03 in 2012, which is primarily attributed to the differences among the four regions; (4) the MCI shows differences among China’s 31 provinces, and the gap that it shows is great; and (5) the proportion of non-agricultural population has a significant negative effect on the MCI. However, the proportions of non-agricultural industry, agricultural policy, per capita operating arable land area and rural household per capita net income have a significant positive impact on the MCI. Therefore, the following policies are suggested to increase the level of China’s cultivated land MCI: transferring rural surplus labor, increasing the farmers’ income, accelerating the transfer of the use rights of arable land, developing the scale effect of land use, providing further support and benefits to farmers in less developed regions and major grain-producing areas, and strengthening the role of the national agricultural policy.

DOI

[50]
Xu X B, Yang G S, 2013. Spatial and temporal changes of multiple cropping index in 1995-2010 in Taihu Lake basin, China.Transactions of the Chinese Society of Agricultural Engineering, 29(3): 148-155. (in Chinese)The smooth crops growth NDVI curves from 1995-2010 were rebuilt by the HANTS method of Fourier transform techniques,with the combination of 1 km 10 d NOAA-AVHRR time-series NDVI data in 1995 with the resolution of 1 km,16 d MODIS time-series NDVI data from 2000 to 2010 with the resolution of 250 m,and land use data in 1995,2000,2005 and 2010.Spatial and temporal changes of multiple cropping index in 1995-2010 in Taihu Lake basin were extracted by a difference algorithm,and its pattern was analyzed.The results showed that spatial and temporal pattern of multiple cropping index from 1995 to 2010 in Taihu Lake basin was dominated with the double cropping system,while the proportion for the single cropping system was at the increasing trend.Local changes for multiple cropping index with decreasing or increasing trend mainly concentrated in Shanghai Municipality and Zhejiang province.Spatial pattern of multiple cropping index in Taihu Lake basin presented downward trend from north to south,and average multiple cropping index was generally at the obviously decreasing trend,decreasing from 189.4% in 1995 to 167.3% in 2010.The decreasing extent of multiple cropping index from 1995 to 2010 at the county-level for Zhejiang province and Shanghai Municipality was larger than that in Jiangsu province.The combination of the HANTS method and long time-series NDVI remote sensing data to extract multiple cropping index in Taihu Lake basin has high accuracy with 94.6% at the grid scale.Due to the differences in calculation categories and spatial resolution of remote sensing data,the error between the multiple cropping index extracted by the remote sensing method and the statistics at the county-level ranged from 15.8% to 21.6%.The results can provide a scientific basis for policy-making and management of agriculture in Taihu Lake basin.

DOI

[51]
Xu Y Q, 2003. Evaluation of groundwater level drawdown driving forces in the Hebei Plain to the south of Beijing and Tianjin.Progress in Geography, 22(5): 490-498. (in Chinese)From the 1970s, under the impact of natural and human factors, the groundwater table in the Hebei Plain has been declining,causing a range of geological and environmental disasters. These disasters include subsidence, seawater intrusion, salinization, desertification and so on, which have seriously threatened the ecological environment and become the key factors of restricting the socio-economic sustainable development of the Hebei Plain. This paper analyzed the causes of groundwater withdrawal from such natural factors as precipitation, surface water and temperature, and from such human aspects as over-exploitation of groundwater, building of water conservancy, improvement of crop production and enlargement of water-consuming crops. The contribution of driving forces to groundwater table drawdown was assessed through building Projection Pursuit Regression model. The result indicates that the exploitation of groundwater is the first factor, which accounts for 54.7% of groundwater withdrawal. According to the proportion of groundwater consumed by industry, agriculture and domestic, the percent of groundwater table drawdown caused by the three sectors were 6.6%, 43.7% and 4.4% respectively. The second is precipitation, with 25.6%, and the third is surface water, with 19.7%. This paper provides scientific basis for groundwater sustainable use.

DOI

[52]
Yan H M, 2007. Spatial pattern and regional characteristic of cropping system in China based on time-series satellite data [D]. Beijing: Chinese Academy of Sciences. (in Chinese)

[53]
Yan H M, Cao M K, Liu J Y et al., 2005b. Characterizing spatial patterns of multiple cropping system in China from multi-temporal remote sensing images.Transactions of the Chinese Society of Agricultural Engineering, 21(4): 85-90.

[54]
Yan H M, Ji Y Z, Liu J Y et al., 2016. Potential promoted productivity and spatial patterns of medium- and low-yield cropland land in China.Journal of Geographical Sciences, 26(3): 259-271.With a continuously increasing population and better food consumption levels, improving the efficiency of arable land use and increasing its productivity have become fundamental strategies to meet the growing food security needs in China. A spatial distribution map of medium- and low-yield cropland is necessary to implement plans for cropland improvement. In this study, we developed a new method to identify high-, medium-, and low-yield cropland from Moderate Resolution Imaging Spectroradiometer (MODIS) data at a spatial resolution of 500 m. The method could be used to reflect the regional heterogeneity of cropland productivity because the classification standard was based on the regionalization of cropping systems in China. The results showed that the proportion of high-, medium-, and low-yield cropland in China was 21%, 39%, and 40%, respectively. About 75% of the low-yield cropland was located in hilly and mountainous areas, and about 53% of the high-yield cropland was located in plain areas. The five provinces with the largest area of high-yield cropland were all located in the Huang-Huai-Hai region, and the area amounted to 42% of the national high-yield cropland area. Meanwhile, the proportion of high-yield cropland was lower than 15% in Heilongjiang, Sichuan, and Inner Mongolia, which had the largest area allocated to cropland in China. If all the medium-yield cropland could be improved to the productive level of high-yield cropland and the low-yield cropland could be improved to the level of medium-yield cropland, the total productivity of the land would increase 19% and 24%, respectively.

DOI

[55]
Yan H M, Liu J Y, Cao M K, 2005a. Remote sensed multiple cropping index variations in China during 1981-2000.Acta Geographica Sinica, 60(4): 559-566. (in Chinese)Multiple cropping system is essential to Chinese agriculture, which can significantly increase grain yield and promote agricultural economic development. Multiple Cropping Index is fluctuating year by year due to the changing natural conditions and rural social status, so, it is very important to get the change information in time for food security assessment and scientific decision on agricultural development and planning. The discussions about food security in recent years mostly focused on the peril caused by decreased cropland area, whereas neglected the loss of actual sown area due to Multiple Cropping Index decrease. As the only data source for sown area or MCI change assessment on national scale, statistical data not only is time-lagged and poor in creditability but also lack spatially explicit description. In this study, we extract multiple cropping information from 8 km 10-day composite AVHRR/NDVI time series images according to the phenological metrics and farmland practice temporal features, and then analyze MCI changes from the 1980s to the 1990s. This study shows that China's MCI increase as a whole, but 15% of cropland area has suffered MCI decrease that is mainly distributed in the Zhujiang River Delta in South China, the middle and lower reaches of the Yangtze River, hilly area of Sichuan Basin and Shandong hilly area of Huang-Huai-Hai region. In the Sichuan Basin and the Huang-Huai-Hai region, the MCI decreased croplands are mostly distributed in hilly area, while MCI of cropland in plain area increase or keep stable.

[56]
Yan H M, Xiao X M, Huang H Q et al., 2014. Multiple cropping intensity in China derived from agro-meteorological observations and MODIS data.Chinese Geographical Science, 24(2): 205-219.Double- and triple-cropping in a year have played a very important role in meeting the rising need for food in China. However, the intensified agricultural practices have significantly altered biogeochemical cycles and soil quality. Understanding and mapping cropping intensity in China鈥檚 agricultural systems are therefore necessary to better estimate carbon, nitrogen and water fluxes within agro-ecosystems on the national scale. In this study, we investigated the spatial pattern of crop calendar and multiple cropping rotations in China using phenological records from 394 agro-meteorological stations (AMSs) across China. The results from the analysis of in situ field observations were used to develop a new algorithm that identifies the spatial distribution of multiple cropping in China from moderate resolution imaging spectroradiometer (MODIS) time series data with a 500 m spatial resolution and an 8-day temporal resolution. According to the MODIS-derived multiple cropping distribution in 2002, the proportion of cropland cultivated with multiple crops reached 34% in China. Double-cropping accounted for approximately 94.6% and triple-cropping for 5.4%. The results demonstrat that MODIS EVI (Enhanced Vegetation Index) time series data have the capability and potential to delineate the dynamics of double- and triple-cropping practices. The resultant multiple cropping map could be used to evaluate the impacts of agricultural intensification on biogeochemical cycles.

DOI

[57]
Zhang H J, 2014. Implementing well the grain direct subsidy policy and ensuring national food security.Shanxi Science & Technology, 29: 1-3, 12. (in Chinese)The important functions of our country's grain direct subsidy policy are strengthening and benefiting the farmers, encouraging farmers to grow grains, ensuring national food security, and promoting agricultural modernization. In the course of implementing the grain direct subsidy policy, should make the work institutionalized and the supervision legalized, let the farmers learn the grain direct subsidy policy, save the administrative cost, maximize the the rights and interests of grain farmers, and ensuring the best effect of the grain direct subsidy policy.

[58]
Zhang J B, Lin X G, Li H, 2011b. A new generation of controlling technology for the medium and low-yield fields and its potential in large-area balanced grain production increase.Bulletin of Chinese Academy of Sciences, 4: 375-382. (in Chinese)To 2020,a national increase of 50 million tons is to be targeted in grain production,one-third of which depends on the great contribution of the Huang-Huai-Hai region.Tapping into the production potential of large-area medium and low-yield fields has become the most principal strategy for the increase of grain production capacity.However,current experiences and technologies in the improvement of medium and low-yield farmlands,with the large transfer of the rural labor force and the deep transformation of the agricultural production pattern to large-scale development and modernization,could not meet the needs in the new situations.In thisstudy,a new generation of controlling techniques for the improvement of medium and low-yield fields,aimed at the settlement of thorny problems in the improvement of medium and low-yield fields,has been developed and integrated,named "double leaping over technology for the raising of soil fertility and grain production",based on the multi-year studies in Fengqiu,Henan Province.These techniques were demonstrated and extended in the improvement of 13 thousand hectare medium and low-yield fields with tremendous benefits in grain production increase,which provides a model for the large-area increase of grain production in Henan and the Huang-Huai-Hai regions as a whole.The provincial government of Henan is set to adopt such technology in the new-round improvement of medium and low-yield fields.

[59]
Zhang X L, Kong X B, 2014. Cropland sustainable use impacted by groundwater depletion in China’s HHH Plains.China Land Sciences, 28(5): 90-96. (in Chinese)The purpose of this study is to calculate the average groundwater depletion rate of China's Huang-HuaiHai(HHH) plains, explore the driving force of the groundwater depletion and provide a decision basis for policy making to regulate the farmland use at the limit of exhausted water resource. Based on previous collection 266 groundwater depletion rate samples and 5 long-term monitoring cities, Kriging interpolations with ArcGIS are used to convert data into the magnitude of water depletion. Furthermore, spatial matching with ArcGIS is used to overlay the groundwater depletion rate layer and cropland distribution layer within nine major agro-ecological regions. The results indicate that the groundwater in HHH plains is being depleted at a mean rate of 0.46 0.37 m yr-1 for the shallow groundwater, and 1.14 0.58 m yr-1 for deep groundwater. It has become the severest depression zone in the world since the 1980 s. The severity of groundwater depletion is attributed to dramatic increase in crop yields and total production in the HHH driven by intensive irrigation. According to the aquifer depletion extent, the HHH is grouped into four adjusting zones, i.e., agricultural-adjust zone, intensity-reduce zone, ecology-sustain zone, and potential-use zone. The paper concludes that the "fallowing land and exploit potentialities" should be the target of building farmland ecological and food security system. The virtual research provides a useful reference for the future farmland sustainable use policy making in China.

[60]
Zhang Z G, 2011. Spatial-temporal characteristics of multiple cropping index and relationship between multiple cropping index and grain yield in Henan province.Hubei Agricultural Sciences, 50(17): 3653-3656. (in Chinese)Multiple cropping is an important way to increase grain yield.Henan is an important province in China's grain-producing.There are realistic significance for food production and food security.Multiple cropping index and potential multiple cropping index were calculated.Spatial-temporal characteristics of multiple cropping were analyzed.At the same time,function relationship between grain yield and multiple cropping indexes in recent 30 years of Henan province was established by linear regression.The results showed:(1) Both multiple cropping index and grain yield totally had an increasing tendency in recent 30 years.They had significant correlation,and multiple crop indexes was the reason for the variation of the food production;(2) Henan province was hard to rely increasing grain yield on multiple cropping;(3)Existing potential multiple crop index calculation did not consider the human factors,and so value was low.

[61]
Zhang Z G, Li L, 2011a. Temporal variation and prediction of multiple cropping index in Henan Province.Research of Soil & Water Conservation, 18(4): 241-243, 253. (in Chinese)Multiple cropping is one of the important measures of intensive land use and food security in regional agricultural production.Based on the analysis of the temporal variation of multiple cropping index in He'nan Province during 1978-2009,the paper predicts the changes of multiple cropping index during 2010-2019 using the GM(1,1) model.The results showed that:the multiple cropping index increased gradually during 1978-2009,and the trend was more significant since 1985;the prediction results showed that in the next decade(2010-2019),the multiple cropping index will also increase in He'nan Province.Although multiple cropping could be important in agricultural development and food security,it is noteworthy that the risk of land degradation would increase.

[62]
Zhao Q, Chen S G, Ye X H, 2009. Practice and reflection on high-standard farmland construction.Agricultural Development & Equipments, 3: 18-21. (in Chinese)The construction of high-standard farmland is of primary importance in comprehensive agricultural development. In the past ten years,especially since 2004,Yangzhou City has built some high-standard farmland by various means and has laid a solid foundation for agricultural development. Effective measures have been taken to ensure this.

[63]
Zhou J, Jia L, Menenti M.2015. Reconstruction of global MODIS NDVI time series: Performance of harmonic analysis of time series (HANTS).Remote Sensing of Environment, 163(15): 217-228.61We develop a systematic scheme to evaluate the performance of HANTS.61The global distribution of reconstruction error for NDVI has been quantified.61The reconstruction performance in the regions north of 50oN is less than ideal.

DOI

[64]
Zhu H Y, Li X B, Xin L J, 2007. Intensity change in cultivated land use in China and its policy implications.Journal of Natural Resources, 22(6): 907-915. (in Chinese)The area of cultivated land in China decreased from 35 104ha/yr(1980-1996) to 98脳104ha/yr(1997-2005),resulted from rapid economic development following the 1978 reforms.In response to the growing demand of society for grain products,intensification has become the overwhelming choice in cultivated land use.But this choice came into conflict with farmers' pursuance in recent years,as the grain production is declining in importance for farmers with market economic improvement.Has the cultivated land use been intensive or extensive in the conflict between social interests and individual interest.How to release the conflict if extensive trend exists. The intensity changes in cultivated land use were discussed firstly on country scale.Increase of multi-cropping index(MCI) during 1952-2005 implied the intensification in cultivated land use in this period.But the sown area of grain decreased from 113787000hm2 in 1998 to 99410000ha in 2003 and 104278000ha in 2005.Meanwhile,the grain yield per unit-sown area had a reduction from 4502kg/ha in 1998 to 4332kg/ha in 2003,and then went up to 4642kg/ha in 2005.The downward trend of grain sown area and grain yield per sown-unit area during 1998-2003,revealed input reduction of cultivated land,expense and labor in grain production.The rise in 2004-2005 can be ascribed to the implement of new agriculture policy.Those facts mean that lower incentive for raising cultivated land use intensity already threatens grain production in China. On regional scale,the intensity in cultivated land use varied across provinces.MCI decreased in regional disparity in Beijing,Shanghai,Tianjin,Zhejiang,Fujian,Jiangxi,Hubei and Guangdong during 1996-2003.Furthermore,these provinces reduced their grain sown area synchronously.Other provinces that reduced their grain sown area included Hebei,Shanxi,Inner Mongolia,Liaoning,Jiangsu,Shangdong,Henan,Hunan,Guangxi,Hainan,Sichuan,Shaanxi,Gansu,Qinghai,and Xinjiang.Except for input reduction of cultivated land in grain production,input of labor and expense declined in some of the above regions till 2005. Farmer's pursuance change is at the root of the intensity change in cultivated land use.It had turned from maximizing the output of land to maximizing the income of labor force with the development of market economy.In order to achieve the goal of national food security,relevant policies and measures should be further taken to alleviate the conflict between the nation's goal and farmers' goal of maximizing their interests.These policies and measures should speed up the flow of cultivated land between farmers and encourage farmers to extend their farm scale with higher technological level.

[65]
Zuo L J, Dong T T, Wang X et al., 2009. Multiple cropping index of northern China based on MODIS/EVI.Transactions of the Chinese Society of Agricultural Engineering, 25(8): 141-146. (in Chinese)Multiple cropping is an important mean for increasing regional grain output and also a crucial cropping pattern in China's farming system.This study proposed a new method for extracting multiple cropping index(MCI) on pixel level with multi-temporal moderate-resolution imaging spectroradiometer(MODIS) enhanced vegetation index(EVI) data based on the crop phenology and decision tree(DT).The method could be divided into two steps.First of all,according to the local crop phenology,several features were put forward for discriminating the pixel-level MCI,which contained three types:fallow,single cropped and double cropped.Second,the threshold for each feature was brought up by using CART Algorithm.Finally,the multiple cropping index of 15 provinces of Northern China were extracted in 2005.Then,the result was compared with that of former researches,and it shows that DT method is more efficient.

DOI

[66]
Zuo L J, Wang X, Zhang Z X et al., 2014. Developing grain production policy in terms of multiple cropping systems in China.Land Use Policy, 40: 140-146.Multiple cropping is one of the simplest ways to increase grain production, and it has an important role in the food security of China. This paper evaluates the multiple cropping systems of China, and identifies the regional obstacles that limit the use of multiple cropping with the aim to give some implications for developing grain production policy. A time series analysis of remote sensing data coupled with an econometrics model tochastic frontier analysis (SFA) was used to derive the multiple cropping index (MCI), potential multiple cropping index (PMCI), multiple cropping efficiency (MCE), and potential increment of multiple cropping index (PIMCI) to evaluate the multiple cropping systems. Regional obstacles to the use of multiple cropping were identified by zoning socioeconomic and ecological environmental factors that impact its application. The MCE of China in 2005 was 87.5%, with a gap of 22% between the MCI and the PMCI. The Bohai Rim, the rim of Tianshan Mountain, the Sichuan Basin, and the middle reach of Yangtze River are the main regions that larger PIMCI could be anticipated. The whole country (excluding areas that lacked data) was divided into seven distinct regions in terms of the impact factors and further classified into low-efficiency high-potential regions (LHRs), high-efficiency low-potential regions (HLRs), high-efficiency medium-potential regions (HMRs), and medium-efficiency high-potential regions (MHRs) according to regional multiple cropping performance. Considering about the obstacles and benefits to each region, different strategies should be implemented to different regions for regional grain production increase. Special attention should be paid to the improvement of MCE in north and southwest China with the expectation to increase grain production of China. The results would help implement he plan to increase grain production capacity by 50 million tons nationwide launched by the central government of China.

DOI

Outlines

/