Special Issue: Land system dynamics: Pattern and process

Spatio-temporal analysis of the geographical centroids for three major crops in China from 1949 to 2014

  • FAN Lingling 1 ,
  • LIANG Shefang 1 ,
  • CHEN Hao 1 ,
  • HU Yanan 2 ,
  • ZHANG Xiaofei 3 ,
  • LIU Zhenhuan 4 ,
  • WU Wenbin 1, 5 ,
  • YANG Peng , 1, 5, *
Expand
  • 1. Key Laboratory of Agricultural Remote Sensing (AGRIRS), Ministry of Agriculture/Institute of Agricultural Resources and Regional Planning, Chinese Academy of Agricultural Sciences, Beijing 100081, Chi-na
  • 2. Agricultural Information Institute, Chinese Academy of Agricultural Sciences, Beijing 100081, China
  • 3. Laboratory for Earth Surface Processes, Ministry of Education, College of Urban and Environmental Sciences, Peking University, Beijing 100871, China
  • 4. Department of Land Resources and Environment Studies, School of Geography and Planning, Sun Yat-Sen University, Guangzhou, 510275, China
  • 5. Chinese Academy of Agricultural Sciences-Ghent University Joint Laboratory of Global Change and Food Security, Beijing 100081, China
*Corresponding author: Yang Peng (1975-), Professor, specialized in global change and food security. E-mail:

Author: Fan Lingling (1993-), Master Student, specialized in impact of climate change on agriculture. E-mail: fanlingling@caas.cn

Received date: 2017-03-14

  Accepted date: 2017-09-18

  Online published: 2018-11-20

Supported by

National Key Research and Development Program of China, No.2017YFD0300201

National Natural Science Foundation of China, No.41401116

Ministry of Finance of China through the Non-Profit National Research Institute, No.Y2017JC30

Field Strategic Research Project of Medium and Long-Term Development Strategy of China’s Engineering Science and Technology, No.2016-ZCQ-08

Copyright

Journal of Geographical Sciences, All Rights Reserved

Abstract

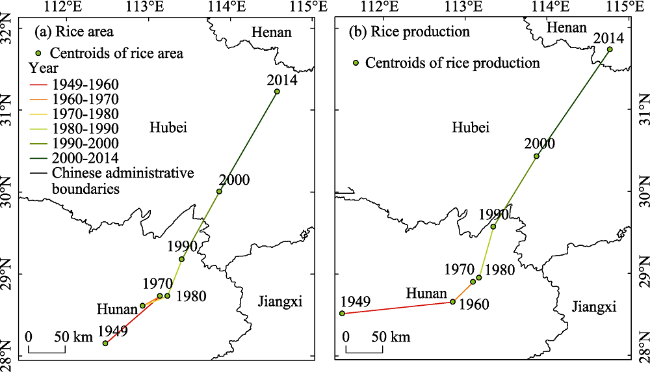
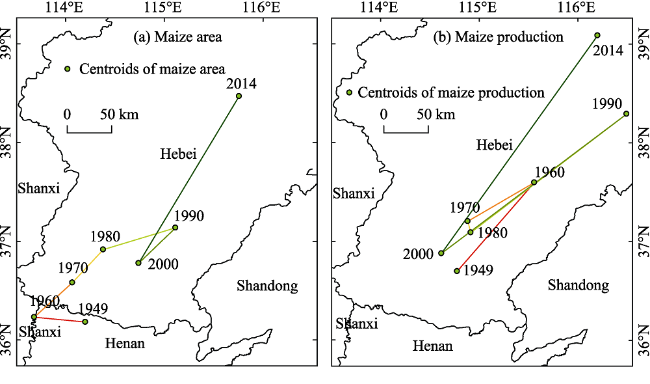
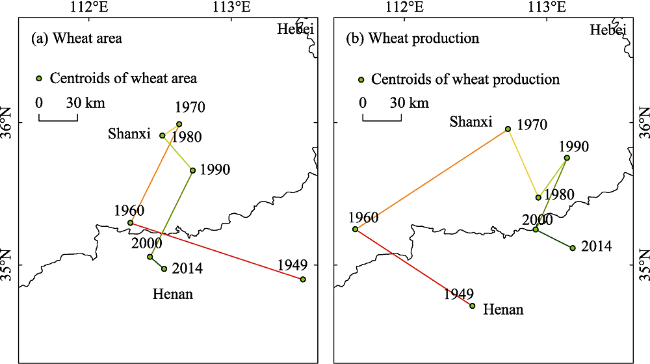
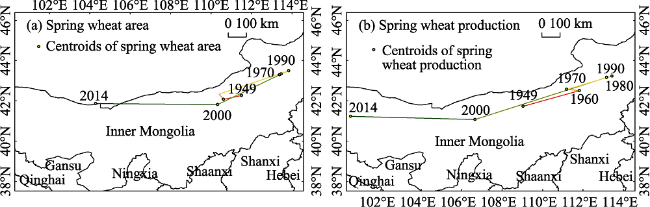
Spatial distribution changes in major crops can reveal important information about cropping systems. Here, a new centroid method that applies physics and mathematics to spatial pattern analysis in agriculture is proposed to quantitatively describe the historical centroids of rice, maize and wheat in China from 1949 to 2014. The geographical centroids of the rice area moved 413.39 km in a 34.32° northeasterly (latitude 3.08°N, longitude 2.10°E) direction at a speed of 6.36 km/year from central Hunan province to Hubei province, while the geographical centroids of rice production moved 509.26 km in the direction of 45.44° northeasterly (latitude 3.22°N, longitude 3.27°E) at a speed of 7.83 km/year from central Hunan province to Henan province. The geographical centroids of the maize area and production moved 307.15 km in the direction of 34.33° northeasterly (latitude 2.29°N, longitude 1.56°E) and 308.16 km in the direction of 30.79° northeasterly (latitude 2.39°N, longitude 1.42°E), respectively. However, the geographical centroids of the wheat area and production were randomly distributed along the border of Shanxi and Henan provinces. We divided the wheat into spring wheat and winter wheat and found that the geographical centroids of the spring wheat area and production were distributed within Inner Mongolia, while the geographical centroids of winter wheat were distributed in Shanxi and Henan provinces. We found that the hotspots of crop cultivation area and production do not always change concordantly at a larger, regional scale, suggesting that the changing amplitude and rate of each crops’ yield differ between different regions in China. Thus, relevant adaptation measures should be taken at a regional level to prevent production damage in those with increasing area but decreasing production.

Cite this article

FAN Lingling , LIANG Shefang , CHEN Hao , HU Yanan , ZHANG Xiaofei , LIU Zhenhuan , WU Wenbin , YANG Peng . Spatio-temporal analysis of the geographical centroids for three major crops in China from 1949 to 2014[J]. Journal of Geographical Sciences, 2018 , 28(11) : 1672 -1684 . DOI: 10.1007/s11442-018-1536-3

1 Introduction

The rapid growth of China’s population has led to an increased demand for food which has been unfortunately accompanied by frequent food security problems in agricultural areas (Carter et al., 2003; Nelson et al., 2010; Ding et al., 2015). China is the largest producer and consumer of grain, placing it in an important position in global agricultural production. Even small changes in agricultural production system have a huge impact on Chinese food security with its increasing population and limited arable land (Ding et al., 2015; Li et al., 2015; He et al., 2017). The spatial and temporal distributions of Chinese crops are thought to reflect dynamic natural and anthropogenic external forces (You et al., 2009; Liu et al., 2013; Tan et al., 2014). Crop land use is closely related to changes in the crop planting area and production, which have increasingly been the focus of scientific research in recent years (Nelson et al., 2010; Kuemmerle et al., 2013; Cohn et al., 2016; Xia et al., 2016). Crop planting area and production, the most intuitive two indicators that could represent the productivity change of crops, are the results of selective planting due to systemic factors in internal agricultural production and external driving factors. Developing science and technology, increasing production input and the transforming concept of crop production in farmers have significant impacts on the crop distribution extension and location region. These factors reflect the importance of a crop in a given region, allowing national departments to put forward agricultural decision-making measures for key regions (You et al., 2009; Cui et al., 2014). Therefore, understanding how the spatial pattern of the crop planting area and production have historically changed will provide significant insights for predicting possible fluctuations in the agricultural production system (Verburg et al., 2013; Zhao et al., 2013; Deb et al., 2015; Szumigalski et al., 2016; Zheng et al., 2017).
Most research on crop spatial distribution changes has focused on the regional spatial change in crop area and production or the dynamics of the northern boundary of crops in China (Li et al., 2013; Tan et al., 2014; Iizumi et al., 2015; Yin et al., 2016). Liu et al. (2013) utilized the SPAM-China model to get a series of spatial distributions for rice area and production at 10-km pixels at national scale from the early 1980s onward and analyzed the pattern of spatial and temporal changes in China. Taking Binxian county of Heilongjiang province in China as an example, Zhang et al. (2013) analyzed the spatial and temporal variation characteristics of crop planting structure from 1996 to 2010. Results showed that the crop pattern exhibited a significant spatio-temperal change in the past 15 years, with an increase in crop planting area of 22.86%. Li et al. (2012) analyzed the northern boundary of wheat and the potential planting distribution in China under the background of climate warming. He pointed out that the planting boundary of winter wheat moved to the north significantly at a rate greater than that of southern boundary due to the increasing temperature of China’s winter over the past 30 years. However, few studies have investigated the geographical movements of crop planting area and production, which can provide a visualized understanding of the migration of major crop regions. Some studies have analyzed the spatial changes based on the geographical centroid model, but they have not compared the cultivation centroids between varieties of main crops (Li et al., 2015; Liu et al., 2015). Therefore, understanding how the geographical centroids of major crop planting area and production have moved, both in terms of their size and geographic location, has significant implications for food security and production system management (Li et al., 2014; Wu et al., 2014).
Crop planting hotspots and expansion direction are subject to spatial heterogeneity (in terms of soil, terrain and climate), of which knowledge is of important for national resource allocation and a balanced market economy (You et al., 2006). Geographical movements in the crop planting area and production could impact or be affected by changing agronomic practices, local environmental conditions and the distribution system of the economic market (Wu et al., 2014; Li et al., 2015). However, the long-term quantitative changes in the distance and direction of external forces and their effects on the geographical centroids remain unclear, and a contrastive analysis of major Chinese crop production systems is needed.
The aim of this study is to fill this research gap by using a centroid calculation model derived from physics to acquire the geographical centroids of the planting area and production of three major crops in China from 1949 to 2014, specifically, rice, maize and wheat. During this process, we divided the wheat into winter wheat and spring wheat so that we could better analyse the specific characteristics within each major planting area. We then compare the changes in geographical centroids between the three crops and discuss the differences between the migratory routes of each crop’s planting area and production. Using a long-term data series from 1949 to 2014, these results highlight the dynamic changes in the geographical centroids for the three major crops and the spatial movement of the important crop planting areas in China.

2 Data source and methodology

2.1 Data sources

We collected historical data for the three major crop areas and production for the 1949-2014 period from 31 provinces in China. These data were obtained from the Planting Information Network of China (http://zzys.agri.gov.cn/nongqing.aspx). The major Chinese crop areas and production in 2014 are shown in Table 1.
Table 1 The area and production of three major Chinese crops in 2014
Province Wheat Rice Maize
Area
(million ha)
Production
(million tons)
Area
(million ha)
Production
(million tons)
Area
(million ha)
Production
(million tons)
Beijing 0.02 0.12 0.00 0.00 0.09 0.50
Tianjin 0.11 0.59 0.02 0.12 0.20 1.01
Hebei 2.34 14.30 0.08 0.54 3.17 16.71
Shanxi 0.67 2.59 0.00 0.01 1.68 9.38
Inner Mongolia 0.56 1.53 0.08 0.52 3.37 21.86
Liaoning 0.01 0.03 0.56 4.52 2.33 11.71
Jilin 0.00 0.00 0.75 5.88 3.70 27.34
Heilongjiang 0.15 0.47 3.21 22.51 5.44 33.43
Shanghai 0.04 0.19 0.10 0.84 0.00 0.03
Jiangsu 2.16 11.60 2.27 19.12 0.44 2.39
Zhejiang 0.08 0.31 0.82 5.90 0.07 0.30
Anhui 2.43 13.94 2.22 13.95 0.85 4.66
Fujian 0.00 0.01 0.80 4.97 0.05 0.20
Jiangxi 0.01 0.03 3.34 20.25 0.03 0.12
Shandong 3.74 22.64 0.12 1.01 3.13 19.88
Henan 5.41 33.29 0.65 5.29 3.28 17.32
Hubei 1.07 4.22 2.14 17.29 0.64 2.94
Hunan 0.03 0.10 4.12 26.34 0.35 1.89
Guangdong 0.00 0.00 1.89 10.92 0.18 0.77
Guangxi 0.00 0.00 2.03 11.66 0.58 2.66
Hainan 0.00 0.00 0.31 1.55 0.00 0.00
Chongqing 0.09 0.27 0.69 5.03 0.47 2.56
Sichuan 1.17 4.23 1.99 15.27 1.38 7.52
Guizhou 0.25 0.62 0.68 4.03 0.79 3.14
Yunnan 0.43 0.84 1.14 6.66 1.53 7.43
Xizang (Tibet) 0.04 0.24 0.00 0.00 0.00 0.02
Shaanxi 1.08 4.17 0.12 0.91 1.15 5.40
Gansu 0.79 2.72 0.01 0.04 1.00 5.64
Qinghai 0.09 0.35 0.00 0.00 0.03 0.19
Ningxia 0.13 0.41 0.08 0.62 0.29 2.24
Xinjiang 1.14 6.42 0.08 0.76 0.91 6.41

2.2 Calculating geographical centroids

The centre of gravity concept originates from physics, and now represents an important analytical tool for studying the spatial changes of factors in regional development processes. Additionally, regional development involves various factors that are in agglomeration and diffusion, and the movement of these factor centres show the spatial pathway of regional development. The production centroid model is a typical analysis model in the field of geography. We built a crop centroid method using the theory of gravity model to calculate the geographical centroids for the area and production of three major crops (unless otherwise indicated, the use of the term “wheat” represents the total wheat). This model addresses the dynamics of the centroids during the examined period and estimates the location (longitude, Xt and latitude, Yt) of the centroids for the three crop areas and productions.
${{X}_{t}}=\frac{\sum\nolimits_{i=1}^{n}{({{P}_{i,t}}\times {{X}_{i}})}}{\sum\nolimits_{i=1}^{n}{{{P}_{i,t}}}};{{Y}_{t}}=\frac{\sum\nolimits_{i=1}^{n}{({{P}_{i,t}}\times {{Y}_{i}})}}{\sum\nolimits_{i=1}^{n}{{{P}_{i,t}}}}$ (1)
Xi and Yi are the longitude and latitude of the geographical centroid of province i; Pi,t represents the three major crop area or production for year t in province i; t covers the period from 1949 to 2014; and n is the total number of crop-producing provinces (n = 31). The centroids for years k and k+m were set as Pk(xk, yk) and Pk+m(xk+m, yk+m); thus, the direction model of the centroid moving from Pk to Pk+m was as follows:
$\theta =\arctan \frac{{{y}_{k+m}}-{{y}_{k}}}{{{x}_{k+m}}-{{x}_{k}}}$ (2)
The distance model of centroids moving from Pk to Pk+m was as follows:
${{d}_{m}}=\sqrt{{{({{x}_{k+m}}-{{x}_{k}})}^{2}}+{{({{y}_{k+m}}-{{y}_{m}})}^{2}}}$ (3)

3 Results

3.1 Relocation of the rice area and production

We quantified the movement of the geographical centroids for the area and production of rice in Figure 1. The result showed a distinct north-eastward movement from 1949 to 2014. The major planting region for rice production was in Hunan province in 1949, while the geographical centroids of the rice area and production in China were 112.47°E/28.15°N and 111.50°E/28.51°N, respectively. By 2014, the centroids of the rice area had moved 413.39 km in the 34.32° northeasterly (latitude 3.08°N, longitude 2.1°E) direction at a speed of 6.36 km/year from central Hunan into Hubei province. The rice area centroids moved 156.81 km north at the fastest speed of 11.20 km/year from 2000 to 2014 and 104.79 km northeast with a speed of 10.48 km/year from 1990 to 2000. In addition, the rice production centroids moved 509.26 km towards the 44° northeasterly (latitude 3.22°N, longitude 3.27°E) direction at a speed of 7.83 km/year from central Hunan into Henan province between 1949 and 2014. The rice production centroids moved 150.84 km north at the fastest speed of 13.71 km/year from 1949 to 1960; however, they moved the longest distance of 175.54 km northeast at the second fastest speed of 12.54 km/year from 2000 to 2014 (Table 2).
Figure 1 Movements of the geographical centroids for rice area and production between 1949 and 2014
Table 2 Changes in the geographic centroids of rice, maize and wheat from 1949 to 2014

3.2 Relocation of the maize area and production

Maize area and production increased at annual speeds of 0.37 million ha and 3.12 million tons from 1949 to 2014. We also quantified the movement of the geographical centroids for the maize area and production over the last six decades, as shown in Figure 2. Both figures showed that the maize planting hot zones moved from the northern part of Henan province to the central part of Hebei province. The geographical centroids of the maize area and production in China moved 307.15 km in the 34.33° northeasterly (latitude 2.29°N, longitude 1.56°E) direction and 308.16 km in 30.79° northeasterly (latitude 2.39°N, longitude 1.42°E) direction, respectively. The geographical centroids of the maize area showed a distinct northeast movement at the longest distance of 219.10 km and the fastest speed of 15.65 km/year between 2000 and 2014. Notably, the centroids of the maize area showed a similar speed before 2000. In contrast, the geographical centroids of maize production did not display a consistent direction every year and engaged in a more random movement than the centroids of maize area. However, the data still showed a northeastern movement over the last six decades. Clearly, most of the centroids for maize production were distributed in Hebei province, and some were located along the border of Henan and Hebei provinces. The geographical centroids of maize production in 1949 were located in the southern part of Hebei province but moved to Henan province in 1959 and then to the middle of Hebei province in 1960; most of the centroids were subsequently distributed within Hebei province from 1960 to 2014. The geographical centroids of maize production moved 260.62 km in the 53.10° southwesterly direction at the fastest speed of 26.06 km/year between 1990 and 2000, then moved the longest distance of 301.11 km in the 35.70° northeasterly direction at a speed of 21.51 km/year.
Figure 2 Movements in the geographical centroids of the maize area and production between 1949 and 2014 (Legend of lines is shown in Figure 1a)

3.3 Relocation of the wheat area and production

(1) Wheat
The dynamic trend in the geographical centroids of the wheat area and production, which were distributed randomly along the border of Henan and Shanxi provinces, completely differed from those of the other two crops. The complete trajectories did not show regular movement over the last six decades and instead returned to Henan. For example, the geographical centroids of wheat area moved in the direction of 71.8° northwesterly with both the longest distance of 141.60 km and the fastest speed of 12.87 km/year across Henan and Shanxi provinces from 1949 to 1960. However, they moved 14.28 km at 49.50° southeasterly at the slowest speed of 1.02 km/year, keeping to Henan province from 2000 to 2014. From 1960 to 1990, nearly all of the wheat area centroids were scattered within Shanxi province and moved towards different directions at an average speed of 4.60 km/year. As expected, the geographical centroids of wheat production did not display a linear movement trend over the last six decades (Figure 3b). Unlike the area, the production centroids exhibited consistent movement in a longitudinal direction but moved randomly in the latitudinal direction, moving 90.23 km in the direction of 60.02° northeasterly (latitude 0.41°N, longitude 0.7°E) between 1949 and 2014. The production centroids showed a distinct northeastern movement at the longest distance of 142.13 km and the fastest speed of 14.21 km/year between 1960 and 1970. To some extent, the relatively concentrated areas of wheat production centroids were located in a more eastern direction than the wheat area centroids.
Figure 3 Movements of the geographical centroids for the total wheat area and production between 1949 and 2014 (Legend of lines is shown in Figure 1a)
(2) Spring wheat
Spring wheat is primarily distributed north of the Great Wall in China. We quantified the geographical centroid movement of the spring wheat area and production as shown in Figure 4. Nearly all of the area centroids were distributed within Inner Mongolia, but moved from the central to the eastern areas between 1957 and 1980 and then from the eastern to the western areas between 1980 and 2014. There was no spring wheat planting in the missing years. In general, the area centroid moved 597.18 km in the direction of 86.79° southwesterly (latitude 0.41°N, longitude 7.22°E) from 1957 to 2014, which showed distinct movement in longitude but not in latitude. The production centroids and migration tendency maintained a similar movement as the area but traversed a longer distance, moving 710.40 km in the direction of 86.65° southwesterly (latitude 0.50°N, longitude 8.53°E) from 1957 to 2014.
Figure 4 Movements of the geographical centroids for the spring wheat area and production between 1949 and 2014 (Legend of lines is shown in Figure 1a)
(3) Winter wheat
Winter wheat is primarily distributed south of the Great Wall in China. The planting area of winter wheat was approximately 20 million ha in 2003, accounting for 90 percent of the total wheat area. This explains the similar geographical centroids of winter wheat and total wheat. We also quantified the geographical centroids of the winter wheat area and production in Figure 5 (a, Winter Wheat Area; b, Winter Wheat Production). The geographical centroid of the winter wheat area moved 63.71 km towards 47.97° southwesterly (latitude 0.38°N, longitude 0.43°E) between 1949 and 2014. With the exception of the 1960s, the majority of area centroids were distributed in Henan province, concentrated in the northern part of Henan. Unlike the geographical centroids for winter wheat area, the production was more scattered in Henan and Shanxi provinces than that for the winter wheat area over the last six decades. The geographical centroids of winter wheat production moved 150.31 km towards 86.01° northeasterly (latitude 0.09°N, longitude 1.35°E) from 1949 to 2014, which showed distinct movement in longitude but not in latitude. Like the area centroids, the production centroids were primarily distributed in Shanxi province during the 1960s and in Henan province during other time periods.
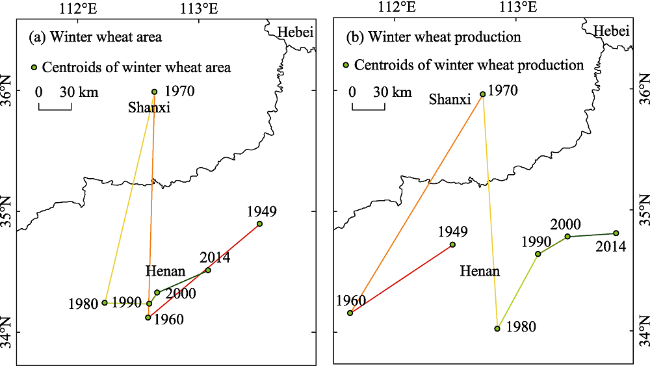
Figure 5 Movements in the geographical centroids of the winter wheat area and production between 1949 and 2014 (Legend of lines is shown in Figure 1a)

4 Discussion

(1) Regional heterogeneity in the natural environment and the socio-economy of different districts has shaped the spatial distribution of crop production in each province. In terms of area, maize planting area significantly increased in Northeast China during the last six decades, which moved the centroids of the maize area a long distance to the northeast. Additionally, the increased maize planting area in Northeast China has contributed to the total planting area in China. Many studies have shown that there is a close relationship between the climate factors and the maize distribution, and the northeast’s maize cultivation is inordinately affected due to its sensitivity to climate change (Zhao et al., 2015; He et al., 2016; Liu et al., 2017). Rice planting area also extended dramatically towards Northeast China, as rice is now grown as far as the northern border of Heilongjiang province due to higher temperatures. During the same time period, the rice area in southern China has decreased due to shifting economic patterns, reduced agricultural land use and increased land use efficiency. These two opposite phenomena experienced by such sensitive rice areas have conspicuously propelled the centroids of the rice area to the northeast. The rice area result is consistent with previous studies in which the centroid of Chinese rice shifted northeast for a long distance over the last few decades (Liu et al., 2013; Li et al., 2015). Unlike maize and rice, the centroids of wheat area did not show a distinct direction at a provincial scale but were randomly distributed between Shanxi and Henan provinces during this period. This phenomenon could be explained by the spatial characteristics of wheat distribution in which a consecutive increasing trend in the wheat planting area was only found in North China but not in the other regions. Therefore, we observed a series of wheat centroids moving irregularly on both sides of the border between Henan and Shanxi provinces, with uncertain directions and distances every ten years. The spatial distribution of wheat was circumscribed by both climate and human factors. It is largely due to the warming temperatures in mid and high latitudes that pushed the northern boundary of wheat to extend to north before the 1980s, but the significant improvement of wheat irrigation technology in North China and the productive benefit of wheat played a major role to move the key region to the south after the 1980s. (Sun et al., 2012; Wang et al., 2012; Liu et al., 2016).
(2) Similar to the area, the centroids of crop production also showed distinct regional movements during this period. Rice and maize production experienced dramatic increases in Northeast and North China due to the improvements in production management and innovation in crop varieties. The rapid development of irrigation facilities and the use of large amounts of chemical fertilizers also significantly contributed to the changes in the geographical centroids related to cultivation. Additionally, the Household Responsibility System (HRS) was another important reason for spatial changes in crop planting production. The HRS significantly stimulated production enthusiasm in farmers and contributed to the geographical movements of crop cultivation during its gradual integration in China after 1984. Under the HRS, farmers could decide what to plant and how to manage their crop system according to their understanding of the hydrothermal conditions and nutrient requirements of crops grown in Northeast China. This ultimately led to an increased production of rice which propelled rice production centroids a long distance to the northeast (Li et al., 2015). However, the hot spots of the rice planting region were distributed in both Northeast China and South China, while maize was distributed in North China. Both crops showed distinct movements within their primary areas of production. As noted previously, wheat is primarily produced south of the Great Wall, and winter wheat in North China accounting for a large proportion of the total wheat. Thus, the wheat production centroids showed no predictable pattern. Increasingly, innovative technologies and improved management practices in different regions have been applied appropriately to improve the wheat production and famer’s profit, enabling the location of wheat production to change significantly at the national scale (Xu et al., 2013; You et al., 2009).
(3) Our study has shown the spatio-temporal changes of the geographical centroids of three main crops area and production (rice, maize and wheat) in China from 1949 to 2014, showing the geographical centroids of each crop had unique migration characteristics from one to another. The geographical centroids of rice and maize exhibited an obvious northeastward movement while wheat showed no directional movement at the national scale during this period. Significant changes in these crops’ centroids movement trends are unlikely to be detected during short time frames as shifts in climate and social conditions affect agriculture at larger time scales (i.e. decades). The migration of the crops’ centroids over long periods reflects the use of agricultural production resources within the scope of human agricultural production and is the basis for understanding the adjustment and optimization of crop planting structure. Hence, this dynamic change in the spatial distribution of crops should be taken into account in order to plan crop planting management objectively and design adaptation strategies purposively. Rapid urbanization (particularly in the south), technical development, widened crop comparison gains, land use policy changes, agricultural mechanization, varieties of conversion, and climate change have significantly influenced crop distribution extension and location region, so the future research is needed to study the driving mechanisms between the crops spatio-temporal distribution and changes of the external factors mentioned above, in order to improve the understanding of the self-adjustment capacity in cropping system and its response to external factors.

5 Conclusions

This study applied the crop centroids model; acquired the geographical centroids of Chinese crop planting area and production during 1949 to 2014 of rice, maize, wheat, winter and spring wheat; and analysed the geographical dynamics of the crop planting area and production. The conclusions are as follows:
(1) During the last six decades, the centroids of the rice and maize areas showed distinct northeast movements. The geographical centroid of the rice area moved 396.27 km in the direction of 34.32° northeasterly (latitude 3.08°N, longitude 2.1°E) at a speed of 6.1 km/year from central Hunan province into Hubei province, while maize moved 288.6 km in the direction of 34.33° northeasterly (latitude 2.29°N, longitude 1.56°E). However, the wheat showed a more irregular movement pattern due to its specific planting distribution characteristics in China, as did the winter and spring wheat.
(2) In terms of the spatial and temporal movements of crop planting production centroids, the centroids of rice production moved 475.08 km in the direction of 45.44° northeasterly (latitude 3.22°N, longitude 3.27°E) at a speed of 7.31 km/year from central Hunan into Henan province. The maize production centroids were not regular for every year and displayed a more random movement than the centroids of the maize area; however, they eventually showed a northeast movement trend over the last six decades. The wheat production was similar to the wheat area in that there was no distinct directional consistency, and changes in the specific region have unique distribution characteristics.
(3) The centroid migration trajectory of each crop’s area and production exhibits different degrees of inconsistency which suggests that the changing amplitude and rate of each crops’ yield are not the same between different regions in China. The adoption of modern varieties, developing technology, increased use of fertilizers and climate change in the past decades have dramatically increased crop yields in China, but these resources and technologies varied from a region to another because of different natural conditions and technical levels. The inconsistencies in direction and distance of crop area and production centroids reflect the spatial variation caused by regional disparities in agricultural investment, field management, and natural conditions.

The authors have declared that no competing interests exist.

[1]
Carter C A, Chen J, Chu B., 2003. Agricultural productivity growth in China: Farm level versus aggregate measurement.China Economic Review, 14(1): 53-71.We measure agricultural productivity growth in China using alternative data sets: farm level data for Jiangsu province, national data, and provincial aggregate data for Jiangsu. For all three data sets, productivity growth was estimated to be strong during the immediate post-reform 1978鈥1987 period. According to the farm level data, productivity growth then slowed from 1988 to 1996. Alternatively, the national and provincial aggregate figures showed continued high productivity growth in the 1990s. These findings suggest that aggregate data may blur the true picture with regard to agricultural productivity growth in China.

DOI

[2]
Cohn A S, VanWey L K, Spera S A et al., 2016. Cropping frequency and area response to climate variability can exceed yield response.Natural Climate Change, 6(6): 601-604.About 70% of agricultural output variance due to climate in Mato Grosso, Brazil was determined by changes in cropping frequency and/or changes in cropping area rather than yield (the most common climate impact indicator), a study now shows.

DOI

[3]
Cui Z, Wu L, Ye Y et al., 2014. Trade-offs between high yields and greenhouse gas emissions in irrigation wheat cropland in China.Biogeosciences, 11(8): 2287-2294.Although the concept of producing higher yields with reduced greenhouse gas (GHG) emissions is a goal that attracts increasing public and scientific attention, the trade-off between high yields and GHG emissions in intensive agricultural production is not well understood. Here, we hypothesize that there exists a mechanistic relationship between wheat grain yield and GHG emission, and that could be transformed into better agronomic management. A total 33 sites of on-farm experiments were investigated to evaluate the relationship between grain yield and GHG emissions using two systems (conventional practice, CP; high-yielding systems, HY) of intensive winter wheat (Triticum aestivum L.) in China. Furthermore, we discussed the potential to produce higher yields with lower GHG emissions based on a survey of 2938 farmers. Compared to the CP system, grain yield was 39% (2352 kg ha???1) higher in the HY system, while GHG emissions increased by only 10%, and GHG emission intensity was reduced by 21%. The current intensive winter wheat system with farmers' practice had a median yield and maximum GHG emission rate of 6050 kg ha???1 and 4783 kg CO2 eq ha???1, respectively; however, this system can be transformed to maintain yields while reducing GHG emissions by 26% (6077 kg ha???1, and 3555 kg CO2 eq ha???1). Further, the HY system was found to increase grain yield by 39% with a simultaneous reduction in GHG emissions by 18% (8429 kg ha???1, and 3905 kg CO2 eq ha???1, respectively). In the future, we suggest moving the trade-off relationships and calculations from grain yield and GHG emissions to new measures of productivity and environmental protection using innovative management technologies.

DOI

[4]
Deb P, Shrestha S, Babel M S, 2015. Forecasting climate change impacts and evaluation of adaptation options for maize cropping in the hilly terrain of Himalayas: Sikkim, India.Theoretical and Applied Climatology, 121(3/4): 649-667.An investigation was carried out to assess the climate change impacts on rainfed maize yield using AquaCrop and CERES–maize crop simulation models, and evaluation of adaptation measures were...

DOI

[5]
Ding J, Huang J, Jia X et al., 2015. Direct farm, production base, traceability and food safety in China.Journal of Integrative Agriculture, 14(11): 2380-2390.With the rapid growth of China's economy, rising demand for safety food has been accompanied by frequent food safety scandals. Given that China's farming is dominated by millions of small-scale farms, ensuring food safety is a major challenge facing the public and private sectors. The direct farm (DF) program, initiated in 2008, represents one of the government's major initiatives to modernize the distribution of fresh fruit and vegetables (FFV) and improve food safety. Under the DF program, participating national and international retailers are expected to establish more direct procurement relationships with farm communities. While it is often claimed that greater participation by retailers in the production and post-harvest processing implied the DF program will lead to improved quality, safety and traceability, systematic evidence remains elusive as existing studies are largely narrative, based on case studies, or theoretical inference. Little empirical evidence is available for a broader evaluation of the DF program. This paper aims to fill this gap by assessing the overall performance of a single retailer's DF experience with respect to the procurement and food safety of FFV. We use data from a survey of production managers of 35 DF production bases (PBs) spread across 11 provinces, 3 cities and 1 autonomous region in China. The results show a mixture of opportunities and challenges. On one hand, the DF program improves production practices and distribution channels of FFV produced on its PBs, thus facilitating the move of China's food system towards improved food safety compliance. On the other hand, significant heterogeneity in the traceability of food and the ability of DF to meet higher safety standards is evident both across major product categories and across household-operated vs. firm-operated PBs. The paper concludes with policy implications.

DOI

[6]
He C, Liu Z, Xu M et al., 2017. Urban expansion brought stress to food security in China: Evidence from decreased cropland net primary productivity.Science of the Total Environment, 576: 660-670.61The CNPP decreased by 13.77TgC due to urban expansion in China from 1992 to 2015.61This CNPP loss caused a decline of 12.45milliontons of grain production.61The mean annual grain self-sufficiency rate decreased by 2% due to urban expansion.

DOI PMID

[7]
He Q, Zhou G, 2016. Climate-associated distribution of summer maize in China from 1961 to 2010.Agriculture Ecosystems and Environment, 232: 326-335.A quantitative description of the change in the cultivation distribution of summer maize under climate change can provide a scientific basis for optimizing the distribution of maize production in China and making countermeasures to cope with climate change. In this paper, we studied the relationship between the cultivation distribution of summer maize and climate in China and investigated the decadal change of cultivation distribution of summer maize and the change in climatic suitability from 1961 to 2010. The results indicate that there has been significant decadal change in the cultivation distribution and climatic suitability of summer maize in China. The most climate-suitable planting area for summer maize exhibited an obvious trend of eastward expansion, reaching its maximum area (3.4 107hm2) in the 1990s; the climate-suitable planting area exhibited a trend of southward expansion, the magnitude of which was relatively large in the last 20 years, approaching about 1.6 108hm2in the last 10 years. The least climate-suitable planting area was the largest and generally exhibited a fluctuating change with a decrease-increase-decrease-increase pattern, with the largest magnitude of fluctuation reaching 2.9 107hm2; the climate-unsuitable area generally exhibited a downward trend, except for a slight increase in the 1970s. In the past 50 years, the arable area of summer maize clearly moved northward. Before the 1990s, expansion in a northwestern direction dominated; since the 1990s, expansion was mainly to the northeast. It indicated that there remains a very large potential of yield increase for summer maize in China against the background of climate change, which primarily concentrates in Northern China.

DOI

[8]
Iizumi T, Ramankutty N, 2015. How do weather and climate influence cropping area and intensity?Global Food Security, 4: 46-50.61Climate affects all components of crop production (area, intensity and yield).61Yet, most studies to date have focussed on estimating climate impacts on yields.61We review the literature on the climatic impacts on cropping area and intensity.61We outline major knowledge gaps and discuss future research needs.

DOI

[9]
Kuemmerle T., Erb K., Meyfroidt P et al., 2013. Challenges and opportunities in mapping land use intensity globally.Current Opinion in Environmental Sustainability, 5(5): 484-493.Future increases in land-based production will need to focus more on sustainably intensifying existing production systems. Unfortunately, our understanding of the global patterns of land use intensity is weak, partly because land use intensity is a complex, multidimensional term, and partly because we lack appropriate datasets to assess land use intensity across broad geographic extents. Here, we review the state of the art regarding approaches for mapping land use intensity and provide a comprehensive overview of available global-scale datasets on land use intensity. We also outline major challenges and opportunities for mapping land use intensityfor cropland, grazing, and forestry systems, and identify key issues for future research.

DOI PMID

[10]
Li K, Yang X, Mu C et al., 2013. The possible effects of global warming on cropping systems in China (VIII: The effects of climate change on planting boundaries of different winter-spring varieties of winter wheat in China.Scientia Agricultura Sinica, 46(8): 1583-1594. (in Chinese)

[11]
Li Z, Liu Z, Anderson W et al., 2015. Chinese rice production area adaptations to climate changes, 1949-2010.Environmental Science and Technology, 49(4): 2032-2037.Abstract Climate change has great impact on cropping system. Understanding how the rice production system has historically responded to external forces, both natural and anthropogenic, will provide critical insights into how the system is likely to respond in the future. The observed historic rice movement provides insights into the capability of the rice production system to adapt to climate changes. Using province-level rice production data and historic climate records, here we show that the centroid of Chinese rice production shifted northeastward over 370km (2.98 N in latitude and 1.88 E in longitude) from 1949 to 2010. Using a linear regression model, we examined the driving factors, in particular climate, behind such rice production movement. While the major driving forces of the rice relocation are such social economic factors as urbanization, irrigation investment, and agricultural or land use policy changes, climate plays a significant role as well. We found that temperature has been a significant and coherent influence on moving the rice center in China and precipitation has had a significant but less spatially coherent influence.

DOI PMID

[12]
Li Z, Yang P, Tang H et al., 2014. Response of maize phenology to climate warming in Northeast China between 1990 and 2012.Regional Environmental Change, 14(1): 39-48.Investigating the temporal changes in crop phenology is essential for understanding crop response and adaption to climate change. Using observed climatic and maize phenological data from 53 agricultural meteorological stations in Northeast China between 1990 and 2012, this study analyzed the spatiotemporal changes in maize phenology, temperatures and their correlations in major maize-growing areas (latitudes 39–48°N) of Northeast China. During the investigation period, seedling and heading dates advanced significantly at 22 out of the 53 stations; maturity dates delayed significantly at 23 stations, and the growing period (GP, from seedling to maturity), the vegetative growing period (VGP, from seedling to heading) and the reproductive growing period (RGP, from heading to maturity) increased significantly at 3002% of the investigated stations. GP length was positively correlated with T mean at 40 stations and significantly at 10 stations ( P 02<020.01). Both negative and positive correlations were found between VGP and T mean , while RGP length was significantly and positively correlated with T mean . The results indicated that agronomic factors contribute substantially to the shift in maize phenology and that most farmers had adopted longer season cultivars because the increase in temperature provided better conditions for maize germination, emergence and grain filling. The findings on the various changes to maize phenology can help climate change impact studies and will enable regional maize production to cope with ongoing climate change.

DOI

[13]
Liu T, Zhou G, Tan K et al., 2016. Review on research of irrigation regime and its environmental effect in winter wheat field of North China Plain.Acta Ecologica Sinica, 36(19): 5979-5986. (in Chinese)The North China Plain known as "China granary"is the main winter wheat producing areas. However,it has been frequently and seriously affected by drought because of monsoon climate,especially winter drought and spring drought have been frequent and serious during recent decades. Making full use of the limited irrigation water resources to guarantee the safety of winter wheat production is a serious challenge for ensuring stable and high yield of winter wheat in the North China Plain. The key to solving this problem is how to make a scientific irrigation management based on the environmental effects. Although many studies have been done on drought and water-saving irrigation systems of winter wheat,there were less comprehensive commentary recently and still a lot of insufficiencies on interactive combinations of irrigation time,irrigation frequency and the environment effects,which have been based on overwintering water and the first springing water,especially for the adverse effects of current climate change and water shortage. This paper reviews the latest researches at home and abroad on the irrigation management systems( sufficient irrigation and deficit irrigation) and the environmental effects of irrigation in the key irrigation periods of winter wheat in the North China Plain. The responses of various developmental stages and physiological processes of winter wheat to water deficit are different. In particular developmental stages,the water deficit is not entirely negative effects,and it might have some adaptive effects on moderating water deficit to a certain extent. Deficit irrigation is through the artificial stage regulation to form state water budget at different developmental stages of winter wheat. Based on the theory of vulnerability and adaptability to drought,winter wheat will adjust its distribution pattern of assimilation to various organs. This process includes the impacts on many aspects: such as the development stages,weather conditions,the soil' s physical,chemical and biological properties,andwinter wheat yield. Eventually winter wheat will achieve the change of passive responses on water deficit. The purpose is to improve the conversion efficiency at each stages of irrigation water- soil water- plant water- photosynthesis- biomass- yield.The key to ensure stable and high yield of winter wheat in the North China Plain with deficit irrigation is to determine the critical water demand period under different environmental conditions. Overwintering water( usually is replaced by sowing water or in advance of reviving water),the first spring water and their irrigation interactive combination will make different environment effects,and affect the time and frequency of the other irrigation waters, various stages of growth and development of winter wheat,especially in reviving and the late growth. Finally the future research tasks of winter wheat scientific irrigation in the North China Plain are proposed,including( 1) Control mechanisms on temporal and amount dynamics of water demand for the growth and development of winter wheat;( 2) Processes of occurrence and development of winter wheat drought and its critical meteorological conditions for causing disasters;( 3) Vulnerability diagnosis and adaptive management of winter wheat responding to extreme drought events under climate change. These researches would provide reference for the development of measures to safety production of winter wheat in the North China Plain.

DOI

[14]
Liu Y, Qin Y, Ge Q et al., 2017. Reponses and sensitivities of maize phenology to climate change from 1981 to 2009 in Henan Province, China.Journal of Geographical Sciences, 27(9): 1072-1084.With the global warming,crop phenological shifts in responses to climate change have become a hot research topic.Based on the long-term observed agro-meteorological phenological data (1981-2009) and meteorological data,we quantitatively analyzed temporal and spatial shifts in maize phenology and their sensitivities to key climate factors change using climate tendency rate and sensitivity analysis methods.Results indicated that the sowing date was significantly delayed and the delay tendency rate was 9.0 d.10a-1.But the stages from emergence to maturity occurred earlier (0.1 d·10a1<e<1.7 d·10a-1,θ is the change slope of maize phenology).The length of vegetative period (VPL) (from emergence to tasseling) was shortened by 0.9 d·10a-1,while the length of generative period (GPL) (from tasseling to maturity) was lengthened by 1.7 d· 10a-1.The growing season length (GSL) (from emergence to maturity) was lengthened by 0.4 d·10a-1.Correlation analysis indicated that maize phenology was significantly correlated with average temperature,precipitation,sunshine duration and growing degree days (GDD) (p<0.01).Average temperature had significant negative correlation relationship,while precipitation,sunshine duration and growing degree days had significant positive correlations with maize phenology.Sensitivity analysis indicated that maize phenology showed different responses to variations in key climate factors,especially at different sites.The conclusions of this research could provide scientific supports for agricultural adaptation to climate change to address the global food security issue.

DOI

[15]
Liu Z, Li Z, Tang P et al., 2013. Change analysis of rice area and production in China during the past three decades.Journal of Geographical Sciences, 23(6): 1005-1018.AbstractRice’s spatial-temporal distributions, which are critical for agricultural, environmental and food security research, are affected by natural conditions as well as socio-economic developments. Based on multi-source data, an effective model named the Spatial Production Allocation Model (SPAM) which integrates arable land distribution, administrative unit statistics of crop data, agricultural irrigation data and crop suitability data, was used to get a series of spatial distributions of rice area and production with 10-km pixels at a national scale — it was applied from the early 1980s onwards and used to analyze the pattern of spatial and temporal changes. The results show that significant changes occurred in rice in China during 1980–2010. Overall, more than 50% of the rice area decreased, while nearly 70% of rice production increased in the change region during 1980–2010. Spatially, most of the increased area and production were in Northeast China, especially, in Jilin and Heilongjiang; most of the decreased area and production were located in Southeast China, especially, in regions of rapidly urbanization in Guangdong, Fujian and Zhejiang. Thus, the centroid of rice area was moved northeast approximately 230 km since 1980, and rice production about 320 km, which means rice production moved northeastward faster than rice area because of the significant rice yield increase in Northeast China. The results also show that rice area change had a decisive impact on rice production change. About 54.5% of the increase in rice production is due to the expansion of sown area, while around 83.2% of the decrease in rice production is due to contraction of rice area. This implies that rice production increase may be due to area expansion and other non-area factors, but reduced rice production could largely be attributed to rice area decrease.

DOI

[16]
Liu Z, Yang P, Tang H et al., 2015. Shifts in the extent and location of rice cropping areas match the climate change pattern in China during 1980-2010.Regional Environmental Change, 15(5): 919-929.Knowledge of cropping areas and climate change is crucial to understanding the causes and consequences of global land use change, and the response of rice areas to climate change is a hot topic to global food security. This study investigates the impacts of climate change on suitable areas for rice cultivation and how the actual cultivated area of rice has been altered in response to climate change during the past three decades. To understand whether the shifts in the extent and location of rice cropping areas match the pattern of climate change, the yearly climate data from 726 weather stations and the rice census data from 2,343 counties were employed to simulate the climatically suitable region for rice using the MaxEnt species distribution model, as well as to model the actual geographical distribution of rice using the spatial allocation production model in each decade. The results show that approximately 3.902% of all Chinese land area (roughly 3.702×0210 7 02ha) has become suitable for rice due to climate change over the past three decades, representing new potential areas for rice cultivation. Meanwhile, the actual rice cropping area has increased by approximately 18.202%, indicating that the extent and location of the rice expansion match the pattern of climate change. However, some spatial inconsistencies did exist between the actual rice area’s expansion and the climatically suitable region after 1990. Nevertheless, climate change was a possible factor impacting the geospatial and temporal changes of the actual rice cropping area in China.

DOI

[17]
Nelson E, Sander H, Hawthorne P et al., 2010. Projecting global land-use change and its effect on ecosystem service provision and biodiversity with simple models.Plos One, 5(12): e14327-e14327.As the global human population grows and its consumption patterns change, additional land will be needed for living space and agricultural production. A critical question facing global society is how to meet growing human demands for living space, food, fuel, and other materials while sustaining ecosystem services and biodiversity [1]. We spatially allocate two scenarios of 2000 to 2015 global areal change in urban land and cropland at the grid cell-level and measure the impact of this change on the provision of ecosystem services and biodiversity. The models and techniques used to spatially allocate land-use/land-cover (LULC) change and evaluate its impact on ecosystems are relatively simple and transparent [2]. The difference in the magnitude and pattern of cropland expansion across the two scenarios engenders different tradeoffs among crop production, provision of species habitat, and other important ecosystem services such as biomass carbon storage. For example, in one scenario, 5.2 grams of carbon stored in biomass is released for every additional calorie of crop produced across the globe; under the other scenario this tradeoff rate is 13.7. By comparing scenarios and their impacts we can begin to identify the global pattern of cropland and irrigation development that is significant enough to meet future food needs but has less of an impact on ecosystem service and habitat provision. Urban area and croplands will expand in the future to meet human needs for living space, livelihoods, and food. In order to jointly provide desired levels of urban land, food production, and ecosystem service and species habitat provision the global society will have to become much more strategic in its allocation of intensively managed land uses. Here we illustrate a method for quickly and transparently evaluating the performance of potential global futures.

DOI PMID

[18]
Sun J, Zhou G, Sui X, 2012. Climatic suitability of the distribution of the winter wheat cultivation zone in China.European Journal of Agronomy, 43(3): 77-86.Winter wheat is one of major grain crops in China. To scientifically map cropping patterns, it is very important to understand the area of its viable cultivation zone in China. Based on published data, geographical information, national climate data, and the MaxEnt model, the relationship between the distribution of the winter wheat cultivation zone and climate was established. The main indices controlling the distribution of the winter wheat cultivation zone were analyzed to reveal climatic suitability. The main controls on winter wheat distribution in China were: the negative accumulation of daily mean temperatures below 0°C during winter (i.e., negative accumulated temperature), annual mean extreme minimum temperatures, potential evapotranspiration, and annual precipitation. For winter wheat to safely survive the winter, the negative accumulated temperature should be higher than 61700°C, and the annual mean extreme minimum temperature should be higher than 6130°C. Climate suitability classification of the winter wheat cultivation zone was mapped, based on the MaxEnt probability distribution of winter wheat. Former studies indicated that the northeast boundary of the winter wheat cultivation zone is the south of Liaoning Province, and our study indicated that the northeast boundary of the winter wheat cultivation zone is the north of Heilongjiang Province; former studies indicated that the northwest boundary of the winter wheat cultivation zone is the south of Xinjiang Uygur Autonomous Region, and our study indicated that the northwest boundary of the winter wheat cultivation zone is the north of Xinjiang Uygur Autonomous Region. Our study describes a suitable winter wheat cultivation zone in China and the northern boundary of winter wheat cultivation, and it will be helpful for guiding the cultivation of Chinese winter wheat. Based on our climatic indices and their threshold determining the distribution of winter wheat, it will be helpful for gaining a scientific understanding of the effects of climate change.

DOI

[19]
Szumigalski A, Acker R V, 2016. Weed suppression and crop production in annual intercrops.Weed Science, 53(6): 813-825.Intercrops have been associated with greater yields and pest and weed control compared with sole crops. In this field experiment, we investigated agronomic performance and weed suppression by three crops090000spring wheat (Triticum aestivum), canola (Brassica napus), and field pea (Pisum sativum)090000alone and in all possible combinations at two sites in Manitoba, Canada, from 2001 to 2003. Crop treatments were planted at the same total density (144 seeds m0908082). The effects of the different crop combinations on weed recruitment and biomass and crop production were studied in both the presence and absence of in-crop herbicides. The agronomic performance of intercrop and sole crop treatments varied greatly across site-years. Some intercrop treatments (e.g., wheat090009canola and wheat090009canola090009pea) tended to produce greater weed suppression compared with sole component crops, indicating synergism among crops within intercrops with regard to weed suppression. Intercrop treatments resulted in land-equivalent ratios (LER) > 1 (i.e., overyielding) in both the presence and absence of in-crop herbicides. In the presence of herbicides, canola090009pea was the most consistent intercrop treatment in terms of overyielding for grain (mean LER = 1.22), whereas in the absence of herbicides, wheat090009canola090009pea produced the most consistent overyielding frequency for dry matter production (mean LER = 1.28). In the presence of herbicides, overall grain yield stability was greatest for the wheat090009canola090009pea intercrop treatment. Results indicate that annual intercrops can enhance both weed suppression and crop production compared with sole crops.

DOI

[20]
Tan J, Yang P, Liu Z et al., 2014. Spatio-temporal dynamics of maize cropping system in Northeast China between 1980 and 2010 by using spatial production allocation model. Journal of Geographical Sciences, 24(3): 397-410.Understanding crop patterns and their changes on regional scale is a critical requirement for projecting agro-ecosystem dynamics. However, tools and methods for mapping the distribution of crop area and yield are still lacking. Based on the cross-entropy theory, a spatial production allocation model (SPAM) has been developed for presenting spatio-temporal dynamics of maize cropping system in Northeast China during 1980-2010. The simulated results indicated that (1) maize sown area expanded northwards to 48 N before 2000, after that the increased sown area mainly occurred in the central and southern parts of Northeast China. Meanwhile, maize also expanded eastwards to 127 E and lower elevation (less than 100 m) as well as higher elevation (mainly distributed between 200 m and 350 m); (2) maize yield has been greatly promoted for most planted area of Northeast China, especially in the planted zone between 42 N and 48 N, while the yield increase was relatively homogeneous without obvious longitudinal variations for whole region; (3) maize planting density increased gradually to a moderately high level over the investigated period, which reflected the trend of aggregation of maize cultivation driven by market demand.

DOI

[21]
Verburg P H, Mertz O, Erb K H et al., 2013. Land system change and food security: Towards multi-scale land system solutions.Current Opinion in Environmental Sustainability, 5(5): 494-502.Land system changes are central to the food security challenge. Land system science can contribute to sustainable solutions by an integrated analysis of land availability and the assessment of the tradeoffs associated with agricultural expansion and land use intensification. A land system perspective requires local studies of production systems to be contextualised in a regional and global context, while global assessments should be confronted with local realities. Understanding of land governance structures will help to support the development of land use policies and tenure systems that assist in designing more sustainable ways of intensification. Novel land systems should be designed that are adapted to the local context and framed within the global socio-ecological system. Such land systems should explicitly account for the role of land governance as a primary driver of land system change and food production.

DOI PMID

[22]
Wang P, Zhang J, Xie D et al., 2012. Spatial characteristic analysis on planting area of winter wheat in China from 1961 to 2010.Journal of Natural Resources, 27(2): 215-224. (in Chinese)Winter wheat is one of the major grain crops in China.It plays an important role in China's grain productivity and food security.In this paper,daily meteorological factors(minimum temperature and snow depth) were collected at 553 weather stations from the year of 1961 to 2010.According to the diminishing law of vertical temperature,minimum temperature in 553 weather stations was disposed to get the value in sea-level for 50 years.The minimum temperature at sea-level was interpolated to get spatial distribution maps by using ArcGIS software.And then,the minimum temperature maps were restored to true value in the appropriate altitude by DEM data.Referring to the northern boundary of winter wheat planting condition inland and Northern Xinjiang Uygur Autonomous Region,planting probabilities of winter wheat were calculated grid by grid for every decade.Results show that planting areas of winter wheat are expanded toward north and west for the past 50 years.Meanwhile the probabilities of planting are increased for almost each grid.So this study can provide some information for winter wheat planting areas.

DOI

[23]
Wu W, Verburg P H, Tang H, 2014. Climate change and the food production system: Impacts and adaptation in China.Regional Environmental Change, 14(1): 1-5.No Abstract available for this article.

DOI

[24]
Xia T, Wu W, Zhou Q et al., 2016. Model-based analysis of spatio-temporal changes in land use in Northeast China.Journal of Geographical Sciences, 26(2): 171-187.Spatially explicit modeling techniques recently emerged as an alternative to monitor land use changes. This study adopted the well-known CLUE-S (Conversion of Land Use and its Effects at Small regional extent) model to analyze the spatio-temporal land use changes in a hot-spot in Northeast China (NEC). In total, 13 driving factors were selected to statistically analyze the spatial relationships between biophysical and socioeconomic factors and individual land use types. These relationships were then used to simulate land use dynamic changes during 1980–2010 at a 1 km spatial resolution, and to capture the overall land use change patterns. The obtained results indicate that increases in cropland area in NEC were mainly distributed in the Sanjiang Plain and the Songnen Plain during 1980–2000, with a small reduction between 2000 and 2010. An opposite pattern was identified for changes in forest areas. Forest decreases were mainly distributed in the Khingan Mountains and the Changbai Mountains between 1980 and 2000, with a slight increase during 2000–2010. The urban areas have expanded to occupy surrounding croplands and grasslands, particularly after the year 2000. More attention is needed on the newly gained croplands, which have largely replaced wetlands in the Sanjiang Plain over the last decade. Land use change patterns identified here should be considered in future policy making so as to strengthen local eco-environmental security.

DOI

[25]
Xu Z, Yu Z, Zhao J, 2013. Theory and application for the promotion of wheat production in China: Past, present and future.Journal of the Science of Food and Agriculture, 93(10): 2339.Food security is becoming a crucial concern worldwide. In this study, we focus on wheat – a staple crop in China – as a model to review its history, status quo and future scenarios, with regard to key production technologies and management practices for wheat production and associated food security issues since the new era in China: the post-1949 era. First, the dominant technologies and management practices over the past 6065years are reviewed. Secondly, we outline several key innovative technologies and their theoretical bases over the last decade, including (i) prohibiting excessively early senescence at a later growth stage to maintain viable leaves with higher photosynthetic capacity, (ii) postponing top dressing nitrogen application to balance carbon and nitrogen nutrition, and (iii) achieving both high yield and better grain quality mainly by increasing soil productivity and balancing the ratio of nutrient elements. Finally, concerns such as water shortages and excessive application of chemical fertilizers are presented. Nevertheless, under high negative conditions, including global warming, rapid population growth, decreasing amounts of arable land, increasing competition with cash crops and severe environmental pollution, we conclude that domestic food production will be able to meet Chinese demand in the mid to long term, because increasingly innovative technologies and improved management practices have been and may continue to be applied appropriately. 08 2013 Society of Chemical Industry

DOI PMID

[26]
Yin X, Jabloun M, Olesen J E et al., 2016. Effects of climatic factors, drought risk and irrigation requirement on maize yield in the Northeast Farming Region of China.Journal of Agricultural Science, firstview(7): 1-19.Drought risk is considered to be among the main limiting factors for maize (Zea mays L.) production in the Northeast Farming Region of China (NFR). Maize yield data from 44 stations over the period 1961 2010 were combined with data from weather stations to evaluate the effects of climatic factors, drought risk and irrigation requirement on rain-fed maize yield in specific maize growth phases. The maize growing season was divided into four growth phases comprising seeding, vegetative, flowering and maturity based on observations of phenological data from 1981 to 2010. The dual crop coefficient was used to calculate crop evapotranspiration and soil water balance during the maize growing season. The effects of mean temperature, solar radiation, effective rainfall, water deficit, drought stress days, actual crop evapotranspiration and irrigation requirement in different growth phases were included in the statistical model to predict maize yield. During the period 1961 2010, mean temperature increased significantly in all growth phases in NFR, while solar radiation decreased significantly in southern NFR in the seeding, vegetative and flowering phases. Effective rainfall increased in the seeding and vegetative phases, reducing water deficit over the period, whereas decreasing effective rainfall over time in the flowering and maturity phases enhanced water deficit. An increase in days with drought stress was concentrated in western NFR, with larger volumes of irrigation needed to compensate for increased dryness. The present results indicate that higher mean temperature in the seeding and maturity phases was beneficial for maize yield, whereas excessive rainfall would damage maize yield, in particular in the seeding and flowering phases. Drought stress in any growth stage was found to reduce maize yield and water deficit was slightly better than other indicators of drought stress for explaining yield variability. The effect of drought stress was particularly strong in the seeding and flowering phases, indicating that these periods should be given priority for irrigation. The yield-reducing effects of both drought and intense rainfall illustrate the importance of further development of irrigation and drainage systems for ensuring the stability of maize production in NFR.

DOI

[27]
You L, Markw R, Stanley W et al., 2009. Impact of growing season temperature on wheat productivity in China.Agricultural and Forest Meteorology, 149(6/7): 1009-1014.Climate change continues to have major impact on crop productivity all over the world. Many researchers have evaluated the possible impact of global warming on crop yields using mainly indirect crop simulation models. Here we use a 1979–2000 Chinese crop-specific panel dataset to investigate the climate impact on Chinese wheat yield growth. We find that a 1 °C increase in wheat growing season temperature reduces wheat yields by about 3–10%. This negative impact is less severe than those reported in other regions. Rising temperature over the past two decades accounts for a 4.5% decline in wheat yields in China while the majority of the wheat yield growth, 64%, comes from increased use of physical inputs. We emphasize the necessity of including such major influencing factors as physical inputs into the crop yield-climate function in order to have an accurate estimation of climate impact on crop yields.

DOI

[28]
You L, Wood S, 2006. An entropy approach to spatial disaggregation of agricultural production.Agricultural Systems, 90(1-3): 329-347.While agricultural production statistics are reported on a geopolitical – often national – basis we often need to know the status of production or productivity within specific sub-regions, watersheds, or agroecological zones. Such re-aggregations are typically made using expert judgments or simple area-weighting rules. We describe a new, entropy-based approach to making spatially disaggregated assessments of the distribution of crop production. Using this approach, tabular crop production statistics are blended judiciously with an array of other secondary data to assess the production of specific crops within individual ‘pixels’ – typically 25–100 square kilometers in size. The information utilized includes crop production statistics, farming system characteristics, satellite-derived land cover data, biophysical crop suitability assessments, and population density. An application is presented in which Brazilian state level production statistics are used to generate pixel level crop production data for eight crops. To validate the spatial allocation we aggregated the pixel estimates to obtain synthetic estimates of municipality level production in Brazil, and compared those estimates with actual municipality statistics. The approach produced extremely promising results. We then examined the robustness of these results compared to short-cut approaches to allocating crop production statistics and showed that, while computationally intensive, the cross-entropy method does provide more reliable estimates of crop production patterns.

DOI

[29]
You L, Wood S, Wood-Sichra U., 2009. Generating plausible crop distribution maps for Sub-Saharan Africa using a spatially disaggregated data fusion and optimization approach.Agricultural Systems, 99(2/3): 126-140.Large gaps exist in our knowledge of the current geographic distribution and spatial patterns of performance of crops, and these gaps are unlikely to be filled. In addition, even the spatial scale of many sub-national statistical reporting units remains too coarse to capture patterns of spatial heterogeneity in crop production and performance that are likely important from a policy and investment planning perspective. To fill these spatial data gaps we have developed and applied a meso-scale model for the spatial disaggregation of crop production. Using a cross-entropy approach, our model makes plausible pixel-scale assessments of the spatial distribution of crop production within geopolitical units (e.g. countries or sub-national provinces and districts). The pixel-scale allocations are performed through the compilation and judicious fusion of relevant spatially-explicit data, including: production statistics, land use data, satellite imagery, biophysical crop uitability assessments, population density, and distance to urban centers, as wells as any prior knowledge about the spatial distribution of individual crops. The development, application and validation of a prior version of the model in Brazil strongly suggested that our spatial allocation approach shows considerable promise. This paper describes efforts to generate crop distribution maps for Sub-Saharan Africa for the year 2000 using this approach. Apart from the empirical challenge of applying the approach across many countries, the application includes three significant model improvements: (1) the ability to cope with production data sources that provided different degrees of spatial disaggregation for different crops within a single country; (2) the inclusion of a digital map of irrigation intensity as a new input layer; and (3) increased disaggregation of rainfed production systems. Applying the modified spatial allocation model we generated 5 min (approximately 10 km) resolution grid maps for the following 20 major crops across Sub-Saharan Africa: barley, dry beans, cassava, cocoa, coffee, cotton, cow peas, groundnuts, maize, millet, oil palm, plantain, potato, rice, sorghum, soybeans, sugar cane, sweet potato, wheat, and yam. The approach provides plausible results but also highlights the need for much more reliable input data for the region, especially with regard to sub-national production statistics and satellite-based estimates of cropland extent and intensity.

DOI

[30]
Zhang L, Wu W, Yang P et al., 2013. Temporal and spatial changes in crop patterns of Binxian County in Heilongjiang Province.Scientia Agricultura Sinica, 46(15): 3227-3237. (in Chinese)Objective】 Crop choice analysis from the individual farmer’s perspective requires a fundamental exploration on spatial-temporal characteristics of local crop pattern dynamics.This study primarily investigated such characteristics at Binxian County in order to provide insights to the subsequent driving force analysis of crop structure and pattern dynamics.【Method】 By using Binxian County Statistical Dataset 1996-2000,mathematical statistics and GIS-based spatial analysis methods were adopted to explore the spatial-temporal characteristics of major grain crops and cash crops in the local agricultural land system.【Result】 Analysis shows that the total cropland sowing area increased by 22.86% from 1996 to 2010,which is mainly contributed by the increase of grain crops.The sowing area of grain crops expanded by 32.80%,while the cash crops shrank by 52.84%.The ratio of grain crops to cash crops raised from 88:12 to 96:4.Maize area received a steadily increase by 73.82%,while by contrast,soybean and rice decreased by 1.05% and 29.78%,respectively.Although maize area distributed uniformly across the county,soybean area mainly distributed at the southeast and rice area mainly located at the north and west of the region.【Conclusion】 The exploration on spatial-temporal characteristics of local crop pattern dynamics is necessary for the subsequent driving force analysis and it will help to provide scientific ways to adjust crop structure and to increase grain productivity.

[31]
Zhao J, Guo J, 2013. Possible trajectories of agricultural cropping systems in China from 2011 to 2050.American Journal of Climate Change, 2(3): 191-197.

DOI

[32]
Zhao J, Guo J, Xu Y et al., 2015. Effects of climate change on cultivation patterns of spring maize and its climatic suitability in Northeast China.Agriculture Ecosystems and Environment, 202: 178-187.To learn the effects of climate change on cultivation patterns of spring maize and its suitability will benefit the strategic decisions for future agricultural adaptation. In this paper, based on the daily data from 68 meteorological stations and 82 agro-meteorological observation stations in Northeast China between 1961 and 2010, the cultivation pattern of spring maize and its climatic suitability in Northeast China were investigated. The agricultural climatic suitability theory was applied. The specific growth phases of spring maize that were most sensitive to environmental limitations were further divided into four stages: from germination to emergence, from emergence to jointing, from jointing to tasseling, and from tasseling to maturity. The average resource suitability index (Isr) was established to evaluate the effects. Higher values of Isr indicate a higher degree of climatic resource suitability. Over the past five decades, the northern planting boundaries of different maturities (late, medium-late, medium, medium-early and early) of spring maize varieties in Northeast China all markedly extended northward and eastward. Of all the varieties, the medium-late maturity variety had the most expanded planting area. This further illustrated the importance of promoting medium-late range heat-tolerant cultivars of spring maize in reducing the unfavorable effect of climate change in the near future in Northeast China. In addition, the most significant extension was found in the early 21st century. Moreover, the southern planting boundaries of unsuitable planting spring maize areas continually compressed northward from the Tonghe County of Heilongjiang Province (128°49′, 46°21′) to the Huma County of Heilongjiang Province (124°11′, 51°26′). Climate change affected not only the planting patterns of spring maize, but also the climatic suitability of spring maize. Significant temporal and spatial changes of Isr from 1961 to 2010 were found. The Isr showed increasing trends, which increased by 0.19 in Heilongjiang Province, 0.16 in Jilin Province and 0.12 in Liaoning Province. Spatial differences of Isr were obvious, with high values shifting northeastward over the past 50 years, indicating more efficient suitability of agricultural climatic resources in Northeast China.

DOI

[33]
Zheng C, Guo J, Zhao J, 2017. Impacts of future climate change on agroclimatic resources in Northeast China.Journal of Geographical Sciences, 27(9): 1044-1058.In this study,the spatial distribution and changing trends of agricultural heat and precipitation resources in Northeast China were analyzed to explore the impacts of future climate changes on agroclimatic resources in the region.This research is based on the output meteorological data from the regional climate model system for Northeast China from 2005 to 2099,under low and high radiative forcing scenarios RCP4.5 (low emission scenario) and RCP8.5 (high emission scenario) as proposed in IPCC AR5.Model outputs under the baseline scenario,and RCP4.5 and RCP8.5 scenarios were assimilated with observed data from 91 meteorological stations in Northeast China from 1961 to 2010 to perform the analyses.The results indicate that:(1) The spatial distribution of temperature decreases from south to north,and the temperature is projected to increase in all regions,especially under a high emission scenario.The average annual temperature under the baseline scenario is 7.70℃,and the average annual temperatures under RCP4.5 and RCP8.5 are 9.67℃ and 10.66℃,respectively.Other agricultural heat resources change in accordance with temperature changes.Specifically,the first day with temperatures ≥10℃ arrives 3 to 4 d earlier,the first frost date is delayed by 2 to 6 d,and the duration of the growing season is lengthened by 4 to 10 d,and the accumulated temperature increases by 400 to 700℃·d.Water resources exhibit slight but not significant increases.(2) While the historical temperature increase rate is 0.35℃/10a,the rate of future temperature increase is the highest under the RCP8.5 scenario at 0.48℃/10a,compared to 0.19℃/10a under the RCP4.5 scenario.In the later part of this century,the trend of temperature increase is significantly faster under the RCP8.5 scenario than under the RCP4.5 scenario,with faster increases in the northern region.Other agricultural heat resources exhibit similar trends as temperature,but with different specific spatial distributions.Precipitation in the growing season generally shows an increasing but insignificant trend in the future,with relatively large yearly fluctuations.Precipitation in the eastern region is projected to increase,while a decrease is expected in the western region.The future climate in Northeast China will change towards higher temperature and humidity.The heat resource will increase globally,however its disparity with the change in precipitation may negatively affect agricultural activities.

DOI

Outlines

/