Special Issue: Land system dynamics: Pattern and process

Spatiotemporal changes of cropping structure in China during 1980-2011

  • LIU Zhenhuan 1 ,
  • YANG Peng , 2, * ,
  • WU Wenbin 2 ,
  • YOU Liangzhi 3
Expand
  • 1. School of Geography and Planning, Sun Yat-sen University, Guangzhou 510275, China
  • 2. Key Laboratory of Agricultural Remote Sensing (AGRIRS), Ministry of Agriculture/Institute of Agri-cultural Resources and Regional Planning, Chinese Academy of Agricultural Sciences, Beijing 100081, China
  • 3. International Food Policy Research Institute, Washington DC 20006, USA
*Corresponding author: Yang Peng (1975-), Professor, specialized in global change and agricultural remote sensing. E-mail:

Author: Liu Zhenhuan (1982-), Associate Professor, specialized in landscape ecology and land use; global change and agricultural remote sensing. E-mail: zhenhuanliu@gmail.com

Received date: 2017-05-01

  Accepted date: 2017-10-15

  Online published: 2018-11-20

Supported by

National Natural Science Foundation of China, No.41571172

Ministry of Finance of China through the Non-Profit National Research Institute, No.2017-CAAS-30

Copyright

Journal of Geographical Sciences, All Rights Reserved

Abstract

Understanding the spatial and temporal variations of cropping systems is very important for agricultural policymaking and food security assessment, and can provide a basis for national policies regarding cropping systems adjustment and agricultural adaptation to climate change. With rapid development of society and the economy, China’s cropping structure has profoundly changed since the reform and opening up in 1978, but there has been no systematic investigation of the pattern, process and characteristics of these changes. In view of this, a crop area database for China was acquired and compiled at the county level for the period 1980-2011, and linear regression and spatial analysis were employed to investigate the cropping structure type and cropping proportion changes at the national level. This research had three main findings: (1) China’s cropping structure has undergone significant changes since 2002; the richness of cropping structure types has increased significantly and a diversified-type structure has gradually replaced the single types. The single-crop types—dominated by rice, wheat or maize—declined, affected by the combination of these three major food crops in mixed plantings and conversion of some of their planting area to other crops. (2) In the top 10 types, 82.7% of the county-level cropping structure was rice, wheat, maize and their combinations in 1980; however, this proportion decreased to 50.7% in 2011, indicating an adjustment period of China’s cropping structure. Spatial analysis showed that 63.8% of China’s counties adjusted their cropping structure, with the general change toward reducing the main food types and increasing fruits and vegetables during 1980-2011. (3) At the national level, the grain-planting pattern dominated by rice shifted to coexistence of rice, wheat and maize during this period. There were significant decreasing trends for 47% of rice, 61% of wheat and 29.6% of maize cropping counties. The pattern of maize cropping had the most significant change, with the maize proportion decreasing in the zone from northeastern to southwestern China during this period. Cities and their surroundings were hotspots for cropping structural adjustment. Urbanization has significantly changed cropping structure, with most of these regions showing rapid increases in the proportion of fruit and vegetables. Our research suggests that the policy of cropping structural adjustment needs to consider geographical characteristics and spatial planning of cropping systems. In this way, the future direction of cropping structural adjustment will be appropriate and scientifically based, such as where there is a need to maintain or increase rice and wheat cropping, increase soybean and decrease maize, and increase the supply of fruit and vegetables.

Cite this article

LIU Zhenhuan , YANG Peng , WU Wenbin , YOU Liangzhi . Spatiotemporal changes of cropping structure in China during 1980-2011[J]. Journal of Geographical Sciences, 2018 , 28(11) : 1659 -1671 . DOI: 10.1007/s11442-018-1535-4

1 Introduction

Spatial and temporal information regarding cropping structure is an important basis for agricultural geography and sustainable agricultural development (Tang et al., 2010), especially in research on the terrestrial carbon emissions of agro-ecosystems, impact of global change on regional agricultural production, and dynamic mechanisms and simulation models of crop patterns (Waha et al., 2013; Liu et al., 2014; Tang et al., 2015). A sustainable cropping structure is beneficial for food security, agricultural resource utility and conservation (You, 2016). Cropping structure is based on the sown area of crops and consists of the ratio of each crop’s sown area to the total sown area, and can be used to characterize historical variations, which can inform policymaking regarding the agriculture planting structure (Liang et al., 2008) and guide agriculture adaptation to climate change (Huang et al., 2012; Field et al., 2014; Guo, 2015; Zhou, 2015). Cropping structural adjustment is a part of macro-agricultural policies at the national level. Most previous cropping structure studies have been more concerned with policymaking, and few have focused on geographical characteristics of cropping structure (Liang et al., 2006). With the rapid development of society and economy, China’s cropping structure has profoundly changed since the reform and opening up in 1978, but the pattern, process and characteristics of these changes have not been systematically shown. It is necessary to analyze the spatial and temporal changes of cropping structure to assess policies concerning food security and agricultural management (Hu et al., 2015).
Cropping structure is affected by natural conditions and socioeconomic changes and is characterized by spatial and temporal dynamics (Liang, 2006; Liu et al., 2013). Cropping structure contains information on one or more crops regarding continuous cropping, rotation, intercropping and other cropping patterns formed by the combination of cropping types (Hu et al., 2015). There are two types of data sources for cropping structure information: annual census data based on surveys from agriculture departments and remote sensing techniques for crop area monitoring (Wu et al., 2014). Remote sensing is increasingly being applied for quick surveys of cropping structure because of its timeliness and high resolution, and it can provide timely and accurate information at a fine scale (Wu et al., 2004; Xu et al., 2007; Cai and Cui, 2009; Huang et al., 2013; Liu et al., 2014). With advances in remote sensing technology, the monitoring of changes in cropping patterns in small regions has become more effective (Leff et al., 2004). However, there is limited capacity of remote sensing for large-scale monitoring, such as at the national or continental scale, because of cost and the short historical record. Compared to remote sensing data, administrative data often lags in time and its spatial resolution is fixed to the administrative boundary; however, such statistics have advantages at the national scale for quantifying the spatiotemporal variation of cropping pattern and are useful for analyzing historical changes in cropping structure (Li et al., 2008; Wang and Wang, 2015). Previous studies of cropping structure have focused on cropping structural adjustment policies, such as on the scientific way to adapt cropping structure to climate change (Li and Xu, 2017), cropping diversity (Aguilar et al., 2015; Hijmans et al., 2016; Deng et al., 2017) and cropping patterns (Huang et al., 2010; Xia et al., 2014; Zhang et al., 2017). The spatial and temporal changes of cropping structure is one component of cropping pattern studies, which describes cropping structure as crop type, composition and spatial distribution characteristics by use of cropping structure indicators in a specific region (Tang et al., 2010; Hu et al., 2015). The trend of crop types and cropping proportion, which are the most sensitive indicators of cropping structure used to evaluate adjustment policies, have not been yet considered by policy-makers (Liang, 2008). In order to quantify these cropping structure trends, we employed linear regression to analyze the trend of historical changes for different crop proportions at the county level in China. To reveal the pattern of cropping structure, a spatial overlay analysis was used to determine the counties with changed cropping combinations and their spatial characteristics.
China’s cropping structure was previously the result of the long-term implementation of planned economy. Since the reforms, the cropping structure accompanying economic development has been adjusted and optimized (Ban, 2000). Rapid industrial and urban development has led to a decrease in the proportion of agriculture in the economy, as well as an adjusted cropping structure. China’s agriculture has made great achievements, but further development faces the problem of deep cropping structural adjustments, especially concerning irrational proportions of agricultural production. Some cropping growing areas are dealing with environmental pollution and pest problems, which are large pressures on China’s new round of cropping structural adjustments (Luo, 2015; You, 2016). Therefore, it is necessary to summarize the characteristics of cropping structure during the past 30 years to aid the new round of cropping structural adjustments. The main objectives of this research are to (1) analyze the changes and trends of cropping structure in China over the past three decades, (2) analyze the adjusted characteristics of cropping structure at the county level over the past three decades and clarify the geographical difference in cropping structure at the national level, and (3) understand the trend of cropping proportions and provide a basis of geographical clustering information for planning in the main agricultural regions. The above objectives differ from direct policy recommendations for the national cropping structural adjustment; we recommend more focus should be given to understanding the geographical characteristics of cropping structure, which may provide a scientific basis for cropping structural adjustment and food security policy.

2 Data and methods

2.1 Data source

(1) The county’s cropping census database. Data at the county level for 1980-2011 were obtained from the Ministry of Agriculture and included each county’s sown area data (http://www.zzys.moa.gov.cn/). Because many of the county boundaries changed several times during this period, the boundaries were merged into 2341 counties based on national county boundary data. Thirty-eight crop species were combined into 11 categories: rice, wheat, maize, soybean, potato, edible oil, fiber, sugar, cotton, vegetables and fruits. This comprised a dataset covering 32 years, 2341 counties and 11 crop types.
(2) Cropping type. In this research, the cropping type is defined as one of the crop species area as a percentage of the total crop area, which can be divided into two types: (i) if one crop’s percentage is over 30%, this crop can be accounted for by the cropping type. The combination is usually no more than three crops. For example, a county’s crop sown area ranks on the top three, and only rice accounting for all cropping areas exceeds 30%. This combination at the county level is the rice type. If two or three crops exceed 30% of the area, the combinations can be called the rice-maize type, rice-wheat-soybean type and so on. (ii) If the proportions of none of the crops exceed 30%, then the top three crops are selected in combination. For example, if a county produces rice at 25%, wheat at 24%, soybean at 19% and maize at 17%, the cropping type combination can be defined as rice-wheat-soybean. The combination of cropping type needs to consider the rank and proportion of crops. All the three crops can exist with variations in proportion in different counties, but if the crop is included in the combination, it is considered to be the same type. For example, rice-wheat-soybean is equivalent to wheat-soybean-rice or soybean-wheat-rice, and so on.

2.2 Methods

2.2.1 Trends of cropping type
To investigate the changes in cropping structure at the national level, this study defined a cropping type richness index (Rt), which is the ratio of the cropping type occurring within a year to the types occurring in all years during the study stage. The expression is as follows:
${{R}_{t}}=\frac{{{m}_{t}}}{{{m}_{\max }}}$ (1)
where Rt has a range of 0-1 and with a larger value meaning more abundance, mt is the amount for one year of the national cropping type and mmax is the total amount of all types of combinations within the study period.
2.2.2 Trends of crop proportion
To study the spatial and temporal characteristics of the cropping area and changes over the past 30 years, the slope coefficient (S) was calculated by least squares regression to show the trends of the proportion of crops in 2341 counties. When S < 0, this indicates that crops in these counties show a decreasing trend, and S > 0 indicates an increasing trend; and if the test value (p-value) has a significance level of 0.05 (p < 0.05), this is considered to be a significant trend. S is calculated as follows:
$S=\frac{n\sum\limits_{t=1}^{n}{t{{X}_{tj}}-\left( \sum\limits_{t=1}^{n}{t} \right)\left( \sum\limits_{t=1}^{n}{{{X}_{tj}}} \right)}}{n\sum\limits_{t=1}^{n}{{{t}^{2}}-{{\left( \sum\limits_{t=1}^{n}{t} \right)}^{2}}}}$ (2)
where t is the study year time period, n is the number of years and Xtj is the ratio of crops for year j. We analyzed the changes in proportions of crops over the past 30 years.

3 Results

3.1 Annual trends of cropping type

Using the definition of cropping type, there was a total of 182 types during the past 30 years. Before 2000, the number of types was 21-54, and Rt was 0.12-0.30; and after 2002, the corresponding values were 84-106 and over 0.52. The trends of Rt showed an adjustment during 2000-2002, indicating that China’s cropping types underwent significant changes and a sharp increase in richness of types. More diverse types have gradually replaced the simple types (Figure 1a). Thus, China’s crop types underwent a shift to crop combinations, which have led to the main food crop pattern transforming to food and economic crop combinations.
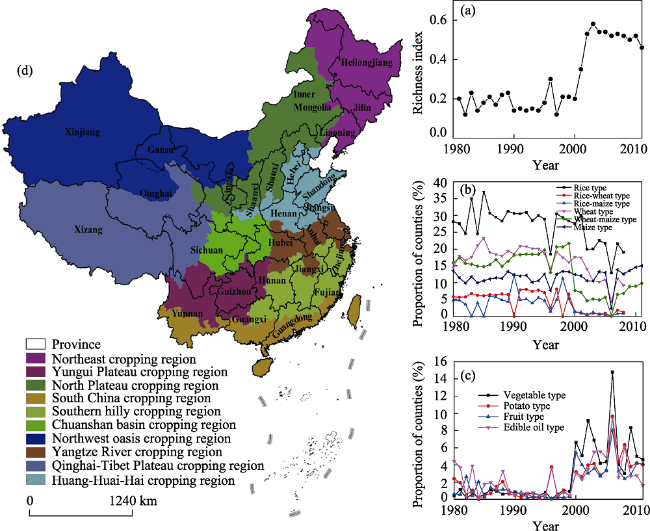
Figure 1 Study area and the richness and proportion of counties concerning cropping types in China during 1980-2011: (a) richness trend of cropping types, (b) and (c) trend of counties’ proportions for specific cropping type, (d) study area and cropping zonal region
The eight major cropping types in China were rice, rice-wheat, rice-maize, wheat, wheat-maize, maize, vegetable and fruit types. Figure 1b shows the trend of the three major food crops and their combinations. The three dominant single types of food crops decreased. The proportion of counties dominated by the rice type fell from the maximum of 37.5% in 1985 to 19.0% in 2008, and the proportion of counties dominated by the wheat type decreased from 23.3% in 1985 to 8.8% in 2011. The maize type was relatively stable around 10-14%. The wheat-maize type remained within 15-20% before 2002 and sharply decreased to 10% thereafter; the rice-wheat had a similar trend of 6% before 2002 and below 2% afterward. The rice-maize type was approximately 5% in 2002, but less than 1% after 2002. Figure 1c shows the trend of the economic cropping types. The proportions of vegetable, potato, fruit and oil types were very low before 2000, but were more than 2% after 2002.

3.2 Geographical variation of cropping type

Over nearly 30 years, 16 crops made up the top ten major types (Table 1). In 1980, 82.7% of China’s crop types were rice, wheat, maize and their combinations and the top 10 of the country’s cropping types at the county level accounted for 93.3% of all types, indicating that the three food crops were the major plantings. In 1990, the proportion of the top 10 rose slightly to 95.0% of all types; compared to 1980, vegetable and fruit replaced soybean and cotton types in the top 10. In 2000, the top 10 ranked of the cropping structure types decreased by nearly 10%, reflecting that 209 counties changed their planting structure. In 2002, the country’s cropping structure underwent sharp changes, with a transition period during which the food crop proportion decreased. The main food type in the top 10 for all counties represented only 50.7%. The number of counties of vegetable-type rose to be ranked fourth and accounted for 9.1%. In 2011, there were 1699 counties in the top 10, accounting for only 72.6% of the total counties. In 1990, this number decreased in 524 counties (22.4%). In this period, food crops and their combination with economic crop types appeared, such as the rice-vegetable type. After 2002, China’s cropping types tended to be diverse, not only related to the adjustment of the national agricultural policy but also due to farmers’ choices; for example, the types of food and fruit or vegetable crops surrounding urban areas were a consequence of urbanization.
Table 1 Proportions and amounts of cropping types in China during 1980-2011
1980 1990 2000
Rank Cropping type Counties Percentage (%) Cropping type Counties Percentage (%) Cropping type Counties Percentage (%)
1 Rice 659 28.2 Rice 716 30.6 Rice 646 27.6
2 Wheat-maize 373 15.9 Wheat 435 18.6 Wheat 413 17.6
3 Wheat 340 14.5 Wheat-maize 426 18.2 Maize 291 12.4
4 Maize 318 13.6 Maize 289 12.3 Wheat-maize 180 7.7
5 Rice-wheat 136 5.8 Rice-maize 288 12.3 Vegetable 155 6.6
6 Rice-maize 111 4.7 Vegetable 20 0.9 Fruit 127 5.4
7 Edible oil 104 4.4 Fruit 15 0.6 Potato 75 3.2
8 Soybean 62 2.6 Edible oil 14 0.6 Edible oil 71 3
9 Potato 56 2.4 Potato 11 0.5 Wheat-oil 39 1.7
10 Cotton 25 1.1 Rice-wheat-maize 9 0.4 Rice-oil 37 1.6
11 Others 157 6.7 Others 118 5 Others 307 13.1
Rank 2001 2002 2011
Cropping type Counties Percentage (%) Cropping type Counties Percentage (%) Cropping type Counties Percentage (%)
1 Rice 703 30.0 Rice 466 19.9 Rice 468 20
2 Wheat 409 17.5 Wheat 330 14.1 Maize 351 15
3 Maize 282 12.0 Maize 247 10.6 Wheat-maize 230 9.8
4 Wheat-maize 167 7.1 Vegetable 214 9.1 Wheat 207 8.8
5 Vegetable 119 5.1 Wheat-maize 108 4.6 Vegetable 108 4.6
6 Fruit 94 4.0 Potato 93 4 Fruit 97 4.1
7 Potato 61 2.6 Edible oil 82 3.5 Potato 94 4
8 Edible oil 54 2.3 Fruit 71 3 Rice-vegetable 59 2.5
9 Wheat-oil 41 1.8 Soybean 51 2.2 Cotton 44 1.9
10 Rice-maize 28 1.2 Rice-wheat-maize 36 1.5 Rice-wheat 41 1.8
11 Others 383 16.4 Others 643 27.5 Others 642 27.4
The spatial distribution of cropping types within counties and over five time periods is shown in Figure 2. From the perspective of changes in crop type, 63.8% of the counties (1494) changed their type during 1980-2011. This trend entailed reducing the proportion of major food crops while increasing the proportion of economic crops and fruit and vegetable crops. These counties were mainly distributed in China’s coastal and western regions; and the counties in which crop type was unchanged were in central China (Figure 2f). Only approximately one-third of the counties did not change their cropping type, with 385 of these of rice type, 105 of wheat type, 160 of maize type and 130 of wheat-maize type; however, the proportion of each dominant crop still had a decreasing trend.
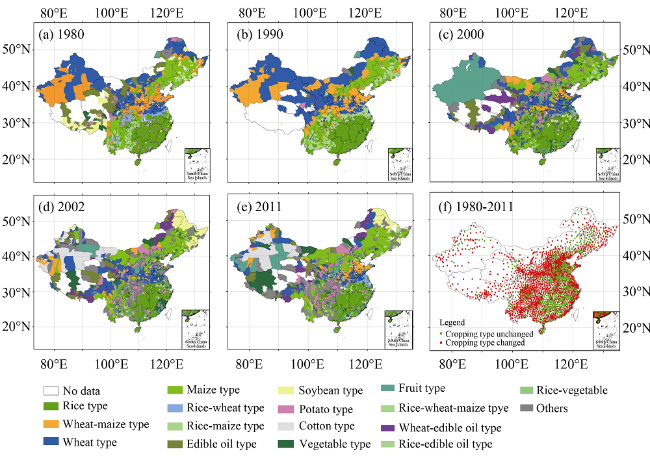
Figure 2 Spatial distribution of the dominant cropping types in China: (a) 1980, (b) 1990, (c) 2000, (d) 2002, (e) 2011, (f) county-level changes of cropping type
The number of counties in which the rice is the major crop type is declining, and the rice type is mainly distributed in 11 provinces of southern China. Most provinces have many counties, where their proportions have reduced, especially in the Yangtze River Delta, Pearl River Delta and Fujian urbanized areas. The maize type was mainly distributed from northeast to southwest. The wheat type was mainly distributed in northern Shandong, Xinjiang, Gansu, Ningxia, Inner Mongolia, central Henan, northern and southern Anhui, and Shandong in 1980; however, there was a relative decline in Henan, Anhui, and northern and part of southern Shandong in 2011. In 1980, the wheat-maize combination was mainly distributed in southern Hebei, central and northern Shandong, northern Henan, Shanxi, central Xinjiang and central, southern and northern Shaanxi; and this shrank in north-central Shandong, southern Hebei, northern Henan and southern Shanxi in 2011.

3.3 Spatial distribution trends of crop proportions

Figure 3 and Table 2 show the annual trends of crop proportions over the past 30 years. At the county level, the three staple food crop proportions tended to decrease; the 47% of rice, 61% of wheat and 29.6% of maize-planting counties significantly decreased (p < 0.05). At this stage, comparing the crop type change distribution (Figure 2), the pattern dominated by rice has changed to coexisting patterns of rice, wheat and maize and the proportion of other crops significantly increased.
Table 2 Statistics regarding the annual trends of cropping proportions in China during 1980-2011
Crop County number No-trends Increasing trends Decreasing trends Significant increasing trends
(p < 0.05)
Significant increasing trends
(p < 0.05)
Counties Percentage Counties Percentage Counties Percentage Counties Percentage Counties Percentage
Rice 2341 449 19.2 390 16.7 1502 64.2 46 2.0 1101 47.0
Wheat 2341 178 7.6 217 9.3 1946 83.1 20 0.9 1429 61.0
Maize 2341 88 3.8 1085 46.3 1168 49.9 417 17.8 693 29.6
Soybean 2341 179 7.6 1778 76.0 384 16.4 1177 50.3 91 3.9
Fiber 2341 1776 75.9 247 10.6 318 13.6 113 4.8 181 7.7
Cotton 2341 1353 57.8 718 30.7 270 11.5 394 16.8 111 4.7
Vegetable 2341 17 0.7 2271 97.0 53 2.3 2054 87.7 2 0.1
Potato 2341 124 5.3 1983 84.7 234 10.0 1392 59.5 40 1.7
Fruit 2341 104 4.4 2071 88.5 166 7.1 1656 70.7 40 1.7
Sugar 2341 1040 44.4 572 24.4 729 31.1 57 2.4 18 0.8
Edible oil 2341 34 1.5 2071 88.5 236 10.1 1627 69.5 17 0.7
Figure 3 Spatial distribution of significant annual trends of cropping proportion in China during 1980-2011 (p < 0.05): (a) rice, (b) maize, (c) wheat, (d) soybean, (e) fruit, (f) vegetable, (g) potato, (h) edible oil, (i) cotton, (j) sugar, (k) fiber
Regions with a significant reduction in rice proportion and rice type were mainly concentrated in Fujian, Guangdong, Zhejiang and other coastal provinces, whereas traditional rice-growing areas showed decreases in proportion but not in crop type, such as Jiangxi, Hunan, southern Anhui, Sichuan Basin and Chongqing. Regions with a significant reduction in the wheat-growing proportion and type were concentrated in the Loess Plateau region, including southern Gansu, Ningxia and the northern Shaanxi plateau to the Shanxi area; and the traditional wheat-growing region in the North China Plain also significantly decreased but did not change crop type. Regions with a significant reduction in maize proportion and type covered the China maize belt formation from northeast to southwest (Figure 3b); cropping type mainly changed in northern Yunnan, southern Sichuan, southern Shaanxi, western Hubei, Beijing, Tianjin and the northeastern plains area; and approximately 650 counties from northern Heilongjiang to southwestern Yunnan reduced their maize proportion.
By contrast, economic crops, such as soybean, vegetable, potato, fruit and oil crops showed an increasing trend with 50.3% of soybean, 87.7% of vegetable, 59.5% of potato, 70.7% of fruit and 69.5% of oil cropping counties showing significantly increasing proportions (p < 0.05) (Figure 3). The increasing proportion of soybean was mainly in a few northeast China counties, such as central Heilongjiang and southern Jilin. Significant increases in the proportion of vegetables were concentrated in coastal regions, including Beijing, Tianjin, the Yangtze River Delta and the Pearl River Delta, and were closely related to urban demand - the others were located in the Shandong Peninsula, northern Jiangsu and northeast Guangxi. Significant increases in potato were mainly in central Inner Mongolia, southern Ningxia, Gansu and mountain regions in the five southwest provinces. Significant increases in fruit were mainly in Yantai, Beijing, the Loess Plateau, Xinjiang, Guangdong and Fujian. There were significant increases in the proportion of oil crops concentrated in southern Tibet, northern Xinjiang, eastern Qinghai, Hubei and Anhui.
In addition, cotton, sugar and fiber crops were regional crops; 42.2% of cotton, 55.6% of sugar and 24.2% of fiber showed significant spatial aggregation; 30.7% of cotton and 24.4% of sugar tended to significantly increase; and 13.6% of fiber tended to significantly decrease. Cotton significantly increased in Xinjiang, the North China Plain and the Yangtze River Plain (Figure 3i). Fiber is found along the Yangtze River. Sugar is scattered in Yunnan, Guangxi, Guangdong and Fujian (Figure 3k).

3.4 Characteristics of cropping structure in urban regions

To understand the impact of urbanization on regional cropping structure, the crop types of 717 counties surrounding 660 cities were used to analyze the trends of crop types and their proportions. Overall, the crop proportions in urban and surrounding areas were divided into two types of changes: The first was the crop sown area shrinking rapidly over the past 30 years. A large amount of arable land has been transformed into urban built-up land. Along with the land cultivated for food and forest land used for economic crops, 90% of counties lost cropland, with crop area decreasing rapidly and the fruit and vegetable area increasing rapidly. The second was cropping type shifting from early crops of rice or maize to crops of vegetables or fruit; 68.6% of the crop structure shifts occurred in these counties. Types of vegetables and fruit kept pace with urban expansion. In 1980, only three of 717 counties were vegetable-type, but there were 54 counties in 2011; and 13 counties were fruit-type in 1980, but there were 29 in 2011. Only 224 counties did not change their type, including 112 rice, 6 rice-wheat, 20 wheat, 48 wheat-maize and 31 maize types.

4 Discussion

4.1 Cropping structure and food security

The changes in cropping structure were closely related to the Chinese food security policy. The National Food Security and Long-term Planning Framework (2008-2020) established a scenario for 2020, with the aim to achieve a food self-sufficiency rate of 95% and top contain 100% cereals, which means the plan for the nation’s cropping structure needs to carefully consider the food supply. As most relevant studies have found, cropping structure changes involve the following three aspects of food security: (1) The food price affects the food supply. Farmers tend to plant high-priced non-food crops or abandon land to go to cities to work. However, because of economic growth and the demand for high-quality of life from the Chinese population, an increasing number of people are choosing to eat more meat or protein, which requires more food to be used as feed. This will impact the staple food served in the future, food consumption habits, domestic and international food price changes, and regional land and water resource conditions. All of these will change the food demand. Relying on adjustments to cropping structure to achieve food production will be potentially limited. Therefore, food security is affected by the 2020 scenario (Huang et al., 2012). (2) To reduce greenhouse gas emissions and effectively protect the environment, an increasing amount of farmland will be returned to conservation land and the demand of biomass will increase the farmland needs (Suramaythangkoor and Li, 2012), which will directly affect the area of planted crops. This will aggravate the food supply crisis. It is suggested that an integrated policy of food security and cropping structural adjustment needs to be considered at the national level (Chen et al., 2014). This research shows that cropping structure changes are usually driven by the impacts of agriculture policies at the national level or by farmers’ choices at the micro-level. (3) With urban development, an increasing amount of farmland is transformed to urban land and people in cities need more agricultural land to be transformed to tourism, which will change food crops to other crops. In addition, the tele-couple type cities’ vegetable and fruit will drive farmer choices more than economic crops. All of these factors will reduce the food supply and change the cropping structure (Jiang et al., 2015).

4.2 Factors influencing cropping structure

Previous studies suggested that cropping structure changes were affected by combinations of agricultural policy, technological progress, social demand, economic growth and natural environmental conditions (Wang and Wang, 2005). Other studies proposed that, in addition, the impacts of urbanization and climate change were important. For example, Li et al. (2015) showed significant effects of urbanization level and climate change on rice cropping changes in China. However, in our study, crop structure changes did not follow a linear trend but showed a sharp change at a certain stage. Therefore, it is still difficult to quantitatively analyze the driving force.
From a qualitative perspective, there are several important factors: (1) Urbanization has changed the crop types in surrounding areas, replacing food crops with fruit or vegetables. (2) Food prices can drive the shift from low-value to high-value crops. (3) Technological advances will improve crop yields and sown areas and simultaneously reduce logistics costs and increase the crop demand exchange. (4) Agriculture investment has increased for nearly 30 years; in particular, agricultural inputs per unit enhance crop production and correspondingly reduce the demand for crop area. (5) Increased meat consumption has led staple crops to be used to feed livestock. (6) The effects of climate change need to be considered because studies have shown that nearly three decades of climate change have had a moderately positive effect on crop yields and sown areas (Ye et al., 2013; Liu et al., 2015). In the next 50 years, climate warming may move the boundaries for maize, winter wheat and double-cropping rice northward and these changes will provide a geographical space for crop structural adjustments (Liu et al., 2013; Ye et al., 2015). To this end, it is suggested that future research should consider the driving forces and so be able to explain the spatial and temporal changes in cropping structure.

4.3 Policy implications for cropping structural adjustment

Understanding the spatial and temporal changes of cropping structure is important for providing evidence-based policy recommendations for sustainable governance of cropping structure management at the national level. Our results show that cropping structure has undergone profound changes over the past 30 years, which not only changed the cropping types but also changed the cropping proportion trends in most counties. These two kinds of changes will help in understanding the national cropping type adjustment and specific crop adjustment policies. As shown in Figures 1d and 2, some remarkable suggestions can figure out in national level. It is necessary to increase soybean type and reduce the high-latitude maize type in the northeastern cropping region. In the North China Plain, wheat type should be maintained and maize reduced. Sugar and fruit types should be increased in the southern China cropping region. It is necessary to reduce wheat and expand potato and fruit in the northwest cropping region. In order to increase vegetable and fruit production to cope with the rapid demand from cities, the cropping area in urban surroundings should be increased. Our national policy suggestions concerning geographical characteristics of cropping structures are consistent with the views of Luo (2015), but with some spatial differences. However, for specific crops, we suggest that most of the counties with increased trends need to spatial aggregation to main cropping regions, such as sugar in the south, fiber in Yangtze River, cotton in the northwest and the North China Plain, soybean in the northeast and fruit in the northwest, the Loess Plateau and southern China (Figure 1d). The trends of cropping proportions and geographical clustering information will aid policy-makers in determining where and which crops are the best adjustment objectives.

5 Conclusion

This study aimed to investigate the spatiotemporal changes in cropping structure in China during 1980-2011. Linear regression and spatial overlay were used to analyze the 11 major crops at the county and national scales. The results showed that geographical changes in cropping types occurred during 2002-2011 and cropping type richness doubled during 1980-2000. The staple food structure changed from being dominated by rice to coexistence of rice, maize and wheat. These deep changes showed a significant geographical shift of cropping types from grain types to grain, fruit and vegetable types. The spatial distribution of cropping proportion trends in counties showed that 47% of rice, 61% of wheat and 29.6% of maize cropping counties significantly decreased. These geographical characteristics of cropping structure suggest that the future direction of cropping structural adjustment needs to consider national adjustment in cropping types and specific crop proportion spatial aggregation policies. These findings will aid agricultural policy making departments in improving future scenarios of agricultural cropping structural adjustment. However, the future direction of cropping structural adjustment needs to consider not only geographical variation but also cropping variety and cropping regime.

The authors have declared that no competing interests exist.

[1]
Aguilar J, Gramig G G, Hendrickson J R et al., 2015. Crop species diversity changes in the United States: 1978-2012.PLOS One, 10: e0136580.Anecdotal accounts regarding reduced US cropping system diversity have raised concerns about negative impacts of increasingly homogeneous cropping systems. However, formal analyses to document such changes are lacking. Using US Agriculture Census data, which are collected every five years, we quantified crop species diversity from 1978 to 2012, for the contiguous US on a county level basis. We used Shannon diversity indices expressed as effective number of crop species (ENCS) to quantify crop diversity. We then evaluated changes in county-level crop diversity both nationally and for each of the eight Farm Resource Regions developed by the National Agriculture Statistics Service. During the 34 years we considered in our analyses, both national and regional ENCS changed. Nationally, crop diversity was lower in 2012 than in 1978. However, our analyses also revealed interesting trends between and within different Resource Regions. Overall, the Heartland Resource Region had the lowest crop diversity whereas the Fruitful Rim and Northern Crescent had the highest. In contrast to the other Resource Regions, the Mississippi Portal had significantly higher crop diversity in 2012 than in 1978. Also, within regions there were differences between counties in crop diversity. Spatial autocorrelation revealed clustering of low and high ENCS and this trend became stronger over time. These results show that, nationally counties have been clustering into areas of either low diversity or high diversity. Moreover, a significant trend of more counties shifting to lower rather than to higher crop diversity was detected. The clustering and shifting demonstrates a trend toward crop diversity loss and attendant homogenization of agricultural production systems, which could have far-reaching consequences for provision of ecosystem system services associated with agricultural systems as well as food system sustainability.

DOI PMID

[2]
Ban Zhengyao, 2000. Crop planting structure adjustment: A food revolution of China in the 21st century.China Food Economy, (1): 13-15. (in Chinese)

[3]
Cai Xueliang, Cui Yuanlai, 2009. Crop planting structure extraction in irrigated areas from multi-sensor and multi-temporal remote sensing data.Transactions of the CSAE, 25(8): 124-130. (in Chinese)Crop planting structure extraction in irrigated areas includes a range of dynamic parameters which require proper spatial and temporal resolution remotely sensed data.The paper seeks to extract crop planting structure by employing multi-temporal images from multi-sensors.Landsat enhanced thematic mapper plus(ETM+) images and moderate resolution imaging spectroradiometer(MODIS) normalized difference vegetation index(NDVI) monthly data were res-merged to produce a mega data tube,which was then classified using ISO cluster algorithm.Spectral signature of each class was extracted and identified using spectral matching technique taking crop coefficient curve as reference.In the way Zhanghe Irrigation system in southern China was classified into four classes:rice-rapeseed rotation,rice-wheat rotation,single summer crops,and double economic crops.Accuracy assessment suggests good agreement with statistical data and 91% classification accuracy when using IKONOS high resolution images as Ground Truth data.The application demonstrates the method a cost-efficient and robust approach to extract crop planting structure at irrigation system scale.

DOI

[4]
Chen Yangfen, Zhong Yu, Liu Yu et al., 2014. Management situation and policy implications of China’s grain security.Research of Agricultural Modernization, 35(6): 690-695. (in Chinese)Since grain security is a complex system, it is critical to policy making that we have a framed and thoughtful consideration of China's grain problems. Based on literature review, this research examined the current situation and main problems of China's grain security system by analyzing five key questions related to grain security, including where to grow, who to grow, what to grow, how to grow, and how to distribute of grains in China. Results show that China has already established a complete policy system to support grain production, distribution, and consumption. This research also found that it is possible to improve China's grain yield and farmers' income through land improvement for low and medium yield farmland and providing more incentives for farmers in the main grain producing regions. However, since grains are considered as uasi-public goods' there are still many unsolved issues, including unstable planting acreage,lack of enthusiasm in grain production, slow industry structural adjustment, imperfect management method, and inefficient grain allocation, etc. To realize and maintain the grain security in China, government policy should play significant roles in macro-managing resource allocations, directing marketing behaviors for all the involved parties, and monitoring the realization of government goals in grain security system.

[5]
Deng X, Gibson J, Wang P, 2017. Relationship between landscape diversity and crop production: A case study in the Hebei Province of China based on multi-source data integration.Journal of Cleaner Production, 142: 985-992.61We explore the relationship between landscape diversity and crop production.61Landscape diversity is not correlated linearly with changes of cultivated area.61Landscape diversity influences crop production economically and ecologically.61Ecological impact of landscape diversity on crop production is positive and marginal.

DOI

[6]
Field C B, Barros V R, Dokken D J et al., 2014. IPCC 2014: Summary for policymakers in Climate Change 2014: Impacts, Adaptation, and Vulnerability. Part A: Global and Sectoral Aspects. Contribution of Working Group II to the Fifth Assessment Report of the Intergovernmental Panel on Climate Change. Cambridge: Cambridge University Press, 17-18.

[7]
Guo Jianping, 2015. Advances in impacts of climate change on agricultural production in China.Journal of Applied Meteorological Science, 26(1): 1-11. (in Chinese)

[8]
Hijmans R J, Choe H, Perlman J, 2016. Spatiotemporal patterns of field crop diversity in the United States, 1870-2012.Agricultural & Environmental Letters, 1: 160022.Abstract Describing spatiotemporal patterns of agricultural biodiversity may be an important step toward better understanding its effect on agroecosystem services. We describe species-level field crop diversity at the national and state level for the United States, using annual survey data for a 142-yr period. National-level field crop diversity was very low around 1870 and peaked around 1960, after which time it began to decline. Many states had their highest levels of diversity between 1940 and 1960, but trends varied strongly among states. In 1900, the states with highest diversity were in the Northeast, but in 2012 the highest diversity was found in California, North Dakota, and the southeastern states. Diversity in the central US Corn Belt was very low throughout the 142-yr period studied. These results show that changes in diversity do not necessarily follow a simple continuous decline when moving from “traditional” to “industrial” agriculture.

DOI

[9]
Hu Qiong, Wu Wenbin, Song Qian et al., 2015. Recent progresses in research of crop patterns mapping by using remote sensing.Scientia Agricultura Sinica, 48(10): 1900-1914. (in Chinese)Mapping crop patterns with remote sensing is of great implications for agricultural production, food security and agricultural sustainability. In this paper, the theoretical basis behind the mapping was summarized, mapping methods were classified into several categories, characteristics and applicabilities of different mapping methods in the latest decade were discussed intensively, and some important directions and priorities for future studies were proposed. Currently, spectral, temporal and spatial features are the major theoretical bases for crop pattern mapping. The mapping method based on single imagery is characterized by its simple implementation, but with difficulty of capturing imagery at the best time for distinguishing different crops. Instead, the mapping method based on time-series of imagery can make full use of temporal features and is thus widely used for crop mapping, among which the methods using multiple features are more suitable than the ones using a single feature for regions with complicated planting structure. To some extent, feature-oriented statistical modeling method can resolve the mixed-pixel problem but its robustness needs to be improved. Furthermore, large-scale crop pattern mapping can be done by combining the remote sensing and agriculture statistics. However, due to coarse resolution, the derived maps show poor region suitability. Future crop pattern mapping should target at developing "a map of crops", the emphasis must be put on covering more crop types, enlarging the mapping areas, utilizing the superiority of blending multi-source data, strengthening the data preprocessing, optimizing the feature extraction and classifier selection, and improving the temporal and spatial scales of crop pattern mapping so as to better meet the needs of multi-faceted agricultural applications.

[10]
Huang Jikun, Yang Jun, Qiu Huanguang, 2012. New Era of national food security strategies and policies. Issues in Agricultural Economy, 33(3): 4-8. (in Chinese)

[11]
Huang Qing, Tang Huajun, Wu Wenbin et al., 2013. Remote sensing based dynamic changes analysis of crop distribution pattern: Taking Northeast China as an example.Scientia Agricultura Sinica, 46(13): 2668-2676. (in Chinese)Objective】Recently,researches on identifications and dynamic changes of landscapes and land use types by using remote sensing techniques have been a hot topic.However,the vast majority of studies have taken farmland as a "single" land type;the spatial distribution and variation of different crops inside the farmland have been neglected.This paper aims to explore the extraction methods of large scale crop acreage and distribution pattern by using remote sensing and the application of landscape pattern indices in crop pattern dynamics.【Method】 Based on the full coverage MODIS images and NDVI data during the crop growing periods of 2005 and 2010,by analyzing the planting structure,phenology calendar and NDVI time series curve characteristics,different area extracting models were established and were used to extract the spatial distribution of main crops(spring maize,soybean and paddy) by using RS and GIS techniques in Northeast China.Meanwhile,some landscape pattern indices were used to describe the characteristics and rules of crop pattern dynamic changes.【Result】Compared with the average statistical data of several years,the overall areas extraction accuracies of these two years were more than 90%.The main crop planting structure changed a lot from 2005 to 2010 in Northeast China.Soybean area decreased obviously,its dynamic degree reached-4.47%,and the average patch area reduced by 0.05 km2.Change range of paddy and spring maize reached 22.37% and 22.82%,respectively,during the 5 years.And the average patch area also increased.【Conclusion】Increasing planting costs and decreasing relative benefits were main reasons for these changes.It is technically feasible for large scale crop acreage extraction by using medium resolution remote sensing data.Landscape ecology pattern index can be used to analyze crop pattern dynamic changes.

[12]
Huang Qing, Tang Huajun, Zhou Qingbo et al., 2010. Remote-sensing based monitoring of planting structure and growth condition of major crops in Northeast China.Transactions of the Chinese Society of Agricultural Engineering, 26(9): 218-223. (In Chinese)Taking the main crops in Northeast China as an example,large-scale crop planting areas automatic identification methods were researched based on time-series of MODIS NDVI Datasets in this paper.The characteristics of NDVI time series of spring wheat,spring corn,soybeans and rice in Northeast China were firstly analyzed,and then the threshold values of extracting different crops were set and the extraction models of above-mentioned four kinds of crops were established,and finally the spatial distribution of these four crops of 2009 were obtained.MODIS data of Northeast China of 2009 were used to monitor the growth condition of the four kinds of crops,and the growth condition were compared with the average crop growth of last five years.The results showed that the extraction accuracy of crops planting structure was more than 87% compared with what with years of average statistical data,and crops growth condition showed different characteristics both in spatial and temporal.Research shows that it is feasible to extract different crops planting structure and monitor crops growth condition in large scale using MODIS data,which provides effective ways for large scale crops planting structure extraction in China agriculture remote sensing monitoring system.

DOI

[13]
Jiang L, Seto K C, Bai J, 2015. Urban economic development, changes in food consumption patterns and land requirements for food production in China.China Agricultural Economic Review, 7(2): 240-261.Purpose - – The impact of dietary changes associated with urbanization is likely to increase the demand for land for food production. The purpose of this paper is to examine the impact of urban economic development on changes in food demand and associated land requirements for food production. Design/methodology/approach - – Based on economic estimates from the Almost Ideal Demand System, feed conversion ratios, and crop yields, the authors forecast and compare future dietary patterns and land requirements for two types of urban diets in China. Findings - – The results show that the expenditure elasticities of oil and fat, meat, eggs, aquatic products, dairy, and liquor for the diet of capital cities are greater than those for the diet of small- and medium-sized cities. The authors forecast that capital city residents will experience a more rapid rate of increase in per capita demand of meat, eggs, and aquatic products, which will lead to much higher per capita land requirements. Projections indicate that total per capita land demand for food production in capital cities will increase by 9.3 percent, from 1,402 to 1,533?m2 between 2010 and 2030, while total per capita land demand in small- and medium-sized cities will increase only by 5.3 percent, from 1,192 to 1,255?m2. Originality/value - – The results imply that urban economic development can significantly affect the final outcomes of land requirements for food production. Urban economic development is expected to accelerate the rate of change toward an affluent diet, which can lead to much higher future land requirements.

DOI

[14]
Leff B, Ramankutty N, Foley J A, 2004. Geographic distribution of major crops across the world.Global Biogeochemical Cycles, 18(1): 1-27.

[15]
Li Kuo, Xu Yinlong, 2017. Study on adjustment of agricultural planting structures in China for adapting to climate change.Journal of Agricultural Science and Technology, 19(1): 8-17. (in Chinese)During the past 100 years,the global climate has experienced a major change ecome warmer and warmer. Along with this change,its influence has become increasingly remarkable. How to adapt to this change has been a world concerned hot spot. China has abundant practices on adjusting agricultural planting structure to adapt to climate change,but systemical carding is lacking. There is no clear cognition about the rich connotation on the existing practices to adapt to climate change. In order to better reply to climate change,this paper expounded the effect of climate change on China adjustment of agricultural planting structures from the following 3 aspects,including cropping system,crop distribution,cultivars layout. The paper also discussed the connotation on different ways of adjusting agricultural planting structures for adapting to climate change,including multiple-crop index,inter-cropping model,crops collocation,boundary of planting,proportion of crops,drought resisting varieties,disease and insect pests resistant varieties,combining with the typical cases,such as expansion of rice and corn planting areas in Northeast China,moving boundary of winter wheat further north,"two-later"technology in North China,changing double cropping rice in the middle and lower valley of the Yangtze River,exploiting winter agriculture in Southern China,etc.. The key issues facing the adjustment of agricultural planting structure for adapting to climate change were put forward. Studies on integrated impacts of each climate change factor on adjustment of agricultural planting structures should be further enhanced. The agricultural exquisite regionalization,optimal allocation of crops layout,and multi-objective breeding decision should be studied in depth.

[16]
Li Qifeng, Zhang Hailin, Chen Fu, 2008. Changes in spatial distribution and planting structure of major crops in Northeast China.Journal of China Agricultural University, 13(3): 74-79. (in Chinese)We studied the spatial distribution of planting structure in the farming system of northeast China.Using cluster analysis and comparative superiority indexes,we estimated the future trend of planting structure with a view to providing a reference for increasing grain production capacity in the area.The results showed that the proportion of wheat planting decreased and that of soybean increased between 1985 and 2005,developing into the main planting structure with maize,soybean and rice.The trend for planting structure appeared steady,and each sub-region developed different characteristics gradually.There was a strong spatial variation in main crops and the planting of main crops was intensive.The area planted to rice and maize increased,while that planted to wheat decreased sharply.The centre for soybean production increased in scope north-wards.The change in planting structure was due to many factors,and the comparative advantage was the inherent force.

DOI

[17]
Li Z, Liu Z, Anderson W et al., 2015. Chinese rice production area adaptations to climate changes, 1949-2010.Environmental Science & Technology, 49(4): 2032-2037.Abstract Climate change has great impact on cropping system. Understanding how the rice production system has historically responded to external forces, both natural and anthropogenic, will provide critical insights into how the system is likely to respond in the future. The observed historic rice movement provides insights into the capability of the rice production system to adapt to climate changes. Using province-level rice production data and historic climate records, here we show that the centroid of Chinese rice production shifted northeastward over 370km (2.98掳N in latitude and 1.88 E in longitude) from 1949 to 2010. Using a linear regression model, we examined the driving factors, in particular climate, behind such rice production movement. While the major driving forces of the rice relocation are such social economic factors as urbanization, irrigation investment, and agricultural or land use policy changes, climate plays a significant role as well. We found that temperature has been a significant and coherent influence on moving the rice center in China and precipitation has had a significant but less spatially coherent influence.

DOI PMID

[18]
Liang Shumin, 2006. Space distribution and reason analysis of the changes in agriculture planting structure of China.Chinese Journal of Agricultural Resources and Regional Planning, 27(2): 29-34. (in Chinese)This paper utilizes the concept of location quotien to study the space distribution of 17 crops and the changes of agriculture planting structure in various locations.It resolves the reasons and motivations for the distribution and changes of agriculture planting structure in China from natural factors and economic factors.The conclusions are that the space distribution of agriculture planting structure in China is mainly determined by the natural conditions,while its changes in distribution are mainly resulted from economic behavior.The planting specific gravity with intensive labor shows negative relation with the amount of land resources per capita.The planting specific gravity with intensive land resources shows positive relation with the amount of land resources per capita.The urbanization and population development determines the distribution and changes of vegetable production.The urbanization also influences the changes of multiple cropping indexes of various places.This paper puts forward several counter measures that the government should strengthen its analysis on markets of various agriculture products and provide more information services.

[19]
Liang Shumin, Meng Zhe, Bai Shi, 2008. Research on Chinese crop planting structure changes based on village-level survey. Issues in Agricultural Economy, 29(Suppl. 1): 26-31. (in Chinese)

[20]
Liu J, Shen J, Li Y et al., 2014. Effects of biochar amendment on the net greenhouse gas emission and greenhouse gas intensity in a Chinese double rice cropping system.European Journal of Soil Biology, 65: 30-39.61Biochar amendment in paddy fields reduced CH4 emissions.61N2O emissions increased by biochar amendment.61Soil Rh increased in a short period by biochar amendment.61Net GHG emission and GHG intensity reduced by biochar amendment.

DOI

[21]
Liu Kebao, Liu Shubin, Lu Zhongjun et al., 2014. Extraction on cropping structure based on high spatial resolution remote sensing data.Chinese Journal of Agricultural Resources and Regional Planning, 35(1): 21-26. (in Chinese)Crop planting structure is important for crop yield and acreage estimation,and it is also the basis of structural adjustment and optimization. To explore the potentials of high spatial resolution data in crop structure extraction,taking Zhaodong City in Heilongjiang Province as an example,this paper used a conventional supervised classification to obtain a crop structure map from three RapidEye images. A prior ground truth database was created with 10 sample plots( 1km* 1km) randomly distributed over the study area for two main purposes: first,to set up interpretation keys for image classification; second,to minimize the effects caused by linear features and small ground objects,which would improve the accuracy of crop area estimation. Classification results showed that the final crop structure map had an overall accuracy of 97. 00% and the position accuracy reaches 96. 15%,which was much higher than the application of middle / low resolution remote sensing images. This experimental case study implied that the accuracy of crop structure mapping can be improved significantly by the combination of high spatial resolution images with detailed ground truth database.

[22]
Liu Z, Yang P, Tang H et al., 2015. Shifts in the extent and location of rice cropping areas match the climate change pattern in China during 1980-2010.Regional Environmental Change, 15(5): 919-929.Knowledge of cropping areas and climate change is crucial to understanding the causes and consequences of global land use change, and the response of rice areas to climate change is a hot topic to global food security. This study investigates the impacts of climate change on suitable areas for rice cultivation and how the actual cultivated area of rice has been altered in response to climate change during the past three decades. To understand whether the shifts in the extent and location of rice cropping areas match the pattern of climate change, the yearly climate data from 726 weather stations and the rice census data from 2,343 counties were employed to simulate the climatically suitable region for rice using the MaxEnt species distribution model, as well as to model the actual geographical distribution of rice using the spatial allocation production model in each decade. The results show that approximately 3.902% of all Chinese land area (roughly 3.702×0210 7 02ha) has become suitable for rice due to climate change over the past three decades, representing new potential areas for rice cultivation. Meanwhile, the actual rice cropping area has increased by approximately 18.202%, indicating that the extent and location of the rice expansion match the pattern of climate change. However, some spatial inconsistencies did exist between the actual rice area’s expansion and the climatically suitable region after 1990. Nevertheless, climate change was a possible factor impacting the geospatial and temporal changes of the actual rice cropping area in China.

DOI

[23]
Liu Z, Yang X, Chen F et al., 2013. The effects of past climate change on the northern limits of maize planting in Northeast China.Climatic Change, 117(4): 891-902.Northeast China (NEC) is one of the major agricultural production areas in China and also an obvious region of climate warming. We were motivated to investigate the impacts of climate warming on the northern limits of maize planting. Additionally, we wanted to assess how spatial shifts in the cropping system impact the maize yields in NEC. To understand these impacts, we used the daily average air temperature data in 72 weather stations and regional experiment yield data from Jilin Province. Averaged across NEC, the annual air temperature increased by 0.38 A degrees C per decade. The annual accumulated temperature above 10 A degrees C (AAT10) followed a similar trend, increased 66 A degrees C d per decade from 1961 to 2007, which caused a northward expansion of the northern limits of maize. The warming enabled early-maturing maize hybrids to be sown in the northern areas of Heilongjiang Province where it was not suitable for growing maize before the warming. In the southern areas of Heilongjiang Province and the eastern areas of Jilin Province, the early-maturing maize hybrids could be replaced by the middle-maturing hybrids with a longer growing season. The maize in the northern areas of Liaoning Province was expected to change from middle-maturing to late-maturing hybrids. Changing the hybrids led to increase the maize yield. When the early-maturing hybrids were replaced by middle-maturing hybrids in Jilin Province, the maize yields would increase by 9.8 %. Similarly, maize yields would increase by 7.1 % when the middle-maturing hybrids were replaced by late-maturing hybrids.

DOI

[24]
Liu Z H, Li Z G, Tang P Q et al., 2013. Change analysis of rice area and production in China during the past three decades.Journal of Geographical Sciences, 23(6): 1005-1018.AbstractRice’s spatial-temporal distributions, which are critical for agricultural, environmental and food security research, are affected by natural conditions as well as socio-economic developments. Based on multi-source data, an effective model named the Spatial Production Allocation Model (SPAM) which integrates arable land distribution, administrative unit statistics of crop data, agricultural irrigation data and crop suitability data, was used to get a series of spatial distributions of rice area and production with 10-km pixels at a national scale — it was applied from the early 1980s onwards and used to analyze the pattern of spatial and temporal changes. The results show that significant changes occurred in rice in China during 1980–2010. Overall, more than 50% of the rice area decreased, while nearly 70% of rice production increased in the change region during 1980–2010. Spatially, most of the increased area and production were in Northeast China, especially, in Jilin and Heilongjiang; most of the decreased area and production were located in Southeast China, especially, in regions of rapidly urbanization in Guangdong, Fujian and Zhejiang. Thus, the centroid of rice area was moved northeast approximately 230 km since 1980, and rice production about 320 km, which means rice production moved northeastward faster than rice area because of the significant rice yield increase in Northeast China. The results also show that rice area change had a decisive impact on rice production change. About 54.5% of the increase in rice production is due to the expansion of sown area, while around 83.2% of the decrease in rice production is due to contraction of rice area. This implies that rice production increase may be due to area expansion and other non-area factors, but reduced rice production could largely be attributed to rice area decrease.

DOI

[25]
Luo Qiyou, 2015. Issue of A new round of strategic adjustment of crop planting structure. Source from: , 2015-10-13. (in Chinese)

[26]
Suramaythangkoor T, Li Z, 2012. Energy policy tools for agricultural residues utilization for heat and power generation.Renewable and Sustainable Energy Reviews, 16(6): 4343-4351.Cane trash could viably substitute fossil fuels in heat and power generation projects to avoid air pollution from open burning and reduce greenhouse gas (GHG) emission. It is competitive with bituminous and other agro-industrial biomass. Using cane trash for heat generation project could provide a higher reliability and return on investment than power generation project. The heat generation project could be viable (Financial Internal Rate of Return, FIRR=36–81%) without feedstock subsidy. With current investment and support conditions, the capacity of 5MW option of power generation project is the most viable (FIRR=13.6–15.3%); but 30MW, 1MW and 10MW options require feedstock subsidy 450–1100Baht/t-cane trash to strengthen financial viability. Furthermore, the revenue from carbon credit sales could compensate the revenue from current energy price adder and increases 0.5–1.0% FIRR of power generation project. Using cane trash for 1MW power generation could reduce GHG emission 637–861t CO2eq and avoid air pollutant emissions of 3.35kg nitrogen oxides (NOx), 0.41kg sulfur oxides (SOx) and 2.05kg volatile organic compounds (VOC). Also, 1t steam generation from cane trash could avoid pollutant emissions of 0.6kg NOx, 0.07kg SOx, and 0.37kg VOC. The potential of cane trash to cause fouling/slagging as well as erosion are not significantly different from other biomass, but chlorinated organic compounds and NOx could be higher than bituminous and current biomass feedstock at sugar mill (bagasse and rice husk).

DOI

[27]
Tang Huajun, Wu Wenbin, Yang Peng et al., 2010. Recent progresses in monitoring crop spatial patterns by using remote sensing technologies.Scientia Agricultura Sinica, 43(14): 2879-2888. (in Chinese)As a new high-technology with an advantage of high temporal resolution,wide coverage and low cost,remote sensing is currently used in a wide arrange of earth observation activities and thus provides a useful tool to detect and monitor the spatial patterns of crop cultivation.Based on the systematic summary of the progress of studies in remote-sensing-based monitoring of spatial patterns of agricultural crops in the latest decade,including its theories,methods and applications,a series of problems that should be urgently resolved in the study are put forward,and some important study directions and priorities for future are viewed.Studies show that crop acreage can be monitored according to the differences in spectral characteristics of different crops,which are normally recorded by the satellite sensors.There are three major approaches used for crop acreage monitoring:spectral-based identification,phenology-based identification and multiple data-fusion-based identification methods.Mapping multiple cropping systems using remote sensing is mainly based on the crop growth curves,which can be derived from the smoothed time-series vegetation index(VI) data.Furthermore,cropping patterns can be also examined through discriminating the crop growth period from variations in time-series VI data and characteristics of different cropping patterns.How to construct the theoretical and technological systems,to develop and verify the image classification methods,to optimize the smoothing methods for time-series data and to improve the capability of automatic extraction of information could be the major development trends of this field in the future.

DOI

[28]
Tang Huajun, Wu Wenbin, Yu Qiangyi et al., 2015. Key research priorities for agricultural land system studies.Scientia Agricultura Sinica, 48(5): 900-910. (in Chinese)Agricultural land use and its dynamics have attracted much attention from researchers due to their ecological and socio-economic implications for agricultural sustainability. Several international programs such as the Land-Use and Land-Cover Change(LUCC) and the Global Land Project(GLP) have promoted the emergence of Land System Sciences. Based on the latest progress in Land System Science, this review paper provides a definition of the Agricultural Land System(ALS) and conceptualizes a framework for the ALS studies relating to global change, food security, and sustainability studies. It is proposed that: 1)Multi-faceted patterns of ALS are the basis for subsequent analysis. It should consider not only the characteristics ALS at the land use and land cover level, e.g. the transitions between cropland and other land cover types, but also the characteristics of cropping system,crop allocation, intensification and productivity within cropland. Interdisciplinary approaches and data integration are necessary for understanding the complex characteristics of ALS. 2) Multi-model coupling through the interpretation and intercorrelation of ALS patterns and underlying drivers is an essential way to represent ALS dynamic changes, processes and its mechanisms, by which it is able to better understand the coupled human-environment interactions across different time, space and scales. 3) It is important to link the ALS with other parallel systems to understand their synergies and trade-offs, in order to build up a sustainable pathway for future agricultural land use. Those solutions for ALS studies would substantially promote the interdisciplinary integration and will contribute to the development of Land System Science and its relevant sciences.

[29]
Waha K, Müller C, Bondeau A et al., 2013. Adaptation to climate change through the choice of cropping system and sowing date in sub-Saharan Africa.Global Environmental Change, 23(1): 130-143.Multiple cropping systems provide more harvest security for farmers, allow for crop intensification and furthermore influence ground cover, soil erosion, albedo, soil chemical properties, pest infestation and the carbon sequestration potential. We identify the traditional sequential cropping systems in ten sub-Saharan African countries from a survey dataset of more than 8600 households. We find that at least one sequential cropping system is traditionally used in 35% of all administrative units in the dataset, mainly including maize or groundnuts. We compare six different management scenarios and test their susceptibility as adaptation measure to climate change using the dynamic global vegetation model for managed land LPJmL. Aggregated mean crop yields in sub-Saharan Africa decrease by 6-24% due to climate change depending on the climate scenario and the management strategy. As an exception, some traditional sequential cropping systems in Kenya and South Africa gain by at least 25%. The crop yield decrease is typically weakest in sequential cropping systems and if farmers adapt the sowing date to changing climatic conditions. Crop calorific yields in single cropping systems only reach 40-55% of crop calorific yields obtained in sequential cropping systems at the end of the 21st century. The farmers' choice of adequate crops, cropping systems and sowing dates can be an important adaptation strategy to climate change and these management options should be considered in climate change impact studies on agriculture. (C) 2012 Elsevier Ltd. All rights reserved.

DOI

[30]
Wang Yang, Wang Xinjiang, 2005. Driving mechanism of cultivating structural evolutionary in Jilin province.System Sciences and Comprehensive Studies in Agriculture, 21(1): 34-36. (in Chinese)In this paper, the history of planting in Jilin province was divided into four phases, which are recover and adjustment, fluctuation, formation and improvement. Driving forces of the formation of the planting structure are policy, technology, demand, economic benefit and the resources. Jilin province has a special planting structure in which high quality corn as the core, high quality rice and high quality soybean as the supplementary, and varied crops features in each region.

[31]
Wu Bingfang, Fan Jinlong, Tian Yichen et al., 2004. A method for crop planting structure inventory and its application.Journal of Remote Sensing, 8(6): 618-627. (in Chinese)Usually crop planting structure derived from the statistical data are quite later due to time consuming of statistic method. The government normally needs the crop planting structure as early as possible, better if it can be obtained during the crop season, so that it allows the government has enough time to make decision for next crop season. This paper presents a fast inventory method of crop planting structure, based on the GVG instrument and transect sampling framework. Then crop planting structure inventory for summer and autumn crop over China in 2002 have been carried out. It is found that the rate of cereal to cash crop within summer crop is 58%: 21%, and that of autumn crop 79%: 14%. It is very obvious that cereal crops still account on very high proportion in the crop structure. According to surveyed results, the difference of crop planting structure over China varies temporally and spatially great. The soybean proportion of Hei Longjiang province ranks first, up to 38%, and Hei Longjiang is main producing area of soybean in China. Jilin and Liaoning provinces almost have the same proportion of spring maize, more than 71%. Winter wheat is a major crop of summer crop in the Huanghuihai area, in which the winter wheat proportion of Hebei province is more than 97%, and summer maize is a major crop of autumn crop, in which the summer maize proportion of Henan province is up to 82%. On the two sides of the Yangtse River there exists very big change of crop proportion between winter wheat and oil rapeseeds. On the north side of Yangtse River, winter wheat and oil rapeseeds almost have the same rank, but on the south side of Yangtse River oil rapeseeds ranks first in the summer season, and middle rice and later rice are the major crops of autumn crop, more than 66%. Rice is major crop of summer and autumn crop in the southern China, and in which the proportion of vegetable and fruit of Guangdong province is up to 29%. Middle rice and summer maize are the major crops of autumn crop in the southwest region, in which the proportion of cotton, flux seed and sugar of Yunnan province is up to 19. Tobacco of Yunnan province ranks first in China. Effects of agricultural structure adjustment are very great in recent years, especially in the developed and adjacent region where the proportion of vegetable and fruit is very high, such as Tianjin city up to 34%.

DOI

[32]
Wu Wenbin, Yang Peng, Li Zhengguo et al., 2014. Overview of research progresses in crop spatial pattern changes.Chinese Journal of Agricultural Resources and Regional Planning, 35(1): 12-20. (in Chinese)Spatial patterns of crops and their dynamics have enormous consequences for both environmental sustainability and food security; It thus has been the important research topics of geography and ecology communities. This paper systematically summarized the current progress in crop pattern studies over the latest decade,specifically focusing on the spatial- temporal characteristics,driving mechanism and simulation models of crop pattern changes. It found that the spatial- temporal change characteristics were studied by the methods such as statistical approach,remote sensing,and spatial modeling techniques,while the driving mechanism was normally illuminated by a proper selection of regional- scale biophysical- socioeconomic variables and further attention was paid to the endogenous- exogenous factors that could potentially influence the stakeholders' decision on making a crop choice. Moreover,the simulation platforms were developing quickly and experiencing a transition from the traditional non-spatial expression of crop structure to the new spatially- explicit representation of crop allocation. This paper also identified the key issues that were still relevant and tried to specify the future prospect and priorities in this field. It was believed that in a long- term,cross- scale and multi- source data coupling was the most trusted way for mapping the spatial- temporal distribution of crop pattern; proper selections on biophysical- socioeconomic variables, micro / macro perspective,and static / dynamic scheme will benefit the analysis on the driving mechanism of crop pattern dynamics; interdisciplinary and multi- methods integration was the most effective approach to improve the current understanding of crop pattern simulation.

[33]
Xia T, Wu W, Zhou Q et al., 2014. Spatio-temporal changes in the rice planting area and their relationship to climate change in Northeast China: A model-based analysis.Journal of Integrative Agriculture, 13(7): 1575-1585.Rice is one of the most important grain crops in Northeast China (NEC) and its cultivation is sensitive to climate change. This study aimed to explore the spatio-temporal changes in the NEC rice planting area over the period of 1980–2010 and to analyze their relationship to climate change. To do so, the CLUE-S (conversion of land use and its effects at small region extent) model was first updated and used to simulate dynamic changes in the rice planting area in NEC to understand spatio-temporal change trends during three periods: 1980–1990, 1990–2000 and 2000–2010. The changing results in individual periods were then linked to climatic variables to investigate the climatic drivers of these changes. Results showed that the NEC rice planting area expanded quickly and increased by nearly 4.5 times during 1980–2010. The concentration of newly planted rice areas in NEC constantly moved northward and the changes were strongly dependent on latitude. This confirmed that climate change, increases in temperature in particular, greatly influenced the shift in the rice planting area. The shift in the north limit of the NEC rice planting area generally followed a 1°C isoline migration pattern, but with an obvious time-lag effect. These findings can help policy makers and crop producers take proper adaptation measures even when exposed to the global warming situation in NEC.

DOI

[34]
Xu Mei, Ruan Benqing, Huang Shifeng et al., 2007. Monitoring of crop variety distribution by remote sensing and its application.Journal of Hydraulic Engineering, 38(7): 879-885. (in Chinese)

[35]
Ye L, Xiong W, Li Z et al., 2013. Climate change impact on China food security in 2050. Agronomy for Sustainable Development, 33(2): 363-374.AbstractClimate change is now affecting global agriculture and food production worldwide. Nonetheless the direct link between climate change and food security at the national scale is poorly understood. Here we simulated the effect of climate change on food security in China using the CERES crop models and the IPCC SRES A2 and B2 scenarios including CO2 fertilization effect. Models took into account population size, urbanization rate, cropland area, cropping intensity and technology development. Our results predict that food crop yield will increase +3–1102% under A2 scenario and +402% under B2 scenario during 2030–2050, despite disparities among individual crops. As a consequence China will be able to achieve a production of 572 and 615 MT in 2030, then 635 and 646 MT in 2050 under A2 and B2 scenarios, respectively. In 2030 the food security index (FSI) will drop from +2402% in 2009 to 614.502% and +10.202% under A2 and B2 scenarios, respectively. In 2050, however, the FSI is predicted to increase to +7.102% and +20.002% under A2 and B2 scenarios, respectively, but this increase will be achieved only with the projected decrease of Chinese population. We conclude that 1) the proposed food security index is a simple yet powerful tool for food security analysis; (2) yield growth rate is a much better indicator of food security than yield per se; and (3) climate change only has a moderate positive effect on food security as compared to other factors such as cropland area, population growth, socio-economic pathway and technology development. Relevant policy options and research topics are suggested accordingly.

DOI

[36]
Ye Q, Yang X, Dai S et al., 2015. Effects of climate change on suitable rice cropping areas, cropping systems and crop water requirements in southern China.Agricultural Water Management, 159: 35-44.Rice is one of the main crops grown in southern China. Global climate change has significantly altered the local water availability and temperature regime for rice production. In this study, we explored the influence of climate change on suitable rice cropping areas, rice cropping systems and crop water requirements (CWRs) during the growing season for historical (from 1951 to 2010) and future (from 2011 to 2100) time periods. The results indicated that the land areas suitable for rice cropping systems shifted northward and westward from 1951 to 2100 but with different amplitudes. The land areas suitable for single rice-cropping systems (SRCS) and early double rice-cropping systems (EDRCS) decreased, whereas the land areas suitable for middle double rice-cropping systems (MDRCS) and late double rice-cropping systems (LDRCS) expanded significantly. Among the rice-cropping systems, the planting area suitable for SRCS was the largest during the historical period (1951–1980), whereas the suitable planting area for LDRCS was the largest during the future period (2070–2100). Spatially, the water requirement of rice during the growing season exhibited a decreasing trend from southeast to northwest from 1951 to 2010. Temporally, the regional water requirement of rice during the growing season decreased from 720mm (1951–1980) to 700mm (1981–2010) as a result of solar radiation and evapotranspiration. However, the water requirement was predicted to increase from 1027mm (2011–2040) to 1150mm (2071–2100). During the past six decades, the planting area suitable for double rice-cropping systems increased by 2.7×10⁴km2and, consequently, the CWR and irrigation water requirement (IWR) increased by 1.1×10¹⁰and 8.8×10⁹m3, respectively. In addition, under A1B scenarios, the CWR and IWR of double rice-cropping systems are expected to increase by 1.6×10¹¹and 1.2×10¹¹m3, respectively, from 2071–2100 compared with the historical period of 1951–1980. The regional CWR and IWR were predicted to increase respectively by 8% and 6% from 2011 to 2040, by 17% and 19% from 2041 to 2070, and by 20% and 24% from 2071 to 2100 compared with 1951–1980. These increases can be attributed to climate warming, which expands the suitable planting area for multiple-cropping systems and extends the growing season for late-maturing rice varieties. Our study aims to provide a scientific guide for planning future cropping systems and optimizing water management in the southern rice cropping region of China.

DOI

[37]
You Fei, 2016. Discussion on several problems of current agricultural structure adjustment. Source from: , 2016-10-25. (in Chinese)

[38]
Zhang G, Xiao X, Biradar C M et al., 2017. Spatiotemporal patterns of paddy rice croplands in China and India from 2000 to 2015.Science of Total Environment, 579: 82-92.61Annual paddy rice maps in China and India were generated for first time using MODIS data.61Spatiotemporal patterns of paddy rice were analyzed in China and India during 2000–2015.61Paddy rice area decreased by 18% in China but increased by 19% in India.61Paddy rice area shifted northeastward in China while widespread expansion detected in India.

DOI PMID

[39]
Zhou Guangsheng, 2015. Research prospect on impact of climate change on agricultural production in China.Meteorological and Environmental Sciences, 38(1): 80-93. (in Chinese)The change tendency and regular patterns of agroclimatic resources,agrometeorological disasters including drought,flood,heat wave and low temperature disasters,and agricultural pests and diseases in China under global climate change are reviewed in this paper.The facts of the climate change impacts on agricultural production in China are revealed from the changes of agricultural production potential,crop cultivation system and crop quality.The potential impacts of future climate change on agricultural production in China are discussed,and the adaptation measures of agricultural production to climate change are summarized.Based on the temporal and spatial patterns of agroclimatic resources in China and new situation and new problems of Chinese agricultural production under climate change,the shortcomings of the study on the impacts of climate change on agricultural production in China are pointed out.Moreover,the future tasks related to the study on the impacts of climate change on agricultural production in China are emphasized,in order to provide scientific decision support for agricultural production security and national food security.

Outlines

/