Special Issue: Land system dynamics: Pattern and process

Modeling the effects of land-use optimization on the soil organic carbon sequestration potential

  • YAO Jingtao , 1, 2 ,
  • KONG Xiangbin , 1, 2, *
Expand
  • 1. Key Laboratory of Agricultural Remote Sensing, Ministry of Agriculture/Institute of Agricultural Resources and Regional Planning, Chinese Academy of Agricultural Sciences, Beijing 100081, China
  • 2. Key Laboratory for Agricultural Land Quality, Monitoring and Control, The Ministry of Land and Resources, Beijing 100193, China
*Corresponding author: Kong Xiangbin (1969-), Professor, specialized in land use and land cover change. E-mail:

Author: Yao Jingtao (1990-), PhD, specialized in the modeling and optimization of land-use changes and GIS. E-mail:

Received date: 2017-05-09

  Accepted date: 2017-09-15

  Online published: 2018-11-20

Supported by

Key Research Program of Beijing Natural Science Foundation, No.8151001

Copyright

Journal of Geographical Sciences, All Rights Reserved

Abstract

Increasing soil organic carbon (SOC) sequestration is not only an efficient method to address climate change problems but also a useful way to improve land productivity. It has been reported by many studies that land-use changes can significantly influence the sequestration of SOC. However, the SOC sequestration potential (SOCP, the difference between the saturation and the existing content of SOC) caused by land-use change, and the effects of land-use optimization on the SOCP are still not well understood. In this research, we modeled the effects of land-use optimization on SOCP in Beijing. We simulated three land-use optimization scenarios (uncontrolled scenario, scale control scenario, and spatial restriction scenario) and assessed their effects on SOCP. The total SOCP (0-20 cm) in Beijing in 2010 was estimated as 23.82 Tg C or 18.27 t C/ha. In the uncontrolled scenario, the built-up land area of Beijing would increase by 951 km2 from 2010 to 2030, and the SOCP would decrease by 1.73 Tg C. In the scale control scenario, the built-up land area would decrease by 25 km2 and the SOCP would increase by 0.07 Tg C from 2010 to 2030. Compared to the uncontrolled scenario, the SOCP in 2030 of Beijing would increase by 0.77 Tg C or 0.64 t C/ha in the spatial restriction scenario. This research provides evidence to guide planning authorities in conducting land-use optimization strategies and estimating their effects on the carbon sequestration function of land-use systems.

Cite this article

YAO Jingtao , KONG Xiangbin . Modeling the effects of land-use optimization on the soil organic carbon sequestration potential[J]. Journal of Geographical Sciences, 2018 , 28(11) : 1641 -1658 . DOI: 10.1007/s11442-018-1534-5

1 Introduction

The soil organic carbon (SOC) pool is the largest carbon pool in the global terrestrial ecosystem (about 1550 Gt) (Lal, 2004). The SOC level represents a dynamic carbon equilibrium of input from photosynthetic carbon and output through organic matter erosion, soil respiration, and leaching (Chapin III et al., 2011). SOC sequestration refers to the transfer of CO2 in the atmospheric system into the SOC pool for safe storage (Lal, 2004). SOC sequestration is not only an important process in global carbon cycling, but also a key process in improving the quality of soils (West and Post, 2002; Armstrong et al., 2003; Lal, 2004; Pan et al., 2004; Blair et al., 2006). However, the carbon holding capacity of soil is limited by both the carbon input and the stabilization mechanisms of soil organic matter (Six et al., 2002). The concept of soil carbon saturation has been proposed, analyzed, and estimated in many studies (Stewart et al., 2008; Du et al., 2014). On the basis of the observation of long-term field experiments in Africa, Asia, Australia, Europe, and America (Grant et al., 2001; Bayer et al., 2006; Kamoni et al., 2007; Yang et al., 2007; Young et al., 2009; Angers et al., 2011), it has also been proved that the saturation of SOC does occur. The SOC content will show little or no significant changes when the existing SOC level achieves saturation. The saturation of SOC is correlated with temperature, water input (precipitation and irrigation), and soil properties (Chung et al., 2008; Stewart et al., 2008).
With the understanding of soil carbon saturation, SOC sequestration potential (SOCP) was used to evaluate the carbon sequestration function of land-use systems (Qin et al., 2013). SOCP refers to the soil carbon saturation deficit, i.e. the difference between the saturation and existing SOC level (Qin et al., 2013). Several process-level models, such as CENTURY (Ardö and Olsson, 2003; Lugato et al., 2014) and DNDC (Zhang et al., 2015), have been developed to estimate the SOCP. However, the limitation of the process-level model is that the site-specific parameters are usually not available in practice. Another commonly adopted method to estimate the SOCP is to upscale the SOCP from the specific site scale to the large area scale (Lal, 2002; Lu et al., 2009). This method ignores the heterogeneity of climate and soil conditions, which will determine the SOCP to some degree. In order to develop a practical approach to evaluate the SOC sequestration function of land-use systems, a statistical model was proposed to estimate the saturation level of SOC (Qin and Huang, 2010). The model was developed with the information from field experiments, and it has been widely adopted to estimate the SOCP of land-use systems (Qin et al., 2013). In previous studies, it was presumed that the structure and spatial distribution of land-use types would not change in the short or long term (Qin et al., 2013). This assumption is flawed since land-use systems continuously change in the real world (Foley et al., 2005; Wright and Wimberly, 2013). Particularly in China, the land-use system is experiencing dramatic changes under the force of urbanization and population growth (Liu et al., 2003). Soil sealing as a consequence of urbanization will decrease the SOCP (Munafò et al., 2013). Soil reconstruction as a consequence of reclamation and afforestation will increase the SOCP (Ussiri and Lal, 2005). The SOCP is highly determined by land-use changes (Wang et al., 2016; Yang et al., 2017). Optimization of land-use change would contribute to improving the carbon sequestration function of land-use systems.
Land-use change research has a long history and many simulation models have been developed (Veldkamp and Lambin, 2001; Han et al., 2005). The Markov chain (Al-sharif and Pradhan, 2014; Mondal et al., 2014) and the CLUE-S model (Verburg et al., 2002; Jiang et al., 2015) are very popular models. The Markov chain model was developed based on the historical knowledge of land-use changes. In this model, the transition probabilities between land-use types are assumed stable across time. The model has been applied to simulate land-use changes under the natural evolution process of land-use systems. The CLUE-S model was developed based on the driving factors of land-use, and combines the structural and spatial allocation changes of land-use types. The model is applied to simulate both the structure and the spatial distribution change of land-use types. However, the conversion setting of land-use types is partly empirical-based. This setting will increase uncertainties of simulation results and influence the application of the model. Since the empirical-based setting in CLUE-S is highly related to the historical knowledge of land-use changes, developing a land-use change model coupling the CLUE-S concept and the historical knowledge of land-use changes would contribute to the application and performance of land-use change simulation. The major challenge in developing this model is to estimate the transition probability matrix based on the historical matrix and land-use optimization strategies, i.e. the scale control planning (the maximum of built-up land, the minimum of arable land, etc.).
Land-use changes which affect the carbon sequestration function of land-use systems, are highly related to land-use optimization policies. It is necessary to model the effects of land-use changes on SOCP. This research will provide evidence to policy-makers and thus improve the SOC sequestration function of land-use systems. In the following sections of this article, we first describe the study area and data materials. Second, we introduce the land-use change simulation model and the SOCP estimating methods. Third, we validate the land-use change simulation method, make a multi-scenario simulation of land-use optimization, and estimate the effects of land-use optimization on SOCP. Last, we propose the land-use optimization policies.

2 Study area and data materials

2.1 Study area

Beijing, located in the north of the Northern China Plain, is the capital of China. It covers an area of approximately 16,800 km2. The geography in this region is characterized by alluvial plain in the south and east, and mountains and hills in the north and west (Wu et al., 2006). The average annual temperature ranges from 9.76℃ to 13.42℃, and the average annual precipitation from 424 mm to 628 mm. In the last two decades, Beijing has experienced rapid population growth and urbanization processes. The population grew from 8.71 million in 1978 to 21.70 million in 2015. Population growth brings huge demand for built-up areas. The built-up land area grew from 1461 km2 in 1990 to 2785 km2 in 2010. In the process, 1288 km2 of arable land was converted to built-up land. Beijing is a typical region to study land-use changes in urbanization processes (Han et al., 2015). Since the carbon sequestration capability of land-use systems is reduced because of land-use changes in the urbanization processes (Lal, 2004), and population growth leads to the high consumption of non-renewable energy (Zhao et al., 2017), Beijing is under high pressure of the carbon balance and pollution. In order to restrict urban expansion and improve the carbon sequestration function of land-use systems, it is necessary to couple land-use optimization and SOCP in this region.

2.2 Data materials

The land-use data of Beijing (1990, 2000, and 2010) was acquired from the Data Center for Resources and Environmental Sciences, Chinese Academy of Sciences (RESDC) (Liu et al., 2002). The data was interpreted from Landsat TM images with a man-machine interactive method with an overall accuracy of 81% (Liu et al., 2002). The format of the database is grid with a spatial resolution of 100 m × 100 m (Figure 1). The spatial distribution data of the average annual temperature and precipitation from 1990 to 2010 was taken from the records of meteorological stations during this period (http://data.cma.cn/). The Kriging interpolation method was employed to translate the stations’ recorded data to spatial distribution maps with a spatial resolution of 100 m × 100 m (Appendix A). Spatial distribution maps of soil properties, including soil pH, soil clay, soil bulk density and SOC density, came from the China Soil Map (Fischer et al., 2008) (Appendix B). The data was obtained from the Cold and Arid Regions Sciences Data Center at Lanzhou (http://westdc.westgis.ac.cn) (Liu et al., 2006). The data was developed based on the Second National Soil Survey, which was conducted from the late 1970s to the early 1990s.
Figure 1 Spatial distribution maps of land-use types in Beijing, 1990-2010

3 Methods

3.1 Modeling of land-use changes

3.1.1 Model framework
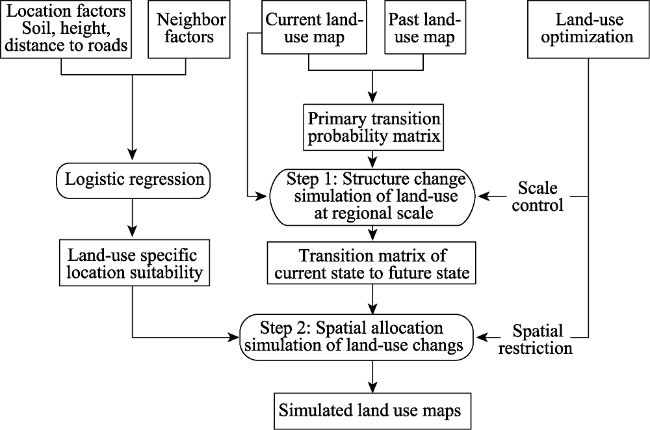
There are two steps in simulating land-use change under different land-use optimization policies. The first step is to simulate the structure changes of land-use types at the regional scale. The second step is to simulate the spatial distribution change at the grid scale (Figure 2). In the first step, both the historical transition probability matrix and the scale control rules are developed to design the future transition matrix. In the second step, the future transition matrix of land-use change is spatially distributed based on the location suitability of land-use types and the spatial restriction rules.
Figure 2 Model framework of land-use change simulation
3.1.2 Structure change simulation of land use at the regional scale
In this model, we assume that the uncontrolled land-use change is submitted to a Markov process (Weng, 2002) and the transition probability matrix is stable in different time states (Alqurashi et al., 2016). The future transition between land-use types can be simulated based on the historical transition probability matrix, which are described in Eqs.1 and 2.
${{p}_{h}}=\prod\limits_{t=1}^{m-1}{\left( \overline{{{p}_{h}}}\times \overline{{{p}_{h}}} \right)}$ (1)
${{p}_{f}}=\prod\limits_{t=1}^{n-1}{\left( \overline{{{p}_{h}}}\times \overline{{{p}_{h}}} \right)}$ (2)
where ph, $\overline{{{p}_{h}}}$ and pf refer to the historical transition probability matrix, the annual transition probability matrix from past state to current state and the transition probability matrix from current state to future state, respectively. m and n refer to the time step (year) from past state to current state, and current state to future state, respectively.
Since the annual transition probability matrix cannot be directly acquired from the matrix multiplication, a gradient descent approach is employed to obtain the annual transition probability matrix (Yao et al., 2016). The transitions between land-use types from the current state to future state and the land-use areas in the future state can be simulated with Eqs.3 and 4.
${{A}_{ij,f}}={{A}_{i,c}}\times {{p}_{ij,f}}$ (3)
${{A}_{j,f}}={{\Sigma }_{i}}{{A}_{ij,f}}$ (4)
where pij,f and Aij,f refer to the transition probability and transition area from land-use i to j from current state to future state, respectively. Ai, c and Aj, f refer to the area of land-use i in current state and the area of land-use j in future state, respectively.
The scale control policy is a common strategy of land-use optimization. Since the land-use change is a flexible, stable and self-organized process (Verburg et al., 2002), we assumed that the uncontrolled transition matrix reflecting the historical knowledge of land-use changes, would self-adjust to meet the land-use demand of scale control policies with minimum cost (Duan et al., 2006). In this article, the cost is measured by the cross-entropy from the uncontrolled transition matrix to the controlled matrix. The object to derive the controlled matrix with scale control policies is to minimize the value of the cross-entropy cost (Eq.5).
$Min\ H=Min\left[ \sum\limits_{i=1}^{n}{\sum\limits_{j=1}^{n}{{{p}_{ij,f}}\times \ln \left( \frac{{{p}_{ij,f}}}{p_{ij,f}^{*}} \right)}} \right]$ (5)
where pij, f and $p_{ij,f}^{*}$ refer to the transition probabilities from land-use type of i to j in the controlled and uncontrolled matrixes, respectively. n refers to the number of land-use types.
The constraint conditions can be described by Eqs.6 and 7.
$\sum\limits_{j=1}^{n}{p_{ij,f}^{*}=1}$ (6)
$\sum\limits_{i=1}^{n}{\left( p_{ij,f}^{*}\times {{A}_{i,c}} \right)}={{D}_{j}}$ (7)
where Dj represents the scale control value of land-use type j.
The constraint optimization problem can be translated into a non-constraint optimization problem with the Lagrangian multiplier method (Bertsekas, 2014), and the translated project function can be described by Eq.8.
$\text{Min}\ {{H}^{*}}=\text{Min}\left\{ {{\Sigma }_{i}}{{\Sigma }_{j}}{{p}_{ij,f}}\times \ln \left( \frac{{{p}_{ij,f}}}{p_{ij,f}^{*}} \right)+{{\Sigma }_{i}}{{\alpha }_{i}}\times \left( {{\Sigma }_{j}}p_{ij,f}^{*}-1 \right)+{{\beta }_{j}}*\left[ {{\Sigma }_{i}}\left( p_{ij,f}^{*}*{{A}_{i,c}} \right)-{{D}_{j}} \right] \right\}$ (8)
The function can be solved with the first optimal conditions, which can be described by Eqs.9-11.
$\frac{\partial {{H}^{*}}}{\partial p_{ij,f}^{*}}=-\frac{{{p}_{ij,f}}}{p_{ij,f}^{*}}+{{\alpha }_{i}}+{{\beta }_{j}}\times {{A}_{i,c}}=0$ (9)
${{\Sigma }_{j}}p_{ij,f}^{*}=1$ (10)
${{\Sigma }_{i}}\left( p_{ij,f}^{*}\times {{A}_{i,c}} \right)={{D}_{j}}$ (11)
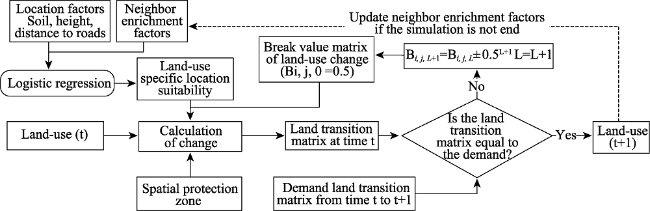
3.1.3 Spatial allocation simulation
On the basis of land transition matrix simulated at the region scale, the spatial allocation module is employed to simulate the spatial allocation change at the grid scale. In this module, the land-use specific location suitability of different land-use types and the spatial protection planning strategies were considered to derive the spatial allocation change (Figure 3).
Figure 3 Spatial allocation module of land-use change simulation
The land-use specific location suitability from current land-use type i to the target land-use type j at the specific location loc is determined by the location factors, i.e. soil texture, height, distance, etc., and the neighbor enrichment factors (Verburg et al., 2004) (Eqs.12 and 13).
${{S}_{j,(loc,i)}}=\frac{1}{1+{{e}^{\left( {{L}_{X,(loc,i)}}*{{W}_{L,X,j}}+{{N}_{X,(loc,i)}}*{{W}_{N,X,j}}+a \right)}}}$ (12)
${{N}_{x,(loc,i)}}=\frac{{{n}_{x,(loc,i)}}/{{n}_{(loc,i)}}}{{{N}_{x}}/N}$ (13)
where Sj,(loc,i) represents the logistics probability of the specific location loc changing from land-use type i to j, LX,(loc, i) represents the value vector of local driving factors such as slope, height, distance to main roads, etc., WL,X,j represents the weight vector corresponding to the value vector of local driving factors, NX,(loc,i) represents the value vector of neighbor enrichment factors, and WN,X,j represents the weight vector of the neighbor enrichment vector. a represents the intercept value of the regression model. Nx,(loc,i) and nx,(loc,i) represent neighbor enrichment value of land-use type x and the number of grids with land-use type x in the neighborhood of land grid loc with land-use type of i, respectively; n(loc,i) represents the total amount of grids for all land-use types in the neighborhood of the land grid, Nx represents the amount of grids of land-use type x in the study area, and N represents the total amount of grids in the study area.
The transition probability from current land-use type i to the target land-use type j at the specific location loc (Pj, (loc, i)) is determined by both the suitability and the spatial restriction rules (Eq.14).
${{P}_{j,(loc,\ i)}}={{\left[ {{S}_{j,\ (loc,\ i)}}\times pr{{t}^{\left| sgn(i-j) \right|}} \right]}^{pr{{t}^{1-\left| sgn(i-j) \right|}}}}$ (14)
where prt is equal to 0 when the specific location falls in the spatial protection zone, prt is equal to 1 when the specific location does not fall in the spatial protection zone. sgn refers to the sign function. |sgn(i-j)| equals 0 when i is equal to j, and equals 1 when i is not equal to j.
Whether the specific location loc will change from current land-use type i to j is determined by whether the transition probability value at this location is greater than the break value (Eq.15). The original break value for all transition probabilities was set as 0.5. The aggregate number of change areas will be calculated for every iteration and the break value will be modified in the next iteration until the aggregate results of land-use changes at the grid scale meet the demand of transition matrix at the region scale (Eq.15).
${{B}_{i,j,L+1}}={{B}_{i,j,L}}+{{0.5}^{L+1}}*\frac{\left| {{\Sigma }_{loc,i}}({{P}_{j,(loc,i)}}>{{B}_{i,j,t}})-{{T}_{i,j}}+0.0001 \right|}{{{\Sigma }_{loc,i}}({{P}_{j,(loc,i)}}>{{B}_{i,j,t}})-{{T}_{i,j}}+0.0001}$ (15)
where Bi, j, L represents the break value of land-use transition from i to j at step L. Σloc,i (Pj,(loc,i) >Bi, j, t) represents the amount of grids of land-use type i and the transition probability to j is greater than the break value. Ti, j represents the demand transition number of grid from i to j which is determined by the structure change simulation module at the regional scale.

3.2 Effects of land-use changes on SOCP

The urbanization process, featuring land-use change from agricultural land or ecological land to built-up areas, will lead to decrease of SOCP due to soil sealing. On the contrary, reclamation or reforestation will lead to increase of SOCP due to the conversion from built-up land to agricultural or ecological land. In this article, we presumed that the land-use change between agricultural land and ecological land has no effects on SOCP.
The assessment of SOCP first requires the calculation of the saturation and existing level of SOC (Eq.16) (Qin et al., 2013). The existing level of SOC is estimated based on the China Soil Map (Eq.17) (Pan et al., 2004). The saturation level of SOC is estimated based on the statistical model including precipitation, temperature, irrigation, and soil properties (Qin and Huang, 2010) (Eq.18).
$SO{{C}_{P}}=SO{{C}_{S}}-SO{{C}_{E}}$ (16)
$SO{{C}_{E}}=SO{{C}_{C}}\times D\times BD\times (1-F)\times {{10}^{-1}}$ (17)
$SO{{C}_{S}}=140.5\times {{e}^{-0.021*MT}}-98.8\times {{e}^{-0.42MW}}-39.6\times {{e}^{-0.1CL}}-4.1\times pH-27.7$ (18)
where SOCp and SOCS refer to the SOCP and the saturation level of SOC of soil, respectively. SOCE refers to the existing level of SOC (t C/ha) and SOCC refers to the existing SOC concentration (g C/kg). D refers to the corresponding soil depth (20 cm). BD and F refer to the soil bulk density (g/cm3) and the soil gravel content (%), respectively. MT and MW refer to the mean annual temperature (℃) and water input (precipitation and irrigation for agricultural land, precipitation for ecological land; unit: 100 mm), respectively. CL and pH refer to the soil clay fraction (%) and soil pH, respectively.

4 Results

4.1 Model validation

4.1.1 Quantity validation
The structure change of land-use systems was simulated based on the transition probability matrix. The probability matrix would remain stable with the historical matrix in the uncontrolled scenario. The uncontrolled matrix could self-adjust to meet the demand of the scale control scenario with minimum cost of cross-entropy. To validate the model, we adopted the transition probability matrix obtained from the historical matrix (1990-2000) and predicted the structure of land-use types in 2010 with the uncontrolled scenario and scale-control scenario, where the scale of built-up land would be controlled as the observed value in 2010. The NRMSE value was employed to evaluate the accuracy of the prediction by comparing the predicted area with the observed area of land-use types in Beijing, 2010 (Table 1).
Table 1 Quantity validation of land-use structure simulated in 2010
Land-use type Observed area
(ha)
Uncontrolled scenario Scale control scenario
Predicted area (ha) Error (%) Predicted area (ha) Error (%)
Built-up land 278464 283675 1.87 278464 -
Agricultural land 444089 420205 -5.38 424308 -4.45
Ecological land 918253 934608 1.78 935716 1.90
NRMSE 0.0278 0.0249
The absolute errors of quantity prediction of land-use types of the uncontrolled and scale-control scenarios range from 1.78% to 5.38%, and 1.90% to 4.45%, respectively. The NRMSE value of the scale control scenario is 0.0249, a little smaller than that in the uncontrolled scenario (0.0278). It can be concluded that the model is satisfied in the two scenarios. Furthermore, the accuracy would be improved with the cross-entropy optimization method when the scale of specific land-use type is controlled.
4.1.2 Spatial validation
In this research, the spatial allocation change of land-use types was simulated based on the structure change simulation at the region scale and the land-use specific suitability driven by the location and neighbor factors of land-use cells. To validate the spatial allocation accuracy of the model, we simulated the spatial land-use change from 2000 to 2010 based on the land-use map of 2000 and the transition probability matrix from 2000 to 2010. The kappa statistical approach with multi fuzzy radius (Duan et al., 2004; Pontius et al., 2008) was employed to validate the spatial simulation accuracy of the model.
The kappa coefficient of different land-use types ranges from 0.79 to 0.93 via different fuzzy radius. The aggregate kappa coefficient ranges from 0.87 to 0.91. Both the specific kappa and the aggregate kappa show a positive correlation with the increase of fuzzy radius (Figure 4). It can be concluded that spatial validation acquired satisfactory results at both the detailed and aggregate levels.
Figure 4 Kappa values of land-use simulation of Beijing, 2010

4.2 Results of land-use change simulation

4.2.1 Scenario setting
Three scenarios were designed in this research to assess the effects of land-use optimization on the SOCP from 2010 to 2030 in Beijing. The uncontrolled scenario (UCS) was designed as the basic scenario to simulate land-use changes following the historical trend of land-use changes. The scale control scenario (SCS) was designed to simulate land-use changes in which the scale of built-up land was controlled to reduce to 2760 km2 in 2030 based on the overall urban plan of Beijing (http://www.china.org.cn/china/2017-03/30/content_40527731.htm). The spatial restriction scenario (SRS) was designed to simulate land-use changes in which the spatial locations with high SOCP (greater than 20 t C/ha) were set as the protection zone. Land-use types of grid in the protection zone would not change during the simulation period.
4.2.2 Simulation results on land-use changes
In this research, we assumed that the spatial restriction policy would have no effect on the structure change of land-use types at the regional scale. Therefore, the transition probabilities and the structure change of land-use types in the SRS would be the same as that in the UCS. The transition probability from agricultural land to built-up land between 2010 and 2030 would significantly decrease from 0.1822 in the UCS to 0.0680 in the SCS. Meanwhile, the transition probability from ecological land to built-up land would significantly decrease from 0.0163 in the UCS to 0.0035 in the SCS. On the contrary, the transition probability from built-up land to agricultural land and ecological land would increase from 0.0008 in the UCS to 0.0487 in the SCS, and from 0.0013 in the UCS to 0.0801 in the SCS, respectively. It can be concluded that the scale control policy of built-up land would both limit the urbanization process and facilitate the reclamation/reforestation process (Tables 2 and 3). As a consequence, the structure change of land-use types from 2010 to 2030 in the SCS is significantly different from that in the UCS (Figure 5).
Table 2 Transition probabilities of land-use types in the uncontrolled scenario (UCS), 2010-2030
Land-use type 2030
Built-up land Agricultural land Ecological land
Land-use type 2010 Built-up land 0.9979 0.0008 0.0013
Agricultural land 0.1822 0.8106 0.0072
Ecological land 0.0163 0.0019 0.9818
Table 3 Transition probabilities of land-use types in the scale control scenario (SCS), 2010-2030
Land-use type 2030
Built-up land Agricultural land Ecological land
Land-use type 2010 Built-up land 0.8712 0.0487 0.0801
Agricultural land 0.0680 0.9238 0.0082
Ecological land 0.0035 0.0019 0.9946
Figure 5 Land-use structure changes of Beijing in different scenarios
Although the scale control policy would restrict the urbanization process and facilitate the reclamation/reforestation process, the central city of the study area would expand both in the UCS or SCS. The major area of the expansion would occur in the southern plain of the region, which is also the major area of agricultural land (Figure 6). The spatial restriction policy would significantly influence the spatial expansion of built-up land, and the spatial expansion of built-up land in the southern plain would be significantly restricted in the SRS. It can be concluded that both the scale control and spatial restriction policies would influence the spatial allocation change of land-use types and this influence is different from different locations and different policies.
Figure 6 Land-use change simulation results of Beijing under different scenarios

4.3 Effects of land-use optimization on SOCP

4.3.1 SOCP estimated of Beijing in 2010
Based on the spatial database of soil and land-use maps, we estimated the existing level of SOC, saturation level of SOC and SOCP of the top soil (0-20 cm) in Beijing in 2010 using the SOCP estimating method (Figure 7).
Figure 7 Spatial maps of SOC in Beijing, 2010
The existing SOC density in Beijing averaged 30.76 t C/ha and 33.36 t C/ha in agricultural land and ecological land, respectively. Based on recommended management practices of agricultural land and natural restoration of ecological land, the saturation level of SOC would reach an average value of 47.60 t C/ha and 49.61 t C/ha in agricultural land and ecological land, respectively. The SOCP of agricultural land and ecological land can reach 23.82 Tg C or averaged 18.27 t C/ha in Beijing (Figure 8). The major zone of SOCP of agricultural land is found in the southeast and northeast of the region.
Figure 8 Average SOCP in Beijing, 2010 (SOC, soil organic carbon; SOCE, existing SOC level of the top soil (0-20 cm); SOCS, saturation SOC level of the top soil; SOCP, SOC sequestration potential of the top soil)
4.3.2 Effects of land-use optimization on SOCP
Combining the land-use change simulation results from 2010 to 2030 under the three scenarios (UCS, SCS, SRS) and the SOCP (0-20 cm) estimating results of Beijing in 2010, the SOCP in the region would decrease 1.73 Tg C in the UCS (from 23.82 to 22.09 Tg C), 0.95 Tg C in the SRS, and increase 0.06 Tg C in the SCS between 2010 and 2030 because of land-use changes. The average SOCP would increase from 18.27 t C/ha to 18.91 t C/ha in the SRS (Figure 9). The average SOCP in agricultural land would increase from 18.51 t C/ha to 20.26 t C/ha in the SRS. The average SOCP in ecological land would increase from 18.14 t C/ha to 18.34 t C/ha in the SRS (Figures 8 and 10). It can be concluded that both the scale control and spatial restriction policies would have positive effects on the SOCP of land-use systems.
Figure 9 Effects of land-use changes on SOCP from 2010 to 2030 in different scenarios (SOCP, soil organic carbon sequestration potential of top soil of 0-20 cm)
Figure 10 Average SOCP of Beijing in 2030 in different scenarios (SOCP, soil organic carbon sequestration potential of top soil of 0-20 cm)

5 Discussion

In this research, we developed a land-use change simulation model to simulate the structure and spatial allocation changes of land use under different optimization scenarios. The model is genetic since it is developed on the basis of the historical knowledge of land-use changes, and it is also flexible since it can be easily adapted to the scale control or spatial restriction policies. The spatial allocation simulation module in the model was developed based on the historical transition probability matrix instead of the land-use type specific settings, as in the CLUE-S model. Since the specific settings of conversion elasticity of land-use types in the CLUE-S model are often empirically based, the model developed in this research can improve the uncertainties of land-use change simulation.
The saturation level of SOC of agricultural and ecological land was estimated by a statistical model driven by temperature, irrigation, precipitation, soil clay, and soil pH. This model was developed based on the information from 95 global long-term agricultural experiments (Qin and Huang, 2010). The model was validated against independent data from 19 long-term agricultural experiments in China, and results suggest that the model performs well (Qin and Huang, 2010). The model has been widely adopted to estimate the saturation level of SOC in agricultural systems (Qin and Huang, 2010; Luo et al., 2011; Qin et al., 2013). Since the model was developed and validated based on the information of agricultural systems, it would increase the uncertainty of this research using the model to estimate the saturation level of SOC of ecological land. However, the major land-use change in Beijing is the conversion between agricultural land and built-up land (He et al., 2001; Wu et al., 2006). The area and allocation of ecological land are relatively stable in historical and future land-use changes. In consequence, the uncertainty of the SOC saturation estimation of the ecological land has little effect on the research result.
Recent studies show that built-up land can also sequester carbon in soil through the application of residuals to pervious surfaces (Lorenz and Lal, 2009; Brown et al., 2012). However, whether the soil could sequester C in the built-up land is correlated with both the scale and management practices of pervious surfaces, and few studies have been conducted to reveal the SOC sequestration of built-up land in China. In this article, the SOC sequestration in built-up land is neglected and we assume that the SOC level would not change in the built-up land. Similar assumptions can also be found in other studies (Grimm et al., 2008).
Despite the uncertainty of both land-use change simulation and SOCP estimation, this article provides a new way to estimate the effects of land-use optimization on the carbon sequestration function of land-use systems by coupling the land-use change simulation model and knowledge of SOC saturation. This coupling is new and essential since it can provide evidence for planning authorities to understand the relations between land-use optimization policies and the carbon sequestration function of land-use systems. It is also expected that the coupling model will be improved according to the development of land-use change simulation methods, the theoretical improvement of soil carbon saturation, and the long-term experimental data accumulation in different land-use systems.
The methods and results presented in this research are universal and representative and they are applicable to other regions. First, the land-use change simulation model developed in this article is applicable to simulate and analyze land-use changes with land-use optimization scenarios in other regions. Second, the coupling of land-use change simulation and the carbon sequestration function of land-use systems should also be applied to other regions where landscape is dramatically changing as a consequence of urbanization. It is necessary to discuss the effects of land-use changes on the carbon sequestration function of land-use systems in these regions and to evaluate the effects of land-use optimization policies on the basis of this coupling analysis.

6 Conclusions

In order to estimate the effects of land-use optimization on SOCP and improve the SOC sequestration function of land-use systems through land-use optimization policies, a coupling analysis was conducted by combining a land-use change simulation model and the SOCP (0-20 cm) estimating method in this research. The effects of land-use changes on SOCP were estimated based on SOC saturation knowledge. Three land-use optimization scenarios were designed and studied in this research to discuss the effects of land-use optimization on land-use changes and SOCP from 2010 to 2030 in Beijing. The results demonstrated that land-use changes significantly influence the SOCP, and that both the scale control of built-up land and the spatial restriction setting of high SOCP areas can have a positive effect on the carbon sequestration function of land-use systems in Beijing.
Some specific measures can be adopted to improve the carbon sequestration function of land-use systems. First, controlling the scale of built-up land should consider not only population growth but also the balance of carbon sequestration. Second, areas of high SOCP should be recognized and protected based on the carbon saturation knowledge. These areas are important carbon pools, and can constitute a restriction line to shape the expansion of built-up land.

Acknowledgments

We wish to thank the timely help given by Dr. Song Wei in improving the writing of this article. The land-use change simulation model was developed with Python language and was registered in the Copyright Protection Center of China (registration No. 2017SRBJ0017). The model is open source. Anyone is free to use the model under the MIT license from https://github.com/YaoJT/LCMS.

Appendix A

Figure A The average annual temperature and precipitation maps of Beijing from 1990 to 2010

Appendix B

Figure B Spatial distribution maps of soil properties in Beijing, 2010
Note: The data was developed based on the Second National Soil Survey, which was conducted from the late 1970s to the early 1990s.

The authors have declared that no competing interests exist.

[1]
Alqurashi A F, Kumar L, Sinha P, 2016. Urban land cover change modelling using time-series satellite images: A case study of urban growth in five cities of Saudi Arabia.Remote Sensing, 8(10): 838.

DOI

[2]
Al-sharif A A, Pradhan B, 2014. Monitoring and predicting land use change in Tripoli Metropolitan City using an integrated Markov chain and cellular automata models in GIS.Arabian Journal of Geosciences, 7(10): 4291-4301.The rapid development of cities in developing countries results in deteriorating of agricultural lands. The majority of these agricultural lands are converted to urban areas, which affects the ecosystems. In this research, an integrated model of Markov chain and cellular automata models was applied to simulate urban land use changes and to predict their spatial patterns in Tripoli metropolitan area, Libya . It is worth mentioning that there is not much research has been done about land use/cover change in Libyan cities. In this study, the performance of integrated CA arkov model was assessed. Firstly, the Markov chain model was used to simulate and predict the land use change quantitatively; then, the CA model was applied to simulate the dynamic spatial patterns of changes explicitly. The urban land use change from 1984 to 2010 was modelled using the CA arkov model for calibration to compute optimal transition rules and to predict future land use change. In validation process, the model was validated using Kappa index statistics which resulted in overall accuracy more than 85 %. Finally, based on transition rules and transition area matrix produced from calibration process, the future land use changes of 2020 and 2025 were predicted and mapped. The findings of this research showed reasonably good performance of employed model. The model results demonstrate that the study area is growing very rapidly especially in the recent decade. Furthermore, this rapid urban expansion results in remarkable continuous decrease of agriculture lands.

DOI

[3]
Angers D A, Arrouays D, Saby N P A et al., 2011. Estimating and mapping the carbon saturation deficit of French agricultural topsoils.Soil Use and Management, 27(4): 448-452.The concept of soil organic C (SOC) saturation suggests that the quantity of stable SOC is limited and determined by the amount of fine particles (clay + fine silt, Clay + fSilt). The difference between the theoretical SOC saturation value and the measured SOC one for the fine fraction corresponds to the soil saturation deficit and may represent the potential for SOC sequestration in a stable form. We calculate the saturation deficit of French arable soils based on the national soil test database and using the saturation equation. For the whole database (n = 1 454 633), the median saturation deficit was 8.1 gC/kg and this generally increased with the Clay + fSilt content to reach a maximum of 500 g/kg. National mapping of the SOC saturation deficit allowed investigation of spatial variation and controlling factors. Saturated soils were found in localities with specific land use (grassland, meadows) or farming systems (livestock production with high manure production). Smaller deficits occurred at higher altitudes, probably due to the combined effect of cooler temperature and the presence of meadows. Some very sandy soils appeared to be almost saturated, largely due to their very small fine fraction. Soils in the highly cultivated plains in the northern half of the country had a significant saturation deficit. Soils in the southern part of the country had the highest saturation deficit because of the combined effects of climatic factors (low production, high temperature) and land use (vineyards, orchards). Analysis of communal data revealed significant correlations at the national level with Clay + fSilt (r = 0.59), pH (r = 0.44) but also with the proportion of grassland in the cultivated area (r = 0.47). Some areas had apparent oversaturation which may be due to uncertainty associated with the theoretical C saturation equation because of overestimation of the stable soil C fraction. Mapping the C saturation deficit at the national scale demonstrates the influence of climate, soil parameters and land use on the SOC stabilization potential and indicates that a significant proportion of agricultural soils have potential for further SOC storage.

DOI

[4]
Ardö J, Olsson L, 2003. Assessment of soil organic carbon in semi-arid Sudan using GIS and the CENTURY model. Journal of Arid Environments, 54(4): 633-651.Using the UNFCCC as a basis, and the objectives of estimating soil organic carbon (SOC) changes during the period 1900–2100, a spatially explicit database of climate, land cover and soil texture was compiled for a 262,000 km 2 region in semi-arid Sudan. The area is characterized by low input cultivation of millet, sorghum and sesamé combined with livestock grazing. By integrating the database with the CENTURY ecosystem model, we were able to estimate historical, current and future pools of SOC as a function of land management and climate. The SOC (upper 20 cm) decrease from 1900 to 2000 was estimated to be 6·8 Mt and the maximum potential carbon sink (SOC increase) for the period 2000 to 2100 was estimated to be 17 Mt. Cropland and grassland lost 293 and 152 t SOC km 612 respectively whereas the savannahs gained 76 t SOC km 612 from 1900 to 2000. The SOC sequestration scenario simulated during 2000–2100 recovered 94, 84 and 75 t km 612 for cropland, grassland and savannah respectively. In addition to climate and soils, cropping intensity, fallow periods, fire frequency and grazing intensity also influence cropland SOC variation. Grassland and savannah SOC variations depend on grazing intensity and fire return interval. Land management may affect future amounts of SOC in semi-arid areas thereby turning them from sources into sinks of carbon. SOC estimates were reasonably consistent with measurements ( r 2=0·70, n=13).

DOI

[5]
Armstrong R D, Millar G, Halpin N V et al., 2003. Using zero tillage, fertilisers and legume rotations to maintain productivity and soil fertility in opportunity cropping systems on a shallow vertosol.Australian Journal of Experimental Agriculture, 43(2): 141-153.The effect of 2 tillage practices (zero

DOI

[6]
Bayer C, Lovato T, Dieckow J et al., 2006. A method for estimating coefficients of soil organic matter dynamics based on long-term experiments.Soil and Tillage Research, 91(1/2): 217-226.The one-compartment C model C t = C 0 e 61 k 2 t + k 1 A / k 2 ( 1 61 e 61 k 2 t ) is being long used to simulate soil organic C (SOC) stocks. C t is the SOC stock at the time t; C 0, the initial SOC stock; k 2, the annual rate of SOC loss (mainly mineralization and erosion); k 1, the annual rate to which the added C is incorporated into SOC; and A, the annual C addition. The component C 0 e 61 k 2 t expresses the decay of C 0 and, for a time t, corresponds to the remains of C 0 ( C 0 remains). The component k 1 A / k 2 ( 1 61 e 61 k 2 t ) refers, at time t, to the stock of SOC derived from C crops ( C crop). We herein propose a simple method to estimate k 1 and k 2 coefficients for tillage systems conducted in long-term experiments under several cropping systems with a wide range of annual C additions ( A) and SOC stocks. We estimated k 1 and k 2 for conventional tillage (CT) and no-till (NT), which has been conducted under three cropping systems (oat/maize 61O/M, vetch/maize 61V/M and oat + vetch/maize + cowpea 61OV/MC) and two N-urea rates (0 kg N ha 611 610 N and 180 kg N ha 611 61180 N) in a long-term experiment established in a subtropical Acrisol with C 0 = 32.55 Mg C ha 611 in the 0–17.5 cm layer. A linear equation ( C t = a + bA) between the SOC stocks measured at the 13th year (0–17.5 cm) and the mean annual C additions was fitted for CT and NT. This equation is equivalent to the equation of the model C t = C 0 e 61 k 2 t + k 1 A / k 2 ( 1 61 e 61 k 2 t ), so that a = C 0 e 61 k 2 t and b A = k 1 A / k 2 ( 1 61 e 61 k 2 t ). Such equivalences thus allow the calculation of k 1 and k 2. NT soil had a lower rate of C loss ( k 2 = 0.019 year 611) than CT soil ( k 2 = 0.040 year 611), while k 1 was not affected by tillage (0.148 year 611 under CT and 0.146 year 611 under NT). Despite that only three treatments had lack of fit (LOFIT) value lower than the critical 5% F value, all treatments showed root mean square error (RMSE) lower than RMSE 95% indicating that simulated values fall within 95% confidence interval of the measurements. The estimated SOC stocks at steady state ( C e) in the 0–17.5 cm layer ranged from 15.65 Mg ha 611 in CT O/M 0 N to 60.17 Mg ha 611 in NT OV/MC 180 N. The SOC half-life ( t 1/2 = ln 2/ k 2) was 36 years in NT and 17 years in CT, reflecting the slower C turnover in NT. The effects of NT on the SOC stocks relates to the maintenance of the initial C stocks (higher C 0 remais), while increments in C crop are imparted mainly by crop additions.

DOI

[7]
Bertsekas D P, 2014. Constrained Optimization and Lagrange Multiplier Methods. Academic Press.

[8]
Blair N, Faulkner R D, Till A R et al., 2006. Long-term management impacts on soil C, N and physical fertility: Part I: Broadbalk experiment.Soil and Tillage Research, 91(1/2): 30-38.

DOI

[9]
Brown S, Miltner E, Cogger C, 2012. Carbon sequestration potential in urban soils. In: Carbon Sequestration in Urban Ecosystems. Springer: 173-196.

[10]
Chapin III F S, Matson P A, Vitousek P, 2011. Principles of terrestrial ecosystem ecology. Springer Science & Business Media.The ecosystem approach to ecology treats organisms and the physical elements of their environment as components of a single, integrated system. This comprehensive textbook outlines the central processes that characterize terrestrial ecosystems, tracing the flow of water, carbon, and nutrients from their abiotic origins to their cycles through plants, animals, and decomposer organisms. As human activity becomes an increasingly dominant factor in natural processes around the globe, landscape dynamics over time and space have become the focus of recent attention. This book synthesizes current advances in ecology with established theory to offer a complete survey of ecosystem pattern and process in the terrestrial environment. Featuring review questions at the end of each chapter, suggestions for recommended reading, and a glossary of ecological terms, Principles of Terrestrial Ecosystem Ecology will be an important text suitable for use in all courses on ecosystem ecology. Resource managers, land use managers, and researchers will also welcome its thorough presentation of ecosystem essentials. About the Authors F. Stuart Chapin, III is Professor of Ecology at the Institute for Arctic Biology, University of Alaska at Fairbanks. Pamela Matson is Professor in the Department of Geological and Environmental Sciences and the Institute of International Studies, Stanford University; Director of the Earth Systems Degree Program and co-director of the Center for Environmental Science and Policy, Stanford University; and currently serves as president of the Ecological Society of America. Harold A. Mooney is Professor of Environmental Biology at Stanford University.

DOI

[11]
Chung H, Grove J H, Six J, 2008. Indications for soil carbon saturation in a temperate agroecosystem.Soil Science Society of America Journal, 72(4): 1132-1139.The soil C saturation concept postulates that there is an upper limit to the equilibrium soil C level of mineral soils even when soil C input is increased. To test this concept, we analyzed the relationship between steady-state soil C input and soil organic C (SOC) concentration in a temperate corn (Zea mays L.) agroecosystem experiment located in Lexington, KY. In this experiment, a gradient in plant productivity and consequent C input to the soil was produced with four N application rates (0, 84, 168, and 336 kg N ha

DOI

[12]
Du Z L, Wu W L, Wu Q Z et al., 2014. Long-term manure amendments enhance soil aggregation and carbon saturation of stable pools in North China Plain.Journal of Integrative Agriculture, 13(10): 2276-2285.Organic amendment is considered as an effective way to increase soil organic carbon (SOC) stock in croplands. To better understand its potential for SOC sequestration, whether SOC saturation could be observed in an intensive agricultural ecosystem receiving long-term composted manure were examined. Different SOC pools were isolated by physical fractionation techniques of a Cambisol soil under a long-term manure experiment with wheat-maize cropping in North China Plain. A field experiment was initiated in 1993, with 6 treatments including control (i.e., without fertilization), chemical fertilizer only, low rate of traditional composted manure (7.5 t ha611), high rate of traditional composted manure (15 t ha611), low rate of bio-composted manure (7.5 t ha611) and high rate of bio-composted manure (15 t ha611). The results showed that consecutive (for up to 20 years) composted manure amendments significantly improved soil macro-aggregation, aggregate associated SOC concentration, and soil structure stability. In detail, SOC concentration in the sand-sized fraction (>53 μm) continued to increase with manure application rate, while the silt (2–53 μm) and clay (>2 μm) particles showed no further increase with greater C inputs, exhibiting the C saturation. Further physical separation of small macro-aggregates (250–2 000 μm) into subpools showed that the non-protected coarse particulate organic matter (cPOM, >250 μm) was the fraction in which SOC continued to increase with increasing manure application rate. In contrast, the chemical and physical protected C pools (i.e., micro-aggregates and silt-clay occluded in the small macro-aggregates) exhibited no additional C sequestration when the manure application rate was increased. It can be concluded that repeated manure amendments can increase soil macro-aggregation and lead to the increase in relatively stable C pools, showing hierarchical saturation behavior in the intensive cropping system of North China Plain.

DOI

[13]
Duan Z Q, Verburg P H, Zhang F R et al., 2004. Construction of a land-use change simulation model and its application in Haidian District, Beijing.Acta Geographica Sinica, 59(6): 1037-1047. (in Chinese)CLUE-s (Conversion of Land Use and its Effects in small extent) is a model for simulating spatial changes in land use. The model was applied for regional agriculture and forest land-use system simulations in many countries. The author extended the CLUE-s model with a dynamic neighborhood analysis. The extended model (CLUE-sII) could simulate the self-organizational processes, spontaneous processes and the competition processes of the land-use changes. CLUE-sII can also implement different simulation schemes according to the characteristics of the study area. The local factors and the neighborhood factors play different roles in each scheme. Therefore, the researchers could find the best scheme for the specific study area. Land use change from 1991 to 2001 is simulated using CLUE-sII for Haidian District, Beijing. The results indicate that neighborhood factor analyse is important to simulate urban land-use changes and the scheme that took the neighborhood factor as a magnifying factor to the spontaneous processes obtained the best results, with which the whole map correspondence proportion gained 77% and the Kappa of urban attained 0.754. The case study in this paper showed that CLUE-sII could simulate urban sprawl with multiple land-use types at a high spatial and temporal resolution. Through constructing multiple simulation schemes, one can not only find the best simulation performance, but also could obtain more information on the importance of different land-use drivers.

DOI

[14]
Duan Z Q, Zhang F R, Miao L M, 2006. Land use scenario analysis based on the IPAT-S script language method and its application.Transactions of the Chinese Society of Agricultural Engineering, 22(7): 75-81.

[15]
Fischer G, Nachtergaele F, Prieler S et al., 2008. Global agro-ecological zones assessment for agriculture (GAEZ 2008). IIASA, Laxenburg, Austria and FAO, Rome, Italy.

[16]
Foley J A, DeFries R, Asner G P et al., 2005. Global consequences of land use.Science, 309(5734): 570-574.

DOI

[17]
Grant R F, Juma N G, Robertson J A et al., 2001. Long-term changes in soil carbon under different fertilizer, manure, and rotation.Soil Science Society of America Journal, 65(1): 205-214.Soil C contents can be raised by land use practices in which rates of C input exceed those of C oxidation. Rates of C inputs to soil can be raised by continuous cropping, especially with perennial legumes, and by soil amendments, especially manure. We have summarized our understanding of the processes by which changes in soil C content are determined by rates of soil C input in the mathematical model We compared model output for changes in soil C with those measured in a Gray Luvisol (Typic Cryoboralf) at Breton, Alberta, during 70 yr of a 2-yr wheat (L.)–fallow rotation vs. a 5-yr wheat–oat (L.)–barley (L.)–forage–forage rotation with unamended, fertilized, and manured treatments. Model results indicated that rates of C input in the 2-yr rotation were inadequate to maintain soil C in the upper 0.15 m of the soil profile unless manure was added, but that those in the 5-yr rotation were more than adequate. Consequent changes of soil C in the model were corroborated by declines of 14 and 7 g C myrmeasured in the control and fertilized treatments of the 2-yr rotation; by gains of 7 g C myrmeasured in the manured treatment of the 2-yr rotation; and by gains of 4, 14, and 28 g C myrmeasured in the control, fertilized, and manured treatments of the 5-yr rotation. Model results indicated that soil C below 0.15 m declined in all treatments of both rotations, but more so in the 2-yr than in the 5-yr rotation. These declines were corroborated by lower soil C contents measured between 0.15 and 0.40 m after 70 yr in the 2- vs. 5-yr rotation. Land use practices that favor C storage appear to interact positively with each other, so that gains in soil C under one such practice are greater when it is combined with other such practices.

DOI

[18]
Grimm N B, Faeth S H, Golubiewski N E et al., 2008. Global change and the ecology of cities.Science, 319(5864): 756-760.Urban areas are hot spots that drive environmental change at multiple scales. Material demands of production and human consumption alter land use and cover, biodiversity, and hydrosystems locally to regionally, and urban waste discharge affects local to global biogeochemical cycles and climate. For urbanites, however, global environmental changes are swamped by dramatic changes in the local environment. Urban ecology integrates natural and social sciences to study these radically altered local environments and their regional and global effects. Cities themselves present both the problems and solutions to sustainability challenges of an increasingly urbanized world.

DOI PMID

[19]
Han B, Wang X, Ouyang Z, 2005. Saturation levels and carbon sequestration potentials of soil carbon pools in farmland ecosystems of China.Rural Eco-environment, 21(4): 6-11.

[20]
Han H, Yang C, Song J, 2015. Scenario simulation and the prediction of land use and land cover change in Beijing, China.Sustainability, 7(4): 4260-4279.

DOI

[21]
He C Y, Shi P J, Chen J et al., 2001. A study on land use/cover change in Beijing area.Geographical Research, 20(6): 680-687. (in Chinese)

[22]
Jiang W G, Chen Z, Lei Xuan et al., 2015. Simulating urban land use change by incorporating an autologistic regression model into a CLUE-S model.Journal of Geographical Sciences, 25(7): 836-850.The Conversion of Land Use and its Effects at Small regional extent (CLUE-S) model is a widely used method to simulate land use change. An ordinary logistic regression model was integrated into the CLUE-S model to identify explanatory variables without considering the spatial autocorrelation effect. Using image-derived maps of the Changsha-Zhuzhou-Xiangtan urban agglomeration, the CLUE-S model was integrated with the ordinary logistic regression and autologistic regression models in this paper to simulate land use change in 2000, 2005 and 2009 based on an observation map from 1995. Significant positive spatial autocorrelation was detected in residuals of ordinary logistic models. Some variables that were much more significant than they should be were selected. Autologistic regression models, which used autocovariate incorporation, were better able to identify driving factors. The Receiver Operating Characteristic Curve (ROC) values of autologistic regression models were larger than 0.8 and the pseudo R 2 values were improved, compared with results of logistic regression model. By overlapping the observation maps, the Kappa values of the ordinary logistic regression model (OL)-CLUE-S and autologistic regression model (AL)-CLUE-S models were larger than 0.75. The results showed that the simulation results were indeed accurate. The Kappa fuzzy (Kfuzzy) values of the AL-CLUE-S models (0.780, 0.773, 0.606) were larger than the values of the OL-CLUE-S models (0.759, 0.760, 0.599) during the three periods. The AL-CLUE-S models performed better than the OL-CLUE-S models in the simulation of land use change. The results showed that it is reasonable to integrate autocovariates into CLUE-S models. However, the Kfuzzy values decreased with prolonged duration of simulation and the maximum range of time was not discussed in this paper.

DOI

[23]
Kamoni P T, Gicheru P T, Wokabi S M et al., 2007. Evaluation of two soil carbon models using two Kenyan long term experimental datasets.Agriculture, Ecosystems & Environment, 122(1): 95-104.RothC and Century are two of the most widely used soil organic matter (SOM) models. However there are few examples of specific parameterisation of these models for environmental conditions in East Africa. The aim of this study was therefore, to evaluate the ability of RothC and the Century to estimate changes in soil organic carbon (SOC) resulting from varying land use/management practices for the climate and soil conditions found in Kenya. The study used climate, soils and crop data from a long term experiment (1976–2001) carried out at The Kabete site at The Kenya National Agricultural Research Laboratories (NARL, located in a semi-humid region) and data from a 13 year experiment carried out in Machang’a (Embu District, located in a semi-arid region). The NARL experiment included various fertiliser (0, 60 and 120 kg of N and P 2O 5 ha 611), farmyard manure (FYM—5 and 10 t ha 611) and plant residue treatments, in a variety of combinations. The Machang’a experiment involved a fertiliser (51 kg N ha 611) and a FYM (0, 5 and 10 t ha 611) treatment with both monocropping and intercropping. At Kabete both models showed a fair to good fit to measured data, although Century simulations for treatments with high levels of FYM were better than those without. At the Machang’a site with monocrops, both models showed a fair to good fit to measured data for all treatments. However, the fit of both models (especially RothC) to measured data for intercropping treatments at Machang’a was much poorer. Further model development for intercrop systems is recommended. Both models can be useful tools in soil C predictions, provided time series of measured soil C and crop production data are available for validating model performance against local or regional agricultural crops.

DOI

[24]
Lal R, 2002. Soil carbon sequestration in China through agricultural intensification, and restoration of degraded and desertified ecosystems.Land Degradation & Development, 13(6): 469-478.Abstract The industrial emission of carbon (C) in China in 2000 was about 165Pg65yr611, which may surpass that of the United States (1088465Pg65C) by 2020. China's large land area, similar in size to that of the United States, comprises 12465Mha of cropland, 40065Mha of grazing land and 13465Mha of forestland. Terrestrial C pool of China comprises about 35–6065Pg in the forest and 120–18665Pg in soils. Soil degradation is a major issue affecting 14565Mha by different degradative processes, of which 12665Mha are prone to accelerated soil erosion. Total annual loss by erosion is estimated at 508565Pg of soil and 1508965Tg of soil organic carbon (SOC). Erosion-induced emission of C into the atmosphere may be 32–6465Tg65yr611. The SOC pool progressively declined from the 1930s to 1980s in soils of northern China and slightly increased in those of southern China because of change in land use. Management practices that lead to depletion of the SOC stock are cultivation of upland soils, negative nutrient balance in cropland, residue removal, and soil degradation by accelerated soil erosion and salinization and the like. Agricultural practices that enhance the SOC stock include conversion of upland to rice paddies, integrated nutrient management based on liberal use of biosolids and compost, crop rotations that return large quantities of biomass, and conservation-effective systems. Adoption of recommended management practices can increase SOC concentration in puddled soil, red soil, loess soils, and salt-affected soils. In addition, soil restoration has a potential to sequester SOC. Total potential of soil C sequestration in China is 105–19865Tg65C65yr611 of SOC and 7–13865Tg65C65yr611 for soil inorganic carbon (SIC). The accumulative potential of soil C sequestration of 1165Pg at an average rate of 22465Tg65yr611 may be realized by 2050. Soil C sequestration potential can offset about 20 per cent of the annual industrial emissions in China. Copyright 08 2002 John Wiley & Sons, Ltd.

DOI

[25]
Lal R, 2004. Soil carbon sequestration impacts on global climate change and food security.Science, 304(5677): 1623-1627.The carbon sink capacity of the world's agricultural and degraded soils is 50 to 66% of the historic carbon loss of 42 to 78 gigatons of carbon. The rate of soil organic carbon sequestration with adoption of recommended technologies depends on soil texture and structure, rainfall, temperature, farming system, and soil management. Strategies to increase the soil carbon pool include soil restoration and woodland regeneration, no-till farming, cover crops, nutrient management, manuring and sludge application, improved grazing, water conservation and harvesting, efficient irrigation, agroforestry practices, and growing energy crops on spare lands. An increase of 1 ton of soil carbon pool of degraded cropland soils may increase crop yield by 20 to 40 kilograms per hectare (kg/ha) for wheat, 10 to 20 kg/ha for maize, and 0.5 to 1 kg/ha for cowpeas. As well as enhancing food security, carbon sequestration has the potential to offset fossil-fuel emissions by 0.4 to 1.2 gigatons of carbon per year, or 5 to 15% of the global fossil-fuel emissions.

DOI PMID

[26]
Liu J Y, Liu M L, Deng X Z et al., 2002. The land use and land cover change database and its relative studies in China.Journal of Geographical Sciences, 12(3): 275-282.In the mid-1990s, we established the national operative dynamic information serving systems on natural resources and environment. During building the land-use/land-cover change (LUCC) database for the mid-1990s, 520 scenes of remotely sensed images of Landsat Thematic Mapper (TM) were interpreted into land-use/land-cover categories at scale of 1:100,000 under overall digital software environment after being geo-referenced and ortho-rectified. The vector map of land-use/land-cover in China at the scale of 1:100,000 was recently converted into a 1-km raster database that captures all of the high-resolution land-use information by calculating area percentage for each kind of land use category within every cell. Being designed as an operative dynamic information serving system, monitoring the change in land-use/land-cover at national level was executed. We have completed the updating of LUCC database by comparing the TM data in the mid-1990s with new data sources received during 1999–2000 and 1989–1990. The LUCC database has supported greatly the national LUCC research program in China and some relative studies are incompletely reviewed in this paper.

DOI

[27]
Liu J Y, Liu M L, Zhuang D F et al., 2003. Study on spatial pattern of land-use change in China during 1995-2000.Science in China Series D: Earth Sciences, 46(4): 373-384.It is more and more acknowledged that land-use/cover dynamic change has become a key subject urgently to be dealt with in the study of global environmental change. Supported by the Landsat TM digital images, spatial patterns and temporal variation of land-use change during 1995鈥2000 are studied in the paper. According to the land-use dynamic degree model, supported by the 1km GRID data of land-use change and the comprehensive characters of physical, economic and social features, a dynamic regionalization of land-use change is designed to disclose the spa-tial pattern of land-use change processes. Generally speaking, in the traditional agricultural zones, e.g., Huang-Huai-Hai Plains, Yangtze River Delta and Sichuan Basin, the built-up and residential areas occupy a great proportion of arable land, and in the interlock area of farming and pasturing of northern China and the oases agricultural zones, the reclamation of arable land is conspicuously driven by changes of production conditions, economic benefits and climatic conditions. The im-plementation of returning arable land into woodland or grassland policies has won initial success in some areas, but it is too early to say that the trend of deforestation has been effectively reversed across China. In this paper, the division of dynamic regionalization of land-use change is designed, for the sake of revealing the temporal and spatial features of land-use change and laying the foundation for the study of regional scale land-use changes. Moreover, an integrated study, in-cluding studies of spatial pattern and temporal process of land-use change, is carried out in this paper, which is an interesting try on the comparative studies of spatial pattern on change process and the change process of spatial pattern of land-use change.

DOI

[28]
Liu Q H, Shi X Z, Weindorf D C et al., 2006. Soil organic carbon storage of paddy soils in China using the 1:1,000,000 soil database and their implications for C sequestration. Global Biogeochemical Cycles, 20(3). doi: 10.1029/2006GB002731.1] Organic carbon storage in agricultural soils plays a key role in the terrestrial ecosystem carbon cycle. Paddy soils support important croplands in many parts of the world, especially in Asia. A thorough understanding of organic carbon storage in Chinese paddy soils would be helpful to both greenhouse gases emission and carbon sequestration studies. This paper examines soil organic carbon density (SOCD) and storage (SOCS) of paddy soils in China using the newly compiled 1:1,000,000 digital soil map of China as well as data from 1490 paddy soil profiles. Results show that paddy soils in China cover about 45.7 M ha, nearly 1.5 times more than the results of other studies. In China, the mean SOCD of paddy soils at a depth of 0090009100 cm is 111.4 t C ha0908081, with a SOCS of 5.1 Pg. These results are 6609000975% higher than studies from other scientists. However, the mean SOCD of paddy soils from 0 to 20 cm is 37.6 t C ha0908081, with a SOCS of 1.7 Pg, which is 89% higher than studies from other scientists.

DOI

[29]
Lorenz K, Lal R, 2009. Biogeochemical C and N cycles in urban soils.Environment International, 35(1): 1-8.The percentage of urban population is projected to increase drastically. In 2030, 50.7 to 86.7% of the total population in Africa and Northern America may live in urban areas, respectively. The effects of the attendant increases in urban land uses on biogeochemical C and N cycles are, however, largely unknown. Biogeochemical cycles in urban ecosystems are altered directly and indirectly by human activities. Direct effects include changes in the biological, chemical and physical soil properties and processes in urban soils. Indirect effects of urban environments on biogeochemical cycles may be attributed to the introductions of exotic plant and animal species and atmospheric deposition of pollutants. Urbanization may also affect the regional and global atmospheric climate by the urban heat island and pollution island effect. On the other hand, urban soils have the potential to store large amounts of soil organic carbon (SOC) and, thus, contribute to mitigating increases in atmospheric CO concentrations. However, the amount of SOC stored in urban soils is highly variable in space and time, and depends among others on soil parent material and land use. The SOC pool in 0.3-m depth may range between 16 and 232 Mg ha, and between 15 and 285 Mg ha in 1-m depth. Thus, depending on the soil replaced or disturbed, urban soils may have higher or lower SOC pools, but very little is known. This review provides an overview of the biogeochemical cycling of C and N in urban soils, with a focus on the effects of urban land use and management on soil organic matter (SOM). In view of the increase in atmospheric CO and reactive N concentrations as a result of urbanization, urban land use planning must also include strategies to sequester C in soil, and also enhance the N sink in urban soils and vegetation. This will strengthen soil ecological functions such as retention of nutrients, hazardous compounds and water, and also improve urban ecosystem services by promoting soil fertility.

DOI PMID

[30]
Lu F, Wang X, Han B et al., 2009. Soil carbon sequestrations by nitrogen fertilizer application, straw return and no-tillage in China's cropland.Global Change Biology, 15(2): 281-305.Soil as the largest global carbon pool has played a great role in sequestering the atmospheric carbon dioxide (CO 2 ). Although global carbon sequestration potentials have been assessed since the 1980s, few investigations have been made on soil carbon sequestration (SCS) in China's cropland. China is a developing country and has a long history of agricultural activities. Estimation of SCS potentials in China's cropland is very important for assessing the potential measures to prevent the atmospheric carbon rise and predicting the atmospheric CO 2 concentration in future. After review of the available results of the field experiments in China, relationships between SCS and nitrogen fertilizer application, straw return and no-tillage (NT) practices were established for each of the four agricultural regions. According to the current agricultural practices and their future development, estimations were made on SCS by nitrogen fertilizer application, straw return and NT in China's cropland. In the current situation, nitrogen fertilizer application, straw return and zero tillage can sequester 5.96, 9.76 and 0.800 Tg C each year. Carbon sequestration potential will increase to 12.1 Tg C yr 1 if nitrogen is fertilized on experts' recommendations. The carbon sequestration potentials of straw return and NT can reach 34.4 and 4.60 Tg C yr 1 when these two techniques are further popularized. In these measures, straw return is the most promising one. Full popularization of straw return can reduce 5.3% of the CO 2 emission from fossil fuel combustion in China in 1990, which meets the global mean CO 2 reduction requested by the Kyoto Protocol (5.2%). In general, if more incentive policies can be elaborated and implemented, the SCS in China's cropland will be increased by about two times. So, popularization of the above-mentioned agricultural measures for carbon sequestration can be considered as an effective tool to prevent the rapid rise of the atmospheric CO 2 in China.

DOI

[31]
Lugato E, Bampa F, Panagos P et al., 2014. Potential carbon sequestration of European arable soils estimated by modelling a comprehensive set of management practices.Global Change Biology, 20(11): 3557-3567.Abstract Bottom–up estimates from long-term field experiments and modelling are the most commonly used approaches to estimate the carbon (C) sequestration potential of the agricultural sector. However, when data are required at European level, important margins of uncertainty still exist due to the representativeness of local data at large scale or different assumptions and information utilized for running models. In this context, a pan-European (EU + Serbia, Bosnia and Herzegovina, Montenegro, Albania, Former Yugoslav Republic of Macedonia and Norway) simulation platform with high spatial resolution and harmonized data sets was developed to provide consistent scenarios in support of possible carbon sequestration policies. Using the CENTURY agroecosystem model, six alternative management practices (AMP) scenarios were assessed as alternatives to the business as usual situation (BAU). These consisted of the conversion of arable land to grassland (and vice versa), straw incorporation, reduced tillage, straw incorporation combined with reduced tillage, ley cropping system and cover crops. The conversion into grassland showed the highest soil organic carbon (SOC) sequestration rates, ranging between 0.4 and 0.8 t C02ha61102yr611, while the opposite extreme scenario (100% of grassland conversion into arable) gave cumulated losses of up to 2 Gt of C by 2100. Among the other practices, ley cropping systems and cover crops gave better performances than straw incorporation and reduced tillage. The allocation of 12 to 28% of the European arable land to different AMP combinations resulted in a potential SOC sequestration of 101–336 Mt CO2 eq. by 2020 and 549-2141 Mt CO2 eq. by 2100. Modelled carbon sequestration rates compared with values from an ad hoc meta-analysis confirmed the robustness of these estimates.

DOI PMID

[32]
Luo Z, Wang E, Sun O J et al., 2011. Modeling long-term soil carbon dynamics and sequestration potential in semi-arid agro-ecosystems.Agricultural and Forest Meteorology, 151(12): 1529-1544.Long-term soil carbon (C) dynamics in agro-ecosystems is controlled by interactions of climate, soil and agronomic management. A modeling approach is a useful tool to understand the interactions, especially over long climatic sequences. In this paper, we examine the performance of the Agricultural Production Systems sIMulator (APSIM) to predict the long-term soil C dynamics under various agricultural practices at four semi-arid sites across the wheat-belt of eastern Australia. We further assessed the underlying factors that regulate soil C dynamics in the top 30cm of soil through scenario analysis using the validated model. The results show that APSIM is able to predict aboveground biomass production and soil C dynamics at the study sites. Scenario analyses indicate that nitrogen (N) fertilization combined with residue retention (SR) has the potential to significantly slow or reverse the loss of C from agricultural soils. Optimal N fertilization (Nopt) and 100% SR, increased soil C by 13%, 46% and 45% at Warra, Wagga Wagga and Tarelee, respectively. Continuous lucerne pasture was the most efficient strategy to accumulate soil C, resulting in increases of 49%, 57% and 50% at Warra, Wagga Wagga and Tarlee, respectively. In contrast, soil C decreases regardless of agricultural practices as a result of cultivation of natural soils at the Brigalow site. Soil C input, proportional to the amount of retained residue, is a significant predictor of soil C change. At each site, water and nitrogen availability and their interaction, explain more than 59% of the variation in soil C. Across the four sites, mean air temperature has significant (P<0.05) effects on soil C change. There was greater soil C loss at sites with higher temperature. Our simulations suggest that detailed information on agricultural practices, land use history and local environmental conditions must be explicitly specified to be able to make plausible predictions of the soil C balance in agro-ecosystems at different agro-ecological scales.

DOI

[33]
Mondal A, Khare D, Kundu S et al., 2014. Detection of land use change and future prediction with Markov chain model in a part of Narmada River Basin, Madhya Pradesh. Landscape Ecology and Water Management. Springer: 3-14.Landuse and land cover change have significant impact on the environment of a river basin and has gained considerable attention. It has a strong effect on the surroundings where increasing agriculture as well as urban areas has led to the rapid deforestation and changes in the ecology. Present study involves detection of landuse and land cover change in a part of Narmada river of Madhya Pradesh where rapid changes such as irrigation planning is leading to changes in the land cover. Hence, change detection in the present landform and probable changes in the near future is required for planning and management. Landsat images of 1990 (TM), 2000 (ETM + ) and 2011 (LISS-III) were used for the classification and future landuse prediction. Supervised Fuzzy C-Mean classification was applied to generate major five classes of water body, built-up area, natural vegetation, agricultural land and fallow land. Overall accuracy for all images was above 85 %. The Markov Chain model was used for prediction. The classified Landsat images of 1990 and 2000 were used to predict the 2011 landuse with Markov Chain which was again validated with the 2011 classified image. The prediction of 2020 and 2030 land use were done to see the future change. The spatial accuracy achieved for the prediction was about 92.5 %. The results illustrate an increase in agricultural land and urban area with the decrease in natural vegetation.

DOI

[34]
Munafò M, Salvati L, Zitti M, 2013. Estimating soil sealing rate at national level: Italy as a case study.Ecological Indicators, 26: 137-140.Soil sealing has been regarded as a key environmental problem since sealed soils lose several of their functions determining a reduction in land productivity and quality. Unfortunately, the analysis of changes in land-use carried out through the use of traditional data sources allows a relatively rough estimation of this phenomenon. The aim of this paper is to illustrate a procedure quantifying over time the soil sealing rate at the country scale. Italy was chosen as the study area due to its spatially-complex urbanization patterns. The procedure was based on the visual interpretation of aerial photographs and high-resolution topographic maps taken at four points in time (1956, 1994, 1999, 2006) in a random sample of field plots homogeneously distributed across the country. Results indicate that soil sealing continuously increased in Italy over the investigated period with the highest absolute and per-capita growth rate of sealed areas being observed respectively in northern and southern Italy. Compared to past, per-capita soil sealing was higher in the most recent period (1999 2006).

DOI

[35]
Pan G, Li L, Wu L et al., 2004. Storage and sequestration potential of topsoil organic carbon in China's paddy soils.Global Change Biology, 10(1): 79-92.Carbon (C) storage and sequestration in agricultural soils is considered to be an important issue in the study of terrestrial C cycling and global climatic change. The baseline C stock and the C sequestration potential are among the criteria for a region or a state to adopt strategies or policies in response to commitment to the Kyoto Protocol. Paddy soils represent a large portion of global cropland. However, little information on the potential of C sequestration and storage is available for such soils. In this paper, an estimation of the topsoil soil organic carbon (SOC) pool and the sequestration potential of paddy soils in China was made by using the data from the 2nd State Soil Survey carried out during 1979–1982 and from the nationwide arable soil monitoring system established since then. Results showed that the SOC density ranged from 12 to 226 t C ha 611 with an area-weighted mean density of 44 t C ha 611 , which is comparable to that of the US grasslands and is higher than that of the cultivated dryland soils in China and the US. The estimated total topsoil SOC pool is 1.3 Pg, with 0.85 Pg from the upper plow layer and 0.45 Pg from the plowpan layer. This pool size is 652% of China's total storage in the top 1 m of the soil profiles and 654% of the total topsoil pool, while the area percentage of paddy soil is 3.4% of the total land. The C pool in paddy soils was found predominantly in southeast China geographically and in the subgroups of Fe-accumulating and Fe-leaching paddy soils pedogenetically. In comparison with dryland cultivation, irrigation-based rice cultivation in China has induced significant enrichment of SOC storage (0.3 Pg) in paddy soils. The induced total C sequestration equals half of China's total annual CO 2 emission in the 1990s. Estimates using different SOC sequestration scenarios show that the paddy soils of China have an easily attainable SOC sequestration potential of 0.7 Pg under present conditions and may ultimately sequester 3.0 Pg. Soil monitoring data showed that the current C sequestration rate is 12 Tg yr 611 . The total C sequestration potential and the current sequestration rate of the paddy soils are over 30%, while the area of the paddy soils is 26% that of China's total croplands. Therefore, practicing sustainable agriculture is urgently needed for enhancing SOC storage to realize the ultimate SOC sequestration of rice-based agriculture of China, as the current C sequestration rate is significantly lower than the potential rate.

DOI

[36]
Pontius R G, Boersma W, Castella J C et al., 2008. Comparing the input, output, and validation maps for several models of land change.The Annals of Regional Science, 42(1): 11-37.This paper applies methods of multiple resolution map comparison to quantify characteristics for 13 applications of 9 different popular peer-reviewed land change models. Each modeling application simulates change of land categories in raster maps from an initial time to a subsequent time. For each modeling application, the statistical methods compare: (1) a reference map of the initial time, (2) a reference map of the subsequent time, and (3) a prediction map of the subsequent time. The three possible two-map comparisons for each application characterize: (1) the dynamics of the landscape, (2) the behavior of the model, and (3) the accuracy of the prediction. The three-map comparison for each application specifies the amount of the prediction鈥檚 accuracy that is attributable to land persistence versus land change. Results show that the amount of error is larger than the amount of correctly predicted change for 12 of the 13 applications at the resolution of the raw data. The applications are summarized and compared using two statistics: the null resolution and the figure of merit. According to the figure of merit, the more accurate applications are the ones where the amount of observed net change in the reference maps is larger. This paper facilitates communication among land change modelers, because it illustrates the range of results for a variety of models using scientifically rigorous, generally applicable, and intellectually accessible statistical techniques.

DOI

[37]
Qin Z, Huang Y, 2010. Quantification of soil organic carbon sequestration potential in cropland: A model approach.Science China Life Sciences, 53(7): 868-884.

DOI

[38]
Qin Z, Huang Y, Zhuang Q, 2013. Soil organic carbon sequestration potential of cropland in China.Global Biogeochemical Cycles, 27(3): 711-722.1] Soil organic carbon (SOC) in cropland is of great importance to the global carbon (C) balance and to agricultural productivity, but it is highly sensitive to human activities such as irrigation and crop rotation. It has been observed that under certain improved management practices, cropland soils can sequestrate additional C beyond their existing SOC level before reaching the C saturation state. Here we use data from worldwide, long-term agricultural experiments to develop two statistical models to determine the saturated SOC level (SOCS) in upland and paddy agroecosystems, respectively. We then use the models to estimate SOC sequestration potential (SOCP) in Chinese croplands. SOCP is the difference between SOCS and existing SOC level (SOCE). We find that the models for both the upland and paddy agroecosystems can reproduce the observed SOCS data from long-term experiments. The SOCE and SOCS stock in Chinese upland and paddy croplands (009000930090009cm soil) are estimated to be 5.2 and 7.9 Pg C with national average densities of 37.4 and 56.8090009Mg C ha0908081, respectively. As a result, the total SOC sequestration potential is estimated to be 2.7 Pg C or 19.4090009Mg C ha0908081 in Chinese cropland. Paddy has a relatively higher SOCE (45.4090009Mg C ha0908081) than upland (34.7090009Mg C ha0908081) and also a greater SOCP at 26.1090009Mg C ha0908081 compared with 17.2090009Mg C ha0908081 in the upland. The SOC varies dramatically among different regions. Northeast China has the highest SOCE and SOCS density, while the Loess Plateau has the greatest SOCP density. The time required to reach SOC saturation in Chinese cropland is highly dependent on management practices applied. Chinese cropland has relatively low SOC density in comparison to the global average but could have great potentials for C sequestration under improved agricultural management strategies.

DOI

[39]
Six J, Conant R, Paul E A et al., 2002. Stabilization mechanisms of soil organic matter: Implications for C-saturation of soils.Plant and Soil, 241(2): 155-176.The relationship between soil structure and the ability of soil to stabilize soil organic matter (SOM) is a key element in soil C dynamics that has either been overlooked or treated in a cursory fashion when developing SOM models. The purpose of this paper is to review current knowledge of SOM dynamics within the framework of a newly proposed soil C saturation concept. Initially, we distinguish SOM that is protected against decomposition by various mechanisms from that which is not protected from decomposition. Methods of quantification and characteristics of three SOM pools defined as protected are discussed. Soil organic matter can be: (1) physically stabilized, or protected from decomposition, through microaggregation, or (2) intimate association with silt and clay particles, and (3) can be biochemically stabilized through the formation of recalcitrant SOM compounds. In addition to behavior of each SOM pool, we discuss implications of changes in land management on processes by which SOM compounds undergo protection and release. The characteristics and responses to changes in land use or land management are described for the light fraction (LF) and particulate organic matter (POM). We defined the LF and POM not occluded within microaggregates (53鈥250 渭m sized aggregates as unprotected. Our conclusions are illustrated in a new conceptual SOM model that differs from most SOM models in that the model state variables are measurable SOM pools. We suggest that physicochemical characteristics inherent to soils define the maximum protective capacity of these pools, which limits increases in SOM (i.e. C sequestration) with increased organic residue inputs.

DOI

[40]
Stewart C E, Paustian K, Conant R T et al., 2008. Soil carbon saturation: Evaluation and corroboration by long-term incubations.Soil Biology and Biochemistry, 40(7): 1741-1750.Although current assessments of agricultural management practices on soil organic C (SOC) dynamics are usually conducted without any explicit consideration of limits to soil C storage, it has been hypothesized that the SOC pool has an upper, or saturation limit with respect to C input levels at steady state. Agricultural management practices that increase C input levels over time produce a new C in soils varying in SOC content and physiochemical characteristics. We incubated for 2.5 years soil samples from seven agricultural sites that were closer to (i.e., A-horizon) or further from (i.e., C-horizon) their C saturation limit. At the initiation of the incubations, samples received low or high C input levels of C-labeled wheat straw. We also tested the effect of Ca addition and residue quality on a subset of these soils. We hypothesized that the proportion of C stabilized would be greater in samples with larger C saturation deficits (i.e., the C- versus A-horizon samples) and that the relative stabilization efficiency (i.e., SOC/ C input) would decrease as C input level increased. We found that C saturation deficit influenced the stabilization of added residue at six out of the seven sites and C addition level affected the stabilization of added residue in four sites, corroborating both hypotheses. Increasing Ca availability or decreasing residue quality had no effect on the stabilization of added residue. The amount of new C stabilized was significantly related to C saturation deficit, supporting the hypothesis that C saturation influenced C stabilization at all our sites. Our results suggest that soils with low C contents and degraded lands may have the greatest potential and efficiency to store added C because they are further from their saturation level.

DOI

[41]
Ussiri D A, Lal R, 2005. Carbon sequestration in reclaimed minesoils.Critical Reviews in Plant Sciences, 24(3): 151-165.Minesoils are drastically influenced by anthropogenic activities. They are characterized by low soil organic matter (SOM) content, low fertility, and poor physicochemical and biological properties, limiting their quality, capability, and functions. Reclamation of these soils has potential for resequestering some of the C lost and mitigating CO2 emissions. Soil organic carbon (SOC) sequestration rates in minesoils are high in the first 20 to 30 years after reclamation in the top 15 cm soil depth. In general, higher rates of SOC sequestration are observed for minesoils under pasture and grassland management than under forest land use. Observed rates of SOC sequestration are 0.3 to 1.85 Mg C ha61 1 yr61 1 for pastures and rangelands, and 0.2 to 1.64 Mg C ha61 1 yr61 1 for forest land use. Proper reclamation and postreclamation management may enhance SOC sequestration and add to the economic value of the mined sites. Management practices that may enhance SOC sequestration include increasing vegetative cover by deep-rooted perennial vegetation and afforestation, improving soil fertility, and alleviation of physical, chemical and biological limitations by fertilizers and soil amendments such as biosolids, manure, coal combustion by-products, and mulches. Soil and water conservation are important to SOC sequestration. The potential of SOC sequestration in minesoils of the US is estimated to be 1.28 Tg C yr611, compared to the emissions from coal combustion of 506 Tg C yr61 1.

DOI

[42]
Veldkamp A, Lambin E F, 2001. Predicting land-use change.Agriculture, Ecosystems & Environment, 85(1-3): 1-6.

[43]
Verburg P H, de Nijs T C, van Eck J R et al., 2004. A method to analyse neighbourhood characteristics of land use patterns.Computers, Environment and Urban Systems, 28(6): 667-690.Neighbourhood interactions between land use types are often included in the spatially explicit analysis of land use change. Especially in the context of urban growth, neighbourhood interactions are often addressed both in theories for urban development and in dynamic models of (urban) land use change. Neighbourhood interactions are one of the main driving factors in a large group of land use change models based on cellular automata (CA).This paper introduces a method to analyse the neighbourhood characteristics of land use. For every location in a rectangular grid the enrichment of the neighbourhood by specific land use types is studied. An application of the method for the Netherlands indicates that different land use types have clearly distinct neighbourhood characteristics. Land use conversions can be explained, for a large part, by the occurrence of land uses in the neighbourhood.The neighbourhood characterization introduced in this paper can help to further unravel the processes of land use change allocation and assist in the definition of transition rules for cellular automata and other land use change models.

DOI

[44]
Verburg P H, Soepboer W, Veldkamp A et al., 2002. Modeling the spatial dynamics of regional land use: The CLUE-S model.Environmental Management, 30(3): 391-405.Land-use change models are important tools for integrated environmental management. Through scenario analysis they can help to identify near-future critical locations in the face of environmental change. A dynamic, spatially explicit, land-use change model is presented for the regional scale: CLUE-S. The model is specifically developed for the analysis of land use in small regions (e.g., a watershed or province) at a fine spatial resolution. The model structure is based on systems theory to allow the integrated analysis of land-use change in relation to socio-economic and biophysical driving factors. The model explicitly addresses the hierarchical organization of land use systems, spatial connectivity between locations and stability. Stability is incorporated by a set of variables that define the relative elasticity of the actual land-use type to conversion. The user can specify these settings based on expert knowledge or survey data. Two applications of the model in the Philippines and Malaysia are used to illustrate the functioning of the model and its validation.

DOI PMID

[45]
Wang K B, Deng L, Ren Z P et al., 2016. Dynamics of ecosystem carbon stocks during vegetation restoration on the Loess Plateau of China.Journal of Arid Land, 8(2): 207-220.In the last few decades, the Loess Plateau had experienced an extensive vegetation restoration to reduce soil erosion and to improve the degraded ecosystems. However, the dynamics of ecosystem carbon stocks with vegetation restoration in this region are poorly understood. This study examined the changes of carbon stocks in mineral soil (0–100 cm), plant biomass and the ecosystem (plant and soil) following vegetation restoration with different models and ages. Our results indicated that cultivated land returned to native vegetation (natural restoration) or artificial forest increased ecosystem carbon sequestration. Tree plantation sequestered more carbon than natural vegetation succession over decades scale due to the rapid increase in biomass carbon pool. Restoration ages had different effects on the dynamics of biomass and soil carbon stocks. Biomass carbon stocks increased with vegetation restoration age, while the dynamics of soil carbon stocks were affected by sampling depth. Ecosystem carbon stocks consistently increased after tree plantation regardless of the soil depth; but an initial decrease and then increase trend was observed in natural restoration chronosequences with the soil sampling depth of 0–100 cm. Moreover, there was a time lag of about 15–30 years between biomass production and soil carbon sequestration in 0–100 cm, which indicated a long-term effect of vegetation restoration on deeper soil carbon sequestration.

DOI

[46]
Weng Q, 2002. Land use change analysis in the Zhujiang Delta of China using satellite remote sensing, GIS and stochastic modelling.Journal of Environmental Management, 64(3): 273-284.Rapid land use change has taken place in many coastal regions of China such as the Zhujiang Delta over the past two decades due to accelerated industrialization and urbanization. In this paper, land use change dynamics were investigated by the combined use of satellite remote sensing, geographic information systems (GIS), and stochastic modelling technologies. The results indicated that there has been a notable and uneven urban growth and a tremendous loss in cropland between 1989 and 1997. The land use change process has shown no sign of becoming stable. The study demonstrates that the integration of satellite remote sensing and GIS was an effective approach for analyzing the direction, rate, and spatial pattern of land use change. The further integration of these two technologies with Markov modelling was found to be beneficial in describing and analyzing land use change process.

DOI PMID

[47]
West T O, Post W M, 2002. Soil organic carbon sequestration rates by tillage and crop rotation.Soil Science Society of America Journal, 66(6): 1930-1946.

DOI

[48]
Wright C K, Wimberly M C, 2013. Recent land use change in the Western Corn Belt threatens grasslands and wetlands.Proceedings of the National Academy of Sciences, 110(10): 4134-4139.In the US Corn Belt, a recent doubling in commodity prices has created incentives for landowners to convert grassland to corn and soybean cropping. Here, we use land cover data from the National Agricultural Statistics Service Cropland Data Layer to assess grassland conversion from 2006 to 2011 in the Western Corn Belt (WCB): five states including North Dakota, South Dakota, Nebraska, Minnesota, and Iowa. Our analysis identifies areas with elevated rates of grass-to-corn/soy conversion (1.0-5.4% annually). Across the WCB, we found a net decline in grass-dominated land cover totaling nearly 530,000 ha. With respect to agronomic attributes of lands undergoing grassland conversion, corn/soy production is expanding onto marginal lands characterized by high erosion risk and vulnerability to drought. Grassland conversion is also concentrated in close proximity to wetlands, posing a threat to waterfowl breeding in the Prairie Pothole Region. Longer-term land cover trends from North Dakota and Iowa indicate that recent grassland conversion represents a persistent shift in land use rather than short-term variability in crop rotation patterns. Our results show that the WCB is rapidly moving down a pathway of increased corn and soybean cultivation. As a result, the window of opportunity for realizing the benefits of a biofuel industry based on perennial bioenergy crops, rather than corn ethanol and soy biodiesel, may be closing in the WCB.

DOI PMID

[49]
Wu Q, Li H Q, Wang R S et al., 2006. Monitoring and predicting land use change in Beijing using remote sensing and GIS.Landscape and Urban Planning, 78(4): 322-333.Rapid land use change has taken place in many mega cities of China such as Beijing over the past two decades. In this paper, land use change dynamics were investigated by the combined use of satellite remote sensing, geographic information systems (GIS). The results indicated that there had been a notable and uneven urban growth and a major loss of cropland loss between 1986 and 2001. Most of the urban growth and loss of agriculture land occurred in inner and outer suburbs. Land use change was projected for the next 20 years using Markov chains and regression analyses. The further integration of remote sensing and GIS technologies with Markov model and regression model was found to be useful for describing, analyzing and predicting the process of land use change.

DOI

[50]
Yang S M, Malhi S S, Li F M et al., 2007. Long-term effects of manure and fertilization on soil organic matter and quality parameters of a calcareous soil in NW China.Journal of Plant Nutrition and Soil Science, 170(2): 234-243.Long-term applications of inorganic fertilizers and farmyard manure influence organic matter as well as other soil-quality parameters, but the magnitude of change depends on soil-climatic conditions. Effects of 22 annual applications (1982-2003) of N, P, and K inorganic fertilizers and farmyard manure (M) on total organic carbon (TOC) and nitrogen (TON), light-fraction organic C (LFOC) and N (LFON), microbial-biomass C (MB-C) and N (MB-N), total and extractable P, total and exchangeable K, and pH in 0-20 cm soil, nitrate-N (NO-N) in 0-210 cm soil, and N, P, and K balance sheets were determined using a field experiment established in 1982 on a calcareous desert soil (Orthic Anthrosol) at Zhangye, Gansu, China. A rotation of irrigated wheat ( Triticum aestivum L.)-wheat-corn ( Zea mays L.) was used to compare the control, N, NP, NPK, M, MN, MNP, and MNPK treatments. Annual additions of inorganic fertilizers for 22 y increased mass of LFON, MB-N, total P, extractable P, and exchangeable K in topsoil. This effect was generally enhanced with manure application. Application of manure also increased mass of TOC and MB-C in soil, and tended to increase LFOC, TON, and MB-N. There was no noticeable effect of fertilizer and manure application on soil pH. There was a close relationship between some soil-quality parameters and the amount of C or N in straw that was returned to the soil. The N fertilizer alone resulted in accumulation of large amounts of NO-N at the 0-210 cm soil depth, accounting for 6% of the total applied N, but had the lowest recovery of applied N in the crop (34%). Manure alone resulted in higher NO-N in the soil profile compared with the control, and the MN treatment had the highest amount of NO-N in the soil profile. Application of N in combination with P and/or K fertilizers in both manured and unmanured treatments usually reduced NO-N accumulation in the soil profile compared with N alone and increased the N recovery in the crop as much as 66%. The N that was unaccounted for, as a percentage of applied N, was highest in the N-alone treatment (60%) and lowest in the NPK treatment (30%). In the manure + chemical fertilizer treatments, the unaccounted N ranged from 35% to 43%. Long-term P fertilization resulted in accumulation of extractable P in the surface soil. Compared to the control, the amount of P in soil-plant system was surplus in plots that received P as fertilizer and/or manure, and the unaccounted P as percentage of applied P ranged from 64% to 80%. In the no-manure plots, the unaccounted P decreased from 72% in NP to 64% in NPK treatment from increased P uptake due to balanced fertilization. Compared to the control, the amount of K in soil-plant system was deficit in NPK treatment, i.e. , the recovery of K in soil + plant was more than the amount of applied K. In manure treatments, the recovery of applied K in crop increased from 26% in M to 61% in MNPK treatment, but the unaccounted K decreased from 72% in M to 37% in MNPK treatment. The findings indicated that integrated application of N, P, and K fertilizers and manure is an important strategy to maintain or increase soil organic C and N, improve soil fertility, maintain nutrients balance, and minimize damage to the environment, while also improving crop yield.

DOI

[51]
Yang Y H, Li W H, Zhu C G et al., 2017. Impact of land use/cover changes on carbon storage in a river valley in arid areas of Northwest China.Journal of Arid Land, 9(6): 879-887.Soil carbon pools could become a CO 2 source or sink, depending on the directions of land use/cover changes. A slight change of soil carbon will inevitably affect the atmospheric CO 2 concentration and consequently the climate. Based on the data from 127 soil sample sites, 48 vegetation survey plots, and Landsat TM images, we analyzed the land use/cover changes, estimated soil organic carbon (SOC) storage and vegetation carbon storage of grassland, and discussed the impact of grassland changes on carbon storage during 2000 to 2013 in the Ili River Valley of Northwest China. The results indicate that the areal extents of forestland, shrubland, moderate-coverage grassland (MCG), and the waterbody (including glaciers) decreased while the areal extents of high-coverage grassland (HCG), low-coverage grassland (LCG), residential and industrial land, and cultivated land increased. The grassland SOC density in 0–100 cm depth varied with the coverage in a descending order of HCG>MCG>LCG. The regional grassland SOC storage in the depth of 0–100 cm in 2013 increased by 0.25×10 11 kg compared with that in 2000. The regional vegetation carbon storage (S rvc ) of grassland was 5.27×10 9 kg in 2013 and decreased by 15.7% compared to that in 2000. The vegetation carbon reserves of the under-ground parts of vegetation (S ruvb ) in 2013 was 0.68×10 9 kg and increased by approximately 19.01% compared to that in 2000. This research can improve our understanding about the impact of land use/cover changes on the carbon storage in arid areas of Northwest China.

DOI

[52]
Yao J T, Kong X B, Duan Z Q, 2016. A gradient algorithm for land use transform matrix analysis and land use change simulation. In: Research on the Innovation and Development of Land Resources Sciences in China in a New Era. Xi'an: Northeastern University Press, 456-463. (in Chinese)

[53]
Young R R, Wilson B, Harden S et al., 2009. Accumulation of soil carbon under zero tillage cropping and perennial vegetation on the Liverpool Plains, eastern Australia.Soil Research, 47(3): 273-285.Australian agriculture contributes an estimated 16% of all national greenhouse gas emissions, and considerable attention is now focused on management approaches that reduce net emissions. One area of potential is the modification of cropping practices to increase soil carbon storage. Here, we report short–medium term changes in soil carbon under zero tillage cropping systems and perennial vegetation, both in a replicated field experiment and on nearby farmers’ paddocks, on carbon-depleted Black Vertosols in the upper Liverpool Plains catchment. Soil organic carbon stocks (CS) remained unchanged under both zero tillage long fallow wheat–sorghum rotations and zero tillage continuous winter cereal in a replicated field experiment from 1994 to 2000. There was some evidence of accumulation of CS under intensive (>165crop/year) zero tillage response cropping. There was significant accumulation of CS (~0.3565Mg/ha.year) under 3 types of perennial pasture, despite removal of aerial biomass with each harvest. Significant accumulation was detected in the 0–0.1, 0.1–0.2, and 0.2–0.465m depth increments under lucerne and the top 2 increments under mixed pastures of lucerne and phalaris and of C3 and C4 perennial grasses. Average annual rainfall for the period of observations was 77265mm, greater than the 40-year average of 68065mm. A comparison of major attributes of cropping systems and perennial pastures showed no association between aerial biomass production and accumulation rates of CS but a positive correlation between the residence times of established plants and accumulation rates of CS. CS also remained unchanged (1998/2000–07) under zero tillage cropping on nearby farms, irrespective of paddock history before 1998/2000 (zero tillage cropping, traditional cropping, or ~10 years of sown perennial pasture). These results are consistent with previous work in Queensland and central western New South Wales suggesting that the climate (warm, semi-arid temperate, semi-arid subtropical) of much of the inland cropping country in eastern Australia is not conducive to accumulation of soil carbon under continuous cropping, although they do suggest that CS may accumulate under several years of healthy perennial pastures in rotation with zero tillage cropping.

DOI

[54]
Zhang H X, Sun B, Xie X L et al., 2015. Simulating the effects of chemical and non-chemical fertilization practices on carbon sequestration and nitrogen loss in subtropical paddy soils using the DNDC model.Paddy and Water Environment, 13(4): 495-506.Understanding the long-term and quantitative effects of different fertilization practices on carbon sequestration and nitrogen loss is important when establishing the best fertilization regime. In this study, the DeNitrification–DeComposition (DNDC) model was validated first for the change of soil organic carbon (SOC) at the site mode and at the regional mode, and then it was used to simulate the effects of three fertilization practices including rice straw (RS) returning, chemical fertilizer application (CF), and green manure planting (GM) on C and N dynamics in paddy soils from a subtropical area of China. The prevailing fertilization practices in the study area were set as the baseline scenario, and alternative scenarios were assigned by varying only one of the three fertilization practices. All three fertilization practices increased SOC content but had different effects on rice yield, N 2 O emission, and nitrate leaching loss. Compared with a baseline RS rate of 1502%, the SOC contents less than RS rates of 30, 50, and 8002% were increased on average by 12.84, 29.48, and 53.5002%, respectively. SOC content also increased as the CF rate rose from 70 to 13002% of the baseline scenario and then leveled off from 130 to 16002%. SOC contents under GM were higher than that without GM by 35.7402%. Both the N 2 O emissions and the nitrate leaching were increased with the increasing CF rate, while they decreased under GM treatment. However, RS increased the N 2 O emissions but decreased the nitrate leaching. The polygon-based modeling method with the DNDC could accurately evaluate the general trend of SOC dynamics and nitrogen loss from paddy soils.

DOI

[55]
Zhao G, Guerrero J M, Jiang K et al., 2017. Energy modelling towards low carbon development of Beijing in 2030.Energy, 121: 107-113.Beijing, as the capital of China, is under the high pressure of climate change and pollution. The consumption of non-renewable energy is one of the most important sources of the CO2 emissions, which cause climate changes. This paper presents a study on the energy system modelling towards renewable energy and low carbon development for the city of Beijing. The analysis of energy system modelling is organized in two steps to explore the alternative renewable energy system in Beijing. Firstly, a reference energy system of Beijing is created based on the available data in 2014. The EnergyPLAN, an energy system analysis tool, is chosen to develop the reference energy model. Secondly, this reference model is used to investigate the alternative energy system for integrating renewable energies. Three scenarios are developed towards the energy system of Beijing in 2030, which are: (i) reference scenario 2030, (ii) BAU (business as usual) scenario 2030, and (iii) RES (renewable energies) scenario 2030. The 100% renewable energy system with zero CO2 emissions can be achieved by increasing solar energy, biomass and municipal solid waste (MSW) and optimizing heating system. The primary fuel consumption is reduced to 155.9 TWh in the RES scenario, which is 72% of fuel consumption in the reference scenario 2030.

DOI

Outlines

/