Special Issue: Land system dynamics: Pattern and process

Spatio-temporal differences and factors influencing intensive cropland use in the Huang-Huai-Hai Plain

  • SHI Shuqin , 1, * ,
  • HAN Yu 1 ,
  • YU Wentao 1 ,
  • CAO Yuqing 1 ,
  • CAI Weimin , 1 ,
  • YANG Peng 2 ,
  • WU Wenbin 2 ,
  • YU Qiangyi , 2, *
Expand
  • 1. School of Management, Tianjin Polytechnic University, Tianjin 300387, China
  • 2. Key Laboratory of Agricultural Remote Sensing (AGRIRS), Ministry of Agriculture/Institute of Agri-cultural Resources and Regional Planning, Chinese Academy of Agricultural Sciences, Beijing 100081, China
*Corresponding author: Cai Weimin, E-mail: ; Yu Qiangyi, E-mail:

Author: Shi Shuqin, PhD and Professor, specialized in agricultural remote sensing and land use evaluation. E-mail:

Received date: 2017-03-05

  Accepted date: 2017-10-09

  Online published: 2018-11-20

Supported by

Project of Ministry of Education Humanities and Social Sciences, No.16YJCZH082, No.16YJC630149

Copyright

Journal of Geographical Sciences, All Rights Reserved

Abstract

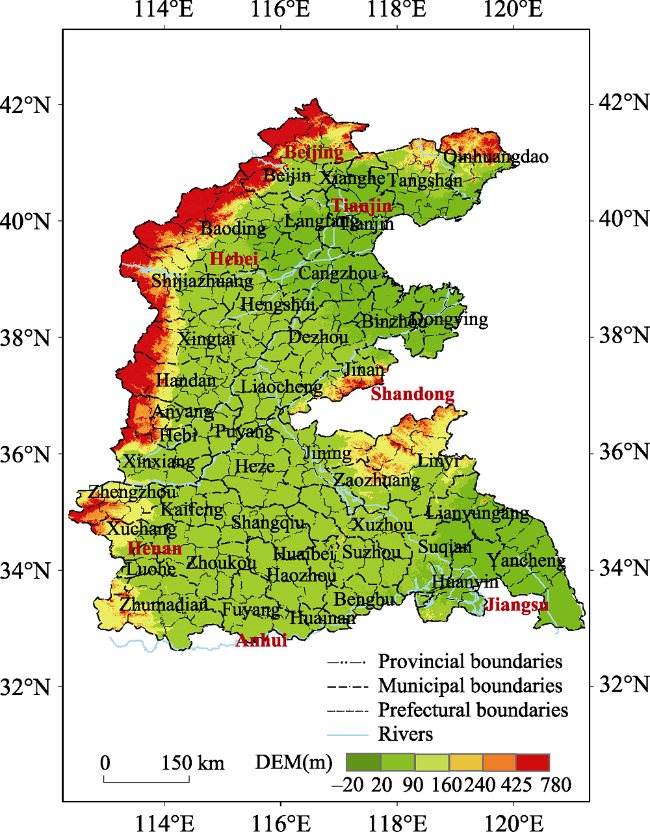
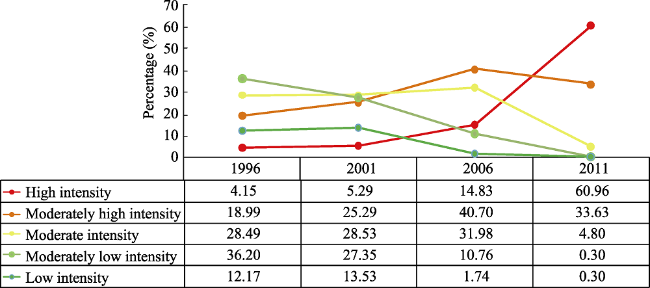
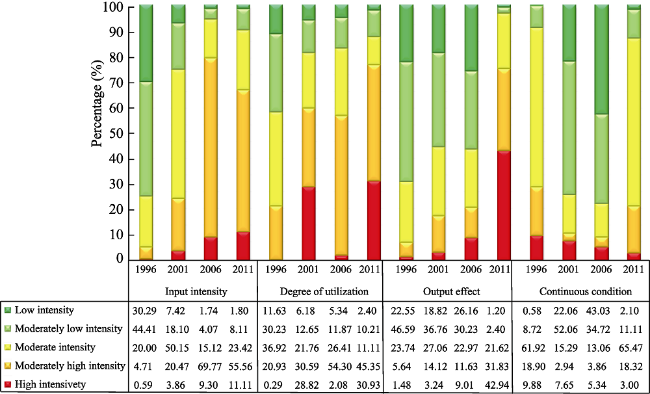
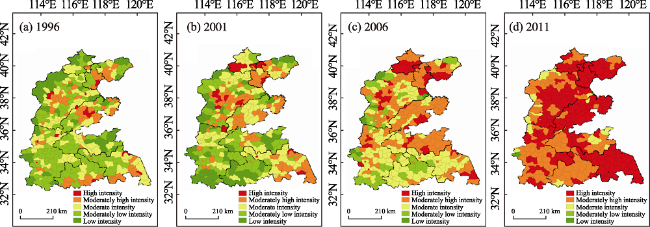
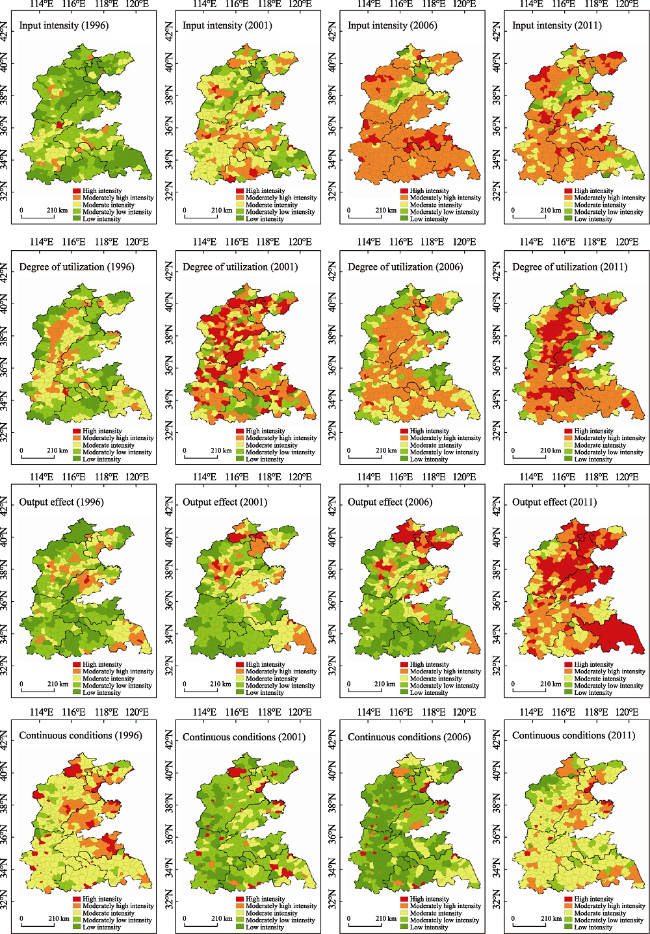
This study developed a comprehensive system to evaluate the intensity of cropland use and evolution of cropland use in the Huang-Huai-Hai Plain. Delphi-entropy methods were adopted to determine the weight of the index, and the GeoDetector model was established to explore the influencing factors. The results are summarized as follows: (1) The intensity of inputs, degree of utilization, and production increased continuously, but the intensity of continuous conditions experienced an overall decline followed by a rebound towards the end of the study period. The number of counties with high and moderately high intensity increased by 56.8% and 14.6%, respectively, from 1996 to 2011. The number of counties with moderately low and low intensity declined by 35.9 % and 11.9 %, respectively. Areas with significant increases in intensity were mainly distributed in northeast Hebei Province, northwest Shandong Province, and north Jiangsu Province. The intensity is high in northern Jiangsu and Anhui; the output effect remained above moderate intensity mainly near Beijing, Tianjin, Tangshan, and counties in the suburbs of Shijiazhuang. (2) Natural disasters, elevation, slope, and road networks were the main factors influencing the intensity of cropland use in this region, with influence values of 0.158, 0.143, 0.129, and 0.054, respectively. Areas with moderately high and high levels of intensity were distributed in low-lying areas. Uneven distribution of precipitation, seasonal drought, and flood disasters can directly affect the stability index of croplands and reduce the intensity of cropland use. Developed road networks are associated with moderately high intensity. Our results suggest recommendations such as promoting agricultural intensification and large-scale management, promoting the construction of road networks, improving early warning systems for drought and flood disasters, and promoting moderate and intensive use of arable land, and focusing on restoration and sustainable use of cropland.

Cite this article

SHI Shuqin , HAN Yu , YU Wentao , CAO Yuqing , CAI Weimin , YANG Peng , WU Wenbin , YU Qiangyi . Spatio-temporal differences and factors influencing intensive cropland use in the Huang-Huai-Hai Plain[J]. Journal of Geographical Sciences, 2018 , 28(11) : 1626 -1640 . DOI: 10.1007/s11442-018-1533-6

1 Introduction

Croplands are the basic food source for human survival, and its utilization has an important influence on food security, stability of the ecological environment, and social stability (et al., 2015). Intensive use of croplands involves managing agricultural systems to make more productive use of materials and labor and to apply modern technology and management methods to achieve increased production and income on smaller plots of land (Lin and Feng, 2006). However, China’s cropland area has declined in recent years mainly as a result of reforestation, construction projects, disaster damage, and agricultural structural adjustment (Zhu et al., 2007). In addition, the excessive input of fertilizers and pesticides, salinization of soil, and other unreasonable uses have reduced the quality of cultivated land to different degrees in different parts of China (Kerr et al., 2004; Herzon et al., 2008; Hof et al., 2011). Therefore, the intensive utilization of existing croplands is essential to achieving sustainable agricultural development and food security. To this end, researching spatio-temporal differences of intensive cropland use and influencing factors restricting intensive utilization are of great theoretical value and practical significance.
Previous studies on the level of the intensive use mainly focused on two approaches: a single index (Yao et al., 2014) and a comprehensive index (et al., 2015; Wang et al., 2015; Xie et al., 2016). The single index is the simplest method for evaluation. However, it is generally insufficient for adequately measuring intensive use; thus, comprehensive index measures are a more common method to evaluate cropland resources. Some scholars directly use the input or output index of cropland to measure the degree of intensive use of cropland (Lambin et al., 2000; Yao et al., 2014; et al., 2015). Others constructed a comprehensive evaluation index system including inputs, utilization, production, and sustainable development for compound measurement (Erb et al., 2013; Liu et al., 2014; Ni et al., 2015).
To date, research on the influence mechanisms underlying land cultivation typically rely on traditional econometric models that focus on factors restricting intensive use, with less emphasis on the spatio-temporal differences, evolutionary principles, and influencing mechanisms (Ning, 2015). Previous studies investigated influencing factors for the intensive use of cropland using correlation analysis (Zhang et al., 2014), typical correlation analysis (Zhao and Yang, 2010; Ke and Ma, 2013), multiple linear regression (Wang et al., 2015), Tobit regression (Chen et al., 2014; Lu et al., 2014), double logarithmic regression (Wu et al., 2012), and co-integration analysis (Wu et al., 2011) from the perspective of farmers. These traditional statistical methods hold many assumptions, such as similarities in variance and normality, and actual research cases rarely meet these assumptions (Ding et al., 2014). Furthermore, most research on the spatio-temporal differences in the overall level of intensity of cropland use mainly employed cluster analysis (Fei et al., 2012), Kernel’s density estimation, and the double self-organizing model (Liu et al., 2014).
The GeoDetector model (Wang and Hu, 2012) is based on the theory of spatial differentiation. The model is less constrained by the initial hypothesis (Hu et al., 2011), and it can determine correlations between factor variables and outcome variables, and handle various factors through discrete classification. It uses different processing approaches to analyze and apply domestication of different types of variables at the same spatial scales (Liu and Li, 2017). In recent years, the method has been applied to the studies on social, economic, and environmental issues (Ding et al., 2014; Liu and Yang, 2012).
This study constructed a comprehensive system for evaluating intensive use of croplands based on four aspects: inputs, utilization, production, and sustainable development. Delphi-entropy methods were employed to determine the weight of the index, considering the level of intensity of cropland use and its evolution in the Huang-Huai-Hai Plain from the perspective of the overall level and the four aspects individually. Furthermore, the GeoDetector model was established to explore the influencing mechanisms of intensive use of croplands and then corresponding policy suggestions are made to provide a reliable basis for the sustainable development of cropland in this region.

2 Data and methods

2.1 Study area

The Huang-Huai-Hai Plain (The Huanghe River-Huaihe River-Haihe River Plain, 32°N-40°N and 114°E- 121°E) covers an area of 300,000 km2 and is the second largest plain in China. The plain is located to the west of the Bohai Sea and the Yellow Sea, north of the Dabie Mountains, and west of the Taihang and Qinling mountains. The Huang-Huai-Hai Plain covers seven provinces, including Beijing, Tianjin, Hebei, Shandong, Henan, Anhui, and Jiangsu (Figure 1). The plain is located in a warm-temperate climate zone with an annual average precipitation of about 500-900 mm and annual average temperature of about 8°C-15°C. The active accumulated temperature ≥10°C is about 3800°C-4900°C. There are about 190-220 frost-free days annually. Crops mature three times every two years. There are about 1570 ha of cultivated land and 33,217 ha of construction land in 2010. Forests and grasslands cover 16,238 and 8156 ha, respectively. The Huang-Huai- Hai Plain has a long history of agriculture and a high degree of land utilization and development.
Figure 1 Map of the Huang-Huai-Hai Plain

2.2 Data sources

Land use data were provided by the Resource and Environment Data Center of the Chinese Academy of Sciences. Remote sensing data with a spatial resolution of 1 km for the Huang-Huai-Hai Plain were obtained in 1995, 2000, 2005, and 2010. The study area was divided into farmland, woodland, grassland, water bodies, construction land, and unused land, according to the land use/cover change (LUCC) classification system provided by the data center of the Chinese Academy of Sciences. Slope data for this region was extracted from a 30-m DEM of Shuttle Radar Topography Mission (SRTM). Road data were sourced from the Open Street Map, and meteorological data, mainly average annual precipitation and temperature, were obtained from the Chinese Meteorological Data Sharing Network (http://data.cma.cn).
Evaluation index data related to intensive utilization of croplands were obtained from the Chinese Rural Statistical Yearbook (1997-2012), the Planting Industry Management Department of the Agricultural Ministry of PRC (http://www.zzys.moa.gov.cn), and the Chinese Agricultural Information Network (http://www.agri.cn). There were multiple changes in administrative boundaries during the research, resulting in a change in the total number of counties at different points during the study period. Finally, we organized the dataset to include the area of croplands, fertilizer applications, and agricultural gross production for 344 counties in 1996, 340 counties in 2001, 337 counties in 2006, and 333 counties in 2011.

2.3 Methods

We built an index system and used a subjective and objective combination weighting method to determine the index weight. According to the weighted arithmetic approach used in the multi-factor comprehensive evaluation, the index layer was calculated and then divided into five levels from the highest to the lowest levels using the natural breakpoint method. The GeoDetector model was used to extract dominant factors and quantitatively evaluate the impact of various factors.
(1) Construction of the index system
Based on a review of the literature (Ni et al., 2015), the current comprehensive evaluation index system of intensive utilization was mainly considered. In light of the notion of intensive utilization and relevant theory, the preliminary index system was built from the rule layer and index layer. The rule layer comprised the intensity of inputs, degree of utilization, effect of outputs, and continuous state. The intensity of input factors (input of labor, fertilizers, pesticides, and power, etc. per unit area) reflects the input level of labor, chemical fertilizers, pesticides and mechanical power, etc. The degree of utilization factors (cultivation index, multiple crop index, irrigation index, and stable yield index) shows the extent of multiple cropping, irrigation, drainage, stable yield in land use process. The effect of outputs factors (output value per unit land, output value of every farmer, grain yield per unit area, production of foodstuff for every farmer, per capita net income of farmers) is a direct reflection of the economic status of croplands, which can reflect the comprehensive agricultural productivity after the input and utilization. Continuous state (non-agriculture index and per capita net area of cultivated lands) is to maintain long-term productivity and ecological stability of croplands.
On this basis, the average values of four years data for all these factors were calculated at the county level. Then the correlation analysis method was adopted to determine whether some indicators are internally relevant. There showed a significant correlation coefficient (higher than 0.5) between multiple crop index and irrigation index, output value per unit area of land and output value of every farmer, security index of foodstuff and per capita net area of croplands. Combined with the real situation of the Huang-Huai-Hai Plain, the irrigation index, output value of every farmer, and per capita net area of croplands were retained as these factors are important and strongly related to intensification in this area. Finally, we constructed a final evaluation index system for intensive cropland use based on the rule layer (Table 1).
Table 1 Evaluation index system of the intensity of cropland use
Target layer Criterion layer Index layer Metering method Effect Weights
Intensive utilization of cultivated lands Input intensity Labor input per unit area Population employed in agriculture per unit area of cropland + 0.2565
Fertilizer input per unit area Application of fertilizers per unit area of cropland + 0.2148
Pesticide input per unit area Application of pesticides per unit area of cropland + 0.2850
Power input per unit area Total power of agricultural machinery per unit area of cropland + 0.2437
Utilization degree Cultivation index Area of cropland/Total area of all lands + 0.2252
Irrigation index Area of effective irrigation per unit area of cropland + 0.2235
Stable yield index Security areas/Seeded area + 0.5515
Output
effect
Output value of every farmer Total output value of agriculture/ Population of agricultural employment + 0.5646
The production of foodstuff Total production of foodstuff/Seeded area + 0.1613
The production of foodstuff of every farmer Total production of foodstuff/Population employed in agriculture + 0.2740
Continued
situation
Non-agriculture index Non-agriculture/Total population - 0.6725
Per capita net area of croplands Total area of lands/Total population + 0.3275

Note: “+” indicates the positive effect, and “-” indicates the negative effect.

(2) Combination weighting method
In this study, we used the Delphi-entropy method to determine the weight of the evaluation index. The combination weighting method can not only compensate for the subjective limitations of the Delphi method, but also overcome the limitation of the entropy method in only considering the complete mathematical theory and method while ignoring the subjective information of decision makers and the real situation (Shan et al., 2012). We used the weights determined from the entropy method as correction factors to correct the weight produced by the Delphi method (Table 1).
(3) Geographical detector
GeoDetector developed by Wang Jinfeng (2010), models the interaction between multiple factors by proposing the “factor force” measurement index, combining spatial analysis technology based on Geographical Information System (GIS) and set theory (Liu and Li, 2017). We conducted an exploratory analysis of the spatial difference of influencing factors and its influence on the intensive use of croplands on the plain. The model is as follows:
${{P}_{F,E}}=1-\frac{\sum\limits_{q=1}^{Q}{{{n}_{F,q}}{{\sigma }^{2}}{{E}_{F,q}}}}{N{{\sigma }^{2}}E}$ (1)
where PF,E is the influence of F factor on E, which reflects the level of intensive utilization, and it is dimensionless. When the value of PF,E is close to 1, the level of intensive utilization is increasingly influenced by the factor F. Conversely, when the value of PF,E is close to 0, the level is less influenced by the factor F. Q is the number of the secondary regions, signifying that the factor F is the number of natural clustering classification. N is the number of counties; σ2E is the variance in the degree of intensive utilization in the region; nF,q and σ2EF,q are the number of secondary zones and corresponding variance in the intensive use of croplands.
(4) Factors influencing the intensive use of croplands
Based on findings from previous studies (Ning, 2015) and consulting expert opinions on cropland use, natural resource conditions, and socio-economic policy, we selected nine factors (Table 2), such as elevation, temperature, Gross Domestic Product (GDP), density of road networks, for inclusion in the GeoDetector model. Factors affecting the level of intensity in the Huang-Huai-Hai Plain could be divided into five layers through natural clustering method of Jenks in GIS software (Figure 6). We generated a spatial distribution pattern of influencing factors, and added the spatial distribution pattern of intensive use of arable land. We then ranked the degree of influence by combining various factors. We quantitatively analyzed the factors influencing the spatio-temporal patterns of the intensive use of croplands to determine the degree of influence of the factors on intensive cropland use at the regional level (Table 2).
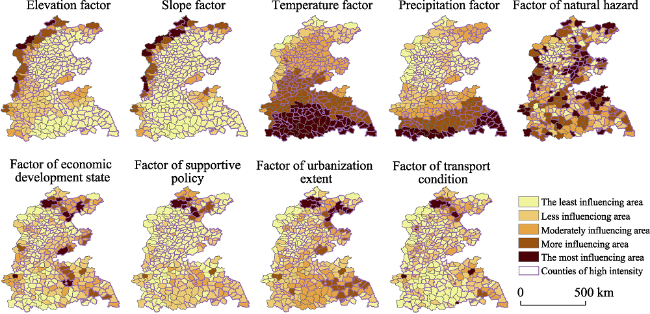
Figure 6 Spatial distribution of influencing factors and the degree of intensive use of croplands (Annotation: Both influencing factors and districts with high intensity in the chart are based on the data of 2011.)
Table 2 Selected influencing factors, their influence value and proportion
Influencing factors Code Variables Unit Influence value Proportion (%)
Natural resources
conditions
Elevation X1 Average elevation m 0.143 23.55
Slope X2 Average slope ° 0.129 21.23
Temperature X3 Annual average temperature 0.042 6.94
Precipitation X4 Annual average precipitation mm 0.051 8.37
Natural disasters X5 Natural hazard rate % 0.158 25.9
Social, economic, and
policy conditions
Economic development state X6 Gross domestic product 10,000 0.013 2.17
Supportive policy X7 Agricultural subsidy 10,000 0.006 1.03
Urbanization extent X8 Built-up area Ha 0.012 2.03
Transport condition X9 Density of road network m/ha 0.054 8.78

Annotation: The influencing factors in the chart are based on the data of 2011.

The influence of the selected factors was calculated using the GeoDetector model (Table 2). We then selected the top factors, such as the elevation, slope, natural disasters, and road networks, for a deeper analysis.

3 Results and analysis

3.1 Temporal changes in intensive use of croplands

As the northern breadbasket for China, the intensity of cropland use in the Huang-Huai-Hai Plain improved significantly from 1996 to 2011. Although the number of counties with high intensity accounted for a low overall proportion (8%), the overall intensity of cropland use improved rapidly during the study period, especially from 2006 to 2011. From 1996 to 2006, the number of counties with high intensity rose gradually and then demonstrated a rapid increase by 46% after 2006. The number of counties with moderately high intensity and moderate intensity also rose with some fluctuation and accounted for a relatively high proportion of the influencing factors. The number of counties with moderately low and low intensity showed a trend of continuous decline. The number of counties with low intensity declined gradually, especially during the period of 2001 to 2011. However, in the last five years of the study period, the number of counties with high intensity varied, and the intensity of cropland use improved rapidly; the proportion of moderately high intensity and moderate intensity slightly dropped. The number of counties with moderately low intensity and low intensity declined almost linearly, occupying a negligible proportion (0.6%) by the end of the study. From the results above, the utilization level of the vast majority of counties in the Huang-Huai-Hai Plain is high (Figure 2).
Figure 2 Number and percentage of counties at each level of intensity in cropland use
The intensity of input increased significantly from 1996 to 2001. The intensity of the continuous situation was at the highest point in 1996. Between 1996 and 2006, the per capita area of croplands declined continuously (as well as measures of sustainable utilization) due to rapid economic development and conversion of agricultural lands in the region. The low level of agricultural management, underdeveloped agricultural mechanization, and inadequate water availability were not favorable for intensive cropland use. After 2006, farmers in the region spared no effort to economically develop croplands, and the intensive use level showed a steady increasing trend from 2006 to 2011. Nearly two thirds of the counties were maintaining a level of intensive use above moderately high intensity from 2001 to 2011. The intensity of degree of utilization was maintained at a higher level, especially in the last ten years. The intensity of utilization above moderate intensity improved in nearly 80% of the counties owing to the constant improvement in cropping systems, irrigation infrastructure, and agricultural production. By 2011, the continuous situation of this area was significantly improved; nearly 85% of the counties had recovered to the moderate level (Figure 3). At the end of the research period, more than 90% of the counties achieved over moderate intensity, indicating a significant improvement.
Figure 3 County number and intensity level of the subsystem
In short, the degree of intensive utilization in the Huang-Huai-Hai Plain increased during the period of 1996-2011. The intensity of input, degree of utilization, and effect of output showed an increasing trend (with some fluctuation) and the continuous situation showed a trend of overall decline (by 4.9% per year), which then rebounded.

3.2 Spatial differences in intensive use of croplands

3.2.1 Spatial differences in the overall level of intensive cropland use
From 1996 to 2011, the overall level of intensive cropland use in the Huang-Huai-Hai Plain gradually increased, with obvious spatial differences. Generally, the availability of irrigation water was sufficient in river basins of the Huang-Huai-Hai Plain. Therefore, the overall level of intensive use of croplands was moderately high for croplands. The overall level of intensive use of croplands in coastal districts and counties was above the moderate intensity level. Through the 15 years, the coverage of districts and counties with high intensity and moderately high intensity of cropland use increased (Figure 4). Areas that showed significant improvement in the level of cropland intensity were mainly distributed in northeast Hebei, northwest Shandong, and north Jiangsu provinces. Most of these areas shifted from low intensity to moderate intensity or from moderately high to high intensity. Highly intensive regions in the suburban counties (or ring districts and counties) of developed cities gradually expanded to districts farther from downtown areas, transferring improved agriculture technology and management techniques. These grain- and oil-producing areas have a strong economic foundation, backing of industry, and access to agricultural infrastructure, such as money, chemical fertilizers, pesticides, and inputs. Districts and counties located in southeast Henan and north Anhui provinces have a relatively low level of intensive utilization of croplands, with intensity levels decreasing in some cases. These areas lack sufficient irrigation water, their agricultural infrastructure is underdeveloped, and possess a low level of economic development.
Figure 4 Variations in the overall level of the intensive utilization of croplands from 1996 to 2011
3.2.2 Spatial differences in the rule layer of intensive cropland utilization
The results of the spatial analysis of intensive use of croplands for each rule layer showed
that in several major agricultural provinces, such as Hebei, Shandong, Henan, and Anhui, there were high levels of input intensity and utilization, but the output effect was slightly inferior. However, after 2006, the increase was significant; regions showing increases in intensity were mainly distributed in west Shandong and north Jiangsu provinces, while other areas showed a continuous annual decline (Figure 5).
Figure 5 Variation in the intensive level of each subsystem from 1996 to 2011
Regarding input intensity, the levels of agricultural investment in the region constantly improved from 1996 to 2006. Investment levels were moderately high in counties in central Hebei, northeast Henan, and west Shandong compared to other regions in 2006. In addition, the overall investment level was moderately high in the Yellow River Basin. With economic development, many districts and counties do not simply invest more in the intensive use of croplands, but they also pay more attention to intensive utilization to improve efficiencies.
The central and southern regions in the Huang-Huai-Hai Plain have high temperatures and abundant rainfall, allowing for three crop harvests within a 2-year period. In the Yellow River and the Huaihe River basins, irrigation water is adequate so the irrigation index is moderately high. The average elevation in the central Huang-Huai-Hai Plain is low, so it is more suitable for farming; the cultivation index is moderately high with intensive human activities. Thus, favorable climatic conditions and a solid foundation of agricultural infrastructure have led to continued improvement in the level of intensive use of croplands in most areas in the plain from 1996 to 2011, especially from 1996 to 2001 and 2006 to 2011.
The output effect has improved significantly from 2006 to 2011 because of constant investment and increasingly intensive utilization. Districts and counties where the output effect has remained above the level of moderate intensity are mainly located near Beijing, Tianjin, Tangshan, counties in the suburbs of Shijiazhuang city, and north Jiangsu, where the agricultural economy is strong. These areas are close to other areas with a great market demand for agricultural products, so their output effect is significantly higher than other districts. Because of the favorable climate and other basic agricultural conditions, the output effect in central Shandong and north Jiangsu is also relatively high. From 1996 to 2006, the output effect of Henan, Anhui and Hebei improved slowly, but rapid development was achieved in the last five years.
Regarding the continuous conditions, from 1996 to 2006, in addition to north Jiangsu, where conditions are favorable, the level of intensity in the Huang-Huai-Hai Plain is declining with rapid economic development, rapid increases in urbanization, declining per capita arable land, and continuous increases in the non-agriculture index. This is especially true in most counties in Hebei and Henan provinces, in which the continuous situation reached the lowest level in 2006. At the end of the study period, the continuous situation of a majority of counties in the Huang-Huai-Hai Plain then reverted to its original level in 1996.

3.3 Influencing factors of intensive cropland utilization

We generated a spatial distribution pattern of influencing factors, and added the spatial distribution pattern of intensive use of arable land (Figure 6). The analysis revealed the influence of these factors on the intensity of cropland use in the Huang-Huai-Hai Plain. Overall, the results showed that natural disasters were the dominant factor affecting the spatial pattern of intensive utilization of cultivated land, with an influence value of 0.158, accounting for 25.90% of the analyzed influencing factors. Elevation had an influence value of 0.143, accounting for 23.55% of the influencing factors. Slope had an influence value of 0.129, accounting for 21.23% of the influencing factors. Road networks had an influence value of 0.054, accounting for 8.78% of the analyzed influencing factors. The results of this analysis provide a reference point for enhancing the level of intensive use of croplands in the plain, and implementing different agricultural policies.
3.3.1 Influence of elevation and slope on the spatio-temporal patterns of intensive cropland use
Topography is an important factor affecting regional differences in the intensive use of cultivated land, which mainly shows that differences in elevation and slope will cause changes in the spatial patterns of cultivation intensity. We found that areas with moderately high and high levels of intensity in cropland use were distributed in low-lying areas. Areas at high elevations and with steep slopes were found to have very low intensities of cropland use. For example, in areas around Taihang and Yanshan mountains, farms were scattered and there was little arable land. Areas at low elevations with flat terrain have more concentrated croplands and frequent human activities. These locations have favorable conditions for agricultural production, and adequate inputs of labor and material resources per unit area of cultivated land. Road networks are also well developed and conducive to agricultural mechanization. Thus, the intensive use of croplands was relatively high.
3.3.2 Impact of natural disasters on the spatio-temporal patterns of intensive cropland use
The Huang-Huai-Hai Plain is located in the monsoon climate region, which means there are more frequent droughts and floods. Temperature and precipitation in the region show a decreasing trend from south to north, but surprisingly the counties with moderately high and high levels of cropland intensity are mostly distributed in the areas where the average annual temperature is slightly lower and rainfall is moderate. In areas where there is an uneven distribution of precipitation, seasonal drought and flood disasters can directly affect the stability index of croplands and reduce the intensity of cropland use.
3.3.3 Influence of road networks on the spatio-temporal patterns of intensive cropland use
Road networks influence the spatial pattern of cropland use. Under normal circumstances, more developed road networks are associated with moderately high levels of cropland intensity, and sparser road networks are related to moderately low levels of intensity in the use of cultivated land. Areas with high-density transportation networks in and around Beijing, Tianjin, south Shandong, and north Jiangsu have developed economies, high levels of urbanization, and a great demand for agricultural products. These factors drive farmers to actively embrace the development of intensive agriculture. However, in remote areas, sparse road networks increase the cost of agricultural production, resulting in less intensive modes of operation. In these areas, farmers still rely mainly on traditional grain and economic crops, which reduce the intensity of cropland use. With economic development and improvement in road networks, transportation becomes an active factor in the intensity of cropland use and its influence may be positive on the spatial pattern of the cropland intensity.

4 Discussion

From the results, we make the following recommendations: 1) The main grain-producing areas in the Huang-Huai-Hai Plain should actively promote agricultural intensification and large-scale management. Government agricultural agencies should improve the efficiency of agricultural production by developing large-scale management and comprehensive planting and breeding programs. In addition, agricultural officials should promote rural land rights and ownership on the part of local farmers to improve rural land management. Once land rights and contracts are established, agencies should explore the effective implementation of moderate-scale management. 2) The government should also actively develop the economy and promote the construction of road networks. In rural areas with relatively low levels of intensive cropland use, efforts must be made to promote road network construction, with emphasis on field roads, ensuring smooth operation of large-scale agricultural machinery. This will significantly contribute to improving the efficiency of farming and the level of agricultural mechanization. 3) The government should also strengthen prevention and early warning systems for drought and flood disasters, as well as improving response capacity to natural disasters. To this end, the local government should first establish an effective network to monitor potential climate threats by linking meteorological stations, hydrological stations and rainfall monitoring stations located in different regions. Second, water conservancies should be set up to regularly dredge the main rivers (such as the Yellow River, Huaihe River, and Haihe River), renovate and construct new coastal dams, and improve flood storage capacity. 4) The government should promote moderate and intensive use of arable land, focusing on restoration and sustainable use of cultivated land. Further research are required to find a reasonable threshold of land intensity, according to the law of diminishing returns. In agricultural production, the government should determine the most appropriate level of inputs, such as the application of fertilizers, through experimental testing of the effects on soil to maximize the overall benefit of cropland use and achieve sustainable use of cultivated land.
The general trend of change in intensive use of croplands on the Huang-Huai-Hai Plain is in agreement with the conclusions of Cao et al. (2009). They demonstrated that constructing an evaluation index system from inputs, outputs, utilization, and sustainable use, as well as introducing the method of emergy value, were feasible in the evaluation of intensive use of croplands. However, the results of the index system, evaluation units, and research methods slightly varied across time and space in comparison to their study results. In addition, our concepts about moderate intensity, proper fallow, and promoting sustainable development were in agreement with Zhao et al. (2001), Zhang et al. (2014) and Wu et al. (2000). The Zhao’s and Zhang’s study also focused on spatio-temporal differences in the continued status of the subsystem and law of decreases in land remuneration. The Wu’s study focused on super high yield characteristics of intensive planting systems, groundwater crises, and the unity of opposites in agricultural intensification and sustainability.
The shortcomings of this study were primarily in the difficulty in obtaining or quantifying ecological indicators, and the impacts of agricultural production on carbon emissions and biodiversity. In addition, it is difficult to accurately measure the sustainability status of arable land, which inevitably reduces the accuracy of evaluation. Because of time limitations, we only considered the influence of environmental, social, and economic factors at a large scale. The influence from towns, villages, farmers, plots and other micro-scale factors should also be considered for a more in-depth analysis.
In the future, we should focus on acquiring and quantifying relevant ecological indicators, and improve the existing index system and scientific methods for evaluation. To enhance the objectivity and rationality of the analysis, various research efforts should be integrated into a driving force analysis that features relevant indicators of intensive use of arable land.

5 Conclusions

We conducted a spatial analysis of different levels of intensive use of croplands and its evolution in the Huang-Huai-Hai Plain. For this purpose, an index system and a comprehensive evaluation model were constructed. The Delphi-entropy method was adopted to determine the weight of the index, and a GeoDetector model was built to explore influencing mechanisms of intensive use of croplands. The following main conclusions can be drawn:
(1) In terms of temporal changes, from 1996 to 2011, the overall intensity of the use of arable land in the Huang-Huai-Hai Plain has increased. The number of counties with high intensity rose gradually and then rapidly increased by 46% after 2006. The number of counties with moderately high intensity and moderate intensity also rose with some fluctuation and accounted for a relatively high proportion (38%) in 2011. The number of counties with moderately low and low intensity declined gradually, especially during the period from 2001 to 2011, occupying a negligible proportion (0.6%) by the end of the study period. Overall, the intensity of input, degree of utilization, and effect of output showed an increasing trend (with some fluctuation) and the continuous situation showed a trend of overall decline (by 4.9% per year), which then rebounded. On the whole, the utilization level of the vast majority of counties in the Huang-Huai-Hai Plain was high. The results are in agreement with descriptions of the current characteristics of cropland use in the Huang-Huai-Hai region.
(2) In terms of spatial differences, the overall level of intensive cropland use in the Huang-Huai-Hai Plain gradually increased, with obvious differences in different regions. In the Yellow River and Huaihe River basins, water resources are abundant, so the overall level of arable land use intensity is relatively high. There are intense inputs in Shandong, Henan and Anhui, which are the major agricultural provinces. Jiangsu and northern Anhui have favorable natural conditions and high utilization level of arable land. There is an obvious output effect in most areas, especially evident after 2006. From 1996 to 2006, in addition to northern Jiangsu, the level of intensity in the Huang-Huai-Hai Plain declined at the end of the study period; the continuous situation of a majority of counties in the Huang-Huai-Hai Plain then reverted to its original level in 1996.
(3) The most important factors affecting the intensity of cropland use in the Huang-Huai-Hai Plain are natural disasters, elevation, slope, and road networks. Natural disasters are the core factor limiting arable land intensification in this region. However, damage from disasters can be reduced or mitigated through early warning systems and rational use of land. Elevation and slope factors, as stable congenital conditions, will not cause a fundamental change in arable land intensification. However, road networks can significantly influence intensification and are relatively easy to develop.

The authors have declared that no competing interests exist.

[1]
Cao Zhihong, Liang Liutao, Hao Jinmin, 2009. Intensive degree and spatial-temporal distributions of agricultural land use over the Huang-Huai-Hai region of China.Resources Science, 31(10): 1779-1786. (in Chinese)The limitation and scarcity in agricultural land resources require improvement to the intensive utilization level of agriculture land use in order to satisfy the growing agricultural products demand for socio-economic growth in China.Due to shortcomings of calculating the intension degree of agricultural land use by means of material possession and value or market price,the authors introduced a theory of emergy analysis to calculate the intensive degree of agricultural land use over the Huang-Huai-Hai region and then rationally analyzed its spatial-temporal distribution patterns.Because of a prominent natural endowment and good socio-economic conditions for agricultural production,the intensive degree of agricultural production investment over Huang-Huai-Hai region is significantly higher than that of average agricultural production investment in China.Overall,the growth rate of the intensive degree of agricultural production investment is much higher than that of the national average,indicating that the Huang-Huai-Hai region remains a high level of agricultural intensive production.The areas with a decreasing trend in intensive degree of agricultural production are primarily distributed over the regions where the number of migrant workers going out to work is relatively larger and over economically developed regions.The ratio between Agricultural Production Capital and labor input emergy over Huang-Huai-Hai region in period 2001-2005 was significantly higher than that of national average and is growing rapidly.This shows an obvious trend in replacement of the labor power depending on backward hand-tools and livestock by advanced agricultural production tools.It was also found through Spearman rank correlation coefficient analysis that the ratio between Agricultural Production Capital and labor input emergy over Huang-Huai-Hai region is highly correlated to the percentage of the population employed in the primary industrial and the fraction of the unban population to the total population.This indicates that the improvement to the level of agricultural modernization would help presents transfer to the secondary and tertiary industries,free from agricultural labor power.

[2]
Chen Yuqi, Li Xiubin, Zhu Huiyi et al., 2010. Agricultural land use responses to increasing labor opportunity cost in Suixian County of Henan Province.Progress in Geography, 29(9): 1067-1074. (in Chinese)Increasing labor opportunity cost has become one of the most important influencing factors for agricultural land use changes.Based on 328 household survey data in Suixian County,Henan Province,this paper analyzed the types of labor employment and non-agricultural work time and wages,and then calculated the labor opportunity cost by using different labor types chances of getting non-agricultural job as the correction factor to amend wages.It was found that labor opportunity cost significantly affected land use practices of rural households.Households with higher labor opportunity cost always have higher nonfarm income.They are less dependent on agricultural production and more likely to lease their cultivated land to other farmers.These farmers are also inclined to grow food crops which need less labor inputs but have higher labor productivity.This results in homogenization of regional land use structure in terms of crop types.As to land use intensity,along with the increase of labor opportunity cost,labor intensity and yield-increasing inputs in agriculture decrease rapidly,while labor-saving inputs show an increasing trend.The households with larger labor opportunity cost are willing to increase machinery inputs as a substitute for labor inputs.Because of the reduction of yield-increasing inputs,the households with larger labor opportunity cost have lower grain yield per unit area.

DOI

[3]
Ding Yue, Cai Jianming, Ren Zhoupeng et al., 2014. Spatial disparities of economic growth rate of China’s national-level ETDZs and their determinants based on geographical detector analysis.Progress in Geography, 33(5): 657-666. (in Chinese)Construction of National-level Economic and Technological Development Zones(NETDZs) is one of the most effective governmental policy measures in implementing the nation's regional development strategy and promoting economic development in China.In over 30 years with the widespread establishment of NETDZs in all areas of China,their spatial disparities have increasingly expanded due to various driving mechanism.Understanding and exploring these spatial disparities by Economic Growth Rate(EGR) and their key determinants behind will have a significant importance to understanding the development patterns of ETDZs,making locallytailored strategies and identifying highly efficient development approaches.This paper therefore uses the coefficient of variation and the geographical detector tool to analyze systematically the spatial disparities of NETDZs in China by their EGR in 2010.The result shows that:(1) Overall,EGR of NETDZs in China shows a large difference between eastern,central and western parts of the country with a U-shaped curve,that is,lowest growth rate in central China;(2) Within each region,the spatial disparity of EGR of NETDZs has different characteristics-such disparity is highest in western China followed by eastern China,and is lowest in central China;(3) The national scale factor detection shows that decision forces of the potential determinants vary only slightly.However,significant difference is detected in the analysis for individual regions,which means that the key determinants for the spatial disparities of EGR in NETDZs in the three regions are quite different;(4) Among the 5 key determinants,internal determinants from inside the NETDZs are more dominated in central China and western China while external determinants from host city and regional context are more dominated in eastern China:changes in labor cost,the volume of foreign trade,preferential policy in NETDZs,spatial accessibility of the host city,and industrial support from the host city are the top 5 determinants in the central area of China.Preferential policy change,industrial support from the host city,change in the volume of foreign trade,relative economies scale of NETDZ,and investment level of host city are the top 5 determinants in the western part of China.For NETDZs in eastern China,the top 5 determinants are changes in preferential policy and labor cost,the level of total investment,economic development,and economic growth rate of the host city.(5) The pattern of spatial disparities of EGRs and determinants in NETDZs in three regions in China reflects,to a certain extent,the evolution stage in the life circle of ETDZs development.Based on this,we recommend that in the near future,the development of NETDZs in central China and western China should focus on improving their internal factors such as lowering labor cost,increasing volume of foreign trade and applying more effective preferential policies,while in the long run,external factors,such as spatial accessibility of the host city and industrial support from the host city,will become increasingly important to NETDZ development,meaning that the development of NETDZs will be eventually more dependent on how well they can be integrated into the host city and to a large extent,the urban region.

[4]
Erb K H, Haberl H, Jepsen M R et al., 2013. A conceptual framework for analyzing and measuring land-use intensity.Current Opinion in Environmental Sustainability, 5(5): 464-470.Large knowledge gaps currently exist that limit our ability to understand and characterise dynamics and patterns of land-use intensity: in particular, a comprehensive conceptual framework and a system of measurement are lacking. This situation hampers the development of a sound understanding of the mechanisms, determinants, and constraints underlying changes in land-use intensity. On the basis of a review of approaches for studying land-use intensity, we propose a conceptual framework to quantify and analyse land-use intensity. This framework integrates three dimensions: (a) input intensity, (b) output intensity, and (c) the associated system-level impacts of landbased production (e.g. changes in carbon storage or biodiversity). The systematic development of indicators across these dimensions would provide opportunities for the systematic analyses of the trade-offs, synergies and opportunity costs of land-use intensification strategies.

DOI PMID

[5]
Fei Luocheng, Cheng Jiumiao, Wu Cifang, 2012. The spatial-temporal comparative analysis of cultivated land intensive utilization in Central China.Land and Resources Information, 6(1): 46-51. (in Chinese)

[6]
Herzon I, Aunins A, Elts J et al., 2008. Intensity of agricultural land-use and farmland birds in the Baltic States.Agriculture, Ecosystems & Environment, 125(1/4): 93-100.There was a clear indication that the more intensively farmed areas across the Baltic States of Estonia, Latvia and Lithuania provided habitat for fewer bird species and individuals. The abundance of farmland specialist birds was significantly lower by 20% in the more intensive areas as compared to less intensive ones. The difference could partly be explained by the more heterogeneous landscape and field areas in the latter. An analysis of the data from homogeneous arable fields indicated that agricultural intensification was reflected in a tangible decrease in farmland bird abundance, especially in species in need of edge structures. Considerable improvements are needed in conservation safeguards for the region facing intensification of production.

DOI

[7]
Hof C, Araujo M B, Jetz W et al., 2011. Additive threats from pathogens, climate and land-use change for global amphibian diversity.Nature, 480(7378): 516-519.Amphibian population declines far exceed those of other vertebrate groups, with 30% of all species listed as threatened by the International Union for Conservation of Nature. The causes of these declines are a matter of continued research, but probably include climate change, land-use change and spread of the pathogenic fungal disease chytridiomycosis. Here we assess the spatial distribution and interactions of these primary threats in relation to the global distribution of amphibian species. We show that the greatest proportions of species negatively affected by climate change are projected to be found in Africa, parts of northern South America and the Andes. Regions with the highest projected impact of land-use and climate change coincide, but there is little spatial overlap with regions highly threatened by the fungal disease. Overall, the areas harbouring the richest amphibian faunas are disproportionately more affected by one or multiple threat factors than areas with low richness. Amphibian declines are likely to accelerate in the twenty-first century, because multiple drivers of extinction could jeopardize their populations more than previous, mono-causal, assessments have suggested.

DOI PMID

[8]
Hu Yi, Wang Jingfeng, Li Xiaohong et al., 2011. Geographical detector-based risk assessment of the under-five mortality in the 2008 Wenchuan earthquake, China.PLoS One, 6(6): e21427.On 12 May, 2008, a devastating earthquake registering 8.0 on the Richter scale occurred in Sichuan Province, China, taking tens of thousands of lives and destroying the homes of millions of people. Many of the deceased were children, particular children less than five years old who were more vulnerable to such a huge disaster than the adult. In order to obtain information specifically relevant to further researches and future preventive measures, potential risk factors associated with earthquake-related child mortality need to be identified. We used four geographical detectors (risk detector, factor detector, ecological detector, and interaction detector) based on spatial variation analysis of some potential factors to assess their effects on the under-five mortality. It was found that three factors are responsible for child mortality: earthquake intensity, collapsed house, and slope. The study, despite some limitations, has important implications for both researchers and policy makers.

DOI PMID

[9]
Ke Xinli, Ma Caixue, 2013. Canonical correlation analysis on impacts of urbanization on cultivated land use intensity and its policy implications.China Land Sciences, 27(11): 4-10. (in Chinese)The purpose of this study is to disclosure the impacts of population urbanization, economic urbanization, land urbanization and social urbanization on cultivated land use intensity, e.g., labor input intensity, fertilizer and pesticides input intensity, and agricultural machine input intensity. It could provide scientific reference to the new-type urbanization and rational use of cultivated land. Canonical correlation analysis method is employed. Results show that 1) population urbanization, economic urbanization and social urbanization play the significant role in cultivated land use intensity, especially labor intensity and agricultural machine intensity. Land intensity has few impacts on cultivated land intensity. 2) improvement of economic urbanization will improve agricultural machine intensity and lower labor intensity, while improvement of population urbanization will lower both labor intensity and agricultural machine intensity. Meanwhile, improvement of social urbanization will raise both labor intensity and agricultural machine intensity. So, we can conclude that it's essential to improve population urbanization during new urbanization stage. That improving both economic urbanization and social urbanization, while constraining land urbanization play essential role in the process of new-type urbanization.

[10]
Kerr J T, Cihlar J, 2004. Patterns and causes of species endangerment in Canada.Ecological Applications, 14(3): 743-753.Few studies have addressed patterns and causes of species endangerment at different resolutions and geographical extents. Using newly developed remote sensing and species distribution data sets, we examined the influence of both natural and anthropogenic factors on the density of terrestrial endangered species in Canada at two spatial scales. The first was at a national extent and the second was within a region of Canada (the mixed wood plains) where there are particularly large numbers of endangered species. We also examined the distribution of protected areas throughout Canada to determine their capacity to shelter endangered species. Land use, which is measured by 1-km resolution satellite data, is a strong predictor of endangered species densities at both scales of analysis. Land use integrates information on habitat loss to agriculture and land use intensity, an index of agricultural pollution. The amount of protected area in a region is unrelated to endangered species numbers except to the extent that areas with the most endangered species are, at best, nearly devoid of protected area. Newly legislated protections for endangered species are unlikely to bring much improvement to this conservation dilemma. Canada's endangered species legislation promotes cooperative conservation activities in areas where species endangerment is most pronounced but does little to protect remaining habitat.

DOI

[11]
Lambin E F, Rounsevell M D A, Geist H J, 2000. Are agricultural land-use models able to predict changes in land-use intensity?Agriculture Ecosystems & Environment, 82(1): 321-331.Land-use and land-cover change research needs to pay more attention to processes of land-cover modification, and especially to agricultural land intensification. The objective of this paper is to review the different modelling approaches that have been used in land-use/land-cover change research from the perspective of their utility for the study and prediction of changes in land-use intensification. After clarifying the main concepts used, the different modelling approaches that have been used to study land-use change are examined, case study evidence on processes and drivers of land-use intensification are discussed, and a conclusion is provided on the present ability to predict changes in land-use intensity. The analysis suggests there are differences in the capability of different modelling approaches to assess changing levels of intensification: dynamic, process-based simulation models appear to be better suited to predict changes in land-use intensity than empirical, stochastic or static optimisation models. However, some stochastic and optimisation methods may be useful in describing the decision-making processes that drive land management. Case study evidence highlight the uncertainties and surprises inherent in the processes of land-use intensification. This can both inform model development and reveal a wider range of possible futures than is evident from modelling alone. Case studies also highlight the importance of decision-making by land managers when facing a range of response options. Thus, the ability to model decision-making processes is probably more important in land-use intensification studies then the broad category of model used. For this reason, landscape change models operating at an aggregated level have not been used to predict intensification. In the future, an integrated approach to modelling that is multidisciplinary and cross-sectoral combining elements of different modelling techniques will probably best serve the objective of improving understanding of land-use change processes including intensification. This is because intensification is a function of the management of physical resources, within the context of the prevailing social and economic drivers. Some of the factors that should be considered when developing future land-use change models are: the geographic and socio-economic context of a particular study, the spatial scale and its influence on the modelling approach, temporal issues such as dynamic versus equilibrium models, thresholds and surprises associated with rapid changes, and system feedbacks. In industrialised regions, predicting land-use intensification requires a better handling of the links between the agriculture and forestry sectors to the energy sector, of technological innovation, and of the impact of agri-environment policies. For developing countries, better representation of urbanisation and its various impacts on land-use changes at rural-urban interfaces, of transport infrastructure and market change will be required. Given the impossibility of specific predictions of these driving forces, most of the modelling work will be aimed at scenario analysis.

DOI

[12]
Lin Hongzeng, Feng Xuehui, 2006. Evaluation index system of land use intensification potential in urban area.Journal of Earth Sciences & Environment, 1(1): 106-110.Land use intensification is the only choice of China's urbanization.This paper points out that urban land use intensification potential evaluation is made up of four parts,namely collective evaluation,regional evaluation,development zone evaluation and parcel evaluation.Meanwhile,it puts forward a set of urban land use intensification evaluation index system,ranging from collective evaluation index system of land use intensification in urban area,regional evaluation index system of land use intensification in urban area,development zone evaluation index system of land use intensification to parcel evaluation index system of land use intensification in urban area.

DOI

[13]
Liu Yansui, Li Jintao, 2017. Geographic detection and optimizing decision of the differentiation mechanism of rural poverty in China.Acta Geographica Sinica, 72(1): 161-173. (in Chinese)Rural poverty has long aroused attention from countries around the world, and eliminating poverty and achieving realize common prosperity is an important mission to build the well- off society in an all- round way. Scientifically revealing the regional differentiation mechanism of rural poverty has become an important issue of implementation of national poverty alleviation strategy. This paper, taking Fuping County of Hebei Province as a typical case, diagnoses the dominant factors of differentiation of rural poverty and reveals the dynamic mechanism of rural poverty differentiation by using the Geodetector model and multiple linear regressions, and puts forward the poverty alleviation policies and models for different poverty regions. The result shows that the dominant factors affecting rural poverty differentiation include slope, elevation, per capita arable land resources, distance to the main roads and distance to the center of county, and their power determinant value to poverty incidence differentiation are 0.14, 0.15, 0.15, and 0.17. These factors affect the occurrence of poverty from different aspects and their dynamic mechanism is also different. Among various factors, the slope and per capita arable land resources affect the structure and mode of agricultural production, while distance to the main roads and distance to the center of county have influence on the relationship between the interior and exterior of the region. There are significant differences in the four types identified of regional rural poverty, namely,environment constrained region mainly affected by slope(seven towns), resource oriented region mainly affected by per capita arable land(seven towns), area dominated by traffic location affected by distance to the main roads(three towns), and economic development leading area mainly affected by distance to the center of county(four towns). Then, Fuping County is divided into single core, dual core and multi- core area according to the number of core elements of the township. The county has shown a multi differentiation of rural poverty with a horizontal center of dual core area, and both sides have a single core and multi- core,which are affected by different dominant factors. Finally, this paper suggests that policy of targeted poverty alleviation should take science and technology as the foundation and form innovation of targeted poverty alleviation according to the core dominant factors of the differentiation mechanism of rural poverty. The county's poverty alleviation and development under different driving mechanisms need orderly promotion of poverty alleviation and integration of urban and rural development strategy with adjusting measures to local conditions, respecting for science, and stressing practical results.

DOI

[14]
Liu Yansui, Yang Ren, 2012. The spatial characteristics and formation mechanism of the county urbanization in China.Acta Geographica Sinica, 67(8): 1011-1020. (in Chinese)The spatial and temporal characteristics and the formation mechanism of the county urbanization in China since 1990 were analyzed systematically,using the methods including regional differences,transect and geography detectors. Results show that the temporal and spatial differences of the county urbanization were significant. The "herringbone" shape region pattern of high county urbanization was gradually highlighted,which were made by the counties along the north border and in eastern coastal areas. The county urbanization process of some regions were accelerated and enhanced,including Wuhan metropolitan region,Chengdu-Chongqing region and Guanzhong-Tianshui region. The low county urbanization level was maintained in Southwest China and Qinghai-Tibet Plateau regions. The differences of urbanization and the change rate of county urbanization were converged in China after 2000,but the rate has slowed down since 2000. The county urbanization trend of transects were significantly different,including Lianyungang-Lanzhou railway and Lanzhou-Urumqi railway transects,the Yangtze River transect,the border of north China transect,106 National Road transect,and the eastern coastal transect. There are many factors affecting county urbanization,mainly including economic development stage,the level of secondary and tertiary industries,rural net income per capita,population density,leading position of grain production,demographic statistics and special arrangements for counties. The high county urbanization in northern border regions was a typical type of statistical unrealistically high urbanization. In the future county urbanization development should follow the geographical differences,highlight its leading function,and adopt multiple urbanization development models such as promoting urbanization intensively in key urban economic development areas,separating urbanization in cropland and grain producing areas,migrating urbanization in ecological and water resource protection areas,suburban areas and urban-based urbanization and other leading county urbanization patterns.

DOI

[15]
Liu Yu, Hao Ming, Pan Yuchun et al., 2014. Evaluating and zoning of cultivated land intensive use in Henan province at county level.Scientia Geographica Sinica, 34(10): 1218-1225. (in Chinese)The intensive use of cultivated land resource is not only the key to improve the cultivated land use efficiency and to ensure the national food security, but also been one of the most important components in rural development and social stability. Henan is the largest agricultural province and the most populous province in China, research on the intensive use of cultivated land in Henan is a window for penetrating into phenomena in China, for which occupying more than 6% cultivated land area in China. Considering the actual situation of the126 counties in Henan Province, the evaluation index system for cultivated land use intensity was established from four aspects, including land investment degree, utilizing intensity, output efficiency and sustainable development status. The weight of each index was calculated by the entropy method, and then the intensity of cultivated land use in 1990, 2000 and 2010 at county level was evaluated and graded. The results demonstrated that: 1) As for temporal characteristic, the average degree of cultivated land intensive use showed an increasing tendency, increased from 0.262 in 1990 to 0.461 in 2010, and the total disparities of intensive use degree in Henan at county level have enlarged. The distribution shapes of intensive use degree were typical"single peak"shapes in the three years, transforming from "spike peak" in 1990 to "broad peak" in 2000 and 2010. 2)As for spatial characteristic, the character of spatial clustering about counties of high value and low value was remarkable, and intensive degree was significantly higher in eastern plain region than in western mountain area, higher in northern region than in southern region. The investment degree and utilizing efficiency of cultivated land were the main reasons that lead to the increment of cultivated land intensive use, while utilizing intensity and sustainable development status improved slower. The level of cultivated land intensive use in most counties from 1990 to 2010 showed a steady increase. 3) The spatial difference of cultivated land intensive use was resulted mainly from location condition, natural features and economic condition, and the main driving forces influencing cultivated land intensive use in different counties were different. The 126 counties in Henan were aggregated into five regions by self-organizing dual zoning method, including the eastern Huang-Huai plain area, the northern plain area, the southeast plain area, the central-south plain area and the western mountain area,and some suggestions on cultivated land intensive use were brought forward.

[16]
Xiao, Niu Shandong, Li Zhenbo et al., 2015. Present situation and trends in research on cultivated land intensive use in China.Transactions of the Chinese Society of Agricultural Engineering, 31(18): 212-224. (in Chinese)The cultivated land intensive use(CLIU) is related to food security, supply of agricultural products, and even economic and social sustainable development. There is important theoretical and practical significance in deeply understanding the condition of CLIU and its change process, pattern, mechanism and comprehensive effect. The paper, by adopting the methods of literature analysis and systematic induction, analyzed the research status of CLIU in China from 3 aspects of research scale, research content and research method. Then with the help of Chinese literature database, we summarized the trends and the overall situation of the researches on CLIU in China in nearly 30 years. We think the existing research presents the following features: a diversity of research perspectives and analysis scales, a wide range of research contents and positivism methodology. Meanwhile, there are a lot of deficiencies in present research, which mainly show in 4 aspects: 1) The researches are insufficient in these aspects including the choice of proper scale, the selection of indicator to proper scale characteristics, the comparison analysis and diversion between different scales, the spatial and temporal scale coupling; 2) The subtype of the CLIU elaboration researches, including paddy field, irrigated land, dry land, is not reported; 3) The content and depth need to be developed, such as the scientificity of CLIU evaluation, the systematicness of influence mechanism, the integrity of intensive effect and the effectiveness of regulation approach; 4) The trend of favoring metric over mechanism, value results over process and verification in research methods need to be overcome, and the method system of multidisciplinary coupling has not yet been built. Overall, the existing research is difficult to meet expectations and requirements in cultivated land resource use of national strategic demand of the new urbanization, "five transformations coordination" and cultivated land protection. The result suggests that the studies on CLIU should focus on these scientific problems: 1) The influence of new development factors on CLIU should be explained, especially the influence differences between traditional elements and new development factors; 2) Revealing the feedback mechanism of the process that the CLIU affects the man-land relationship areal system; 3) Prove the collaborative process and coupling mechanism between CLIU and regional rural development, urban-rural integration and quality of regional ecological environment, build the theory and method system of "process, pattern, mechanism" of CLIU, and realize the effective control of CLIU. Based on the above main scientific problems, further studies should strengthen the project research on the scale and scaling in the evaluation of CLIU, especially the data acquisition, the identification of influencing factors and the driving mechanism analysis at multiple scales. We should be committed to building a comprehensive and integrative theoretical framework for analyzing the inside and outside process of CLIU, depicting the main body structure and spatio-temporal pattern of CLIU, and revealing the driving mechanism and regulation mechanism. More attentions should be given to the comprehensive and integrative method system for the CLIU research, as well as the scientificity and feasibility of data acquisition and processing. It is necessary to select appropriate scale and typical area to build the research system of the CLIU in China, explore the process, pattern, effect and trend of CLIU, and then put forward the typical mode and characteristic path for the intensive use of cultivated land.

DOI

[17]
Ni Chao, Yang Shengtian, Luo Ya et al., 2015. The spatial-temporal difference analysis of cultivated land use intensity in Heilongjiang province based on circular economy.Geographical Research, 34(2): 341-350. (in Chinese)In order to examine the level of intensive cultivated land use and features of spatialtemporal difference accurately, based on the basic principles of circular economy, namely "reduce, reuse, recycle", an evaluation index system of intensive cultivated land use from four aspects including input intensity, reuse, comprehensive benefit and continuous status was constructed. Status of intensive cultivated land use in Heilongjiang province from 1986 to 2008 was evaluated by using entropy method and variation coefficient method, and the feature of spatial difference of various areas in Heilongjiang was discussed by using Spearman rank correlation coefficient and cluster analysis method. The results show that:(1) As the condition of cultivated land in Heilongjiang was superior and a series of policies to support and benefit farmers have been implemented, the intensive use degree of cultivated land showed an increasing trend during the study period compared with the period from 1994 to 1998;(2) Increasing population and decreasing cultivated land had a detrimental effect on continuous status, which presented a decreasing trend. While other three layers, namely input intensity, reuse and comprehensive benefit, showed an increasing trend, because cultivated land protection had been strengthened and agricultural input had increased. Coordination degree of cultivated land use was in a highly coordinate state on the whole;(3) Cultivated land use intensity in Northeast China decreased significantly, while the increased or decreased margin in other areas was unobvious;(4) Under the influence of nature, economy, location and other factors, the difference of intensive cultivated land use in various areas was significant, which can be divided into five classes, highly intensive, more intensive, generally intensive, basic intensive and non-intensive. On the whole, the intensive use degree of cultivated land in Heilongjiang showed an increasing trend during the study period. The areas of superior natural conditions, such as Sanjiang plain and Songnen plain, have higher cultivated land intensity, while the nonagricultural areas have lower cultivated land intensity.

DOI

[18]
Ning Xiaoli, 2015. Spatial pattern of intensive croplands use and its influencing factors in Beijing, Tianjin and Hebei region [D]. Hebei: Agricultural University of Hebei. (in Chinese)

[19]
Shan Chengju, Dong Zengchuan, Fan Kongming, 2012. Application of combination weighting method to weight calculation in river health evaluation.Journal of Hohai University, 40(6): 622-628. (in Chinese)According to the concept of combination weighting based on game theory,the combination weighting method,which combines the subjective weighting method(the analytic hierarchy process method) and the objective weighting method(the entropy method),was used for weight calculation.This method avoids not only the subjectivity of the subjective weighting method,but also the absolute objectivity of the objective weighting method.The method was used to calculate the weights of indices of the health evaluation index system for the Yongding River in the Haihe Basin and to evaluate the influences of the indices on the river's health.The research results show that the weights of the indices obtained by the combination weighting method,compared with a single weight that is unilateral,are more reasonable and scientific,and applicable to actual conditions,indicating that the proposed method plays a practical role in river health evaluation.

DOI

[20]
Wang Guogang, Liu Yansui, Li Yurui et al., 2015. Dynamic trends and driving forces of land use intensification of cultivated land in China.Journal of Geographical Sciences, 25(1): 45-57.The aim of this study is to establish several important factors representing land use intensification in cultivated land (denoted by CII), using a multi-dimensional approach to achieve realistic and practical cultivated land use policies in China. For this reason, the theoretical framework was first built to explain the changes of land use intensification in the cultivated land, and then the variables and index were further developed for the purpose of characterizing the dynamic trends and driving forces of the land use intensification in the cultivated land at the provincial level. The study results indicate that the extent of CII significantly increased during the period of 1996 to 2008, due to the extensive use of fertilizers, machinery and pesticide, increased labor and capital input, and intensified land use. Moreover, the principal component regression results show that the productivity of cultivated land, economic benefits of cultivated land, labor productivity, and land use conversion are the main factors affecting the village development. The first three factors play a positive role, while the last one has a negative effect on the land use intensification in the cultivated land. According to these results, the main policies for sustainable intensification in cultivated land are proposed. First, the sustainable pathways for intensification should be adopted to reduce the unsustainable uses of chemical fertilizer, agricultural chemicals, etc. Second, the conditions for agricultural production should be further improved to increase the cultivated land productivity. Third, it is very necessary and helpful for improving labor productivity and land use efficiency from the viewpoint of accelerated the cultivated land circulation. The last step is to positively affect the production activities of peasants by means of reforming the subsidy standards.

DOI

[21]
Wang Jinfeng, Hu Yi, 2012. Environmental health risk detection with GeogDetector.Environmental Modelling & Software, 33(7): 114-115.Human health is affected by many environmental factors. Geographical detector is software based on spatial variation analysis of the geographical strata of variables to assess the environmental risks to human health: the risk detector indicates where the risk areas are; the factor detector identifies which factors are responsible for the risk; the ecological detector discloses the relative importance of the factors; and the interaction detector reveals whether the risk factors interact or lead independently to disease.

DOI

[22]
Wang Jinfeng, Li Xinhu, Christakos G et al., 2010. Geographical detectors-based health risk assessment and its application in the neural tube defects study of the Heshun Region, China.International Journal of Geographical Information Science, 24(1): 107-127.Physical environment, man‐made pollution, nutrition and their mutual interactions can be major causes of human diseases. These disease determinants have distinct spatial distributions across geographical units, so that their adequate study involves the investigation of the associated geographical strata. We propose four geographical detectors based on spatial variation analysis of the geographical strata to assess the environmental risks of health: the risk detector indicates where the risk areas are; the factor detector identifies factors that are responsible for the risk; the ecological detector discloses relative importance between the factors; and the interaction detector reveals whether the risk factors interact or lead to disease independently. In a real‐world study, the primary physical environment (watershed, lithozone and soil) was found to strongly control the neural tube defects (NTD) occurrences in the Heshun region (China). Basic nutrition (food) was found to be more important than man‐made pollution (chemical fertilizer) in the control of the spatial NTD pattern. Ancient materials released from geological faults and subsequently spread along slopes dramatically increase the NTD risk. These findings constitute valuable input to disease intervention strategies in the region of interest.

DOI

[23]
Wu Dafu, Gao Wangsheng, Chen Hongwei et al., 2000. Unity of opposites of agriculture between intensity and sustainability in Huang-Huai-Hai Plain.Research of Agricultural Modernization, 21(3): 134-137. (in Chinese)The intensive agriculture would be needed to input much more materials and resources.On the other hand,the agricultural sustainability should be stressed on the environment and resources protection.Otherwise,high yields and sustainability are always primary goal of agriculture in China.Obviously,they are a pair of contradictory.Took Jingxian County as a case in this paper.The unity and opposites of agricultural intensity and sustainability was researched.Then put out technological countermeasure that brought line with the opposites of agricultural intensity and sustainability in Huang-huai-hai Plain.

[24]
Wu Yuling, Feng Zhonglei, Zhou Yong et al., 2011. Co-integration analysis on driving factors of intensive cultivated land use based on perspective of farmers: A case study of Hubei Province.China Population, Resources and Environment, 21(11): 67-72. (in Chinese)Actually,the intensive degree of cultivated land use is the direct result of farmer's different farming practices which are taken in different economic and institutional environment.So,this paper tries to analyze the effects of those factors influencing farming households' farming practices on intensive cultivated land use.Taking Hubei Province as an example,by using co-integration theory and error correction model,the paper analyzes both the long-term equilibrium and the short-term fluctuation relationships between intensive cultivated land use and its influencing factors.The results show that: in the long run,the average number of one household's agricultural labor,agricultural comparative income and cultivated land property rights security have positive influences on intensive cultivated land use.When each of these factors increase 1% percentage point,the intensive degrees of cultivated land use will respectively increase 0.166%銆0.430% and 0.035% percentage points.Moreover,the peasant family's per capita agricultural production expenditure and the price indices of agricultural means of production have negative impacts on intensive cultivated land use.When each of these factors increases 1% percentage point,the intensive degrees of cultivated land use will respectively decrease 0.004% and 0.008%.In the short term,all factors mentioned above have the same influence direction but different influence sizes on intensive cultivated land use.Furthermore,the short-term and long-term effects of the average number of one household's agricultural labor and agricultural comparative income on intensive cultivated land use are similar.However,the long-term effects of cultivated land property rights security and agricultural production costs on intensive cultivated land use are more evident.Therefore,the agricultural policy guidance emphasizing stable property rights and reducing agricultural production costs is more conducive to protecting cultivated land and enhancing the allocation and utilization efficiency of cultivated land in the long term.

[25]
Wu Yuling, Gu Xiang, Zhou Yong, 2012. Factors analysis on intensive use of cultivated land from the viewpoint of farmers in Hubei Province.China Land Sciences, 26(2): 50-55. (in Chinese)The aim of this article is to find the way to promote the intensity of cultivated land use by analyzing the impact factors of intensively use of cultivated land through the perspective of farmers in Hubei province.It further severs a new research viewpoint for improving land allocation and use efficiency in China.Method of dual-log function analysis was employed.The result showed that 1)the factors,such as number of labor per household,net income per capita and comparative revenue from agriculture,had positive effects on enhancing the intensity of cultivated land use;2)price index of agricultural production had a negative impact on intensive cultivated land use;3)the property rights and agricultural subsidies were not significant.The paper therefore argued that in order to improve the intensity of cultivated land use it was important to take measures to promote the incentive of agricultural production,to increase the agricultural revenue,to control the prices of agricultural production materials,to deepen the reform of property rights and to ameliorate the agricultural subsidies.

[26]
Xie Hualin, He Yafen, Zou Jinlang et al., 2016. Spatio-temporal difference analysis of cultivated land use intensity based on emergy in the Poyang Lake Eco-economic Zone of China.Journal of Geographical Sciences, 26(10): 1412-1430.Taking the emergy requirements of the five input indexes as the foundation, this paper analyzes the total temporal and spatial changes in cultivated land use intensity in the Poyang Lake Eco-economic Zone from 2000 to 2010. The results are obtained as follows: (1) Over a period of 10 years, the cultivated land use intensity has increased exponentially in the Poyang Lake Eco-economic Zone; agricultural machinery intensity has been the largest proportion of the total inputs, comprising more than 99.50% and increasing year by year, which indicates that agricultural mechanization is a basic trend in agricultural development in the Poyang Lake Eco-economic Zone. (2) The total number of counties belonging to the moderate- and low- intensity cultivated land use categories is the largest, while the number of counties belonging to the high-intensity cultivated land use and extensive cultivated land use categories is the smallest. (3) This zone can be divided into five areas: an eastern area of high-intensity cultivated land use, a central and eastern area of low-intensity cultivated land use, a central area of low-intensity cultivated land use, a southern area of moderate-intensity cultivated land use, and a northern area of moderate-intensity cultivated land use. (4) The counties which had a coordinated development between cultivated land use intensity and their socio-economic development level increase year by year, and the socio-economic development level had increasingly obvious effects on the cultivated land use intensity. Finally, this paper presents suggestions for the development of cultivated land use intensity in the Poyang Lake Eco-economic Zone, especially for different levels of intensity among counties.

DOI

[27]
Yao Chengsheng, Huang Lin, Xi et al., 2014. Temporal and spatial change of cultivated land use intensity in China based on energy theory.Transactions of the Chinese Society of Agricultural Engineering, 30(8): 1-12. (in Chinese)Limited cultivated land has become one of the major restrictions for China's social and economic development, and how to use it intensively is the focus of the Chinese government and research scholars. Based on emergy theory and methods, the cultivated land use intensity(I) was composed of production factors intensity(P) and multiples the multiple cropping index(M). On this basis, the paper analyzed the temporal and spatial change law of all the five production factor intensities, which are farm machinery, fertilizer, pesticide, agricultural film and labor, and the multiple cropping index in China from 1990 to 2011. The results showed: Firstly, during the past 22 years, the farm machinery intensity, fertilizer intensity, pesticide intensity, and agricultural film intensity were all in a linear growth trend, and their annual growth rates were 6.59%, 2.89%, 3.88% and 7.42% respectively; while the labor intensity was in a linear decreasing trend, and its decreasing rate was 5.10 percent. In 1996, the possession of industrial supplementary energy intensity, including farm machinery, fertilizer, pesticide, and agricultural film, in the total production factors intensity first exceeded 50 percent, which meant that China had entered the modern agriculture stage in the middle of 1990s. During the study period, multiple cropping index was also in a linear growth, and the annual growth rate is 0.79%; its total increasing rate was 0.1794 in the past 22 years, and was the major driving force of the increase of land use intensity. Secondly, in 1996, the provinces with high labor intensity and low development of modern agriculture were mainly located in the western part of China, and the typical characteristics of these provinces were that they were all rated with a relatively low level of social and economic development; While in the provinces with high development of economic levels and a good industrial foundation, the labor intensity was low and development of modern agriculture was high. From 1996 to 2008, most provinces in the western part of China and some of the coastal provinces in the eastern part of China, labor intensity decreased a lot; while in the provinces with high economic development and the provinces with more land and fewer persons, labor intensity decreased only a little. In the provinces with high economic development in the eastern coastal part of China and some major grain producing areas, industrial supplementary energy intensity increased a lot; In the provinces with high development of modern agriculture, industrial supplementary energy intensity increased only a little. Thirdly, from 1996 to 2008, in the major rice producing areas in southern part of China, the multiple cropping index decreased a lot, which was the major reason that contributed to the decreasing of their land use intensity; In most provinces in the northern part of China, the multiple cropping index increased a lot, which was the major reason that improved their land use intensity.

DOI

[28]
Yao Guanrong, Liu Guiying, Xie Hualin, 2014. Spatiotemporal difference and driving forces of input factors intensity for arable land-use in China.Journal of Natural Resources, 29(11): 1836-1848. (in Chinese)Based on the Theil index and an econometric model,this paper analyzed the spatiotemporal difference and driving forces of six input factors intensity of arable land-use in China.The results showed that:1) At the national scale,the labor intensity of arable land-use has decreased,while the remaining five input factors intensity showed a rising trend in China,and among them,agricultural fixed assets being of the highest growth rate.2) At the regional scale,the temporal pattern of six input factors intensity for arable land-use was in common with which at the national scale.In addition to the labor intensity which the central region was of the highest value,intensity of other five input factors were of the highest values in the eastern region,the central region took the second place and the northeast and west regions were of the lowest values.3) At provincial scale,there was two changing directions in labor intensity,while the intensity of fertilizer,pesticide and agricultural diesel oil decreased in Shanghai,Tianjin,Jiangsu and Shandong where are economically developed.4) The regional differences of six input factors intensity of arable land-use in China was evident and showed a narrowing trend.The differences of six input factors intensity of arable land-use between four major regions contributed more than differences within the region.5) Per capita annual net incomes of household operations and proportion of nonagricultural population had a significant positive correlation with inputs of fertilizer,agricultural investment in fixed assets,pesticide and agricultural plastic film.The proportion of nonagricultural industry had a significant positive correlation with fertilizer input.Agricultural policies promoted the inputs of fertilizer and agricultural investment in fixed assets.Finally,we suggest that there is an urgent need to focus on the structure of agricultural investment in fixed assets and its social,economic and ecological effects,as well as ecological impact of heavy application of fertilizer,pesticide and agricultural plastic film.In order to comprehensively promote the arable land-use intensity under the conditions of area constraints,the government should focus on improving per capita annual net incomes of household operations,meanwhile strengthening the agricultural support policies for less developed regions and major grain producing regions.

DOI

[29]
Zhang Lin, Zhang Fengrong, An Pingli et al., 2008. Comparative study of cultivated land use intensive degree and its change law at different economic levels.Transactions of the Chinese Society of Agricultural Engineering, 24(1): 108-112. (in Chinese)In the process of industrialization of China,the use of cultivated land has changed obviously,and the use intensive degree is diverse in different areas with different economic development levels.In this study,three typical agricultural regions with different economic levels were chosen to compare and analyze their use intensities of cultivated land during the period of 2000 to 2004.Results show that the order of intensive degree is accordant with the order of economic level which is Daxing Quzhou Wuchuan.The positive correlation between cultivated land use intensive degree and GDP is significant,which indicate that the intensive degree increased with the development of economy.At the same time,the internal structure of intensive degree changes with economic growth: the percentage of capital intensity goes up gradually while labor intensity goes down.It reflects the trend that capital input will gradually substitute labor input in the process of regional development.Moreover,planting structures also have close relationships with regional use intensive degree of cultivated land and the intensive degree for planting structure mainly of vegetables is higher than that mainly of field crops.

DOI

[30]
Zhang Xueliang, Kong Xiangbin, 2014. Cropland sustainable use impacted by groundwater depletion in China’s HHH plains.Chinese Land Sciences, 28(5): 90-96. (in Chinese)The purpose of this study is to calculate the average groundwater depletion rate of China's Huang-HuaiHai(HHH) plains, explore the driving force of the groundwater depletion and provide a decision basis for policy making to regulate the farmland use at the limit of exhausted water resource. Based on previous collection 266 groundwater depletion rate samples and 5 long-term monitoring cities, Kriging interpolations with ArcGIS are used to convert data into the magnitude of water depletion. Furthermore, spatial matching with ArcGIS is used to overlay the groundwater depletion rate layer and cropland distribution layer within nine major agro-ecological regions. The results indicate that the groundwater in HHH plains is being depleted at a mean rate of 0.46 卤 0.37 m yr-1 for the shallow groundwater, and 1.14卤0.58 m yr-1 for deep groundwater. It has become the severest depression zone in the world since the 1980 s. The severity of groundwater depletion is attributed to dramatic increase in crop yields and total production in the HHH driven by intensive irrigation. According to the aquifer depletion extent, the HHH is grouped into four adjusting zones, i.e., agricultural-adjust zone, intensity-reduce zone, ecology-sustain zone, and potential-use zone. The paper concludes that the "fallowing land and exploit potentialities" should be the target of building farmland ecological and food security system. The virtual research provides a useful reference for the future farmland sustainable use policy making in China.

[31]
Zhao Bingqiang, Zhang Fusuo, Li Zengjia, 2001. Studies on the super-high yield characteristics of three intensive multiple cropping systems in Huanghuaihai area.Scientia Agricultura Sinica, 34(6): 649-655. (in Chinese)

[32]
Zhao Jing, Yang Gangqiao, 2010. Cannonical correlation analysis on the influencing factors of the change of cultivated land intensive use degree.China Population, Resources and Environment, 20(10): 103-108. (in Chinese)Change of cultivated land intensive use degree is related to food security and sustainable development of economy.This paper analyzes the change of cultivated land intensive use degree from 1990 to 2006 in China and its influencing factors using canonical correlation analysis.The results show that the intensity of cultivated land input fluctuated,the degree of land utilization fluctuated frequently and the efficiency of land use increased obviously from 1990 to 2006 in the whole country.GDP,rural labor wages,financial support of agriculture are the key factors influencing the intensity of cultivated land input;farmers' education level,the urbanization rate and per-capita area of cultivated land also affect the degree of cultivated land intensive use to some extent.Therefore,some policy recommendations put forward by this paper are as follows: coordinate economic development and cultivated land use,and promote sustainable development of society and economy and sustainable use of land resource by reasonably optimizing the structure of agricultural land use;improve the system of cultivated land transfer and surplus agricultural labor flow,and promote the scale and mechanization of food production;raise the education level of farmers,strengthen farmers' agricultural production ability using advanced science and technology;ensure national food security by further increasing policy support for food production,improve agricultural production environment and promote cultivated land intensive use degree.

DOI

[33]
Zhu Huiyi, Li Xiubin, Xin Liangjie, 2007. Intensity change in cultivated land use in China and its policy implications.Journal of Natural Resources, 22(6): 907-915. (in Chinese)The area of cultivated land in China decreased from 35 104ha/yr(1980-1996) to 98 104ha/yr(1997-2005),resulted from rapid economic development following the 1978 reforms.In response to the growing demand of society for grain products,intensification has become the overwhelming choice in cultivated land use.But this choice came into conflict with farmers' pursuance in recent years,as the grain production is declining in importance for farmers with market economic improvement.Has the cultivated land use been intensive or extensive in the conflict between social interests and individual interest.How to release the conflict if extensive trend exists. The intensity changes in cultivated land use were discussed firstly on country scale.Increase of multi-cropping index(MCI) during 1952-2005 implied the intensification in cultivated land use in this period.But the sown area of grain decreased from 113787000hm2 in 1998 to 99410000ha in 2003 and 104278000ha in 2005.Meanwhile,the grain yield per unit-sown area had a reduction from 4502kg/ha in 1998 to 4332kg/ha in 2003,and then went up to 4642kg/ha in 2005.The downward trend of grain sown area and grain yield per sown-unit area during 1998-2003,revealed input reduction of cultivated land,expense and labor in grain production.The rise in 2004-2005 can be ascribed to the implement of new agriculture policy.Those facts mean that lower incentive for raising cultivated land use intensity already threatens grain production in China. On regional scale,the intensity in cultivated land use varied across provinces.MCI decreased in regional disparity in Beijing,Shanghai,Tianjin,Zhejiang,Fujian,Jiangxi,Hubei and Guangdong during 1996-2003.Furthermore,these provinces reduced their grain sown area synchronously.Other provinces that reduced their grain sown area included Hebei,Shanxi,Inner Mongolia,Liaoning,Jiangsu,Shangdong,Henan,Hunan,Guangxi,Hainan,Sichuan,Shaanxi,Gansu,Qinghai,and Xinjiang.Except for input reduction of cultivated land in grain production,input of labor and expense declined in some of the above regions till 2005. Farmer's pursuance change is at the root of the intensity change in cultivated land use.It had turned from maximizing the output of land to maximizing the income of labor force with the development of market economy.In order to achieve the goal of national food security,relevant policies and measures should be further taken to alleviate the conflict between the nation's goal and farmers' goal of maximizing their interests.These policies and measures should speed up the flow of cultivated land between farmers and encourage farmers to extend their farm scale with higher technological level.

Outlines

/