
Journal of Geographical Sciences >
Modeling the spatio-temporal changes in land uses and its impacts on ecosystem services in Northeast China over 2000-2050
Author: Xia Tian (1981-), Associate Professor, specialized in remote sensing monitoring and simulation of the influence of global changes on agriculture. E-mail: xiatian@mail.ccnu.edu.cn
Received date: 2017-03-13
Accepted date: 2017-09-12
Online published: 2018-11-20
Supported by
Agricultural Outstanding Talents Research Foundation of Ministry of Agriculture (MOA)
Key Laboratory of Agri-Informatics Foundation of MOA No.2015001
Natural Science Foundation of Hubei Province No.2016CFB558
The Fundamental Research Funds for the Central Universities, No.CCNU15A05058
Copyright
Land use and its dynamics have attracted considerable scientific attention for their significant ecological and socioeconomic implications. Many studies have investigated the past changes in land use, but efforts exploring the potential changes in land use and implications under future scenarios are still lacking. Here we simulate the future land use changes and their impacts on ecosystem services in Northeast China (NEC) over the period of 2000-2050 using the CLUE-S (Conversion of Land Use and its Effects at Small regional extent) model under the scenarios of ecological security (ESS), food security (FSS) and comprehensive development (CDS). The model was validated against remote sensing data in 2005. Overall, the accuracy of the CLUE-S model was evaluated at 82.5%. Obtained results show that future cropland changes mainly occur in the Songnen Plain and the Liaohe Plain, forest and grassland changes are concentrated in the southern Lesser Khingan Mountains and the western Changbai Mountains, while the Sanjiang Plain will witness major changes of the wetlands. Our results also show that even though CDS is defined based on the goals of the regional development plan, the ecological service value (ESV) under CDS is RMB 2656.18 billion in 2050. The ESV of CDS is lower compared with the other scenarios. Thus, CDS is not an optimum scenario for eco-environmental protection, especially for the wetlands, which should be given higher priority for future development. The issue of coordination is also critical in future development. The results can help to assist structural adjustments for agriculture and to guide policy interventions in NEC.
Key words: Northeast China; land use; spatio-temporal change; scenario; ecosystem service
XIA Tian , WU Wenbin , ZHOU Qingbo , TAN Wenxia , Peter H. VERBURG , YANG Peng , YE Liming . Modeling the spatio-temporal changes in land uses and its impacts on ecosystem services in Northeast China over 2000-2050[J]. Journal of Geographical Sciences, 2018 , 28(11) : 1611 -1625 . DOI: 10.1007/s11442-018-1532-7
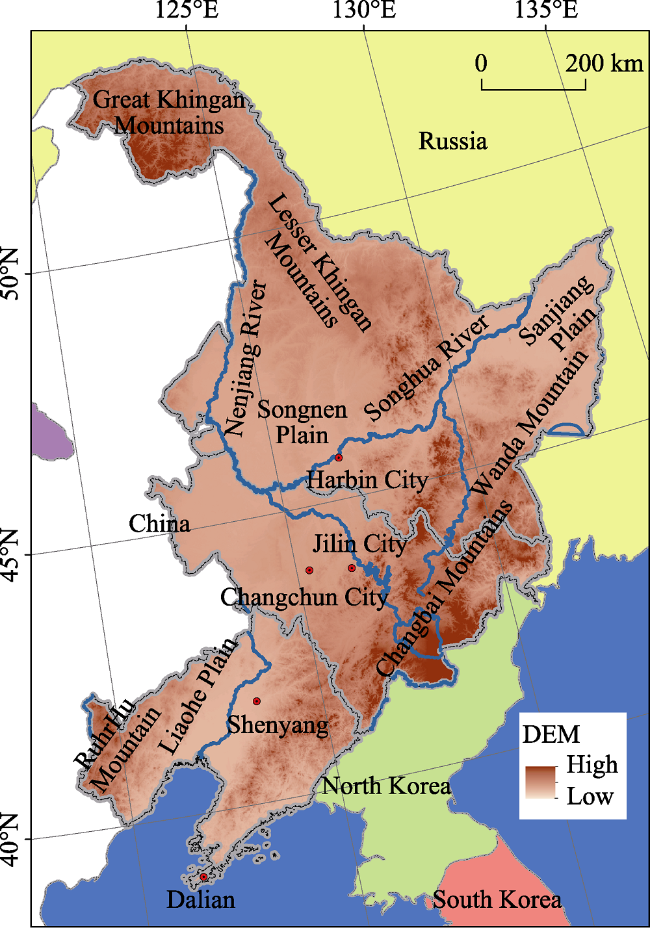
Figure 1 Map of Northeast China |
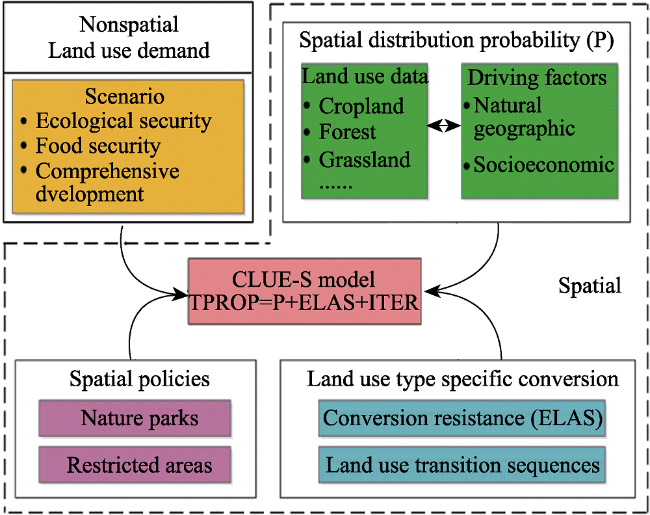
Figure 2 CLUE-S model structure |
Table 1 Parameter settings of ELAS |
| Land use type | Cropland | Forest | Grassland | Water body | Built-up | Wetland | Unused land |
|---|---|---|---|---|---|---|---|
| ELAS | 0.6 | 0.8 | 0.5 | 0.9 | 0.9 | 0.7 | 0.4 |
Table 2 Equivalent value per unit area of ecosystem services in NEC |
| Level 1 | Level 2 | Cropland | Forest | Grassland | Water body | Wetland | Unused land |
|---|---|---|---|---|---|---|---|
| Supply services | Food production | 1.00 | 0.33 | 0.43 | 0.53 | 0.36 | 0.02 |
| Production of materials | 0.39 | 2.98 | 0.36 | 0.35 | 0.24 | 0.04 | |
| Regulating services | Gas release regulation | 0.72 | 4.32 | 1.50 | 0.51 | 2.41 | 0.06 |
| Climate regulation | 0.97 | 4.07 | 1.56 | 2.06 | 13.55 | 0.13 | |
| Hydrological adjustment | 0.77 | 4.09 | 1.52 | 18.77 | 13.44 | 0.07 | |
| Waste treatment | 1.39 | 1.72 | 1.32 | 14.85 | 14.4 | 0.26 | |
| Cultural services | Provide aesthetic landscape | 0.17 | 2.08 | 0.87 | 4.44 | 4.69 | 0.24 |
| Support services | Improve soil integrity | 1.47 | 4.02 | 2.24 | 0.41 | 1.99 | 0.17 |
| Maintain biodiversity | 1.02 | 4.51 | 1.87 | 3.43 | 3.69 | 0.40 |
Table 3 Annual change rate of the area of each land use type under different scenarios (%) |
| Cropland | Forest | Grassland | Water body | Built-up | Wetland | Unused land | |
|---|---|---|---|---|---|---|---|
| ESS | -0.30 | 0.25 | 0.30 | 0.25 | 0.25 | 0.30 | -0.75 |
| FSS | 0.25 | -0.05 | -1.50 | 0.25 | 0.25 | -0.85 | -2.5 |
| CDS | 0.03 | 0.02 | -0.30 | 0.01 | 0.25 | -0.85 | -0.75 |
Table 4 Type and source of data |
| Data type | Data name | Data format | Description and source |
|---|---|---|---|
| Land use | Land use basic data | Grid | Land use resources in seven types of basic data type of land use, spatial resolution of 1 km |
| Biophysical | DEM | Grid | Institute of Geographic Sciences, CAS, spatial resolution of 1 km |
| Years of average temperature distribution map | Grid | The national meteorological data compilation, spatial resolution of 500 m | |
| Years of average rainfall distribution map | Grid | The national meteorological data compilation, spatial resolution of 1 km | |
| Years of average≥0°C accumulated temperature distribution map | Grid | The national meteorological data compilation, spatial resolution of 500 m | |
| Years of average of ≥10°C accumulated temperature distribution map | Grid | The national meteorological data compilation, spatial resolution of 500 m | |
| Soil map | Grid | FAO soil classification | |
| Level 1-3 traffic network distribution map | Vector | The national fundamental geographic information data | |
| Level 1-3 river water distribution map | Vector | The national fundamental geographic information data | |
| Town centers | Vector | The national fundamental geographic information data | |
| Socio-economic | Demographic distribution map | Grid | Institute of Geographic Sciences, CAS, 1 km grid population: people/km2 |
| GDP distribution diagram | Grid | Institute of Geographic Sciences, CAS, 1 km grid GDP unit: million RMB/km2 | |
| Statistical | Area of each land type for 2000-2010 | Text | China Statistical Yearbooks |
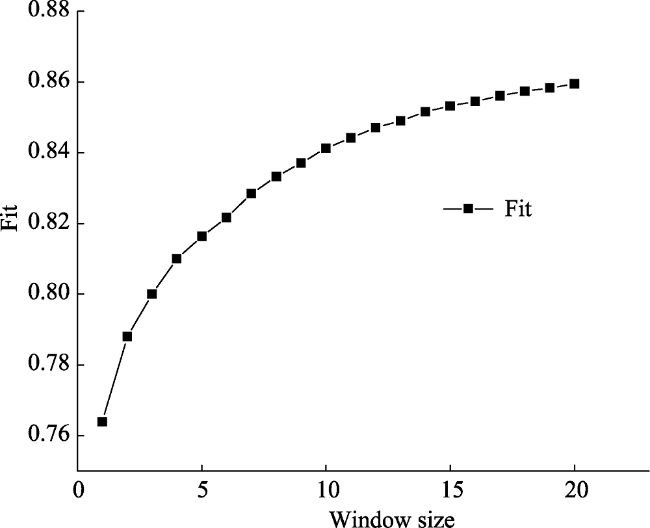
Figure 3 Multiscale simulation test validation |
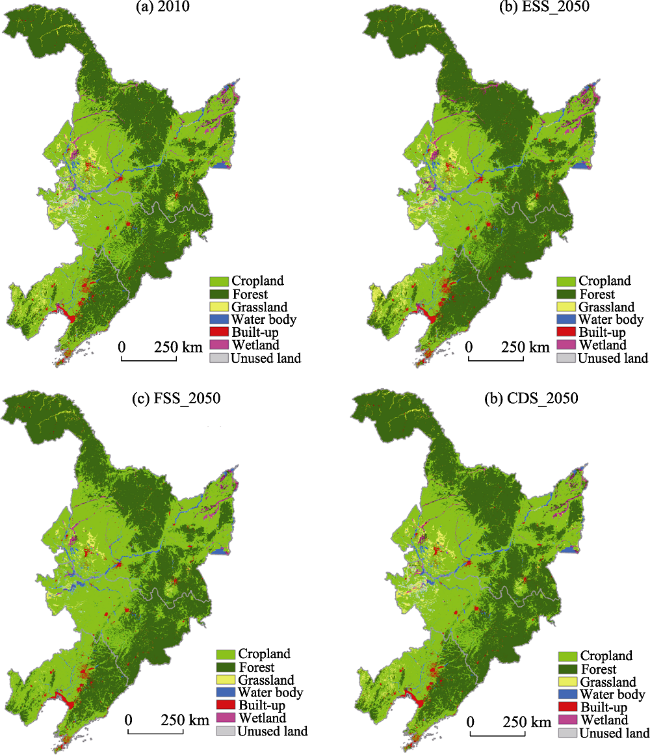
Figure 4 The three scenarios of land use patterns of Northeast China in 2050 |
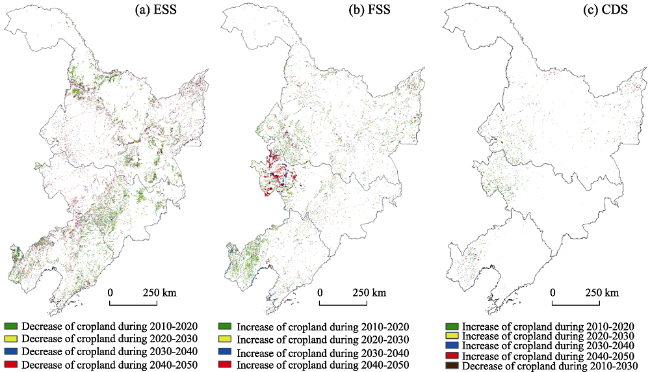
Figure 5 The three scenarios (ESS: Ecological security scenario; FSS: Food security scenario; CDS: Comprehensive development scenario) of cropland conversion in Northeast China in 2010-2050 |
Table 5 Cropland and other land use conversion types in the three scenarios (km2) |
| Forest into cropland | Cropland into forest | Grassland into cropland | Cropland into grassland | Water body into cropland | Cropland into water body | Built-up into cropland | Cropland into built-up | Unused land into cropland | Cropland into unused land | Wetland into cropland | Cropland into wetland | ||
|---|---|---|---|---|---|---|---|---|---|---|---|---|---|
| ESS | 2010-2020 | 1005 | 956 | 452 | 481 | 141 | |||||||
| 2020-2030 | 9959 | 668 | 451 | 515 | 369 | ||||||||
| 2030-2040 | 9147 | 1352 | 525 | 504 | 458 | ||||||||
| 2040-2050 | 9044 | 1359 | 522 | 523 | 545 | ||||||||
| FSS | 2010-2020 | 1449 | 4667 | 14 | 1280 | 612 | |||||||
| 2020-2030 | 1493 | 4363 | 444 | 688 | 1001 | ||||||||
| 2030-2040 | 1626 | 3621 | 272 | 1511 | 973 | ||||||||
| 2040-2050 | 1581 | 3750 | 161 | 1509 | 982 | ||||||||
| CDS | 2010-2020 | 570 | 5 | 519 | |||||||||
| 2020-2030 | 501 | 5 | 346 | 110 | |||||||||
| 2030-2040 | 495 | 230 | 313 | ||||||||||
| 2040-2050 | 469 | 32 | 82 | 351 |
Notes: ESS: Ecological security scenario; FSS: Food security scenario; CDS: Comprehensive development scenario |
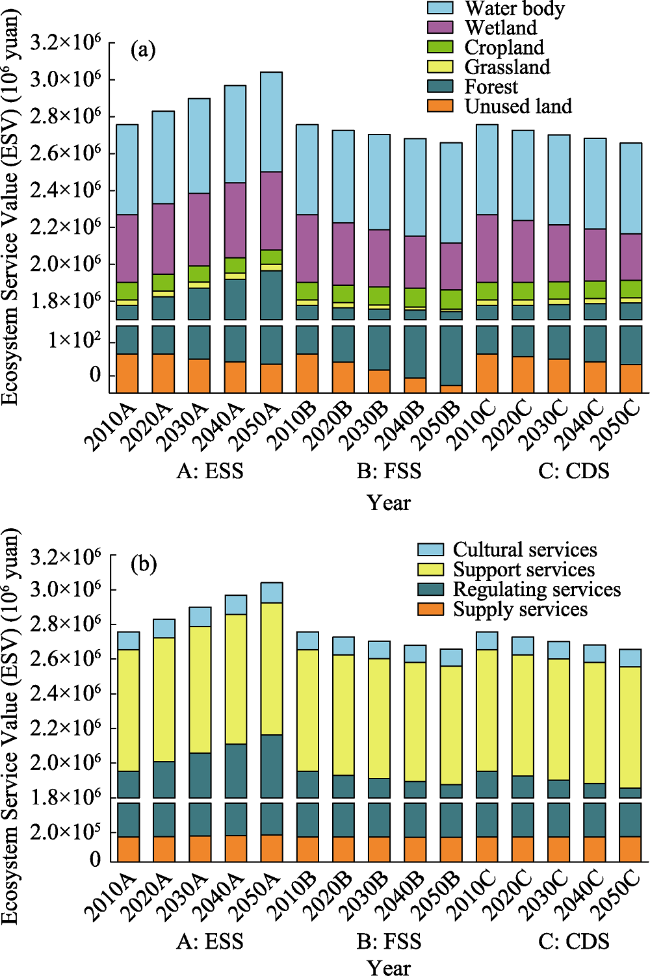
Figure 6 Different scenarios of ESV in 2010-2050 |
The authors have declared that no competing interests exist.
| [1] |
|
| [2] |
|
| [3] |
|
| [4] |
|
| [5] |
|
| [6] |
|
| [7] |
|
| [8] |
|
| [9] |
|
| [10] |
|
| [11] |
|
| [12] |
|
| [13] |
|
| [14] |
|
| [15] |
|
| [16] |
|
| [17] |
|
| [18] |
|
| [19] |
|
| [20] |
|
| [21] |
|
| [22] |
|
| [23] |
|
| [24] |
|
| [25] |
|
| [26] |
|
| [27] |
|
| [28] |
|
| [29] |
|
| [30] |
|
| [31] |
|
| [32] |
|
| [33] |
|
| [34] |
|
| [35] |
|
| [36] |
|
| [37] |
|
| [38] |
|
| [39] |
|
| [40] |
|
| [41] |
|
/
| 〈 |
|
〉 |