Special Issue: Land system dynamics: Pattern and process

The changing patterns of cropland conversion to built-up land in China from 1987 to 2010

  • JU Hongrun , 1, 2, 3, 4 ,
  • ZHANG Zengxiang 1 ,
  • ZHAO Xiaoli 1 ,
  • WANG Xiao 1 ,
  • WU Wenbin 5 ,
  • YI Ling 1 ,
  • WEN Qingke 1 ,
  • LIU Fang 1 ,
  • XU Jinyong 1 ,
  • HU Shunguang 1 ,
  • ZUO Lijun , 1, *
Expand
  • 1. Institute of Remote Sensing and Digital Earth, CAS, Beijing 100101, China
  • 2. School of Tourism and Geography Science, Qingdao University, Qingdao 266071, Shandong, China
  • 3. Department of Geography, University of California Santa Barbara, Santa Barbara, CA 93106, USA
  • 4. University of Chinese Academy of Sciences, Beijing 100049, China
  • 5. Key Laboratory of Agri-informatics, Ministry of Agriculture/Institute of Agricultural Resources and Regional Planning, Chinese Academy of Agricultural Sciences, Beijing 100081, China
*Corresponding author: Zuo Lijun, Associate Professor, E-mail:

Author: Ju Hongrun (1990-), PhD, specialized in land use and GIS. E-mail:

Received date: 2017-06-30

  Accepted date: 2017-09-12

  Online published: 2018-11-20

Supported by

National Major Science and Technology Program for Water Pollution Control and Treatment, No.2017ZX07101001

Copyright

Journal of Geographical Sciences, All Rights Reserved

Abstract

Over the past few decades, built-up land in China has increasingly expanded with rapid urbanization, industrialization and rural settlements construction. The expansions encroached upon a large amount of cropland, placing great challenges on national food security. Although the impacts of urban expansion on cropland have been intensively illustrated, few attentions have been paid to differentiating the effects of growing urban areas, rural settlements, and industrial/transportation land. To fill this gap and offer comprehensive implications on framing policies for cropland protection, this study investigates and compares the spatio-temporal patterns of cropland conversion to urban areas, rural settlements, and industrial/transportation land from 1987 to 2010, based on land use maps interpreted from remote sensing imagery. Five indicators were developed to analyze the impacts of built-up land expansion on cropland in China. We find that 42,822 km2 of cropland were converted into built-up land in China, accounting for 43.8% of total cropland loss during 1987-2010. Urban growth showed a greater impact on cropland loss than the expansion of rural settlements and the expansion of industrial/transportation land after 2000. The contribution of rural settlement expansion decreased; however, rural settlement saw the highest percentage of traditional cropland loss which is generally in high quality. The contribution of industrial/transportation land expansion increased dramatically and was mainly distributed in major food production regions. These changes were closely related to the economic restructuring, urban-rural transformation and government policies in China. Future cropland conservation should focus on not only finding a reasonable urbanization mode, but also solving the “hollowing village” problem and balancing the industrial transformations.

Cite this article

JU Hongrun , ZHANG Zengxiang , ZHAO Xiaoli , WANG Xiao , WU Wenbin , YI Ling , WEN Qingke , LIU Fang , XU Jinyong , HU Shunguang , ZUO Lijun . The changing patterns of cropland conversion to built-up land in China from 1987 to 2010[J]. Journal of Geographical Sciences, 2018 , 28(11) : 1595 -1610 . DOI: 10.1007/s11442-018-1531-8

1 Introduction

As the largest developing country in the world, China has experienced rapid economic development and broad scale urbanization and industrialization over the last decades, especially since the implementation of the reform and opening-up policy in 1978 (Longley, 2002). Along with these changes, land resources and the structure of land use in China have undergone profound changes. Perhaps the most notable land use change is the loss of large areas of cropland. The fast decline of cropland is due to the combined effects of rapid economic development, population growth, urbanization, agricultural restructuring, ecological policies, natural disasters and land degradation (Yang and Li, 2000; Ding, 2003; Tan et al., 2005). Among these factors, the demand for built-up land has placed growing pressure on the remaining available cropland resources. According to monitoring data from the Ministry of Land and Resources of China, the proportion of cropland lost to built-up land among the total cropland loss of China continuously increased in the 2000s. The expansion of built-up land also affected the quality of cropland in China due to the fact that cropland located at the urban and rural settlement fringes was generally in good condition and so could produce more food. According to a quality grade survey of cropland in China, the average quality grade of the lost cropland was 8.60, while that of newly added cropland was 9.88 in 2014 (quality grade 1 being the best quality and 15 the worst). The quick depletion and degradation of agricultural land resources is intrinsically linked to food insecurity, as well as to the livelihoods of millions of rural people across the country (Qin, 2010; Liu et al., 2015; d’Amour et al., 2017).
With its rapid economic development, China has experienced a rate of urban growth almost unparalleled in history. In 2011, the proportion of China’s population living in urban areas reached 51.27% surpassing the agricultural population (NBSC, 2011). The conflict between the loss of arable land and urban development has attracted the special attention of many scholars worldwide (Anderson and Yang, 1998; Boland, 2000; She and Xie, 2000; Tania et al., 2001; Cai et al., 2002). In previous research, urban land was usually defined by impervious surfaces and other manifestation of the built environment (Seto et al., 2011), including both settlements and industrial/transportation land, as these classes are easy to extract from satellite images with automatic classification methods (Yeh and Li, 1999; Seto et al., 2011; Pandey and Seto, 2015). Industrial land is that used for the manufacturing and processing of commodities, while transportation is land in roads, pipelines, airports, railways and transportation storage facilities such as warehouses and shipping yards. With the further rapid development of industrialization and the movement of industries from the coastal cities and regions to the vast areas of inland China, more land will be needed by factories, quarries, mining, oil-field development and transportation. The industrial/transportation land expansion could become more significant drivers of cropland loss. It is worthwhile investigating the patterns of cropland lost to urban areas and to industrial/transportation land separately, before cropland protection strategies are designed and proposed.
When the increasing urban-rural disparities began to endanger socioeconomic stability, the Chinese government began to promote rural development by creating policies that favored rural areas to intensify the mutual linkages between cities and the countryside (Tu and Long, 2017). The rural collectives and their members have strong incentives to engage in farmland conversion activities in order to capture a share of profits from land conversion (Wang and Scott, 2008). Moreover, croplands in rural areas are always close to rural settlements in China (Xie et al., 2017), highlighting the potential vulnerability of agricultural land in rural areas to the expansion of rural settlements. Indeed, more cultivated land in southern Jiangsu was converted to rural settlements than to urban areas during 1990-2006 (Long et al., 2009; Liu et al., 2010). How these different types of built-up land place pressure on cropland is a question worth answering for the sake of framing more specific land management policies.
In this research, we investigated how the expansion of the three different built-up land types (urban, rural settlement, and industrial/transportation land) encroached on China’s cropland from 1987 to 2010. Based on land use change data visually interpreted from remote sensing images, we illustrated the spatio-temporal patterns of the speed and the structure of cropland conversion to built-up land. We further quantitatively measured the influence of different built-up land on cropland loss from three aspects: the contribution of built-up land expansion to cropland loss, the dependence of built-up land expansion on cropland loss and the conversion’s impacts on cropland quality. Finally, we discussed the drivers of the cropland conversion to built-up land and the implications on future cropland use. The research on investigating the individual effect of different types of built-up land on cropland loss is of great importance, since it helps understand the explicit drivers of massive cropland loss. By comparing the patterns of the different kinds of conversion and exploring the embodied drivers, we may highlight the risks of cropland loss in the future and develop precise suggestions on protecting cropland from this type of land use change.

2 Data and methods

2.1 Land use data

The spatio-temporal data revealing cropland lost to built-up land were obtained from the China Land Use Dataset at 1:100,000 scale established by the Chinese Academy of Sciences. It was visually interpreted by experts using medium resolution satellite images including Landsat MSS/TM/ETM, the China-Brazil Earth Resources Satellite (CBERS) and HJ-1A from the late 1980s (In the remainder of this paper, the year of 1987 was used to represent the period of the late 1980s, because images obtained in 1987 were the major sources for the land use interpretation for this period), 1995, 2000, 2005 and 2010. Landsat data were the main data source, and CBERS and HJ data were only used where no qualified or cloud free Landsat data were available. Field investigation was applied to verify the accuracy of the dataset, and the overall classification accuracy was above 90% (Zhang et al., 2014). The built-up land and cropland data used in this study were resampled to a raster format with a spatial resolution of 100 m. It was converted from the original vector format by attributing each grid cell to the land type with the largest area within the cell.
A hierarchical land use classification system with six first level types and 25 second level types was adopted. The first level types included cropland, woodland, grassland, water bodies, built-up land and unused land. The cropland comprised two second level types of paddy and dry land, while the built-up land comprised three second level types of urban, rural settlement and industrial/transportation land. The cropland in this database included permanently cultivated land, newly cultivated land, fallow, and grassland farming with crop rotation land. It also included intercropping land such as crop-fruit, crop-mulberry, and crop-forest land in which the crop was the dominant species (Liu et al., 2005). Urban referred to land used for urban settlement, with a largely continuous area covered by urban construction and city facilities. Rural settlement referred to land used for village settlements, while industrial/transportation land referred to land used for factories, quarries, mining, oil-fields outside cities and land for transportation uses, such as railroads, pipelines, highways and airports (Zhang et al., 2014).

2.2 Methods

We developed five indicators to understand the process of the conversion from cropland to built-up land. We illustrated the spatio-temporal patterns of the conversion from two aspects: the speed of cropland lost to built-up land (SCBi) and the proportion of cropland loss to each type of built-up land in total area of cropland converted into built-up land (PCBi). The impacts of built-up land expansion on cropland loss were measured by three indicators: the contribution of built-up land expansion to cropland loss (Ccropi), the dependence of built-up land expansion on cropland loss (Dcropi), and the impact of built-up land expansion on cropland quality (Tcropi). The relationships between these indicators are shown in Figure 1. Databases of built-up land and cropland for 1987, 1995, 2000, 2005 and 2010 were created in ESRI’s ArcView geographic information system (GIS) software to compute these indicators.
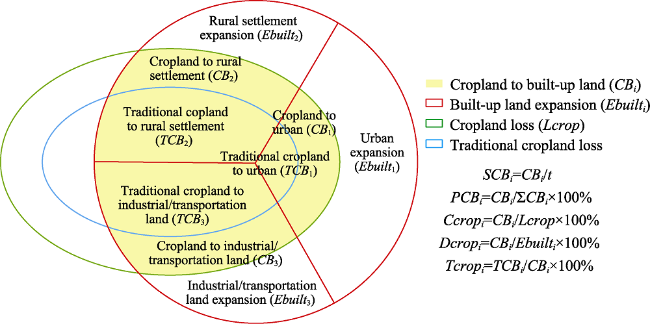
Figure 1 The relationship between built-up land expansion and cropland loss
To explicitly describe the spatial patterns of cropland conversion to built-up land and the impacts of this conversion on cropland loss, we adopted the “comprehensive agricultural zonation of China” to analyze the spatial variation by regions (NCAR, 1981). The division of the regions is based primarily on their agriculture production and geographic features. These regions include Northeast agriculture and forestry region; Inner Mongolia and along the Great Wall pastoral, agriculture and forestry region; Huang-Huai-Hai Plain agriculture region; Loess Plateau agriculture, forestry and pastoral region; Middle-Lower Yangtze River agriculture, forestry and aquaculture region; Southwest agriculture and forestry region; South China agriculture, forestry and tropical crops region; Gansu-Xinjiang agriculture, forestry and pastoral region; and Qinghai-Tibet Plateau pastoral, agriculture and forestry region (Figure 2). Among these regions, Qinghai-Tibet region has the smallest amount of cropland which was distributed sparsely. The Northeast region, the Huang-Huai-Hai Plain region, the north part of the Middle-Lower Yangtze River region and the central part of the Southwest region has a large amount of cropland clustered in a large continuous area. By contrast, the cropland in southern part of the Southwest region, the southern part of the Middle-Lower Yangtze River region, and the South China region is fragmentedly distributed.
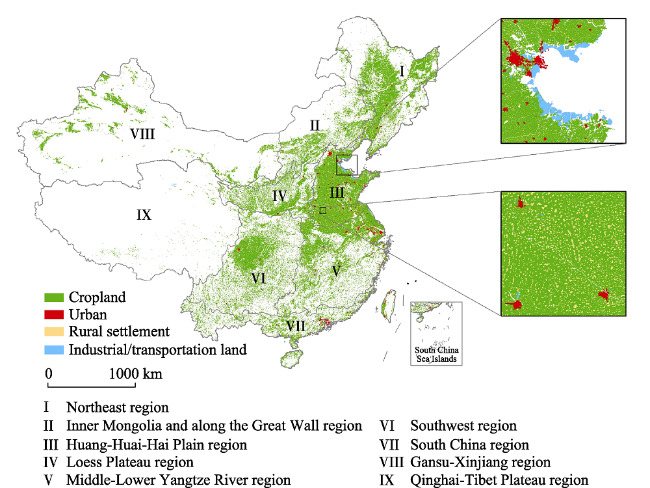
Figure 2 Distribution of cropland and built-up land and the agricultural regions in China in 2010
2.2.1 Methodology for measuring the patterns of cropland lost to built-up land
For temporal patterns, we used the annual area of cropland converted into built-up land (the speed of conversion) to illustrate the quantity, while the percentage of cropland lost to each built-up land type in the cropland lost to total built-up land was used to measure the proportion change.
The speed of cropland lost to built-up land (SCBi) (Figure 1) was calculated as follows:
SCBi = CBi /t(1)
where CBi represents the area of cropland lost to built-up land type i. The area of cropland lost to built-up land was obtained by extracting the grids of cropland in the early period and the built-up land in the later period using GIS overlay analysis. Built-up land type i includes urban, rural settlement, industrial/transportation land and built-up land. SCBi was calculated for four periods: 1987-1995, 1995-2000, 2000-2005, and 2005-2010. The value of t was 8 for the period of 1987-1995 and was 5 for the other periods. The larger the SCBi, the faster the built-up land use type i encroached on the cropland.
The proportion of cropland lost to each built-up land type in cropland lost to total built-up land (PCBi) (Figure 1) was calculated as follows:
PCBi = CBi / ∑CBi × 100% (2)
where CBi means the same as in equation 1. Built-up land type i includes urban, rural
settlement and industrial/transportation land. PCBi was calculated for four periods: 1987-1995, 1995-2000, 2000-2005, and 2005-2010. The larger the PCBi, the more built-up land type i contributes to cropland loss.
For spatial pattern, we used conversion area from cropland to built-up land in each grid cell to illustrate the quantity, and the dominant built-up land type in each grid to illustrate the proportion. We employed a gridded zonal model with a 5-km resolution to facilitate the visualization of the land use change (Zuo et al., 2014). The map produced a spatial distribution of the two indicators, from which the spatial patterns of cropland lost to built-up land could be seen. First, we generated a standard grid frame in vector format using the FISHNET module in the ArcGIS software over the study area. Each cell of the grid was 5 km × 5 km. Then, we used the 25-km2 grid to intersect with the patches from the 100 m data to obtain five types of the 25-km2 gridded zonal values: area of cropland lost to built-up land, area of cropland lost to urban, area of cropland lost to rural settlement, area of cropland lost to industrial/transportation land and the dominant built-up land use type. Since the spatial pattern changed a great deal before and after 2000, we did the spatial analyses for two periods: 1987-2000 and 2000-2010.
2.2.2 Methodology for measuring the impacts of built-up land expansion on cropland loss
We used the percentage of cropland lost to built-up land in the total cropland loss area to indicate the contribution of built-up land expansion to cropland loss (Ccropi) (Figure 1), which was defined as:
Ccropi = CBi / Lcrop × 100% (3)
where Lcrop represents the area of cropland loss. CBi, built-up land type i means the same as in equation 1. A larger value of this index indicates a more critical impact of built-up land expansion on the cropland loss.
We took the percentage of cropland lost to built-up land in the total built-up land expansion area as an indicator illustrating the dependence of built-up land expansion on cropland loss (Dcropi) (Figure 1), which was defined as:
Dcropi = CBi / Ebuilti × 100% (4)
where Ebuilti represents the expansion area of built-up land type i during the period j. CBi and built-up land type i mean the same as in equation 1. A larger Dcrop value indicates built-up land expansion relies more on the cropland as its land source.
We used the percentage of traditional cropland in the cropland lost to built-up land as the indicator illustrating the impacts on cropland quality. Here, we defined traditional cropland as the cropland that has existed since 1987. The existing croplands in China are generally in more favorable condition for food production than the newly claimed and more marginal cropland (d’Amour et al., 2017). The percentage of traditional cropland in cropland lost to built-up land (Tcropi) (Figure 1) was calculated as follows:
Tcropi = TCBi / CBi × 100% (5)
where TCBi represents the area of traditional cropland lost to built-up land type i and CBi means the same as in equation 1. Here, Tcrop was calculated for four periods of 1995-2000, 2000-2005, 2005-2010, and the whole period of 1987-2010 (1987-1995 was not included in this analysis because this was the base period). A larger Tcrop value indicates built-up land expansion encroaches upon more traditional cropland.

3 Results

3.1 Spatio-temporal patterns of cropland lost to built-up land

During 1987 to 2010, a total of 42822 km2 of cropland was converted into built-up land in China (Table 1). The rate of cropland loss to overall built-up land fell greatly from 1492.81 km2/yr in 1987-1995 to 833.32 km2/yr in 1995-2000; however, it grew dramatically after 2000 and reached 2827.41 km2/yr in 2005-2010. The rate of cropland lost to urban land first decreased in 1995-2000, and then peaked at 1290.22 km2/yr in 2000-2005. For rural settlement, the speed of cropland lost was stable at about 700 km2/yr except for falling during 1995-2000. The speed of cropland loss to industrial/transportation land increased from 120.76 km2/yr in the late 1980s-1995 to 931.60 km2/yr in 2000-2005. Urban had the highest speed of encroaching upon cropland among the three types of built-up land after 2000. The speed of industrial/transportation land encroaching upon cropland was the lowest of the three types, however, it exceeded the rate of loss to rural settlement in the last period (Figure 3).
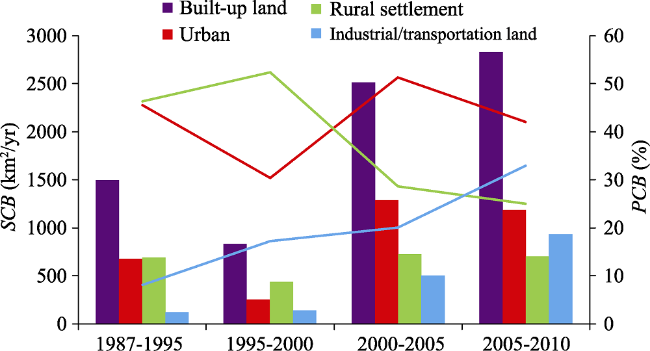
Table 1 The area of cropland converted into built-up land of China during 1987-2010
Cropland to built-up land (km2) 1987-1995 1995-2000 2000-2005 2005-2010 1987-2010
Urban 5440 1265 6451 5945 19101
Rural settlement 5536 2184 3609 3534 14863
Industrial/transportation land 966 718 2517 4658 8859
Total 11942 4167 12576 14137 42822
Figure 3 Temporal changes of SCB (the speed of cropland lost to built-up land) and PCB (the proportion of cropland lost to each built-up land type in the cropland lost to total built-up land) in China from 1987 to 2010
Over the entire period, urban land encroached most on cropland, accounting for 44.6% of the total cropland lost to built-up land, while rural settlement and industrial/transportation land accounted for 34.7% and 20.7%, respectively. However, the contribution of the different built-up land types changed over time. The percentage of cropland lost to urban land decreased to 30.4% in 1995-2000, the lowest in all four periods, and then peaked at 51.3% in 2000-2005. The percentage of loss to rural settlement saw a slight increase and peaked at 52.4% in 1995-2000; followed by a decrease, ending up at 25.0% in 2005-2010. The contribution of industrial/transportation land became increasingly larger, as its percentage went from 8.1% to 33.0% during the entire period (Figure 3).
The spatial pattern of cropland loss to built-up land changed significantly before and after 2000. In 1987-2000, this kind of conversion clustered in the west of the Huang-Huai-Hai Plain region, the northeast of the Middle-Lower Yangtze River region, the east of the South China region, the middle of the Southwest region, and the south of the Loess Plateau region. By contrast, the conversion in the other regions was scattered. In 2000-2010, the distribution of cropland lost to built-up land was more widespread and more evenly distributed across the regions in the east and south of China. Most regions in China showed an increase in the area of cropland lost to built-up land, except for Gansu-Xinjiang and Qinghai-Tibet Plateau (Figures 4a and 4b).
The distribution of cropland lost to urban land was near the city fringes and scattered in
space. In 2000-2010, urban land expanded into cropland more intensively all over the coun-
try with several obvious clusters in Beijing, Tianjin, the Yangtze River Delta Economic Zone
and the Pearl River Delta Economic Zone (Figures 4c and 4d). In contrast, cropland lost to
rural settlement was distributed more widely. During 1987-2000, rural settlement en-
croached upon a large amount of cropland in the Huang-Huai-Hai Plain region and the Mid-
dle-Lower Yangtze River region, while in 2000-2010, the total area of cropland occupied by
rural settlement decreased, and the Huang-Huai-Hai Plain region experienced the largest
decrease. However, other regions including Middle-Lower Yangtze River region, Southwest
region, Northeast region and Inner Mongolia and along the Great Wall region saw an in-
crease in the loss of cropland to rural settlement (Figures 4e and 4f). The spatial distribution
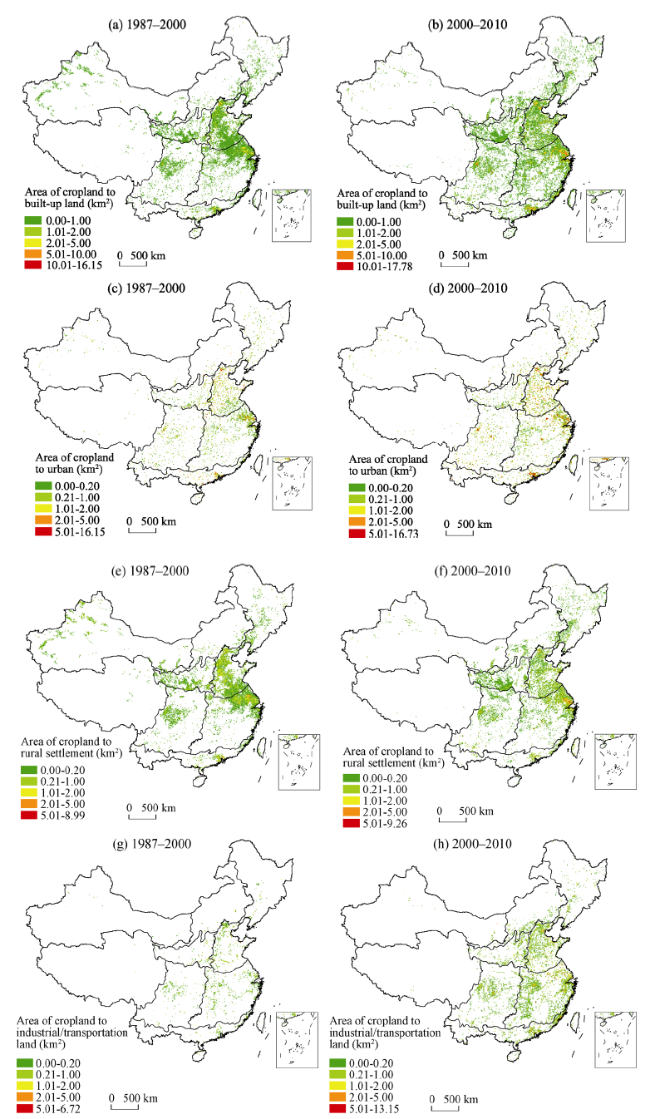
Figure 4 Spatial patterns of areas of cropland lost to built-up land of China in 5 km × 5 km grids
of cropland loss to industrial/transportation land was quite scattered during 1987 to 2000, and it caused the least cropland loss in all regions. In 2000-2010, however, the industrial/ transportation land expanded significantly and occupied a large amount of cropland, especially in Middle-Lower Yangtze River region, South China region, Huang-Huai-Hai Plain region and Southwest region (Figures 4g and 4h).
The dominant type of each grid indicates the leading contributor to cropland loss. In China, the loss of cropland to rural settlements was the dominant type in most areas where the conversion from cropland to built-up land happened in both periods. During 1987-2000, 72.6% of the grid cells with cropland lost to built-up land were dominated by rural settlement expansion, which were mainly in the west of the Huang-Huai-Hai Plain region and the northeast of the Middle-Lower Yangtze River region (Figure 5a). This loss fell to 45.8% during 2000-2010, accompanied by a dramatic increase in the loss to industrial/transportation land (Figure 5b). The percentage of the grid cells with industrial/transportation land expansion as the dominant type increased dramatically from 6.9% in the early period to 32.2% in the later period. The percentage of grid cells dominated by cropland loss to urban expansion was relatively stable, 20.5% and 22.0% for the former and latter period, respectively. The cropland losses dominated by urban expansion were mainly concentrated in Beijing, Tianjin, the Yangtze River Delta Economic Zone and the Pearl River Delta Economic Zone.
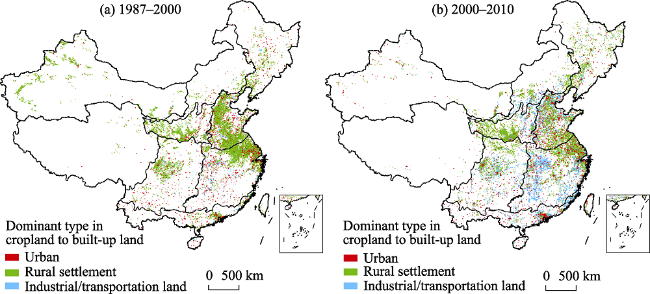
Figure 5 Spatial patterns of dominant types of cropland conversion to built-up land of China in 5 km × 5 km grid cells

3.2 Effects of built-up land expansion on cropland loss

It was found that built-up land expansion explained 43.8% of the total cropland loss during
1987 and 2010 in China. However, this situation varied over time. Before 2000, only about 30% of the lost cropland was converted into built-up land; but this figure soared to 71.1% during 2005-2010. This indicates that built-up land has become an increasingly important factor in causing cropland loss. Among the three types of built-up land, the largest contributor to cropland loss changed from rural settlements before 2000 to urban land after the year 2000. The contribution of the industrial/transportation land expansion was the smallest at first; however, it grew sharply by more than 9 times and ended up as the second largest contributor to cropland loss after urban expansion in the last period (Figure 6a).
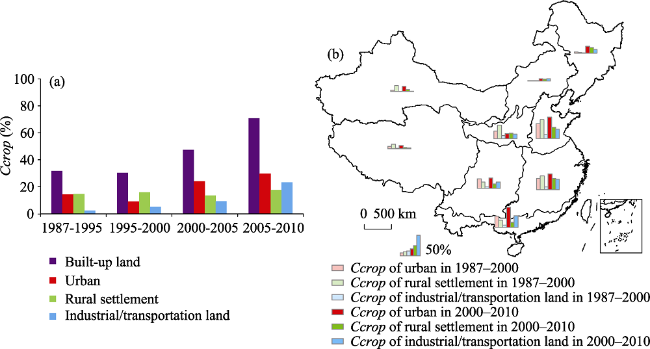
Figure 6 Spatio-temporal pattern of Ccrop in China (the contribution of built-up land expansion to cropland loss)
Spatially, during 1987-2000, built-up land expansion in the Huang-Huai-Hai Plain region had the largest impact on the cropland loss, followed by the Middle-Lower Yangtze River region. Both of these two regions are major food producing zones in China. In most regions, rural settlement had the largest contribution to the cropland loss; however, in the South China region and the Southwest region, urban was the type that encroached on the most cropland. During 2000-2010, urban became the type that caused the largest cropland loss in most regions except in the Loess Plateau region. Further, the effects of industrial/transportation land on cropland loss increased a great deal and even surpassed that of the loss to rural settlement in Inner Mongolia and along the Great Wall region, the Southwest region and the South China region (Figure 6b).
The expansion of built-up land in China during the period depended heavily on the availability for conversion of cropland. Most (85.8%) of the built-up land expansion come from cropland loss, however, the percentage fell to 69.8% by 2010. Among the different types of built-up land, rural settlement expansion depended mostly on cropland; more than 85% of rural settlement expansion comes from cropland loss for the whole period. The dependence of urban and industrial/transportation land expansion on cropland loss had similar temporal sequences, an increase during 1995-2000 and a decrease during 2000-2005. However, the dependence of urban expansion on cropland was much higher than that of industrial/transportation land (Figure 7a).
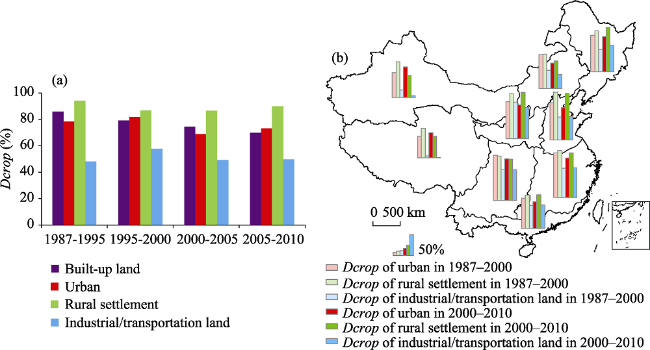
Figure 7 Spatio-temporal pattern of Dcrop in China (the dependence of built-up land expansion on cropland loss)
Spatially, croplands were the major source for built-up land expansion, especially to urban and rural settlement expansion. During 1987 and 2000, the percentage of new rural settlement changing from cropland was larger than that of urban in all regions except the Southwest region. During 2000-2010, proportionally less of the rural settlement expansion encroached onto cropland, except for the Northeast region, the Loess Plateau region and the South China region. Urban expansion also showed a lower percentage of encroachment into cropland in most regions. However, the Gansu-Xinjiang region and the Tibetan Plateau region experienced an increase in the percentage, which even surpassed that of rural settlement (Figure 7b).
Traditional cropland was usually of good quality and produced more food than newly reclaimed cropland in China, because most of the suitable land was already under intense, multi-cropping cultivation (d’Amour et al., 2017). It was found that 90.3% of the cropland occupied by the built-up land was traditional cropland for the whole period of study. In the early period (1995-2000), built-up land expansion consumed a smaller proportion of traditional cropland at 76.0%. However, the proportion kept increasing and ended up at 88.5% in 2005-2010. This indicates that more and more built-up land expansion occupied traditional cropland of the best food production quality. Rural settlement expansion took the highest percentage of traditional cropland, followed by urban growth. Industrial/transportation land expansion consumed least traditional cropland (Figure 8a).
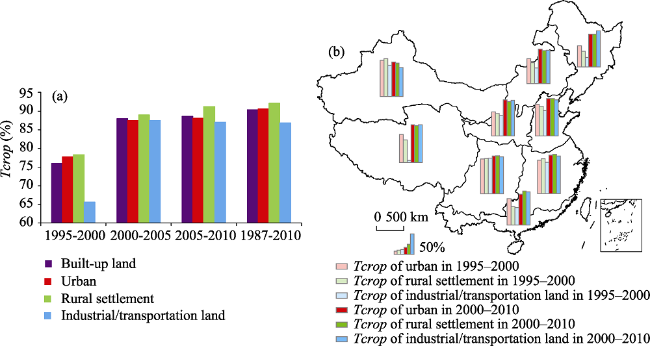
Figure 8 Spatio-temporal pattern of Tcrop (the percentage of traditional cropland in the cropland lost to built-up land)
Spatially, during 1995-2000, urban land use occupied a higher proportion of traditional cropland in most regions except the Middle-Lower Yangtze River region, the Southwest region and the Gansu-Xinjiang region. In 2000-2010, the proportion of traditional cropland in cropland lost to built-up land saw an obvious increase in all regions except the Gansu-Xinjiang region. During this period, rural settlements encroached on proportionally more traditional cropland in the Huang-Huai-Hai Plain region, the Middle-Lower Yangtze River region, the Southwest region and the South China region, where the cropland quality is generally higher than in other regions of the country. The Middle-Lower Yangtze River region had the largest proportion of traditional cropland lost to built-up land among all the regions in the later period (Figure 8b).

4 Discussion

4.1 Drivers of cropland loss to built-up land

Economic growth, represented by GDP growth, is recognized as the major driver of urban expansion in China (Liu et al., 2005; Seto et al., 2011), which in turn places great pressure on cropland. Therefore, the changes in annual GDP growth and its structure help to understand the patterns of cropland lost to built-up land. According to the data from NBSC (NBSC, 2011), the average annual GDP growth rate for China in 1987-1995 was 21.9%, before it declined to 10.5% in 1995-2000. After 2000, the annual GDP growth rate gradually increased, ending up as 13.5% and 17.3% for the period of 2000-2005 and 2005-2010 respectively. Correspondingly, the cropland loss to built-up land also experienced a similar process; the annual area of cropland loss to built-up land bottomed out in 1995-2000, and increased afterward (Figure 3). Meanwhile, the contributions to GDP from different sectors changed over time. The percentage of GDP from agriculture continuously decreased from 22.9% in the period of 1987-1995 to 10.1% in the period of 2005-2010. This largely explains the decline of contributions from rural settlement to the cropland lost to built-up land, and the increasing contributions from urban and industrial/transportation land as a whole.
Population changes directly influence urbanization and urban land (Pacione, 2001), and population migration also drives urban and rural land expansion. In China, the total population increased at an annual rate of 0.92% from 1.08 billion in 1987 to 1.34 billion in 2010. However, the changes of urban population and rural population were completely different. The average annual growth rate of the urban population was 3.92%, while the agricultural population has been decreasing since 1996 (NBSC, 2011). Although rural settlement still saw an expansion after 2000 due to the “rural hollowing” problem (Li et al., 2015), the percentage of rural settlement expansion among total built-up land expansion decreased, and in turn the percentage of cropland lost to rural settlement in the cropland lost to built-up land decreased greatly from 52.4% in 1995-2000 to 25.0% in 2005-2010 (Figure 3).
Policy and land management are the third kind of factor that drives the changes in the pattern of cropland loss to built-up land. Building industrial parks has spread overwhelmingly almost all over the country since China launched reform. These started in the coastal regions of China, but now are flourishing in the vast inland of China. Industrial/transportation land saw a dramatic expansion and was causing larger and larger amounts of cropland loss. Both the speed of cropland loss to industrial/transportation land and its percentage of total cropland lost to built-up land increased greatly. Moreover, with the planning of a medium and long term railway network proposed in 2004, high-speed railway construction promoted by the central government has accelerated transportation land expansion, as well.
Various factors have led to the expansion of built-up land, thus taking up productive cropland. However, positive land use management could slow down the loss of cropland (Li et al., 2014). To protect the cropland from being encroached by built-up land, the State Council released Regulations for the Protection of Basic Agricultural Land (Jiben Nongtian Baohu Tiaoli) in 1994, and the Protection Rules of Basic Farmland (New Jiben Nongtian Baohu Tiaoli) in 1998. Additionally, a “requisition-compensation balance of arable land” policy was implemented in 1997. From our results, we can see the decline of the dependence of built-up land expansion on cropland conversion (Figure 7).

4.2 Implications on future cropland use

Cropland is the major source of land for built-up land expansion, since it is located nearby or surrounding settlements. China is undergoing a historic urban-rural transformation process and is anticipating a boom of new urbanization in the near future. Much land will be in demand, not only to accommodate the large and growing population, but also to support the development of various industries and to support infrastructure projects. d’Amour et al. (2017) projected that from 2000 to 2030, one quarter of global cropland loss (7.6×10⁶ ha) due to urban expansion that would occur in China. Therefore, cropland loss is a lasting problem worthy of attention. The combination of a growing urban population and a declining rural population with diminishing and more impacted farmland means that China’s food security will be increasingly threatened.
As our results show, urban expansion has consumed the largest amount of cropland since 2000. Things might be getting even worse as China has shifted the urban development strategy from developing big cities as a priority to developing small towns or secondary cities. This may be a more land consuming mode of urbanization. Research indicates that if we had developed small towns as a priority during 1995-2000, there would be 9% more cropland lost to urban; and the additional cropland loss would be even larger (29%) in 2000-2008 as the urbanization rate in this period was much higher (Deng et al., 2015).
For rural settlement expansion, although we measured a decreasing value of PCB since the year 2000 and the rural population was migrating to cities, rural settlements continued to expand over the last 20 years. According to land use and population data (NBSC, 2011), the rural settlement use of land per capita increased from 151.95 m2 to 203.93 m2 during 1987-2010, which was considerably above the national standard of 150 m2 per capita (MCC, 1993). The “hollowing village” has become quite common in many areas of China, in which new houses are built at the fringes of rural towns and historical village centers are abandoned. Also, cropland encroachment by rural settlement was more likely to be into traditional and more fertile cropland (Figure 8). This further magnifies the pressure of rural settlement expansion on cropland and on the food supply.
Industrial/transportation land was the kind of built-up land taking up more and more cropland in the past. During 1990-2010, the railways, highways, inland waterways, civil aviation lines and pipelines increased by 0.58, 2.9, 0.14, 4.46 and 3.11 times, respectively (Jiao et al., 2016). This trend is more likely to continue into the near future. With the promotion of policies such as “Rise of Central China” and “Belt and Road Initiative”, central and western regions of China are anticipated to see more economic growth, industrialization and an emphasis on transportation. Building industrial parks to collocate various factories and companies has already been quite common and will be more widely spread to many other parts of China. What’s more, although high-speed roads and high-speed railway have been greatly developed in the last several years, airports are now only just starting to boom. As a result, transportation land expansion will continue to induce a large amount of cropland loss.

5 Conclusions

Based on land use data interpreted from remote sensing imagery, this study examined the spatio-temporal patterns of cropland lost to different types of built-up land in China during 1987-2010. In addition, the impacts of built-up land expansion on cropland loss were measured quantitatively. With the new knowledge, drivers of this conversion and implications on future cropland use were further analyzed.
Results showed that 42,822 km2 of cropland were converted into built-up land in China, accounting for 43.8% of total cropland loss during 1987-2010. Among the three types of built-up land, the contribution of rural settlement expansion to this kind of conversion decreased, while that of industrial/transportation land expansion increased dramatically. The increment of cropland lost to industrial/transportation land mainly distributed in regions with high-quality cropland, such as the Middle-Lower Yangtze River region, the South China region, the Huang-Huai-Hai Plain region and the Southwest region. In addition, the built-up land expansion depended on cropland heavily. 85.8% of the built-up land expansion came from cropland in 1987-1995, however, the percentage fell down to 69.8% at last. Among the different types of built-up land, rural settlement expansion depended on cropland mostly and took up the highest proportion of traditional cropland, which placed great pressure on cropland quality.
The fast increase in economic activity and the large rural to urban transformation were the main driving forces of the cropland lost to built-up land. Policies to protect the cropland showed obvious effects in the period of 1995-2000, however, the booming industrial land construction and intensive expansion of small cities drove a massive conversion from cropland to built-up land afterwards. Our results suggest that other than urban expansion, rural settlement should be a focus when conserving cropland because of its widest distribution, greatest dependence on croplands when expanding, and the greatest impacts on high quality traditional cropland. In addition, industrial/transportation land has a high potential to threaten the cropland in the future because of the undergoing transformation of industries from coastal region to inland China. Comprehensive regulations on the development of built-up land are essential to cropland conservation.
Our research offers evidences that the expansion of different built-up land types places distinguishing impacts on cropland in terms of quantity and quality, suggesting the importance of regulations on the development of rural settlements and industrial/transportation land when cropland protection policies are framed. For future research, a further quantitative assessment on cropland quality is worth to conduct, so that the impacts of built-up land on the quality of cropland could be more explicitly addressed. Moreover, a quantitative investigation on the driving forces of the conversion from cropland to built-up land will be more helpful on framing cropland-related policies.

Acknowledgements

All the authors are grateful to Professor Keith. C. Clarke for his valuable comments on an earlier version of the paper. The comments from the reviewers have been greatly helpful for strengthening the arguments of the paper.

The authors have declared that no competing interests exist.

[1]
Anderson K, Peng C Y, 1998. Feeding and fueling China in the 21st century.World Development, 26(8): 1413-1429.Abstract This paper addresses the questions: to what extent will China become a significant net importer of food and fuel in the foreseeable future, and what will be the impact of that import demand growth on international markets? It first summarizes what standard trade and development economics and the experiences of other Asian economies suggest we should expect of China, and then examines China's experience to date before turning to some forecasts for the next decade or so. Our review suggests that before long China will become a significant net importer of both food and fuels (especially petroleum). Contrary to Chinese fears, however, becoming more interdependent with the rest of the world need not be threatening and it may even offer more supply security for China in the long run.

DOI

[2]
Boland A, 2000. Feeding fears: Competing discourses of interdependency, sovereignty, and China’s food security.Political Geography, 19: 55-76.Following the release of the 1994 report ‘Who will feed China?’ by the Worldwatch Institute, there has been much debate over the implications of China's growing demand for grain. The question of China's food production has elicited a variety of responses. While for some it raises the specter of regional and global instability as China becomes an environmental threat, for others the entrance of China into the world market promises increased trade and profits. In this paper I explore the responses in China and the US to the different notions of interdependence which have shaped the debate. I first turn to how concerns over China's food supply have, despite appeals to the concepts of global environmental and economic interdependence, become linked to classical state-centered geopolitical concerns such as ‘sovereignty’ and ‘containment.’ I then look at how the debate has also been actively distanced from national security concerns through the invocation of an alternative interdependence founded on the logic of commerce. I conclude by arguing for the need within critical geopolitics to further examine the circulation of strategic texts between and within states, particularly in the analysis of texts that map worlds beyond the boundaries of North America and Europe.

DOI

[3]
Cai Y L, Fu Z Q, Dai E F, 2002. The minimum areas per capita of cultivated land and its implication for the optimization of land resources allocation.Acta Geographica Sinica, 57(2): 127-134. (in Chinese)

[4]
d’Amour C B, Reitsma F, Baiocchi G et al., 2017. Future urban land expansion and implications for global croplands.Proceedings of the National Academy of Sciences, 114(34): 8939-8944.Urban expansion often occurs on croplands. However, there is little scientific understanding of how global patterns of future urban expansion will affect the world’s cultivated areas. Here, we combine spatially explicit projections of urban expansion with datasets on global croplands and crop yields. Our results show that urban expansion will result in a 1.8–2.4% loss of global croplands by 2030, with substantial regional disparities. About 80% of global cropland loss from urban expansion will take place in Asia and Africa. In both Asia and Africa, much of the cropland that will be lost is more than twice as productive as national averages. Asia will experience the highest absolute loss in cropland, whereas African countries will experience the highest percentage loss of cropland. Globally, the croplands that are likely to be lost were responsible for 3–4% of worldwide crop production in 2000. Urban expansion is expected to take place on cropland that is 1.77 times more productive than the global average. The loss of cropland is likely to be accompanied by other sustainability risks and threatens livelihoods, with diverging characteristics for different megaurban regions. Governance of urban area expansion thus emerges as a key area for securing livelihoods in the agrarian economies of the Global South.

DOI PMID

[5]
Deng X, Huang J, Rozelle S et al., 2006. Cultivated land conversion and potential agricultural productivity in China.Land Use Policy, 23(4): 372-384.In China there is a growing debate on the role of cultivated land conversion on food security. This paper uses satellite images to examine the changes of the area of cultivated land and its potential agricultural productivity in China. We find that between 1986 and 2000 China recorded a net increase of cultivated land (+1.9%), which almost offset the decrease in average potential productivity, or bioproductivity (鈭2.2%). Therefore, we conclude that conversion of cultivated land has not hurt China's national food security. We also argue that more recent change in cultivated area likely has had little adverse effect on food security.

DOI

[6]
Deng X, Huang J, Rozelle S et al., 2015. Impact of urbanization on cultivated land changes in China.Land Use Policy, 45: 1-7.This article aims to evaluate the impact of urbanization and different urbanization modes on cultivated land changes using an econometric model that incorporates socio-economic and policy factors in the eastern China, which experience the great urbanization in recent years. Based on land-use remote sensing data interpreted from Landsat Thematic Mapper/Enhanced Thematic Mapper digital images of Chinese Academy of Sciences and a unique set of socio-economic data, an econometric model is developed to empirically estimate the impacts on cultivated land changes. Although urbanization has an effect on the changes of cultivated land, its effect is marginal. Moreover, the expansion of built-up areas in different urbanization modes causes varying impacts on changes in cultivated land use in different regions. Assuming that other factors remain constant, compared with the expansion of villages or the development of small towns, in the periods of 1995 2000, the urbanization in the more developed eastern region alleviates the loss of cultivated land by 7%, while during 2000鈥2008 the rapid urbanization lead to the cultivated land loss increase by 29.2%. The policies designed to protect cultivated land by encouraging people move to small towns may actually accelerate the occupation of cultivated land.

DOI

[7]
Ding C, 2003. Land policy reform in China: Assessment and prospects.Land Use Policy, 20: 109-120.China has launched a series of land policy reforms to improve land-use efficiency, to rationalize land allocation, to enhance land management, and to coordinate urban and rural development. These land policy reforms have yielded positive impacts on urban land use as well as negative socioeconomic consequences. On the positive side, they have contributed to emerging land markets, increased government revenue for the financing of massive infrastructure projects and provision of public goods, and improved the rationalization of land use. On the negative side, problems such as loss of social equity, socioeconomic conflicts, and government corruption have emerged. This paper reviews China's land policy reform in a historical context and then examines the impacts on urban development and land use. Policy implications are discussed at the end.

DOI

[8]
Jiang X C, 2003. Urbanization in China on WTO backgrounds.Urban Studies, 10(5): 23-34. (in Chinese)This paper discusses the tendency and discipline of the city development of the world in the period of economic globalization, interpreting metropolis outskirts as new phase of urbanization and putting forward the global city_net concept. Furthermore, the author analyzes the effects on city development and urbanization brought by China's entering WTO, then advances the corresponding strategy on urbanization in China.

[9]
Jiao J, Wang J, Jin F et al., 2016. Understanding relationship between accessibility and economic growth: A case study from China (1990-2010).Chinese Geographical Science, 26(6): 803-816.China′s economy and transport infrastructure have both experienced rapid development since 1978, and especially since 1990. Today, China is the second-largest economic entity in terms of GDP and has the largest high-speed rail (HSR) network and the second-largest expressway network in the world. This paper explores the relationship between accessibility and economic growth in China from 1990 to 2010. In the study, the basic research units include 333 prefecture-level cities and four municipalities. We explore a bivariate analysis framework of accessibility and economic growth, and their increase rates, to examine this relationship using long-term panel data. The results indicate that, first, accessibility and economic growth show a significant positive relationship using both cross-section and panel data, while the increase rate in accessibility and GDP indicate no significant relationship using cross-section data and a poor significant relationship using panel data. Second, the distributions of local advantage are uneven. Cities with low local advantage with respect to accessibility and GDP are mainly located in China′s eastern coastal region or the provincial capitals, while those with low local advantage in terms of their increase rates are located in the western region. Third, as China′s economic growth and transport networks have evolved, the distribution of local advantage shows little change in terms of accessibility and GDP, but a greater change in terms of their increase rates, which is largely influenced by the distribution of expressway and HSR networks.

DOI

[10]
Li G, Fang C, Qiu D et al., 2014. Impact of farmer households’ livelihood assets on their options of economic compensation patterns for cultivated land protection.Journal of Geographical Sciences, 24(2): 331-348.With rapid urbanization and the socio-economic transformation,cultivated land protection has gradually become a major concern in China. The economic compensation plays a crucial role in promoting cultivated land protection and improving the utilization ratio of cultivated land. Farmer household's satisfaction has a great influence on the effectiveness of compensation. Therefore,households' willingness to select the economic compensation pattern for cultivated land protection has been considered and re-examined. By employing Participatory Rural Appraisal method (PRA),3 villages and 392 households were investigated and sampled in mesa and hilly areas of Chongqing. Then a quantitative analysis framework of household livelihood hexagon has been developed to quantify the livelihood assets of different farmer households. Finally,the Gray Relation Model and Probit Regression Model have been employed to explore the coupling relationship between the household livelihood assets and their compensation pattern options. The results show that there are both qualitative and spatial heterogeneity in household livelihood assets. We found that the inequality of livelihood assets is evident for five household types. There is a spatial trend that the higher the elevation,the less livelihood assets are. In addition,their options of economic compensation pattern vary from Chengdu Pattern to Foshan Pattern due to their difference in livelihood assets and difference in location. In detail,there is a coupling relationship between household livelihood assets and their compensation pattern;negative correlation is observed between natural assets value and household pattern options,while the other livelihood assets have positive impacts on compensation pattern in varying degrees,which from the top are psychological assets,human assets,physical assets,financial assets,and social assets respectively. A conceptual compensation pattern system has been designed to meet the demands for farmer households mainly according to their shortage in livelihood assets. In addition,compensation method,compensation standard,the basis of compensation and the source of compensation funds have been proposed accordingly.

DOI

[11]
Li Y, Li Y, Westlund H et al., 2015. Urban-rural transformation in relation to cultivated land conversion in China: Implications for optimizing land use and balanced regional development.Land Use Policy, 47: 218-224.The paper aims to investigate land conversion as a result of urban–rural transformation in the Chinese context. Theoretical analysis and empirical study of the Bohai Rim region find strong connections between the land conversion rates and urban–rural transformation intensity in the period 2000–2010. Rapid land conversion normally takes place in counties/districts of low initial level of urban–rural transformation. However, places of high initial socioeconomic level and low transformation intensity would experience slow land conversion. The different land conversion rates in relation to urban–rural transformation intensity are mainly attributed to the China's land quotas distribution system which is subjective and administrative. The study highlights the implementation of land quotas distribution system based on differences to improve the land distribution efficiency and achieve balanced regional development in China.

DOI

[12]
Liu J, Liu M, Tian H et al., 2005. Spatial and temporal patterns of China’s cropland during 1990-2000: An analysis based on Landsat TM data.Remote Sensing of Environment, 98(4): 442-456.There are large discrepancies among estimates of the cropland area in China due to the lack of reliable data. In this study, we used Landsat TM/ETM data at a spatial resolution of 30 m to reconstruct spatial and temporal patterns of cropland across China for the time period of 1990 2000. Our estimate has indicated that total cropland area in China in 2000 was 141.1 million hectares (ha), including 35.6 million ha paddy land and 105.5 million ha dry farming land. The distribution of cropland is uneven across the regions of China. The North-East region of China shows more cropland area per capita than the South-East and North regions of China. During 1990鈥2000, cropland increased by 2.79 million ha, including 0.25 million ha of paddy land and 2.53 million ha of dry farming land. The North-East and North-West regions of China gained cropland area, while the North and South-East regions showed a loss of cropland area. Urbanization accounted for more than half of the transformation from cropland to other land uses, and the increase in cropland was primarily due to reclamation of grassland and deforestation. Most of the lost cropland had good quality with high productivity, but most gained cropland was poor quality land with less suitability for crop production. The globalization as well as changing environment in China is affecting land-use change. Coordinating the conflict between environmental conservation and land demands for food will continue to be a primary challenge for China in the future.

DOI

[13]
Liu L, Xu X, Liu J et al., 2015. Impact of farmland changes on production potential in China during 1990-2010.Journal of Geographical Sciences, 25(1): 19-34.The quantity and spatial pattern of farmland has changed in China, which has led to a major change in the production potential under the influence of the national project of ecological environmental protection and rapid economic growth during 1990-2010. In this study, the production potential in China was calculated based on meteorological, terrain elevation, soil and land-use data from 1990, 2000 and 2010 using the Global Agro-ecological Zones model. Then, changes in the production potential in response to farmland changes from 1990 to 2010 were subsequently analyzed. The main conclusions were the following. First, the total production potential was 1.055 billion tons in China in 2010. Moreover, the average production potential was 7614 kg/ha and showed tremendous heterogeneity in spatial pattern. Total production in eastern China was high, whereas that in northwestern China was low. The regions with high per unit production potential were mainly distributed over southern China and the middle and lower reaches of the Yangtze River. Second, the obvious spatiotemporal heterogeneity in farmland changes from 1990 to 2010 had a significant influence on the production potential in China. The total production potential decreased in southern China and increased in northern China. Furthermore, the center of growth of the production potential moved gradually from northeastern China to northwestern China. The net decrease in the production potential was 2.97 million tons, which occupied 0.29% of the national total actual production in 2010. Third, obvious differences in the production potential in response to farmland changes from 1990 to 2000 and from 2000 to 2010 were detected. The net increase in the production potential during the first decade was 10.11 million tons and mainly distributed in the Northeast China Plain and the arid and semi-arid regions of northern China. The net decrease in the production potential during the next decade was 13.08 million tons and primarily distributed in the middle and lower reaches of the Yangtze River region and the Huang-Huai-Hai Plain. In general, the reason for the increase in the production potential during the past two decades might be due to the reclamation of grasslands, woodlands and unused land, and the reason for the decrease in the production potential might be urbanization that occupied the farmland and Green for Grain Project, which returned farmland to forests and grasslands.

DOI

[14]
Liu Y S, Wang J Y, Long H L, 2010. Analysis of arable land loss and its impact on rural sustainability in southern Jiangsu Province of China.Journal of Environmental Management, 91(3): 646-653.Rapid urbanization and industrialization in southern Jiangsu Province have consumed a huge amount of arable land. Through comparative analysis of land cover maps derived from TM images in 1990, 2000 and 2006, we identified the trend of arable land loss. It is found that most arable land is lost to urbanization and rural settlements development. Urban settlements, rural settlements, and industrial park-mine-transport land increased, respectively, by 87 99702ha (174.65%), 81 04102ha (104.52%), and 12 69202ha (397.99%) from 1990 to 2006. Most of the source (e.g., change from) land covers are rice paddy fields and dryland. These two covers contributed to newly urbanized areas by 37.12% and 73.52% during 1990–2000, and 46.39% and 38.86% during 2000–2006. However, the loss of arable land is weakly correlated with ecological service value, per capita net income of farmers, but positively with grain yield for some counties. Most areas in the study site have a low arable land depletion rate and a high potential for sustainable development. More attention should be directed at those counties that have a high depletion rate but a low potential for sustainable development. Rural settlements should be controlled and rationalized through legislative measures to achieve harmonious development between urban and rural areas, and sustainable development for rural areas with a minimal impact on the ecoenvironment.

DOI PMID

[15]
Long H, Liu Y, Wu X et al., 2009. Spatio-temporal dynamic patterns of farmland and rural settlements in Su-Xi-Chang region: Implications for building a new countryside in coastal China.Land Use Policy, 26(2): 322-333.This paper analyzes the spatio-temporal dynamic patterns of farmland and rural settlements from 1990 to 2006 in Su–Xi–Chang region of coastal China experienced dramatic economic and spatial restructuring, using high-resolution Landsat TM (Thematic Mapper) data in 1990, 1995, 2000 and 2006, and socio-economic data from both research institutes and government departments. To examine the spatial patterns of farmland and rural settlements and their change over time, a set of pattern metrics that capture different dimensions of land fragmentation was identified. The outcomes indicated that, to a large extent, land-use change from 1990 to 2006 in Su–Xi–Chang region was characterized by a serious replacement of farmland with urban and rural settlements, construction land, and artificial ponds. Population growth, rapid industrialization and urbanization are the major driving forces of farmland change, and China's economic reforms played an important role in the transformation of rural settlements. China's “ building a new countryside” is an epoch-making countryside planning policy. The focuses of building a new countryside in coastal China need to be concentrated on protecting the farmland, developing modern agriculture, and building “clean and tidy villages.” Rural construction land consolidation and cultivated land consolidation are two important ways to achieve the building objectives. The authors argue that it is fundamental to lay out a scientific urban–rural integrated development planning for building a new countryside, which needs to pay more attention to making the rural have certain functions serving for the urban. In addition, the cultural elements of idyll and the rural landscape need to be reserved and respected in the process of building a new countryside in coastal China, instead of building a new countryside, which looks more like a city.

DOI

[16]
Longley P A, 2002. Geography: Will development in urban remote sensing and GIS lead to better urban geography?Progress in Human Geography, 26(2): 231-239.

DOI

[17]
Ministry of Construction of China (MCC), 1993. Village/Small-Town Planning Standards (GB 50188-93). Beijing: Ministry of Construction of P. R. China. (in Chinese)

[18]
National Bureau of Statistics of China (NBSC), 2011. China Statistical Yearbook. Beijing: China Statistics Press. (in Chinese)

[19]
Nationwide Committee of Agricultural Regionalization (NCAR), 1981. The Comprehensive Agricultural Regionalization of China. Beijing: Agriculture Press. (in Chinese)

[20]
Pacione M, 2001. The internal structure of cities in the third world.Geography, 86(3): 189-209.This second of three articles on models of urban structure focuses attention on the internal land use structure of cities in the Third World. First, the key 'trigger factors' underlying urban development and the processes of globalisation are identified, then empirical evidence is used to reveal regional variations in levels of urbanisation and urban growth in the contemporary world. Next, major differences between the urbanisation process experienced in nineteenth century Western cities and that occurring in the Third World are examined, and finally, acknowledging the diversity of the urban experience, a range of urban models is introduced to illuminate the structure of cities in different socio-cultural realms. Particular attention is afforded to the cities of Latin America, African cities (including the colonial city, Islamic city and apartheid/post-apartheid city), cities of the Middle East and North Africa, and the city in South and South East Asia.

DOI

[21]
Pandey B, Seto K C, 2015. Urbanization and agricultural land loss in India: Comparing satellite estimates with census data.Journal of Environmental Management, 148: 53-66.61We examined the urban conversion of agricultural lands (UCAL) in India from 2001 to 2010.61We used a hierarchical classification method and time-series analysis to identify location and timing of UCAL.61Results show that UCAL in India is greater in states where urbanization and economic growth are high.61Agricultural land loss in India is concentrated around smaller cities more than more bigger cities.61The total area under UCAL in India during the study period is relatively low but has been increasing since 2006.

DOI PMID

[22]
Qin H, 2010. Rural-to-urban labor migration, household livelihoods, and the rural environment in Chongqing Municipality, Southwest China.Human Ecology, 38(5): 675-690.Rural migration and its relationship to the rural environment have attracted increasing research interest in recent decades. Rural migration constitutes a key component of human population movement, while rural areas contain most of the world's natural resources such as land and forests. This study empirically evaluates a conceptual framework incorporating rural household livelihoods as an integrative mediating factor between rural migration and the rural environment in the context of rural-to-urban labor migration in Chongqing Municipality, Southwest China. The analysis draws on data collected through household surveys and key informant interviews from four villages. Results confirm the hypothesis that labor-migrant and nonlabor-migrant households differ significantly in livelihood activities including agricultural production, agricultural technology use, income and consumption, and resource use and management. Implications for the subsequent environmental outcomes of rural labor out-migration and corresponding natural resource management and policy in rural origin areas are discussed.

DOI PMID

[23]
She L M, Xie B G, 2000. Some considerations about the dynamic balance of the total cultivated land quantity in China.Research of Agricultural Modernization, 21(2): 87-90. (in Chinese)Keeping the dynamic balance of the total cultivated land quantity in China is not only necessary for national grain security and the fundamental transformation of land use patterns, but also beneficial to macrocontrol of national economic development. The realistic possibility of maintaining the dynamic balance is discussed from five aspects:increasing utilization efficiency of the existing urban land; compacting rural community distribution. consolidating existing cultivated land; reclamating waste land. and exploiting virgin land suitable for agriculture use. Four strategies about realizing the dynamic balance are proposed:strictly controling the total land supply for building; speeding up to establish market system for cultivated land protection; prohibiting changing cultivated land into garden plot or fish pond arbitrarily, strenghtening the examining and approving management of agriculture construction appropriating cultivated land.

[24]
Seto K C, Fragkias M, Güneralp B et al., 2011. A meta-analysis of global urban land expansion.PLoS One, 6(8): e23777.The conversion of Earth's land surface to urban uses is one of the most irreversible human impacts on the global biosphere. It drives the loss of farmland, affects local climate, fragments habitats, and threatens biodiversity. Here we present a meta-analysis of 326 studies that have used remotely sensed images to map urban land conversion. We report a worldwide observed increase in urban land area of 58,000 km2from 1970 to 2000. India, China, and Africa have experienced the highest rates of urban land expansion, and the largest change in total urban extent has occurred in North America. Across all regions and for all three decades, urban land expansion rates are higher than or equal to urban population growth rates, suggesting that urban growth is becoming more expansive than compact. Annual growth in GDP per capita drives approximately half of the observed urban land expansion in China but only moderately affects urban expansion in India and Africa, where urban land expansion is driven more by urban population growth. In high income countries, rates of urban land expansion are slower and increasingly related to GDP growth. However, in North America, population growth contributes more to urban expansion than it does in Europe. Much of the observed variation in urban expansion was not captured by either population, GDP, or other variables in the model. This suggests that contemporary urban expansion is related to a variety of factors difficult to observe comprehensively at the global level, including international capital flows, the informal economy, land use policy, and generalized transport costs. Using the results from the global model, we develop forecasts for new urban land cover using SRES Scenarios. Our results show that by 2030, global urban land cover will increase between 430,000 km2and 12,568,000 km2, with an estimate of 1,527,000 km2more likely.

DOI PMID

[25]
Tan M, Li X, Xie H et al., 2005. Urban land expansion and arable land loss in China: A case study of Beijing-Tianjin-Hebei region. Land Use Policy, 22(3): 187-196.With significant economic development in the last decade in China, urban land has increasingly expanded and encroached upon arable land in the last decade. Although many papers have analyzed the characteristics of urban land expansion, relatively less attention has been paid to examining the different expansion features of different-tier cities at a regional level. This paper analyzes the spatio-temporal differences of urban land expansion and arable land loss among different-tier cities of the BTH (Beijing鈥揟ianjin鈥揌ebei) region in China in the 1990s, and identifies social, economic, political and spatial factors that led to these differences. Based on urban land change data determined by interpreting Landsat Thematic Mapper (TM) imagery, it was found that the urban land area in the BTH region expanded by 71% between 1990 and 2000. Different-tier cites, however, had enormous differences in urban development, such as speed of urban land expansion, speed of urban land per capita growth, and so on. These differences were closely related to rapid economic development, strict household registration systems, urban development guidelines ( chengshi fazhan fangzhen), and national land use policies. Of all the new urban land, about 74% was converted from arable land, and there was a general tendency for smaller cities to have higher percentages. One of the important reasons for this result is that urban land is highly correlated with arable land in spatial distribution.

DOI

[26]
Tania D M, Lopez T, Aide M et al., 2001. Urban expansion and the losses of prime agricultural lands in Putero Rico.Ambio, 30: 49-54.In many countries where the economy has shifted from mainly agricultural to industrial, abandoned agricultural lands are lost to urbanization. For more than 4 centuries the Puerto Rican economy depended almost entirely on agriculture, but sociopolitical changes early in the 20th century resulted in a shift to industry. This shift in the economy, and an increase in population, has resulted in an increase in urban areas. This study describes the rate and distribution of urban growth on the island of Puerto Rico from 1977 to 1994 and the resulting influence on potential agricultural lands. Urban extent and growth were determined by interpreting aerial photographs and satellite imagery. The 1994 urban coverage was combined with a soil coverage based on agricultural potential to determine the distribution of urban areas relative to potential farmlands. Analyses showed that in 1977, 11.3% of Puerto Rico was classified as urban. After 17 years, urban areas had increased by 27.4% and urban growth on soils suitable for agriculture had increased by 41.6%. This represents a loss of 6% of potential agricultural lands. If this pattern of encroachment by urban growth into potential farmlands continues, Puerto Rico's potential for food production in the future could be greatly limited.

DOI PMID

[27]
Tu S, Long H, 2017. Rural restructuring in China: Theory, approaches and research prospect.Journal of Geographical Sciences, 27(10): 1169-1184.Rural restructuring is a process of reshaping socio-economic morphology and spatial pattern in rural territory in response to the changes of elements both in kernel system and external system of rural development,by optimally allocating and efficiently managing the material and non-material elements in the two systems.It aims at ultimately optimizing the structure and promoting the function within rural territorial system as well as realizing the coordination of structure and complementation of function between urban and rural territorial system.This paper establishes a theoretical framework of rural restructuring through elaborating the concept and connotations as well as analyzing the mechanism pushing forward rural restructuring based on the evolution of"elements-structure-function",and probes the approaches from the three aspects of spatial restructuring,economic restructuring and social restructuring.Besides,the authors argue that the study of rural restructuring in China in the future needs to focus on the aspects of long-term and multi-scale process and pattern,mechanism,regional models,rural planning technology system and standard,policy and institutional innovations concerning rural restructuring as well as the impacts of globalization on rural restructuring,in order to serve the current national strategic demands and cope with the changes of rural development elements in the process of urban-rural development transformation.

DOI

[28]
Wang Y, Scott S, 2008. Illegal farmland conversion in China’s urban periphery: Local regime and national transitions.Urban Geography, 29(4): 327-347.Through a case study in a village located in suburban Haikou City, Hainan Province, this article suggests the existence of a local development regime that exercises illegal farmland conversion in China's urban periphery. This regime consists not only of state officials and business investors, but also of local farmers anxious for off-farm employment. Our study highlights the broad transitions that led to the rise of local development regimes in China's urban periphery. These transitions include (1) the development of the local state, (2) farmers' changing relations with local authorities, and (3) the asymmetrical liberalization of land transaction rights in rural and urban areas. Whereas the state government still manages to intervene in the local conversion of farmland, such intervention is increasingly ineffective as economic liberalization intensifies. A series of potential policies are recommended to protect farmland and agricultural livelihoods in the context of rapid urbanization.

DOI

[29]
Xie J, Jin X, Lin Y et al., 2017. Quantitative estimation and spatial reconstruction of urban and rural construction land in Jiangsu Province, 1820-1985.Journal of Geographical Sciences, 27(10): 1185-1208.Land cover is the most evident landscape signal to characterize the influence of human activities on terrestrial ecosystems.Since the industrial revolution,the expansion of construction land has profoundly changed the status of land use coverage and changes.This study is proposed to reconstruct the spatial pattern of construction land (urban construction land and rural settlement land) for five historical periods over the past 200 years in Jiangsu Province with 200 m 200 m grids on the basis of quantitative estimation.Urban construction land is estimated based on data about city walls,four gates along walls,and other socio-economic factors.Rural settlement land is calculated based on the rural population and per capita housing allowance.The spatial pattern of historical construction land is simulated based on the distribution of modern construction land in 1985 with a quantitative-boundarysuitability control method and thorough consideration over connectivity of different land use types.The study concludes that:(1) the amount of construction land in Jiangsu Province is estimated at 963.46 km2 in 1820,1043.46 km2 in 1911,1672.40 km2 in 1936,1980.34 km2 in 1952 and 10,687.20 km2 in 1985;and (2) the spatial distribution of construction land features the great proclivity to water bodies and main roads and the strong polarization of existent residence.The results are verified directly and indirectly by applying the trend verification of construction land changes and patterns,the correlation analysis between rural settlement land and local arable land,and quantitative accuracy test of the reconstructed construction land to actual historical survey maps covering four sample regions in 1936.

DOI

[30]
Yang H, Li X B, 2000. Cultivated land and food supply in China.Land Use Policy, 17: 73-88.The study utilizes official statistics at the national and provincial level to examine changes in cultivated land in China during the past two decades. The environmental impact of the changes and the consequent effect on China's short- and long-term food supply are tackled. The study finds that while the decline in cultivated land was a trend evident at the national level, a provincial investigation reveals that this was mainly the result of a drastic reduction of fertile land in the southeast areas. The conversion of cultivated land to other types of agricultural uses and the encroachment of various constructions were the major causes of the loss there. Cultivated land increased in some northwest and frontier provinces, which partially offset the loss in the southeast. Reclamation was the primary source of the increase. This gain, however, has been made at the expense of environment, indicated by a substantial abandonment of damaged land in the major reclaiming provinces. The study argues that under the current land management system, the enforcement of the strategy of maintaining a dynamic balance of cultivated land can only intensify the existing regional trend. To this end, the strategy could potentially do more harm than good to China's long-term food security.

DOI

[31]
Yeh A G O, Li X, 1999. Economic development and agricultural land loss in the Pearl River Delta, China.Habitat International, 23(3): 373-390.The Pearl River Delta is developing very rapidly in the last two decades since the adoption of economic reform and open-door policy of China in 1978. Concomitant to this development is the rapid change of landscape in both urban and rural areas. The loss of valuable agricultural land by the encroachment of urban development, especially massive construction sites from land speculation, is very severe recently. This paper examines the relationship between economic development and agricultural land loss in the Pearl River Delta, using Dongguan as a case study. It is found that agricultural land loss has been much aggravated by land speculation as a result of the property bloom in the Pearl River Delta that was induced by the property boom in Hong Kong in the early 1990s. The urban sprawl in the Pearl River Delta is also related to other economic factors, such as rural industrialization, rise of localism, influence from Hong Kong, transport improvement, and lack of land management and monitoring system. There is an urgent need to develop a sustainable land development strategy to protect the fertile agricultural land from further unnecessary losses, especially from land speculation.

DOI

[32]
Zhang Z, Wang X, Zhao X et al., 2014. A 2010 update of national land use/cover database of China at 1:100000 scale using medium spatial resolution satellite images.Remote Sensing of Environment, 149: 142-154.61We update national land use database (NLUD-C) of China in 2010.61Visual interpretation based on professional knowledge was employed for update.61The accuracy for verified first-level type polygons is more than 95.41%.

DOI

[33]
Zuo L, Zhang Z, Zhao X et al., 2014. Multitemporal analysis of cropland transition in a climate-sensitive area: A case study of the arid and semiarid region of northwest China.Regional Environmental Change, 14(1): 75-89.Land-use change is becoming an important anthropogenic force in the global climate system through alteration of the Earth’s biogeophysical and biogeochemical processes. Cropland, which provides...

DOI

Outlines

/