
Journal of Geographical Sciences >
Cultivated land change in the Belt and Road Initiative region
Author: Chen Di (1991-), PhD Candidate, specialized in agricultural land use change. E-mail: chendi01@caas.cn
Received date: 2018-01-04
Accepted date: 2018-06-06
Online published: 2018-11-20
Supported by
National Natural Science Foundation of China, No.41501111
Fundamental Research Funds for Central Non-profit Scientific Institution, No.IARRP-2017-27, No.IARRP-2017-65
Copyright
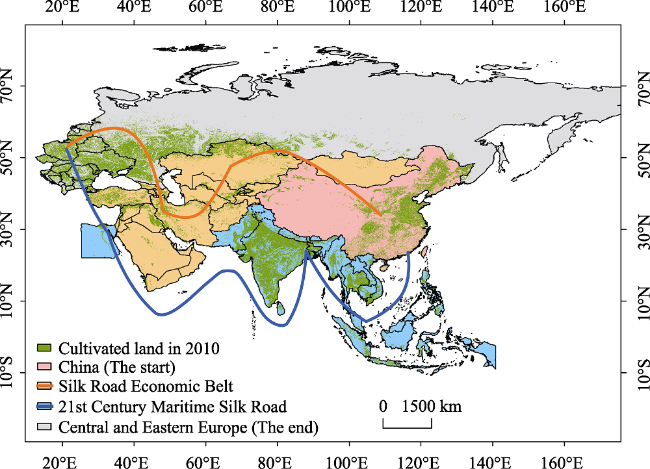
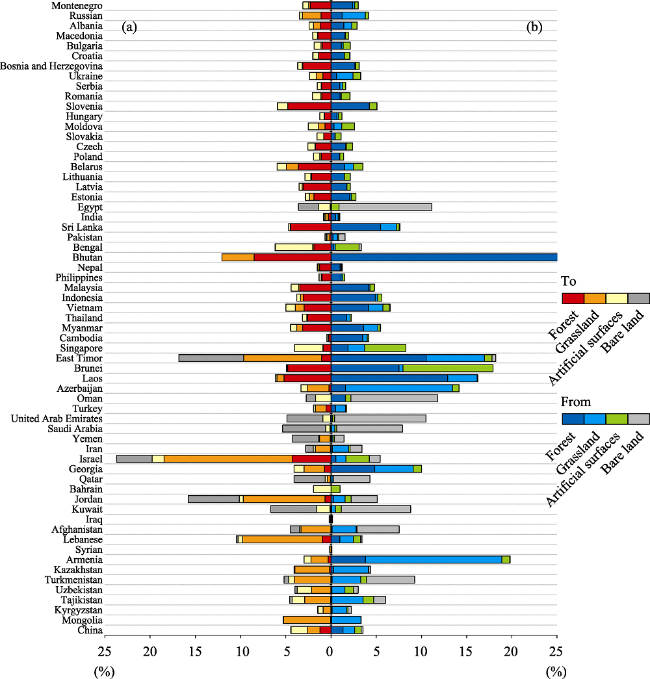
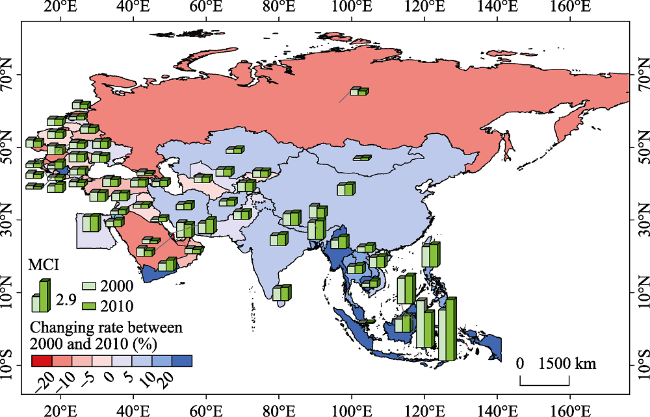
The Belt and Road Initiative (BRI)-a development strategy proposed by China - provides unprecedented opportunities for multi-dimensional communication and cooperation across Asia, Africa and Europe. In this study, we analyse the spatio-temporal changes in cultivated land in the BRI countries (64 in total) to better understand the land use status of China along with its periphery for targeting specific collaboration. We apply FAO statistics and GlobeLand30 (the world’s finest land cover data at a 30-m resolution), and develop three indicator groups (namely quantity, conversion, and utilization degree) for the analysis. The results show that cultivated land area in the BRI region increased 3.73×10⁴ km2 between 2000 and 2010. The increased cultivated land was mainly found in Central and Eastern Europe and Southeast Asia, while the decreased cultivated land was mostly concentrated in China. Russia ranks first with an increase of 1.59×10⁴ km2 cultivated land area, followed by Hungary (0.66×10⁴ km2) and India (0.57×10⁴ km2). China decreased 1.95×10⁴ km2 cultivated land area, followed by Bangladesh (-0.22×10⁴ km2) and Thailand (-0.22×10⁴ km2). Cultivated land was mainly transferred to/from forest, grassland, artificial surfaces and bare land, and transfer types in different regions have different characteristics: while large amount of cultivated land in China was converted to artificial surfaces, considerable forest was converted to cultivated land in Southeast Asia. The increase of multi-cropping index dominated the region except the Central and Eastern Europe, while the increase of fragmentation index was prevailing in the region except for a few South Asian countries. Our results indicate that the negative consequence of cultivated land loss in China might be underestimated by the domestic-focused studies, as none of its close neighbours experienced such obvious cultivated land losses. Nevertheless, the increased cultivated land area in Southeast Asia and the extensive cultivated land use in Ukraine and Russia imply that the regional food production would be greatly improved if China’ “Go Out policy” would help those countries to intensify their cultivated land use.
CHEN Di , YU Qiangyi , HU Qiong , XIANG Mingtao , ZHOU Qingbo , WU Wenbin . Cultivated land change in the Belt and Road Initiative region[J]. Journal of Geographical Sciences, 2018 , 28(11) : 1580 -1594 . DOI: 10.1007/s11442-018-1530-9
Figure 1 An overview of the Belt and Road Initiative |
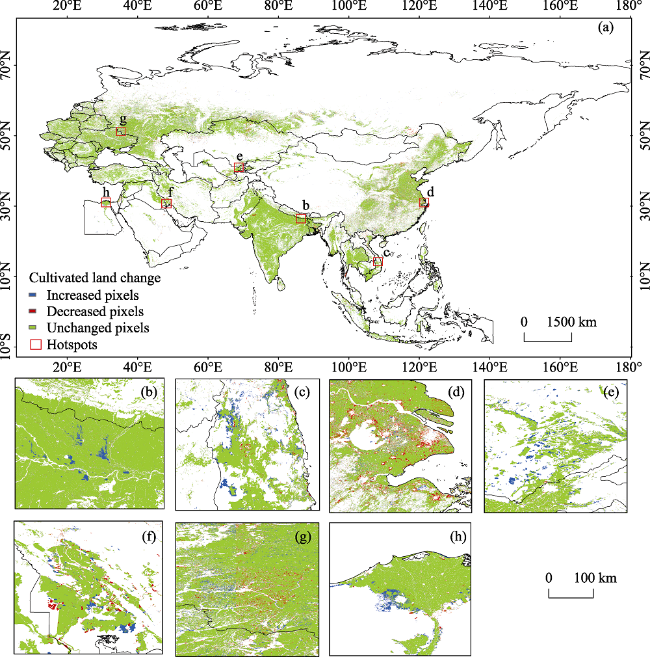
Figure 2 Cultivated land change in the BRI between 2000 and 2010 (a) and the identified seven hotspots representing the characteristics of cultivated land change at the seven geographical zones, including: northeast India from South Asia (b), central part of Vietnam from Southeast Asia (c), Yangtze River Delta in China from East Asia (d), south Kazakhstan from Central Asia (e), southwest Iran from West Asia (f), southwest Russia from Central and Eastern Europe (g) and Nile Delta in Egypt from North Africa (h). Detailed elaboration of the seven geographical zones can be found in Section 2.1 and Table S1. A unified legend is provided in the upper figure (a). |
Figure 3 The share of cultivated land converted to other land cover classes in BRI countries (a), and the share of other land cover classes converted to cultivated land in the BRI countries (b) between 2000 and 2010 |
Figure 4 Spatial distribution of multi-cropping index and its changing rate in the BRI countries between 2000 and 2010. The number, i.e. 2.9 in the legend, means the length of the presented bar equalizes to this specific value. |
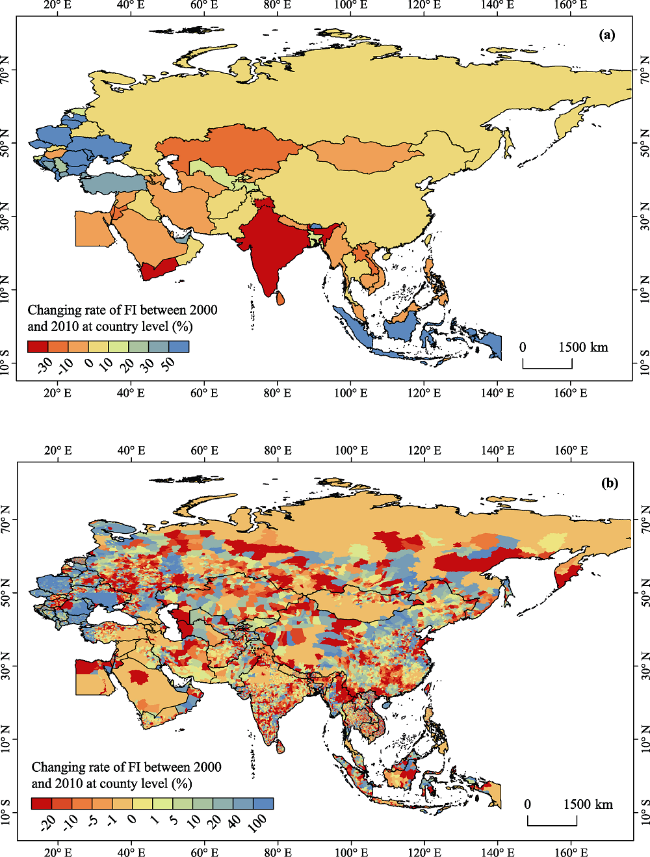
Figure 5 Changing rate of cultivated land fragmentation index in the BRI countries between 2000 and 2010 at country level (a) and county level (b) |
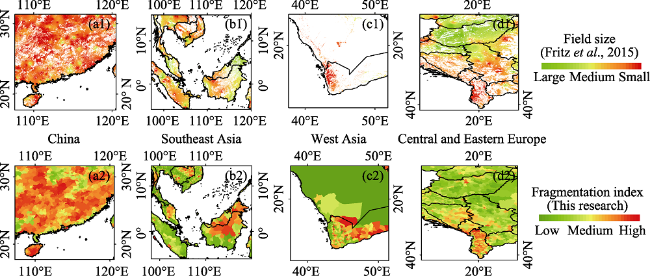
Figure 6 Comparison between fragmentation index and field size in hotspots from China (a, 1 and 2), Southeast Asia (b, 1 and 2), West Asia (c, 1 and 2), Central and Eastern Europe (d, 1 and 2) |
Table S1 Countries in the “Belt and Road Initiative” (BRI) region |
| BRI | Geographical zone | Countries |
|---|---|---|
| China (the start) | East Asia | China |
| the Belt | East Asia | Mongolia |
| Central Asia | Kazakhstan, Turkmenistan, Tajikistan, Uzbekistan, Kyrgyzstan | |
| West Asia | Armenia, Syrian, Lebanese, Afghanistan, Iraq, Kuwait, Jordan, Bahrain, Qatar, Georgia, Israel, Iran, Yemen, Saudi Arabia, United Arab Emirates, Turkey, Oman, Azerbaijan | |
| the Road | Southeast Asia | Brunei, East Timor, Laos, Singapore, Cambodia, Myanmar, Thailand, Indonesia, Malaysia, Vietnam, Philippines |
| South Asia | Maldives, Sri Lanka, Pakistan, India, Bangladesh, Nepal, Bhutan | |
| North Africa | Egypt | |
| Central and Eastern Europe (the end) | Central and Eastern Europe | Estonia, Latvia, Lithuania, Belarus, Poland, Czech, Slovakia, Moldova, Hungary, Slovenia, Romania, Serbia, Ukraine, Bosnia and Herzegovina, Croatia, Bulgaria, Macedonia, Albania, Russia, Montenegro |
Table S2 Cultivated land area change (104 km2) and changing rate (%) of seven geographical zones and each country in the BRI region between 2000 and 2010 |
| Geographical zone | Country | Area change | Area changing rate | |||
|---|---|---|---|---|---|---|
| East Asia | China | -1.95 | -0.95 | |||
| Mongolia | -0.03 | -2.00 | ||||
| Subtotal | -1.98 | -0.96 | ||||
| Central Asia | Kazakhstan | 0.17 | 0.40 | |||
| Turkmenistan | 0.17 | 4.87 | ||||
| Tajikistan | 0.02 | 1.86 | ||||
| Uzbekistan | -0.06 | -0.89 | ||||
| Kyrgyzstan | 0.02 | 0.92 | ||||
| Subtotal | 0.31 | 0.55 | ||||
| West Asia | Armenia | 0.0001 | 0.02 | |||
| Syrian | -0.003 | -0.04 | ||||
| Lebanese | -0.02 | -7.31 | ||||
| Afghanistan | 0.21 | 3.57 | ||||
| Iraq | -0.001 | -0.01 | ||||
| Kuwait | 0.001 | 2.39 | ||||
| Jordan | -0.05 | -11.18 | ||||
| Geographical zone | Country | Area change | Area changing rate | |||
| Bahrain | -0.00003 | -0.96 | ||||
| Qatar | 0.00005 | 0.35 | ||||
| Georgia | -0.01 | -0.58 | ||||
| Israel | -0.12 | -18.92 | ||||
| Iran | 0.32 | 1.40 | ||||
| Yemen | -0.04 | -3.16 | ||||
| Saudi Arabia | 0.08 | 2.97 | ||||
| United Arab Emirates | 0.01 | 6.44 | ||||
| Turkey | -0.04 | -0.15 | ||||
| Oman | 0.02 | 10.50 | ||||
| Azerbaijan | 0.10 | 3.20 | ||||
| Subtotal | 0.44 | 0.52 | ||||
| Southeast Asia | Brunei | 0.0006 | 15.83 | |||
| East Timor | 0.0007 | 1.78 | ||||
| Laos | 0.24 | 12.24 | ||||
| Singapore | 0.0006 | 5.07 | ||||
| Cambodia | 0.28 | 4.78 | ||||
| Myanmar | 0.10 | 0.64 | ||||
| Thailand | -0.22 | -0.82 | ||||
| Indonesia | 0.42 | 1.67 | ||||
| Malaysia | 0.01 | 0.49 | ||||
| Vietnam | 0.21 | 1.68 | ||||
| Philippines | 0.003 | 0.05 | ||||
| Subtotal | 1.05 | 1.11 | ||||
| South Asia | Maldives | 0.00 | 0.00 | |||
| Sri Lanka | 0.06 | 3.28 | ||||
| Pakistan | 0.27 | 1.01 | ||||
| India | 0.57 | 0.29 | ||||
| Bangladesh | -0.22 | -2.53 | ||||
| Nepal | -0.01 | -0.25 | ||||
| Bhutan | 0.02 | 20.25 | ||||
| Subtotal | 0.69 | 0.29 | ||||
| North Africa | Egypt | 0.35 | 8.75 | |||
| Subtotal | 0.35 | 8.75 | ||||
| Central and Eastern Europe | Estonia | 0.003 | 0.18 | |||
| Latvia | -0.03 | -1.03 | ||||
| Lithuania | -0.02 | -0.47 | ||||
| Belarus | -0.18 | 1.72 | ||||
| Poland | -0.08 | -0.39 | ||||
| Geographical zone | Country | Area change | Area changing rate | |||
| Czech | -0.003 | -0.06 | ||||
| Slovakia | -0.01 | -0.42 | ||||
| Moldova | 0.003 | 0.12 | ||||
| Hungary | 0.66 | 11.69 | ||||
| Slovenia | -0.004 | -0.59 | ||||
| Romania | 0.39 | 2.98 | ||||
| Serbia | 0.01 | 0.13 | ||||
| Ukraine | 0.50 | 1.25 | ||||
| Bosnia and Herzegovina | -0.01 | -0.45 | ||||
| Croatia | 0.01 | 0.58 | ||||
| Bulgaria | 0.02 | 0.35 | ||||
| Macedonia | -0.001 | -0.15 | ||||
| Albania | 0.004 | 0.55 | ||||
| Russia | 1.59 | 1.02 | ||||
| Montenegro | -0.0004 | -0.15 | ||||
| Subtotal | 2.86 | 1.02 | ||||
| The BRI region | Total | 3.73 | 0.39 | |||
Table S3 Share (%) of cultivated land converted into other land cover types, and other land cover types converted into cultivated land in the BRI region between 2000 and 2010 |
| Geographical zone | Country | Cultivated land converted OUT | Cultivated land converted IN | ||||||
|---|---|---|---|---|---|---|---|---|---|
| (to) forest | (to) grassland | (to) artificial surfaces | (to) bare land | (from) forest | (from) grassland | (from) artificial surfaces | (from) bare land | ||
| East Asia | China | 1.22 | 1.41 | 1.77 | 0.04 | 1.33 | 1.28 | 0.72 | 0.20 |
| Mongolia | 0.04 | 5.21 | 0.02 | 0.01 | 0.08 | 3.22 | 0.01 | 0.04 | |
| Subtotal | 1.22 | 1.43 | 1.76 | 0.04 | 1.32 | 1.30 | 0.72 | 0.20 | |
| Central Asia | Kazakhstan | 0.15 | 3.83 | 0.09 | 0.02 | 0.30 | 3.85 | 0.03 | 0.19 |
| Turkmenistan | 0.02 | 4.05 | 0.61 | 0.50 | 0.13 | 3.16 | 0.65 | 5.32 | |
| Tajikistan | 0.04 | 2.86 | 1.40 | 0.28 | 0.10 | 3.44 | 1.18 | 1.31 | |
| Uzbekistan | 0.01 | 2.12 | 1.61 | 0.24 | 0.10 | 1.44 | 0.96 | 0.50 | |
| Kyrgyzstan | 0.01 | 0.85 | 0.56 | 0.05 | 0.13 | 1.62 | 0.13 | 0.37 | |
| Subtotal | 0.12 | 3.51 | 0.36 | 0.08 | 0.25 | 3.42 | 0.22 | 0.58 | |
| West Asia | Armenia | 0.31 | 1.91 | 0.76 | 0.00 | 3.83 | 15.05 | 0.87 | 0.07 |
| Syrian | 0.00 | 0.12 | 0.02 | 0.00 | 0.07 | 0.02 | 0.01 | 0.00 | |
| Lebanese | 0.97 | 8.80 | 0.51 | 0.19 | 0.97 | 1.50 | 0.80 | 0.16 | |
| Afghanistan | 0.01 | 3.31 | 0.16 | 1.03 | 0.11 | 2.66 | 0.10 | 4.66 | |
| Iraq | 0.02 | 0.05 | 0.02 | 0.11 | 0.01 | 0.03 | 0.02 | 0.10 | |
| Kuwait | 0.01 | 0.09 | 1.48 | 5.08 | 0.09 | 0.41 | 0.63 | 7.69 | |
| Jordan | 0.66 | 9.03 | 0.44 | 5.65 | 0.27 | 1.28 | 0.67 | 2.89 | |
| Bahrain | 0.00 | 0.00 | 1.93 | 0.00 | 0.00 | 0.00 | 0.99 | 0.00 | |
| Geographical zone | Country | Cultivated land converted OUT | Cultivated land converted IN | ||||||
| (to) forest | (to) grassland | (to) artificial surfaces | (to) bare land | (from) forest | (from) grassland | (from) artificial surfaces | (from) bare land | ||
| Qatar | 0.05 | 0.35 | 0.25 | 3.43 | 0.02 | 0.20 | 0.04 | 4.05 | |
| Georgia | 0.73 | 2.24 | 1.13 | 0.00 | 4.84 | 4.25 | 0.92 | 0.00 | |
| Israel | 4.28 | 14.16 | 1.34 | 3.92 | 0.55 | 1.10 | 2.59 | 1.20 | |
| Iran | 0.06 | 1.67 | 0.22 | 0.85 | 0.14 | 1.80 | 0.16 | 1.34 | |
| Yemen | 0.10 | 1.17 | 0.08 | 2.93 | 0.10 | 0.11 | 0.15 | 1.08 | |
| Saudi Arabia | 0.01 | 0.09 | 0.50 | 4.75 | 0.06 | 0.36 | 0.23 | 7.26 | |
| United Arab Emirates | 0.04 | 0.00 | 0.85 | 3.98 | 0.14 | 0.02 | 0.24 | 10.11 | |
| Turkey | 0.55 | 1.17 | 0.20 | 0.00 | 0.49 | 1.12 | 0.11 | 0.00 | |
| Oman | 0.00 | 0.00 | 1.69 | 1.06 | 1.60 | 0.00 | 0.60 | 9.59 | |
| Azerbaijan | 0.22 | 2.40 | 0.70 | 0.00 | 1.61 | 11.83 | 0.71 | 0.02 | |
| Subtotal | 0.28 | 1.44 | 0.24 | 0.59 | 0.43 | 1.74 | 0.18 | 1.03 | |
| Southeast Asia | Brunei | 4.78 | 0.06 | 0.09 | 0.00 | 7.52 | 0.45 | 9.95 | 0.00 |
| East Timor | 1.05 | 8.61 | 0.00 | 7.17 | 10.52 | 6.46 | 0.82 | 0.43 | |
| Laos | 5.20 | 0.78 | 0.17 | 0.00 | 12.90 | 3.26 | 0.05 | 0.01 | |
| Singapore | 0.86 | 0.04 | 3.14 | 0.00 | 7.52 | 0.45 | 9.95 | 0.00 | |
| Cambodia | 0.24 | 0.06 | 0.16 | 0.00 | 3.50 | 0.51 | 0.17 | 0.00 | |
| Myanmar | 3.13 | 0.65 | 0.68 | 0.02 | 3.61 | 1.58 | 0.24 | 0.06 | |
| Thailand | 2.58 | 0.10 | 0.47 | 0.00 | 1.72 | 0.39 | 0.14 | 0.00 | |
| Indonesia | 3.07 | 0.29 | 0.42 | 0.00 | 4.89 | 0.27 | 0.46 | 0.00 | |
| Malaysia | 3.45 | 0.13 | 0.83 | 0.00 | 4.17 | 0.13 | 0.50 | 0.00 | |
| Vietnam | 2.96 | 0.97 | 1.04 | 0.01 | 4.18 | 1.56 | 0.70 | 0.10 | |
| Philippines | 0.98 | 0.11 | 0.22 | 0.02 | 1.12 | 0.18 | 0.19 | 0.01 | |
| Subtotal | 2.67 | 0.37 | 0.54 | 0.01 | 3.57 | 0.76 | 0.32 | 0.02 | |
| South Asia | Maldives | 0.00 | 0.00 | 0.00 | 0.00 | 0.00 | 0.00 | 0.00 | 0.00 |
| Sri Lanka | 4.46 | 0.03 | 0.18 | 0.00 | 5.48 | 1.76 | 0.32 | 0.09 | |
| Pakistan | 0.14 | 0.23 | 0.13 | 0.16 | 0.21 | 0.53 | 0.11 | 0.72 | |
| India | 0.30 | 0.29 | 0.16 | 0.09 | 0.49 | 0.31 | 0.11 | 0.08 | |
| Bangladesh | 1.89 | 0.13 | 4.13 | 0.05 | 0.30 | 0.15 | 2.64 | 0.25 | |
| Nepal | 1.26 | 0.19 | 0.05 | 0.01 | 0.99 | 0.12 | 0.05 | 0.08 | |
| Bhutan | 8.48 | 3.57 | 0.00 | 0.00 | 25.80 | 0.65 | 0.09 | 2.36 | |
| Subtotal | 0.39 | 0.27 | 0.30 | 0.09 | 0.51 | 0.33 | 0.20 | 0.16 | |
| North Africa | Egypt | 0.07 | 0.02 | 1.29 | 2.21 | 0.03 | 0.01 | 0.84 | 10.26 |
| Subtotal | 0.07 | 0.02 | 1.29 | 2.21 | 0.03 | 0.01 | 0.84 | 10.26 | |
| Central and Eastern Europe | Estonia | 1.89 | 0.48 | 0.46 | 0.00 | 2.05 | 0.20 | 0.50 | 0.00 |
| Latvia | 3.07 | 0.10 | 0.36 | 0.00 | 1.74 | 0.03 | 0.37 | 0.00 | |
| Lithuania | 2.15 | 0.08 | 0.67 | 0.00 | 1.45 | 0.03 | 0.65 | 0.00 | |
| Belarus | 3.62 | 1.32 | 1.01 | 0.00 | 1.50 | 0.97 | 1.06 | 0.00 | |
| Geographical zone | Country | Cultivated land converted OUT | Cultivated land converted IN | ||||||
| (to) forest | (to) grassland | (to) artificial surfaces | (to) bare land | (from) forest | (from) grassland | (from) artificial surfaces | (from) bare land | ||
| Poland | 1.09 | 0.16 | 0.69 | 0.00 | 0.95 | 0.04 | 0.40 | 0.00 | |
| Czech | 1.74 | 0.05 | 0.77 | 0.00 | 1.62 | 0.08 | 0.69 | 0.00 | |
| Slovakia | 0.80 | 0.01 | 0.75 | 0.00 | 0.45 | 0.01 | 0.65 | 0.00 | |
| Moldova | 0.65 | 0.73 | 1.14 | 0.00 | 0.33 | 0.85 | 1.43 | 0.00 | |
| Hungary | 0.71 | 0.03 | 0.49 | 0.01 | 0.66 | 0.16 | 0.39 | 0.00 | |
| Slovenia | 4.76 | 0.02 | 1.13 | 0.01 | 4.23 | 0.03 | 0.81 | 0.01 | |
| Romania | 1.00 | 0.13 | 0.91 | 0.01 | 1.00 | 0.12 | 0.96 | 0.02 | |
| Serbia | 1.04 | 0.05 | 0.44 | 0.00 | 0.99 | 0.29 | 0.37 | 0.00 | |
| Ukraine | 0.89 | 0.74 | 0.74 | 0.00 | 0.61 | 1.83 | 0.84 | 0.01 | |
| Bosnia and Herzegovina | 3.11 | 0.06 | 0.50 | 0.01 | 2.65 | 0.07 | 0.39 | 0.01 | |
| Croatia | 1.35 | 0.02 | 0.61 | 0.04 | 1.47 | 0.02 | 0.58 | 0.04 | |
| Bulgaria | 0.97 | 0.13 | 0.75 | 0.01 | 1.13 | 0.22 | 0.78 | 0.01 | |
| Macedonia | 1.45 | 0.05 | 0.53 | 0.00 | 1.54 | 0.05 | 0.35 | 0.00 | |
| Albania | 1.20 | 0.73 | 0.48 | 0.01 | 1.42 | 0.86 | 0.58 | 0.03 | |
| Russia | 1.10 | 2.05 | 0.34 | 0.00 | 1.23 | 2.57 | 0.32 | 0.02 | |
| Montenegro | 2.28 | 0.19 | 0.64 | 0.00 | 2.38 | 0.23 | 0.40 | 0.00 | |
| Subtotal | 1.22 | 1.33 | 0.52 | 0.00 | 1.13 | 1.76 | 0.50 | 0.01 | |
| The Belt region | Subtotal | 0.21 | 2.27 | 0.28 | 0.39 | 0.35 | 2.41 | 0.19 | 0.85 |
| The Road region | Subtotal | 1.04 | 0.30 | 0.38 | 0.09 | 1.38 | 0.45 | 0.25 | 0.25 |
| The BRI region | Total | 1.01 | 1.13 | 0.70 | 0.10 | 1.14 | 1.30 | 0.41 | 0.26 |
Table S4 Changing rate (%) in multi-cropping index, and fragmentation index of seven geographical zones and each country in the BRI region between 2000 and 2010 |
| Geographical zone | Country | MCI changing rate | FI changing rate | |||||
|---|---|---|---|---|---|---|---|---|
| East Asia | China | 6.01 | 2.17 | |||||
| Mongolia | 27.77 | -2.82 | ||||||
| Subtotal | 6.06 | 2.16 | ||||||
| Central Asia | Kazakhstan | 22.71 | -17.35 | |||||
| Turkmenistan | -2.76 | -8.55 | ||||||
| Tajikistan | 0.62 | 15.53 | ||||||
| Uzbekistan | 1.45 | 14.44 | ||||||
| Kyrgyzstan | -3.21 | -2.20 | ||||||
| Subtotal | 14.72 | -14.28 | ||||||
| West Asia | Armenia | 4.11 | -0.34 | |||||
| Syrian | 6.40 | -0.97 | ||||||
| Lebanese | -5.49 | 3.82 | ||||||
| Afghanistan | 20.06 | 2.13 | ||||||
| Geographical zone | Country | MCI changing rate | FI changing rate | |||||
| Iraq | -1.76 | 0.95 | ||||||
| Kuwait | 87.13 | 19.41 | ||||||
| Jordan | 32.04 | -21.81 | ||||||
| Bahrain | 36.26 | 13.58 | ||||||
| Qatar | -29.94 | 0.00 | ||||||
| Georgia | -45.10 | 1.62 | ||||||
| Israel | 21.05 | -21.72 | ||||||
| Iran | 18.88 | -0.28 | ||||||
| Yemen | 41.95 | -49.59 | ||||||
| Saudi Arabia | -30.48 | -1.40 | ||||||
| United Arab Emirates | -11.03 | 36.70 | ||||||
| Turkey | -9.60 | 34.67 | ||||||
| Oman | -19.38 | 3.42 | ||||||
| Azerbaijan | 19.35 | -1.89 | ||||||
| Subtotal | 2.21 | 4.19 | ||||||
| Southeast Asia | Brunei | -25.74 | 22.88 | |||||
| East Timor | 20.44 | -1.78 | ||||||
| Laos | 23.36 | -16.52 | ||||||
| Singapore | 49.09 | -40.20 | ||||||
| Cambodia | 54.40 | -2.88 | ||||||
| Myanmar | 39.15 | -8.26 | ||||||
| Thailand | 15.37 | 1.09 | ||||||
| Indonesia | 24.42 | 52.22 | ||||||
| Malaysia | 9.30 | -6.67 | ||||||
| Vietnam | 7.55 | -7.46 | ||||||
| Philippines | 9.39 | -8.32 | ||||||
| Subtotal | 20.40 | 10.47 | ||||||
| South Asia | Maldives | 0.00 | 0.00 | |||||
| Sri Lanka | 7.03 | -12.32 | ||||||
| Pakistan | 2.13 | 3.66 | ||||||
| India | 8.82 | -30.71 | ||||||
| Bangladesh | 8.16 | 10.11 | ||||||
| Nepal | 7.44 | -0.57 | ||||||
| Bhutan | -22.18 | 129.89 | ||||||
| Subtotal | 7.98 | -16.67 | ||||||
| North Africa | Egypt | 2.35 | -5.91 | |||||
| Subtotal | 2.35 | -5.91 | ||||||
| Central and Eastern Europe | Estonia | -24.44 | 9.85 | |||||
| Latvia | 16.04 | 58.77 | ||||||
| Lithuania | -6.02 | 69.96 | ||||||
| Geographical zone | Country | MCI changing rate | FI changing rate | |||||
| Belarus | -9.55 | 3.59 | ||||||
| Poland | -7.45 | 133.17 | ||||||
| Czech | -16.51 | 89.39 | ||||||
| Slovakia | -11.25 | 6.66 | ||||||
| Moldova | -11.01 | 75.19 | ||||||
| Hungary | -20.58 | -9.42 | ||||||
| Slovenia | 0.79 | 17.63 | ||||||
| Romania | -4.76 | 60.83 | ||||||
| Serbia | 93.08 | 28.88 | ||||||
| Ukraine | 3.38 | 77.19 | ||||||
| Bosnia and Herzegovina | 2.53 | 38.88 | ||||||
| Croatia | -24.36 | 74.29 | ||||||
| Bulgaria | 2.76 | 113.41 | ||||||
| Macedonia | -15.55 | 34.42 | ||||||
| Albania | 24.88 | 63.98 | ||||||
| Russia | -24.33 | 6.40 | ||||||
| Montenegro | -28.60 | 89.90 | ||||||
| Subtotal | -13.44 | 23.41 | ||||||
| The BRI region | Total | 4.27 | 6.51 | |||||
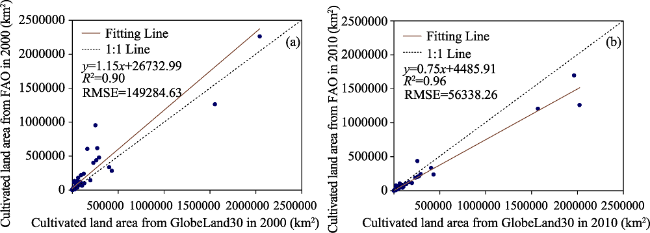
Figure S1 Comparison between the cultivated land area of GlobeLand30 and FAOSTAT in 2000 (a) and 2010 (b) |
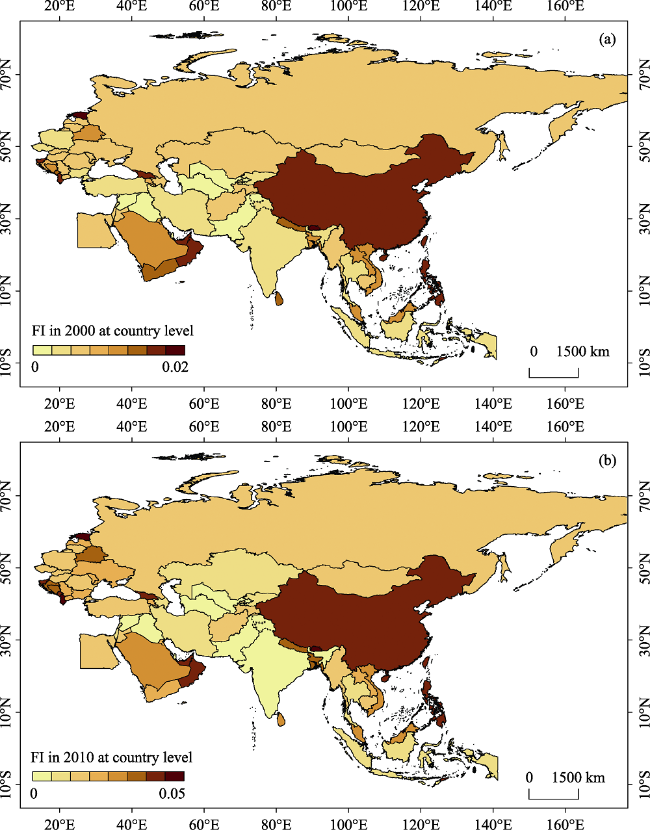
Figure S2 Fragmentation index of cultivated land in 2000 (a) and 2010 (b) in the BRI region at a country level |
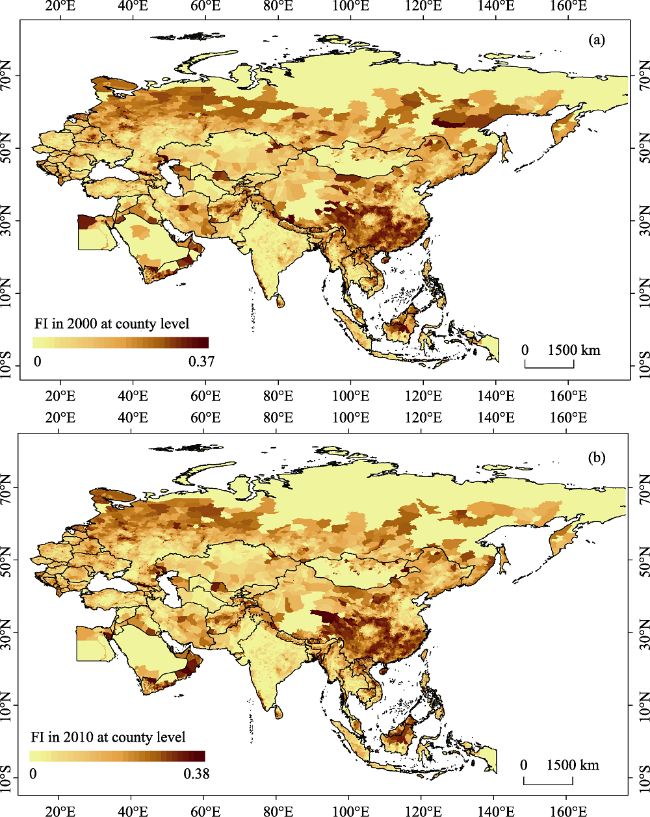
Figure S3 Fragmentation index of cultivated land in 2000 (a) and 2010 (b) in the BRI region at a county level |
The authors have declared that no competing interests exist.
| [1] |
|
| [2] |
|
| [3] |
|
| [4] |
|
| [5] |
|
| [6] |
|
| [7] |
|
| [8] |
|
| [9] |
|
| [10] |
|
| [11] |
|
| [12] |
|
| [13] |
|
| [14] |
|
| [15] |
|
| [16] |
|
| [17] |
|
| [18] |
|
| [19] |
|
| [20] |
|
| [21] |
|
| [22] |
|
| [23] |
|
| [24] |
|
| [25] |
|
| [26] |
|
| [27] |
|
| [28] |
|
| [29] |
|
| [30] |
|
| [31] |
|
| [32] |
|
| [33] |
|
| [34] |
|
| [35] |
|
| [36] |
|
| [37] |
|
| [38] |
|
| [39] |
|
| [40] |
|
| [41] |
|
| [42] |
|
| [43] |
|
| [44] |
|
| [45] |
|
| [46] |
|
| [47] |
|
| [48] |
|
| [49] |
|
| [50] |
|
| [51] |
|
| [52] |
|
| [53] |
|
| [54] |
|
| [55] |
|
| [56] |
|
| [57] |
|
| [58] |
|
| [59] |
|
| [60] |
|
| [61] |
|
| [62] |
|
| [63] |
|
/
| 〈 |
|
〉 |