Special Issue: Land system dynamics: Pattern and process

Global prioritisation of renewable nitrogen for biodiversity conservation and food security

  • Eisner ROWAN , 1 ,
  • SEABROOK Leonie 2 ,
  • MCALPINE Clive 2
Expand
  • 1. University of Cambridge Conservation Research Institute, Cambridge CB2 3QZ, UK
  • 2. Centre for Biodiversity and Conservation Science, UQ, QLD 4072, Australia

Author: Eisner Rowan, E-mail:

Received date: 2017-02-20

  Accepted date: 2017-09-15

  Online published: 2018-11-20

Copyright

Journal of Geographical Sciences, All Rights Reserved

Abstract

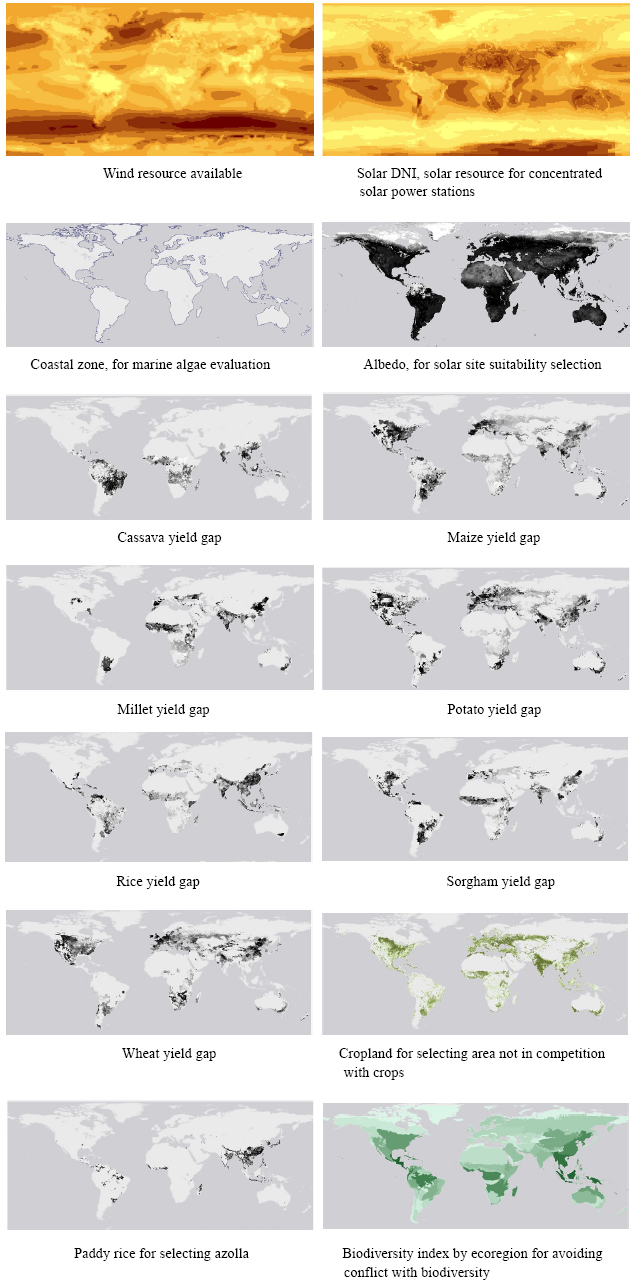
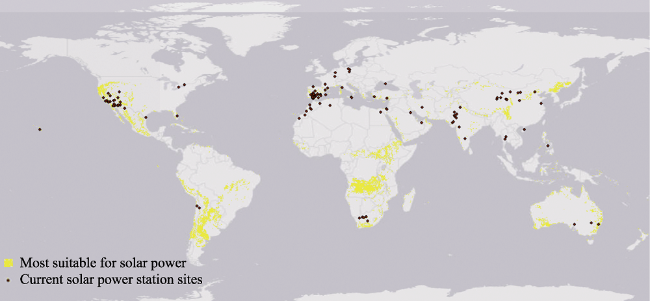
The continuing use of petrochemicals in mineral nitrogen (N) production may be affected by supply or cost issues and climate agreements. Without mineral N, a larger area of cropland is required to produce the same amount of food, impacting biodiversity. Alternative N sources include solar and wind to power the Haber-Bosch process, and the organic options such as green manures, marine algae and aquatic azolla. Solar power was the most land-efficient renewable source of N, with using a tenth as much land as wind energy, and at least 100th as much land as organic sources of N. In this paper, we developed a decision tree to locate these different sources of N at a global scale, or the first time taking into account their spatial footprint and the impact on terrestrial biodiversity while avoiding impact on albedo and cropland, based on global resource and impact datasets. This produced relatively few areas suitable for solar power in the western Americas, central southern Africa, eastern Asia and southern Australia, with areas most suited to wind at more extreme latitudes. Only about 2% of existing solar power stations are in very suitable locations. In regions such as coastal north Africa and central Asia where solar power is less accessible due to lack of farm income, green manures could be used, however, due to their very large spatial footprint only a small area of low productivity and low biodiversity was suitable for this option. Europe in particular faces challenges because it has access to a relatively small area which is suitable for solar or wind power. If we are to make informed decisions about the sourcing of alternative N supplies in the future, and our energy supply more generally, a decision-making mechanism is needed to take global considerations into account in regional land-use planning.

Cite this article

Eisner ROWAN , SEABROOK Leonie , MCALPINE Clive . Global prioritisation of renewable nitrogen for biodiversity conservation and food security[J]. Journal of Geographical Sciences, 2018 , 28(11) : 1567 -1579 . DOI: 10.1007/s11442-018-1561-2

1 Introduction

Modern agriculture is highly dependent on petrochemicals, especially for nitrogen (N) fertiliser which is made using natural gas. The use of petrochemicals to produce fertiliser is unsustainable for two main reasons. First, they are non-renewable and consumption is growing faster than the supply due to both growth in human populations and per capita consumption with increased living standards (Kruger, 2006). Second, their use emits greenhouse gases and aggressive mitigation measures such as committed to in the Paris Agreement may constrain their use (Thomas et al., 2016). If N use were to be constrained, either through access or through price, then agriculture productivity would fall and more land would be required to maintain food production. This agricultural extensification threatens global biodiversity, since the conversion of native ecosystems to agriculture has long been the major threat to biodiversity.
Nitrogen fertiliser can be produced from other sources (Dunn et al., 2012). These include replacing the existing petrochemical power supply for the Haber-Bosch process with renewable energy supplies from solar or wind power, and using organic sources of nitrogen. However, these sources would all use some additional land, which again would potentially impact biodiversity. An assessment of alternative sources of renewable N suggested that using solar energy to power the existing Haber-Bosch industrial process was the most land-efficient option, with a footprint one tenth that of wind energy and one thousandth that of green manures (Eisner et al., 2016). A cost-effectiveness prioritisation would be unable to differentiate between options because the difference in footprint is so great that this aspect would dominate footprint-to-cost ratios globally, meaning that solar would always be selected over other options, at any land price and any solar resource availability. However, there are factors other than land use which determine the choice of N source. These factors include the resource availability and the affordability to the landholder (Chianu and Tsujii, 2004). There are also factors which influence the desirability of the source of N such as the competition for agricultural land and biodiversity conservation and the impact on radiative forcing (Nemet, 2009; Rosenthal, 2010; Turney and Fthenakis, 2011). The extreme variations in the area of land needed to produce alternative sources of nitrogen make it essential that we understand the implications of renewable N fertilisers for regional land use planning.
This paper aims to prioritise renewable sources of nitrogen with the goal of minimising the impact on biodiversity through agricultural extensification and the competition for arable land, given the distribution of practical resource constraints. The N sources considered include the most land-efficient sources of renewable energy to power the existing Haber-Bosch infrastructure (solar and wind); terrestrial, freshwater and marine organic fertilisers (alfalfa, azolla and seaweed); and the use of crop residues.

2 Methods and data

The steps used to map and prioritise N sources are given in Figure 1. Firstly, given the aims of preserving biodiversity while maintaining food security, data sources of N and thresholds were identified from the literature, where available (Table 1). The data needed to map these factors globally was sourced. An algorithm was developed which mapped the highly suitable regions for each N source (Figure 2). These were then mapped to produce a map of the most suitable regions for each source of N. Areas of major overlap were combined into a collective category, and a global map of most suitable N sources was created.
Table 1 Data sources used for mapping N source prioritisation.
Variable Reason for inclusion Data Threshold Reference
Biodiversity To assess impact Ecoregional biodiversity indices 0.1064 Kier et al., 2009
Commercial cropland Space constraint for N production Cropland-yield gap >20% Monfreda et al., 2008
Green manure Farm income to purchase fertilisers. Yield gap > area required to grow N Yield gap 0.513 Monfreda et al., 2008
Sun Most land efficient DNI for concentrated solar NASA SWERE 4.93 NASA, 2011
Deign, 2012
Wind Second most land efficient NASA SSE 5.5 ms-1 NASA, 2005
Blankenhorn and
Resch, 2014
Albedo Solar power can contribute to global warming at high albedo sites Albedo (1 month) Reflectance values
lowest 20% (albedo 0.35)
NASA Earth Observations, 2016
Nemet, 2009
Wetland rice Azolla valuable N source, no land cost Presence/absence Salmon et al., 2015
Aquaculture Data not found N.A.
Seaweed No land cost Coastal zone 40km Natural Earth, 2016
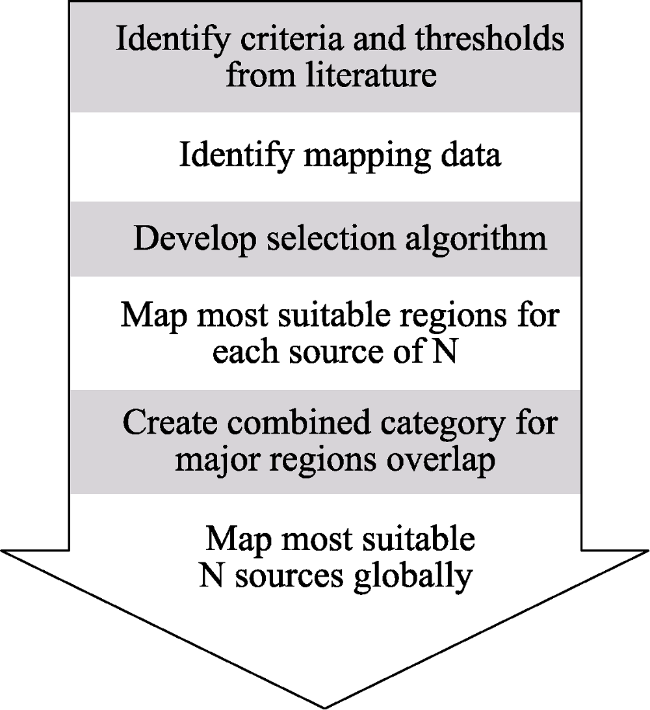
Figure 1 Process for developing maps for selecting sources of N production most suitable at each location
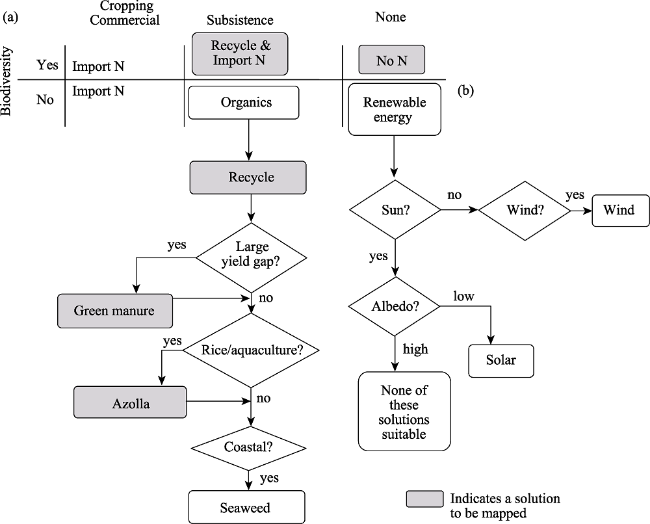
Figure 2 Decision matrix (a) and decision trees (b) for siting N sources

2.1 Data sources

Data sources for resource availability, constraints and suitability thresholds used for mapping N source prioritisation are given in Table 1. See supplementary data for source maps. The reference is provided for the thresholds applicable to the variable and for the datasets used. The data sources were rasterised based on 1 km cropland mapping (Monfreda et al., 2008). The data sources are for the period 2005-2016. They are just to project a hypothetical future scenario, and mostly reflect physical characteristics such as solar and wind resources, albedo and distance to the coast which would be unlikely to change on a decadal time scale. One exception might be yield gaps, which are used for selecting suitability for green manures. This is based on 2008 data (Monfeda et al.).

2.2 Decision process for selecting alternative sources of N

Using solar energy to power N production is most land-efficient renewable method and would allow the ‘sparing’ of land for other purposes such as growing food and protecting biodiversity (Scheidel and Sorman, 2012; Eisner et al., 2016). Solar is at least ten times more land efficient than the alternatives for the production of N. But there are other factors which might constrain its use. Not everywhere has sufficient sunshine, but may have wind resources, and in some regions the land would be better used for agriculture or biodiversity conservation. Also, some farming produces insufficient income to purchase N produced using solar power making it less accessible to subsistence farmers (Chianu and Tsujii, 2004). These farmers may choose other options they can access without cost, including green manures, waste recycling and, where located near the coast, marine algae, especially in areas with high marine N (Cavagnaro, 2015). In biodiverse regions, subsistence farmers impact native ecosystems when they use land for N production, so importing N for these farmers has the potential to limit their impacts (Matthews and De Pinto, 2012). For these reasons, it is necessary to consider how to prioritise the location of each alternative source of N.
Figure 2 shows the logical process for deciding between sources of N for each location which combines a decision matrix and a decision tree. First, in the decision matrix options are selected on the basis of cropland use and the biodiversity level (Figure 2a). Cropland is better used for food production than for N production to maintain food supply, so in those areas N should be imported, as is currently practiced. Very unproductive agricultural land produces insufficient income to purchase N and so farmers need to produce their own organic fertiliser on-farm (Crucefix, 1998). In areas of high biodiversity, the land used for N production competes with biodiversity, so N should be imported, and farm and household residues recycled, where feasible. If there is no cropping currently present and low biodiversity then the land can be used for renewable energy production with low impact. If such land has high biodiversity then the land should be prioritised to preserve this, and not used for renewable energy production.
Figure 2b shows a decision tree for selecting organic fertilisers and the renewable energy source for powering N production. Organics are best suited for subsistence farmers in low biodiversity areas due to their affordability but high land requirements. Recycling organic matter is generally beneficial, where feasible. If there is a very large yield gap then green manures can increase overall productivity. Azolla is a significant N source in rice production and coastal areas have access to seaweed.
Renewable energy systems are best sited in low biodiversity areas unsuitable for cropping. Sites with low insolation and high wind are suitable for wind power. Sites with adequate insolation and low albedo are suitable for solar. Otherwise, none of these options are suitable, but there may be suitable possibilities in the future or solutions not considered here.

3 Results and discussion

First we present global spatial analysis of the sites that were most suitable for each individual way of sourcing N, based on the criteria shown in the decision matrix and trees. These were, for solar, competition with biodiversity, cropping, solar resource and albedo; for wind, locations where solar would be suitable but there is insufficient sun but sufficient wind; for green manure, cropping has a large yield gap; azolla is suitable in wetland rice and seaweed in coastal subsistence farming. Then we combine the individual means of sourcing N into a global map.

3.1 Solar power

Areas were selected as suitable for solar power because they have sufficiently high insolation to efficiently power concentrated solar power stations (Deign, 2012). Solar thermal power is chosen over PVs because they perform best in low rainfall areas and so tend to compete less with biodiversity and cropping without additional policy intervention (Philibert, 2005). Solar thermal also has very much lower embodied energy and fewer material constraints for manufacture, with the silver used in the mirrors as the major material constraint (Pihl et al., 2012). Solar thermal plants are currently also slightly more land efficient. Because of their flexibility of location and scale, there are currently about 30 times the installed capacity in PV compared to concentrated solar.
Sites suitable for solar power are chosen on the basis of not displacing cropping, having low levels of biodiversity, and having sufficiently low albedo so that the increased radiative forcing does not significantly undo the benefits of the reduced greenhouse gas emissions (Nemet, 2009).
Figure 3 shows the 5.7 million km2 of land best suited to solar power, taking into account solar resource availability, conflict with biodiversity and cropping and reducing albedo. The most suitable locations are mostly in the Southern Hemisphere, western North America and coastal Far East. The location of solar power stations are also shown.
Figure 3 Sites most suitable for solar power, and the location of existing solar power stations
This area represents over 100 times the area needed to power global N production and more than four times the area needed for the total world energy supply (Scheidel and Sorman, 2012). To supply N requirements of USA would require 30,000 MW (Leighty, 2008), which is about 18 times the installed solar capacity. Transmission losses due to distance from markets would be compensated for by having a 30% efficiency gain compared to efficiency losses of fossil fuel combustion (Jacobson and Delucchi, 2011).
Currently only three solar power stations are in the regions most suited to solar power (Arizona, New South Wales and South Australia), although many could be in more suitable places if they were moved slightly. Several of the locations with the best solar resource and least impacts on biodiversity are remote from major energy markets or large energy grids, as is the case in central southern Africa, in Chile and Argentina and in Western Australia (Li, 2013). Other regions have their power stations better aligned with suitability, such as in southern Spain and the south-western USA.

3.2 Wind

Figure 4 shows the 8.3 million km2 of land best suited to wind power globally, mostly at very low and very high latitudes, and in Bolivia, Central Asia and Japan. These regions are unsuited to solar power, they have very good wind resources, low biodiversity and would not be competing with cropping. Most other global wind mapping only takes into account the wind resource available and not land-use considerations (eg Grassi et al., 2015).
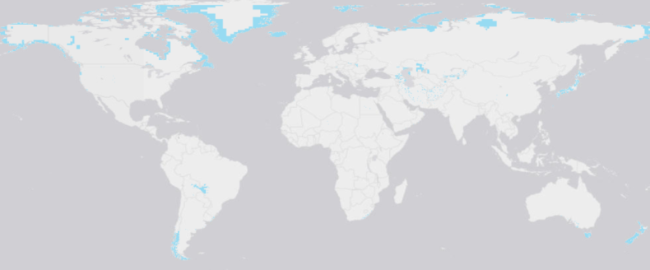
Figure 4 Sites most suitable for wind power. These are mostly at very high and very low latitudes.

3.3 Organic sources of N

The regions selected for organics (Figure 5) tend to be subsistence systems which are not part of the cash economy and lack the income to buy fertiliser. Green manures were selected for the relatively few areas of cropland where the yield gap is so high that their use would still increase their overall land use efficiency (Table 1) and where there is little competition with biodiversity. Marine algae are most suited in low-yield systems within easy transport distance of the ocean (Antoine De Ramon and Iese, 2014; Florentinus et al., 2008). Azolla is a useful source of N in wetland rice production and aquaculture (Shridhar, 2012), but only wetland rice is included here because terrestrial aquaculture areas are too small for global mapping.
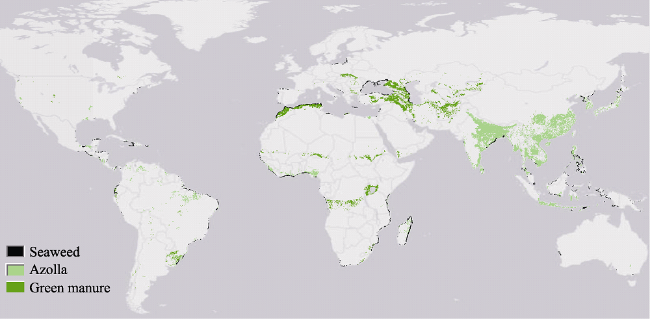
Figure 5 Locations suitable for organic nitrogen sources: green manures, seaweed and azolla
The regions which are most suitable for organic N sources, comprise 2.2 million km2 for green manure in the areas with the lowest yields, 0.85 million km2 of coastal subsistence farming suited to marine algae use, and azolla in 6.0 million km2 of wetland rice production. Yields would be able to be at least maintained with N supplied in this way, although some of these regions would additionally benefit from importing N (Figure 6).
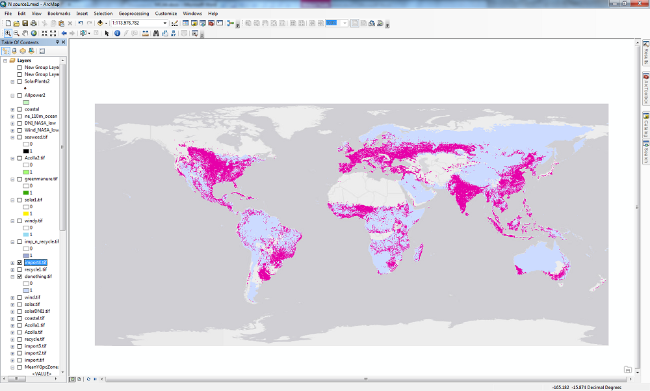
Figure 6 Regions where it is preferable to import N rather than compete with crops or biodiversity, or where high biodiversity makes N production unsuitable
The N-efficiency of green manures assumes that the land is used solely for manure production. There are management practices, such a zero-till seed drilling (Fischer et al., 2012), which produce some N without consuming additional land, but these practices have not been included here.

3.4 Cropland and high biodiversity regions

Figure 6 shows regions where competition with biodiversity or cropping makes N production undesirable. For cropland in high biodiversity regions (29.8 million km2 globally), N would best be brought in from other regions to reduce cropland expansion into biodiverse areas, and it is preferable to retain natural ecosystems than to convert the land to N production. Assistance would be needed to supply subsistence areas with N, at suitable levels to reduce encroachment, since their income is insufficient to purchase N for themselves. Recycling agricultural residues makes sense in all agricultural systems, and recycling household wastes would be beneficial in subsistence systems, where feasible. If there is no cropland, high biodiversity areas should have no N production or importation (Do nothing) to retain their conservation values.
Both cropland and biodiversity regions are based on existing locations which might change under future climates.

3.5 Regions with no suitable options

Some areas, including northern Canada, North Africa, large parts of Central Asia and inland eastern Australia are unsuitable for any of these sources due to a combination of factors including lack of solar or wind resource or high albedo (Figure 7). None of the options in this study are suitable in these areas, however, alternatives which do not adversely interact with albedo (eg geothermal) may be suitable in some places. The use of recently developed white PV panels, produced to increase albedo, may result in a net increase radiative forcing in desert regions and a reduction of the urban heat island effect, although at an efficiency cost (Heinstein et al., 2015).
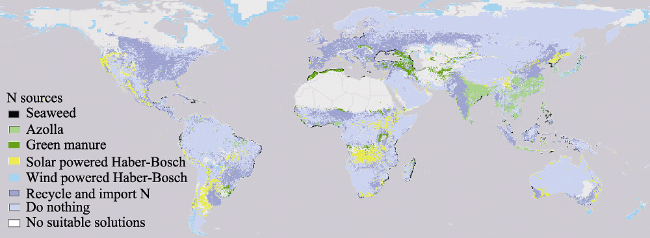
Figure 7 Sources of N for cropping prioritised for biodiversity and cropland conservation. Solar is the most land-efficient option, but is highly suitable in relatively few regions due to completion with biodiversity or cropping or reducing the albedo of the site, contributing to global warming. Organics are very land inefficient for N production so are only suited for use on land with low productivity and low biodiversity.

3.6 Prioritisation of N sources

Figure 7 shows the preferred N source at each location across the globe. Mostly options do not overlap because the decision tree prioritises the best option for a given location. The main exception to this is recycling which is combined with and importing N which are combined in Figure 7. Recycling wastes that are produced on-site uses no additional land area and improves soil condition so is desirable wherever it is feasible. For household waste this may only be the case for small-holders, because of transport costs. Although Figure 7 presents organics and mineral N as alternatives, it may be optimal to combine organics with mineral N (compare with Figure 6). Importing N from production sites that are highly cost- and land-efficient may benefit many areas suitable for organics by increasing the productivity of organic systems. The use of organic fertilizers could reduce overall N-use and the resulting pollution of the biosphere and increase soil health, soil water-holding capacity and drought tolerance in conventional commercial systems (Ali et al., 2011).
There are risks with supplying N to subsistence farmers in biodiverse regions. There is the risk of becoming dependent on a finite resource, which would result in food insecurity if the supply discontinued. This is particularly the case if supplying N were to increase the carrying capacity in the short-term to levels which could not be supported without it. Also the increased efficiency of agriculture using mineral N can tend to make production more profitable, increasing areas under production. Complementary planning measures are needed to reduce this risk (Phalan et al., 2016). N pollution of the most sensitive regions is also a risk, unless the N is managed carefully.
With most area in the prioritised map (Figure 7) selected for non-production of N (ie, either ‘Do nothing’, ‘Import N or ‘No suitable solutions’), there is relatively little area highly suitable for any of these options. However, there are sufficient highly suitable areas to meet all N needs using the best option available, and even sufficient area selected for solar energy to meet total energy needs.
Prioritisation based on cost effectiveness is often suggested to optimally allocate resources (eg Wilson et al., 2006). The prioritisation used in this paper did not include costs for a number of reasons. First, perhaps half of the world’s people and about a third of the agricultural land is under management systems outside the economic system, so a cost-effectiveness prioritisation is unhelpful in these systems. In order to include these systems, the prioritisation needed to target factors accessible to those making the decisions. Second, the overall aim of the research was to minimise pressure on biodiversity and food insecurity. Finally, price was the most volatile factor in these systems, rapidly changing with markets and management practices, and so results based on price are not very reliable.

3.7 Regions of interest

Three regions can draw on the full range of N sources without high negative impacts (Figure 8). The Caucasian region between the Black Sea and The Caspian Sea has much cropland which is of such low productivity that yields could be improved with green manures, and high wind speeds suited to wind power south of the Greater Caucasus Mountains between the Black Sea and the Caspian Sea. Much of the coastal areas could be suitable for algae use. The Nile delta could usefully use Azolla in rice production with Cyprus and eastern Caspian coastal areas suitable for solar. Azerbaijan alone has the potential of about 800-1500 MW of economically feasible wind power, the main barriers being regulatory (Safarov, 2015). The first wind farm in Georgia, rated at 20.7 MW, began operations in 2016 (Caspian Energy Newspaper, 2016).
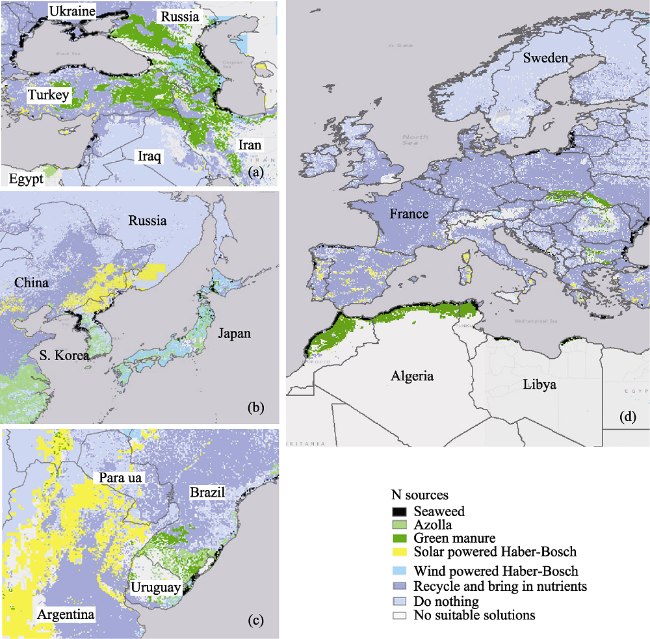
Figure 8 Three regions with a wide range of options for sourcing N, a) Caucasia and surrounding region, b) Japan, China, Koreas and c) Uruguay region. In contrast, Europe (d) has a paucity of options. Europe has little area highly suitable for solar or wind because of competing land use and biodiversity and lack of solar resource. The Sahara desert is not selected for solar power because the decrease in albedo would contribute to global warming.
In the Far East, Japan has good wind resources and, together with South Korea and China south of Shanghai, has opportunities to use azolla in rice production, which is often practiced in China (Biswas et al., 2005). North Korea has very good solar resources, some of which has already been exploited with international assistance (Yi et al., 2011). Its coastal regions suit algae use, which they harvest (Chennubhotla et al., 2013). North Korea has 2.8% of the world’s aquaculture but chronic food and energy insecurity. The region produces over 10 million tonnes a year of marine algae, mostly for food, with its main use as fertiliser in India.
Although much of Uruguay has no suitable N sources, its bordering regions are rich in resources. There is abundant solar north western Argentina. Its border region with Brazil to the north would benefit from azolla in wetland production and green manures and in the coastal area seaweed could be used, with the southern coastal zone also suiting wind.
By contrast, the European region has relatively poor access to renewable N sources. Algae may be viable along the coast of the Black Sea, parts of the Iberian Peninsula, coastal Poland, parts of the Baltic states and North Africa, which is also suitable for green manure because of its low productivity. Small areas of the Mediterranean in Corsica and Sardinia, southern Italy, Greece and Turkey and in Portugal and Spain have solar resources, which in Spain are largely exploited. Coastal northern Russia and Norway may suit wind but many otherwise suitable areas are excluded because of conflicts with wildlife or cropping. Plans such as Desertec which aim to provide Europe with power using solar panels based in the Sahara is problematic due to the warming effect of decreased albedo (Backhaus et al., 2015; Nemet 2009). The benefits from reduced GHGs by using solar power are about 30 times the heating caused by solar panels when well placed, but the heating can increase more than three-fold by placing solar collectors in the Sahara Desert.

3.8 Significance, contribution and limitations

Renewable nitrogen fertiliser has not been spatially prioritised before. This is important in order to be able to maintain food security and biodiversity as we move away from fossil fuels. The 2008 US Farm Bill allocation US$1 million per year in 2008-2009 for a study of the feasibility of producing N from renewable energy (Capehart and Stubbs, 2007). Leighty and Holbrook (2008) conducted a comparison of H2 and NH3 as potential storage for wind power, noting that NH3 can also be used for fertiliser. Leighty (2010) also investigated the possibility of transmission of both fuels via pipeline and concluded both the fuel and pipeline technology would accelerate conversion to renewables. It has also been found that the efficiency of NH3 production could be increased by using humidified carbon monoxide as a feedstock instead of hydrogen (Jiang and Aulich, 2008). There is also a Swedish study which compared a variety of technologies for producing renewable N and found that wind powered N costs about 2.4 times the current price. The cheapest renewable technology, thermochemical gasification of biomass is not yet commercially available. They also found that renewable N reduced the GHG emissions incurred by perhaps a factor of ten (Tallaksen et al., 2015).
This study has been conducted at a global scale and the maps are not at sufficiently high resolution to be used locally, especially the biodiversity index. Rather, the presented method could be applied locally using local datasets and with the incorporation additional, locally important criteria.
This paper used a threshold approach to determine suitability of areas for each source of N. It would be beneficial to develop a suitability scale for each so that maps of relative suitability could be produced. It would also be useful to consider industrialised sources of N such as waste from intensive animal industries and municipal waste streams, and mechanisms of treating waste so that the N content can be reused.

4 Conclusion

This chapter has spatially prioritised methods for producing nitrogen for crop production with the goal of minimising impact on biodiversity and reducing competition with cropping, taking into account solar and wind resource constraints. Although solar power is the most land-efficient way to power N production, there are relatively few areas which are very suitable for solar power stations, and some of these are far from energy markets and grids. Siting ammonia production in such locations could contribute de facto energy storage into the system. Alternative ways of producing N are also suitable in relatively small areas with many regions continuing to benefit from bringing in N from those more suitable to its production, as they do currently. Biodiversity would benefit if low yield farms were supplied with N, to reduce encroachment onto natural ecosystems, although care is needed to prevent unwanted side-effects.

Acknowledgements

We appreciate those who supplied data, The University of Queensland, who supported the research, Alvaro Sala who taught me GIS and Paul Lawrence and The Queensland Government for getting me interested in spatial prioritisation.

Appendix Input data layers for N production site selection

The authors have declared that no competing interests exist.

[1]
Ali K, Munsif F, Zubair M et al., 2011. Management of organic and inorganic nitrogen for different maize varieties.Sarhad J. Agric., 27(4): 525-529.Field trial to evaluate the response of different maize varieties to organic and inorganic nitrogen was conducted at Agricultural Research Farm, Agricultural University Peshawar during summer 2010. The experiment was consisted of eleven nitrogen treatments (Control, Nitrogen alone, FYM alone, Poultry manure alone, Green manure alone, 50% N (Urea) + 50% FYM, 50% N (Urea) + 50% PM, 50 % N (Urea) + 50% GM, 50% PM + 50% FYM, 50% PM + 50% GM and 50% GM + 50 % FYM) and two maize varieties (Azam and Jalal). Nitrogen treatments (N) were kept in the sub plots whereas varieties treatment (V) was allotted to the main plots. The experiment was carried out in randomized complete block design with split plot arrangement having four replications. The results revealed that varieties and nitrogen treatment significantly affected all parameters under study. Interactions between N x V were remained non significant for all parameters. Application of mineral N with organic manure in combination resulted in increased yield and yield components. Application of half Mineral N and half PM produced higher plant height, higher ear length, grain ear-1, thousand grain weight, grain yield and biological yield of maize. Cultivars influenced yield and yield components of maize and higher maximum plant height, grains ear-1, ear length, thousand grain weight, grain yield and biological yield was produced by Jalal variety. It was concluded that Organic and inorganic N application in combination Jalal cultivar resulted in higher yield and yield components of maize and hence recommend for higher productivity.

DOI

[2]
Antoine De Ramon N Y, Iese V, 2014. Marine plants as a sustainable source of agri-fertilizers for small island developing states (SIDS).Impacts of Climate Change on Food Security in Small Island Developing States, 280.Climate change is forcing farmers in Small Island Developing States to find novel methods to maintain crop productivity. Past practices using chemical fertilizers and poor waste management severely damaged many coastal areas, leading to an ecosystem shift towards algal dominance. In this chapter, the authors propose an approach to deal with this issue by devising methods which divert excess marine plant biomass into agricultural uses through conversion of the biomass to solid and liquid fertilizers. Seaweed-based fertilizers have already been tried with much success on crops in some developed countries, but these are expensive to import into Pacific Islands. The authors also suggest empowering local communities with the knowledge to convert marine plant biomass into ecologically friendly fertilizers. They will be able to save on the purchase of commercial fertilizers detrimental to the environment, while at the same time reducing the spread of seaweeds on their coral reefs. Farmers' incomes will increase.

DOI

[3]
Backhaus K, Gausling P, Hildebrand L, 2015. Comparing the incomparable: Lessons to be learned from models evaluating the feasibility of Desertec.Energy, 82: 905-913.61Desertec's four main feasibility calculation models are limited in comparability.61Comparability is restricted due to varying assumptions and omitted risks.61Country-specific, political and organizational risks are highly important.61Uncertainty and risks need to be considered to determine Desertec's feasibility.614 ways to handle risk: substitute, eliminate, redistribute risk or abandon project.

DOI

[4]
Biswas M, Parveen S, Shimozawa H et al., 2005. Effects of Azolla species on weed emergence in a rice paddy ecosystem.Weed Biology and Management, 5(4): 176-183.The effects of Azolla pinnata R. Br. on weed emergence were evaluated in terms of plot area coverage by an A. pinnata mat, its biomass production and the amount of weed emergence, using fresh and dry weights, in a rice paddy field experiment. The experiment was conducted following a randomized block design with five combinations of fertilizer and A. pinnata treatments (control, A. pinnata + superphosphate, A. pinnata + urea, A. pinnata + compound fertilizer, A. pinnata + cow manure). The results revealed that after 18 days of inoculation, all superphosphate (T1) and cow manure (T4)-treated plots were fully covered by the A. pinnata mat. However, coverage of the urea (T2) and compound fertilizer (T3)-treated plots were only 80% and 70%, respectively. The full plot area coverage by the A. pinnata mat and the highest biomass production with superphosphate and cow manure-treated plots were able to completely inhibit two weed species ( Scirpus juncoides Roxb. var. hotarui Ohwi and Monochoria vaginalis Burm. f. Presl var. plantaginea (Roxb.) Solms-Laub) and significantly suppressed four other weeds ( Cyperus serotinus Rottb, Echinochla oryzicola Vasing, and Eclipta prostrata L.). In all the treatments, the fresh weight of weeds significantly reduced to 13, 29, 34, and 9%, respectively, for treatments T1, T2, T3, and T4. The dry weights also were significantly reduced to 10.00, 16.00, 22.00, and 7.26%, respectively, for treatments T1, T2, T3, and T4 over the control. The results revealed that there was a significant correlation among plot area coverage by the A. pinnata mat, its biomass production and weed emergence in a rice paddy field over the control. Azolla pinnata did not have any detrimental effect on the growth of rice plants.

DOI

[5]
Blankenhorn V, Resch B, 2014. Determination of suitable areas for the generation of wind energy in germany: Potential areas of the present and future.ISPRS International Journal of Geo-Information, 3(3): 942-967.Shortly after the Fukushima Daiichi nuclear disaster in 2011, the Federal Government of Germany decided to change the structure of the country鈥檚 energy supply system by ending nuclear energy conversion and strongly promoting the development of renewable energies. In order to politically set the course for sustainable energy supply in this time of transition, it is important to analyze the factors influencing the future development of renewable energies. This work contributes to this purpose in the field of onshore wind electricity generation by displaying the temporal development of areas suitable for wind energy use. The availability of such areas is crucial to the extension of sites for wind energy plants. In our approach, the current potential area is determined by excluding areas unsuitable for this kind of electricity generation. For the determination of potential areas of the future, assumptions are made based on the expansion of settlement and traffic areas, and the occupation of protection areas. According to various scenarios, a decline of potential areas between 3% and 8% between 2011 and 2030 is indicated.

DOI

[6]
Capehart T, Stubbs M, 2007. Renewable energy policy in the 2008 farm bill. In: Caspian Energy Newspaper 2016, First wind farm launched in Caucasus region viewed 11/11/2016. .

[7]
Cavagnaro T R, 2015. Chapter five-biologically regulated nutrient supply systems: Compost and Arbuscular Mycorrhizas: A review.Advances in Agronomy, 129: 293-321.

DOI

[8]
Chennubhotla V, Rao M U, Rao K, 2013. Exploitation of marine algae in Indo-Pacific region.Seaweed Research and Utilization, 35(1/2): 1-7.Marine algae are harvested from the coastal waters of numerous countries of Indo-Pacific region due to their value as food, feed for animals, fertilizers and a source of various minerals, trace elements and phycocolloids. Out of 20, 000 species of marine algae in the world, 145 are used for food and 101 for extraction of phycocolloids. The Indo – Pacific region encompasses approximately 75% of the world’s coral reefs and provides ideal habitat for marine algae and various other organisms. According to FAO Fisheries Statistics, 2006, the total estimated marine algal production in the world is more than 15.8 million tonnes and that of Indo–Pacific region is of the order of 13 million tonnes. The global production of edible marine algae has been assessed as four million tonnes (wet wt.).The Indo- Pacific region produced 2,60,00,00 tonnes wet weight. In India, the annual production of marine algae has been estimated as 3, 01,646 tonnes. The bulk production comes from Tamil Nadu coast and Andaman-Nicobar Islands amounting to 60 %.Information on global production of useful marine algae, important edible species, harvesting, industrial exploitation and culture of Indian resources is given in this paper. The marine algal industry has grown in leaps and bounds in other countries increasing the employment potential and gainful economic returns for them. There is an urgency in improving the culture and exploitation of our marine algal resources to face competition in the world markets.

[9]
Chianu J, Tsujii H, 2004. Determinants of farmers' decision to adopt or not adopt inorganic fertilizer in the savannas of northern Nigeria.Nutrient Cycling in Agroecosystems, 70(3): 293-301.Soil nutrient deficiency has hampered increased agricultural production in the savannas of northern Nigeria. It has been observed that inorganic fertilizer (IF) has the potential to reverse the situation. However, low adoption among the farmers has characterized IF in the savannas of northern Nigeria. The application rates have also fallen far lower than the rate recommended by research and extension, resulting in low crop yields. This paper investigates the factors that influence farmers' decision to adopt or not to adopt IF and to evaluate the elasticity of adoption. This information will help to prioritize the factors that affect IF adoption decisions and suggest pathways for effective promotion of IF. About 49% of the survey farmers adopted IF and the application rate ranges from 5.6 to 64.4 kg ha 鈥1 (with a mean of 24.1 kg ha 鈥1 ). The probability of adoption increases with increased targeting of: farmers from the Guinea savanna agroecological zone, younger farmers, better educated farmers, food secure farmers and net sellers of food grains, farmers who have diversified into many crops, farmers who perceive increase in the fertilizer needs of their crops, and farmers who apply large quantities of organic manure. Among others, the estimates of elasticity of adoption indicate that a 1% increase in the number of farmers who perceive an increase in the fertilizer needs of their crops results in 3.23% increase in the probability of IF adoption. The paper concludes with policy implications for strategies aimed at promoting IF in the savannas of Nigeria and similar ecologies elsewhere.

DOI

[10]
Crucefix D, 1998. Organic agriculture and sustainable rural livelihoods in developing countries. Report by Natural Resources and Ethical Trade Programme, June.CiteSeerX - Scientific documents that cite the following paper: Organic agriculture and sustainable rural livelihoods in developing countries

[11]
Deign J, 2012. DNI: Measuring bang for your buck, viewed 19/10/2016. .

[12]
Dunn R, Lovegrove K, Burgess G, 2012. A review of ammonia-based thermochemical energy storage for concentrating solar power.Proceedings of the IEEE, 100(2): 391-400.The development of a thermochemical energy storage system based on ammonia, for use with concentrating solar power is discussed in this paper. This is one of a number of storage options for concentrating solar power, including molten-salt storage, which is already operating commercially. The ammonia storage development has involved prototype solar receiver/reactors operated in conjunction with a 20-m 2 dish concentrator, as well as closed-loop storage demonstrations. An ongoing computational study deals with the performance of an ammonia receiver for a 489-m 2 dish concentrator. The ammonia storage system could employ industry-standard ammonia synthesis converters for superheated steam production. A standard 1500 t/day ammonia synthesis reactor would suffice for a 10-MWe baseload plant with 330 large 489-m2 dishes. At this stage, an updated economic assessment of the system would be valuable.

DOI

[13]
Eisner R, Seabrook L, McAlpine C A, 2016. Minimising the land area used by agriculture without petrochemical nitrogen. In: Proceedings of the International Nitrogen Initiative 2016. .

[14]
Fischer R, Byerlee D, Edmeades G, 2012. Crop yields and global food security. Canberra: Australian Center for International Agricultural Research.

[15]
Florentinus A, Hamelinck C, de Lint S et al., 2008. Worldwide potential of aquatic biomass.Utrecht, Ecofys.

[16]
Grassi S, Veronesi F, Schenkel R et al., 2015. Mapping of the global wind energy potential using open source GIS data.

[17]
Heinstein P, Perret-Aebi L-E, Escarre Palou J et al., 2015. Energy harvesting and passive cooling: A new BIPV perspective opened by white solar modules. In: Proceedings of International Conference CISBAT 2015 Future Buildings and Districts Sustainability from Nano to Urban Scale, 675-680.

[18]
Jacobson M Z, Delucchi M A, 2011. Providing all global energy with wind, water, and solar power (Part I): Technologies, energy resources, quantities and areas of infrastructure, and materials.Energy Policy, 39(3): 1154-1169.

DOI

[19]
Jiang J, Aulich T, 2008. JV Task-121 electrochemical synthesis of nitrogen fertilizers. University of North Dakota.

[20]
Kier G, Kreft H, Lee T M et al., 2009. A global assessment of endemism and species richness across island and mainland regions.Proceedings of the National Academy of Sciences, 106(23): 9322-9327. doi: 10.1073/pnas.0810306106.

DOI

[21]
Kruger P, 2006. Alternative Energy Resources: The Quest for Sustainable Energy. Wiley New Jersey.

[22]
Leighty B, 2008. Two Farm Bill Research Initiatives Promise New Markets, Transmission, and Firming Storage for Diverse, Large-Scale Renewables as Hydrogen and Ammonia', in The NHA Annual Hydrogen Conference 2008.

[23]
Leighty B, Holbrook J, 2008. Transmission and firming of GW-scale wind energy via hydrogen and ammonia.Wind Engineering, 32(1): 45-66.ABSTRACT This is a conceptual study, for MW to GW scale, comparing production, transmission, and storage costs for gaseous hydrogen (GH2) and anhydrous ammonia (NH 3) fuels made from wind-generated electricity, with and without the low-cost, annual-scale, firming storage which would add great market and strategic value. Both fuels are suitable for vehicles and for distributed generation (DG) in stationary combined-heat-and-power (CHP), via fuel cells or internal combustion engines (ICE' s). NH 3 is also a valuable fertilizer, and this study briefly examines the economics of renewable-source versus fossil-source production of NH 3 fertilizer. No pilot plant exists for confirming the system capital costs and conversion efficiencies we estimate in this study, although both GH2 and NH 3 have been proposed for wind energy transmission and storage [1 6]. Hydrogen is promising as a clean-burning energy carrier, and modern electrolyzers can produce large volumes of high-pressure hydrogen, ready for direct pipeline transmission and/or for ammonia synthesis, from renewable energy sources. Renewable-source hydrogen can alternatively be stored and transported as NH 3 , which can be readily synthesized, following electrolysis, using atmospheric nitrogen, and be used at the delivery end-point as a fertilizer or a fuel. Both GH2 and NH 3 transmission and firming storage will accelerate our conversion from fossil to diverse renewable resources, via major new markets including, and beyond, the electricity sector.

DOI

[24]
Leighty W C, 2010. Transmission and annual-scale firming storage alternatives to electricity: Gaseous hydrogen and anhydrous ammonia via underground pipeline. In: Proceedings of the International Colloquium on Environmentally Preferred Advanced Power Generation, Costa Mesa, California, USA.This is a conceptual study, for MW to GW scale, comparingproduction, transmission, and storage costs for gaseous hydrogen(GH2) and anhydrous ammonia (NH3) fuels made from wind-generated electricity, with and without the low-cost, annual-scale,firming storage which would add great market and strategic value.Both fuels are suitable for vehicles and for distributed generation (DG) in stationary combined-heat-and-power (CHP), via fuel cells orinternal combustion engines (ICE's). NH3 is also a valuable fertilizer, and this study briefly examines the economics of renewable-sourceversus fossil-source production of NH3 fertilizer. No pilot plant exists for confirming the system capital costs and conversion efficiencies we estimate in this study, although both GH2 and NH3 have beenproposed for wind energy transmission and storage [1-6]. Hydrogen is promising as a clean-burning energy carrier, and modern electrolyzers can produce large volumes of high-pressure hydrogen, ready for direct pipeline transmission and/or for ammonia synthesis, from renewableenergy sources. Renewable-source hydrogen can alternatively bestored and transported as NH3, which can be readily synthesized,following electrolysis, using atmospheric nitrogen, and be used at thedelivery end-point as a fertilizer or a fuel. Both GH2 and NH3transmission and firming storage will accelerate our conversion fromfossil to diverse renewable resources, via major new markets including, and beyond, the electricity sector.

[25]
Li D, 2013. Using GIS and remote sensing techniques for solar panel installation site selection [D]: University of Waterloo.

[26]
Matthews R, De Pinto A, 2012. Should REDD+ fund ‘sustainable intensification’as a means of reducing tropical deforestation?Carbon Management, 3(2): 117-120.Over the last 50 years, the global population has doubled. Despite this, food production has more than kept pace, resulting in a 24% increase in per capita world food production and a 40% reduction in food prices in real terms. While some progress has been made towards lowering the proportion of people suffering from chronic hunger from 20 to 16%, the absolute number of chronically hungry has actually increased to more than 900 million. Until recently, conventional wisdom was that while global food production was sufficient to meet demand, the main problem was one of distribution. This conclusion was reassessed towards the end of the 2000s, when the effect of changing diets in developing nations was taken into account, which indicated that food production will need to increase 70% to meet demand in 2050. A recent analysis relating calorie and protein consumption to GDP puts this even higher at 100 110%. These projections have prompted a number of high-profile reports analyzing the global food production system, generally concluding that gains are likely to come from a mix of new applications of existing knowledge, new technologies, and development and implementation of appropriate economic and social policies, and sustainable intensification on existing crop area.

DOI

[27]
Monfreda C, Ramankutty N, Foley J A, 2008. Farming the planet: 2. Geographic distribution of crop areas, yields, physiological types, and net primary production in the year 2000. Global Biogeochemical Cycles, 22(1).

[28]
NASA 2005. NASA SSE monthly average wind data at one-degree resolution of the world viewed 19/10/2016, https://en.openei.org/datasets/dataset/nasa-see-monthly-average-wind-data-at-one-degree-resolution-of-the-world. — 2011. NASA solar direct normal viewed 19/10/2016. .

[29]
NASA Earth Observations 2016. Albedo (1 month), viewed 19/10/2016. .

[30]
Natural Earth 2016. Coastline, available online , (accessed 19 October 2016).

[31]
Nemet G F, 2009. Net radiative forcing from widespread deployment of photovoltaics.Environmental Science & Technology, 43(6): 2173-2178.Abstract If photovoltaics (PV) are to contribute significantly to stabilizing the climate, they will need to be deployed on the scale of multiple terawatts. Installation of that much PV would cover substantial portions of the Earth's surface with dark-colored, sunlight-absorbing panels, reducing the Earth's albedo. How much radiative forcing would result from this change in land use? How does this amount compare to the radiative forcing avoided by substituting PV for fossil fuels? This analysis uses a series of simple equations to compare the two effects and finds that substitution dominates; the avoided radiative forcing due to substitution of PV for fossil fuels is approximately 30 times largerthan the forcing due to albedo modification. Sensitivity analysis, including discounting of future costs and benefits, identifies unfavorable yet plausible configurations in which the albedo effect substantially reduces the climatic benefits of PV. The value of PV as a climate mitigation option depends on how it is deployed, not just how much it is deployed--efficiency of PV systems and the carbon intensity of the substituted energy are particularly important

DOI PMID

[32]
Phalan B, Green R E, Dicks L V et al., 2016. How can higher-yield farming help to spare nature?Science, 351(6272): 450-451.

DOI

[33]
Philibert C, 2005. The present and future use of solar thermal energy as a primary source of energy. International Energy Agency, Paris, France.

[34]
Pihl E, Kushnir D, Sandén B et al., 2012. Material constraints for concentrating solar thermal power.Energy, 44(1): 944-954.Scaling up alternative energy systems to replace fossil fuels is a critical imperative. Concentrating Solar Power (CSP) is a promising solar energy technology that is growing steadily in a so far small, but commercial scale. Previous life cycle assessments (LCA) have resulted in confirmation of low environmental impact and high lifetime energy return. This work contributes an assessment of potential material restrictions for a large-scale application of CSP technology using data from an existing parabolic trough plant and one prospective state-of-the-art central tower plant. The material needs for these two CSP designs are calculated, along with the resulting demand for a high adoption (up to about 8000 TWh/yr by 2050) scenario. In general, most of the materials needed for CSP are commonplace. Some CSP material needs could however become significant compared to global production. The need for nitrate salts (NaNO3 and KNO3), silver and steel alloys (Nb, Ni and Mo) in particular would be significant if CSP grows to be a major global electricity supply. The possibilities for increased extraction of these materials or substituting them in CSP design, although at a marginal cost, mean that fears of material restriction are likely unfounded.

DOI

[35]
Rosenthal E, 2010. Solar industry learns lessons in Spanish sun. The New York Times, March, vol.8.Two years ago, this gritty mining city hosted a brief 21st-century gold rush. Long famous for coal, Puertollano discovered another energy source it had overlooked: the relentless, scorching sun. Armed with generous incentives from the Spanish government to jump-start a national solar energy industry, the city set out to replace its failing coal economy by attracting solar companies, with a campaign slogan: "The Sun Moves Us." Soon, Puertollano, home to the Museum of the Mining Industry, had two enormous solar power plants, factories making solar panels and silicon wafers, and clean energy research institutes. Half the solar power installed globally in 2008 was installed in Spain.

[36]
Safarov V, 2015. Renewable energy perspectives of oil exporter Azerbaijan. Renewable Energy, Apr 16.

[37]
Salmon J M, Friedl M A, Frolking S et al., 2015. Global rain-fed, irrigated, and paddy croplands: A new high resolution map derived from remote sensing, crop inventories and climate data.International Journal of Applied Earth Observation and Geoinformation, 38: 321-334.Irrigation accounts for 70% of global water use by humans and 33鈥40% of global food production comes from irrigated croplands. Accurate and timely information related to global irrigation is therefore needed to manage increasingly scarce water resources and to improve food security in the face of yield gaps, climate change and extreme events such as droughts, floods, and heat waves. Unfortunately, this information is not available for many regions of the world. This study aims to improve characterization of global rain-fed, irrigated and paddy croplands by integrating information from national and sub-national surveys, remote sensing, and gridded climate data sets. To achieve this goal, we used supervised classification of remote sensing, climate, and agricultural inventory data to generate a global map of irrigated, rain-fed, and paddy croplands. We estimate that 314 million hectares (Mha) worldwide were irrigated circa 2005. This includes 66Mha of irrigated paddy cropland and 249Mha of irrigated non-paddy cropland. Additionally, we estimate that 1047Mha of cropland are managed under rain-fed conditions, including 63Mha of rain-fed paddy cropland and 985Mha of rain-fed non-paddy cropland. More generally, our results show that global mapping of irrigated, rain-fed, and paddy croplands is possible by combining information from multiple data sources. However, regions with rapidly changing irrigation or complex mixtures of irrigated and non-irrigated crops present significant challenges and require more and better data to support high quality mapping of irrigation.

DOI

[38]
Scheidel A, Sorman A H, 2012. Energy transitions and the global land rush: Ultimate drivers and persistent consequences,Global Environmental Change-Human and Policy Dimensions, 22(3): 588-595. doi: 10.1016/j.gloenvcha.2011.12.005.While the recent emergence of a global land rush has initiated large debates and conflicts over the use and access to land, further investigation into the underlying drivers is required to enhance the understanding of the potential trajectories of the land grab phenomenon. This paper takes a biophysical perspective and explores how declining fossil stocks and a global transition towards renewable energies ultimately drive the land rush. The paper addresses, in qualitative terms, how societal needs for land change with different patterns of societal energy metabolism. The potential spatial expansions of renewables are illustrated in quantitative terms, based on the power density concept and energy provision forecasts for the year 2020. The transition from an energy system based on fossils stocks, with high power densities, to one based on renewables, with low power densities, drastically boosts societal demand for land. This drives the land rush directly through land acquisitions for the expansion of energy systems. The energy transition also drives the land rush indirectly, in particular through food security threats motivated by the growing competition over farmland uses and changes in crop supply. Although currently fossil stocks are still relatively abundant, future declines are expected to trigger the demand for land to even greater extents. Given the inevitability of the energy transition, we believe that the land rush will have persistence, bearing long-term consequences for land use and struggles over access to land.

DOI

[39]
Shridhar B S, 2012. Review: Nitrogen fixing microorganisms.Int. J. Microbiol. Res., 3(1): 46-52.

[40]
Tallaksen J, Bauer F, Hulteberg C et al., 2015. Nitrogen fertilizers manufactured using wind power: Greenhouse gas and energy balance of community-scale ammonia production.Journal of Cleaner Production, 107: 626-635.61Ammonia is the standard source of nitrogen for agricultural fertilizers.61Energy use and GHG were modeled at a wind powered ammonia production facility.61Wind based ammonia production is still dependent on background energy system.61Fossil energy use for renewable ammonia was 149% to0261108% of conventional ammonia.61Results show high sensitivity to background grid electrical system fossil energy use.

DOI

[41]
Thomas R, Graven D H, Hoskins S B et al., 2016. What is meant by ‘balancing sources and sinks of greenhouse gases’ to limit global temperature rise?Briefing Note, (3): 1-5.

[42]
Turney D, Fthenakis V, 2011. Environmental impacts from the installation and operation of large-scale solar power plants.Renewable and Sustainable Energy Reviews, 15(6): 3261-3270.Large-scale solar power plants are being developed at a rapid rate, and are setting up to use thousands or millions of acres of land globally. The environmental issues related to the installation and operation phases of such facilities have not, so far, been addressed comprehensively in the literature. Here we identify and appraise 32 impacts from these phases, under the themes of land use intensity, human health and well-being, plant and animal life, geohydrological resources, and climate change. Our appraisals assume that electricity generated by new solar power facilities will displace electricity from traditional U.S. generation technologies. Altogether we find 22 of the considered 32 impacts to be beneficial. Of the remaining 10 impacts, 4 are neutral, and 6 require further research before they can be appraised. None of the impacts are negative relative to traditional power generation. We rank the impacts in terms of priority, and find all the high-priority impacts to be beneficial. In quantitative terms, large-scale solar power plants occupy the same or less land per kW02h than coal power plant life cycles. Removal of forests to make space for solar power causes CO emissions as high as 3602g CO kW02h, which is a significant contribution to the life cycle CO emissions of solar power, but is still low compared to CO emissions from coal-based electricity that are about 110002g CO kW02h.

DOI

[43]
Wilson K A, McBride M F, Bode M et al., 2006. Prioritizing global conservation efforts.Nature, 440(7082): 337-340.

DOI

[44]
Yi S-K, Sin H-Y, Heo E, 2011. Selecting sustainable renewable energy source for energy assistance to North Korea.Renewable and Sustainable Energy Reviews, 15(1): 554-563.Renewable energy (RE) is the best sustainable energy solution South Korea can provide to assist North Korea in overcoming its chronic energy shortage. Designed as a follow-on research to Sin et al. [1], a survey was conducted with a panel of experts consisting of various disciplines and affiliations using the analytic hierarchy process (AHP) with benefit, opportunity, cost, and risk (BOCR). The results showed the panel viewed security as the most important factor among the strategic criteria. For the level 1 attributes, the panel showed no significant differences of opinion among the different alternatives; however, cost showed to be the most important factor for the panel. The panel chose wind power as the best alternative source of energy for North Korea; however, there were some differences in opinion among the sub-groups of the panel depending on the composition and the expertise of the sub-group. Compared to other studies on the similar topic, this research stands out in that the research results were derived using AHP and BOCR and that the panel was composed of both Korean and foreign experts on North Korea affiliated with state-run research organizations, armed forces, non-governmental organizations, academic research organizations, private consulting firms, and journalism. The research arrived at the conclusion that the following factors must be considered as South Korea designs its future North Korean energy assistance policy: (1) RE assistance for North Korea can take on various forms; hence, experts consulted during the design, writing, and implementation phases of the policy in question must possess knowledge and expertise in the appropriate technology and methodology being considered; (2) possibility of a sudden destabilization of the Northeast Asian security paradigm due to the collapse of North Korea; and (3) continued nuclearization of North Korea.

DOI

Outlines

/