Research Articles

Latitudinal patterns and influencing factors of soil humic carbon fractions from tropical to temperate forests

  • XU Li , 1, 3 ,
  • WANG Chunyan 4 ,
  • ZHU Jianxing 1, 3 ,
  • GAO Yang 1 ,
  • LI Meiling 1 ,
  • LV Yuliang 2 ,
  • YU Guirui 1 ,
  • HE Nianpeng , 1, 3, *
Expand
  • 1. Key Laboratory of Ecosystem Network Observation and Modeling, Institute of Geographic Sciences and Natural Resources Research, CAS, Beijing 100101, China
  • 2. College of Geographical Science, Southwest University, Chongqing 400715, China
  • 3. College of Resources and Environment, University of Chinese Academy of Sciences, Beijing 100190, China
  • 4. Branch of Experimental School of Beihang University, Beijing 100191, China

Author: Xu Li, PhD, specialized in soil carbon storage and sequestration. E-mail:

The authors Xu Li and Wang Chunyan contributed equally to this work.

Received date: 2017-01-10

  Accepted date: 2017-08-23

  Online published: 2018-01-10

Supported by

National Key Research Project of China, No2016YFC0500202

STS of Chinese Academy of Sciences, No.KFJ- SW-STS-167

National Natural Science Foundation of China, No.31290221, No.31570471

Youth Innovation Research Team Project, NoLENOM2016Q0005

Copyright

Journal of Geographical Sciences, All Rights Reserved

Abstract

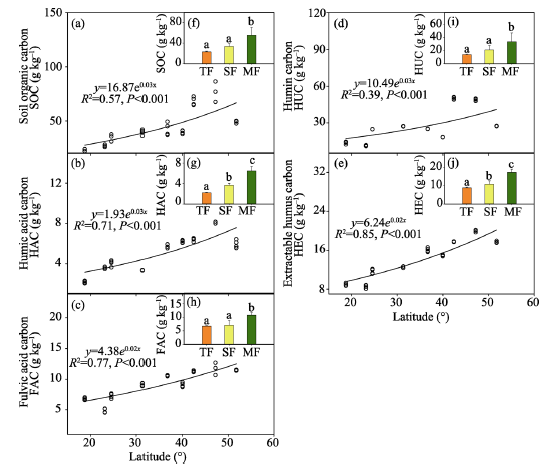
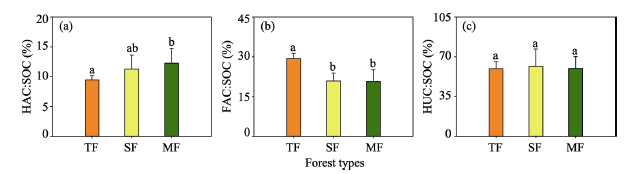
Soil humic carbon is an important component of soil organic carbon (SOC) in terrestrial ecosystems. However, no study to date has investigated its geographical patterns and the main factors that influence it at a large scale, despite the fact that it is critical for exploring the influence of climate change on soil C storage and turnover. We measured levels of SOC, humic acid carbon (HAC), fulvic acid carbon (FAC), humin carbon (HUC), and extractable humus carbon (HEC) in the 0-10 cm soil layer in nine typical forests along the 3800-km North-South Transect of Eastern China (NSTEC) to elucidate the latitudinal patterns of soil humic carbon fractions and their main influencing factors. SOC, HAC, FAC, HUC, and HEC increased with increasing latitude (all P<0.001), and exhibited a general trend of tropical < subtropical < temperate. The ratios of humic C fractions to SOC were 9.48%-12.27% (HAC), 20.68%-29.31% (FAC), and 59.37%-61.38% (HUC). Climate, soil texture, and soil microbes jointly explained more than 90% of the latitudinal variation in SOC, HAC, FAC, HEC, and HUC, and interactive effects were important. These findings elucidate latitudinal patterns of soil humic C fractions in forests at a large scale, and may improve models of soil C turnover and storage.

Cite this article

XU Li , WANG Chunyan , ZHU Jianxing , GAO Yang , LI Meiling , LV Yuliang , YU Guirui , HE Nianpeng . Latitudinal patterns and influencing factors of soil humic carbon fractions from tropical to temperate forests[J]. Journal of Geographical Sciences, 2018 , 28(1) : 15 -30 . DOI: 10.1007/s11442-018-1456-2

1 Introduction

The amount of organic carbon in soils is about twice as much as in the atmosphere, consequently maintaining and increasing soil organic carbon (SOC) storage is important in mitigating the effects of increasing atmospheric CO2 (Lal et al., 1995). SOC is composed of various fractions that have different decomposition rates and turnover times because they are stabilized by specific mechanisms (von Lutzow et al., 2007; Huan et al., 2008). In the past two decades, many studies have tried investigating the responses of different SOC fractions to climate change or anthropogenic disturbance. Labile SOC fractions are sensitive to climate and environmental change, e.g., turnover processes, controlling mechanisms, and temperature sensitivity, and therefore receive much attention (Neff and Hooper, 2002; Wang et al., 2012; Benbi et al., 2014). However, little attention has been paid to the recalcitrant carbon fraction (soil humic carbon fraction), although recalcitrant carbon is the dominant component of SOC, and is related to soil carbon sequestration, sorption, and cation exchange capacity over long periods (Davidson and Janssens, 2006). Chemical recalcitrance appears to be the only mechanism by which SOC can be sequestered for long periods (Krull et al., 2003).
Different fractions of SOC have different chemical compositions and residence times (von Lutzow et al., 2007). Therefore, SOC dynamics can be evaluated by separating the different fractions (Murage et al., 2007). The biogeochemical models CENTURY (Parton et al., 1987) and ROTH-C (Jenkinson et al., 1990) have classified SOC into three categories according to their turnover times (fast, slow, or passive) and pool size (microbial biomass, humified organic matter, or inert). Humic substances play important roles in stabilizing the SOC pool, and even a small depletion of the humic fraction will generate a large flow of CO2 (Song et al., 2008). Furthermore, the chemical resistance of humic substances controls SOC turnover processes from soil to atmosphere (Qualls, 2004). It is therefore important to measure the storage and composition of soil humic carbon fractions at a large scale to understand the processes and underlying mechanisms of SOC turnover and to develop of a dynamic carbon model (Skjemstad et al., 2004; He et al., 2016).
Humic substances are the most widely distributed organic materials on the planet (Stevenson, 1994), and account for 65%-75% of soil organic matter (SOM) (Pettit, 2004). Soil humus fractions are relatively stable, and play key roles in the stable SOM pool (Song et al., 2008). Based on differences in its solubility in aqueous solutions due to different pH and molecular characteristics, soil humus can be divided into humic acid (HA), fulvic acid (FA), and humin (HU) (Fabbri et al., 1996; Zhang et al., 2009). As one of the most important fractions of SOM, soil humus has many important functions, such as the slow release of plant nutrients, cation exchange, pH buffering, and interactions with micronutrients, toxic metal ions, and xenobiotic organic molecules (Fabbri et al., 1996; Brunetti et al., 2007). Some studies, using a variety of techniques, have compared soil humus between different ecosystems (Watanabe et al., 2001) and investigated the effects of land-use changes (or management types) on the soil humic fraction (Yang et al., 2004; Wang et al., 2015). Martin et al. (1998) investigated changes in soil humic fractions with altitude, and found that the fractions increased with increasing altitude. To the best of our knowledge, no study has been published on latitudinal patterns and factors that control soil humic carbon fractions at a large scale. Investigating the effects of changes of biotic and abiotic factors on SOC and its humic components under climate change is very important for understanding SOC turnover and improving dynamic carbon models (Wen and He, 2016). The North-South Transect of Eastern China (NSTEC) is one of 15 standard terrestrial transects of the International Geosphere-Biosphere Program (IGBP) (Canadell et al., 2002). It encompasses a gradient from tropical to temperate climates, and covers the major forest types of the Northern Hemisphere, from tropical rainforests to boreal coniferous forests (Lu et al., 2013; Wang et al., 2016; Zhao et al., 2016). Therefore, it provides a unique research platform to investigate the spatial patterns of soil humic carbon fractions. In this study, we selected nine forests along the NSTEC and measured levels of SOC, humin carbon (HUC), humic acid carbon (HAC), fulvic acid carbon (FAC), and extractable humus carbon (HEC) in the 0-10 cm soil layer, as well as other parameters. The main objectives of this study were to elucidate latitudinal patterns of forest soil humic carbon fractions at a large scale, investigate the distribution ratio of different humic carbon fractions to SOC along the transect, and discuss the mechanisms for the spatial patterns of soil humic carbon fractions.

2 Materials and methods

2.1 Study area

As shown in Figure 1, the 3800-km NSTEC contains several climatic zones and vegetation types with considerable water and heat gradients, and it is the only complete continuous vegetation band formed by thermal gradients in the world (Zhang and Yang, 1995; Wang et al., 2016; Zhao et al., 2016). The mean annual temperature (MAT) varies from -3.67 to 23.15ºC from north to south, and the mean annual precipitation (MAP) varies from 472.96 to 2265.80 mm. In this study, nine forest ecosystems were selected along the NSTEC from south to north, and were designated as tropical monsoon forest (Jianfenglin, T-1), southern subtropical monsoon evergreen broad-leaved forest (Dinghushan, S-1), subtropical evergreen broad-leaved forest (Jiulianshan, S-2), northern subtropical deciduous evergreen mixed forest (Shennongjia, S-3), warm temperate deciduous broad- leaved forest (Taiyue, M-1; Dong- lingshan, M-2), temperate conifer broad-leaved mixed forest (Changbaishan, M-3; Liangshui, M-4), and cold temperate coniferous forest (Huzhong, M5). The general characteristics of the forests are presented in Table 1 and Figure 1.
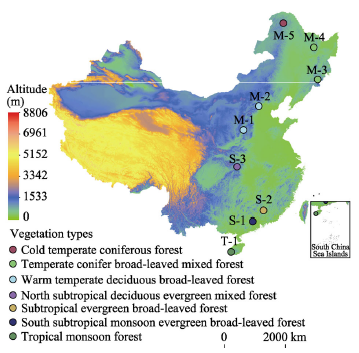
Figure 1 Experimental plots and forest types along the North-South Transect of eastern China
T, Tropical; S, Subtropical; M, Temperate; T-1, Jiangfenglin, tropical monsoon forest; S-1, Dinghu¬shan, southern subtropical monsoon evergreen broad-leaved forest; S-2, Jiulianshan, subtropical evergreen broad-leaved forest; S-3, Shennongjia, northern subtropical deciduous evergreen mixed forest; M-1, Taiyue, warm temperate deciduous br¬oad leaved forest; M-2, Dongling¬shan, warm temperate deciduous br¬oad-leaved forest; M-3, Changbais¬han, temperate conifer broad-le-aved mixed forest; M-4, Liangshui, temperate conifer broad-leaved mi¬xed forest; M-5, Huzhong, cold temperate coniferous forest.
Table 1 Badic inforation of the selected nine forests along the North-South-South Transect of eastern China

2.2 Field survey and sampling

Field surveys were conducted from July to August 2013. To minimize the effects of land-use change and anthropogenic disturbance, forest plots were set in the centers of National Nature Reserves in each forest type. The experimental plots were located in climax forests that have not been subjected to intense human disturbance or deforestation in more than 80-100 years. We established four replicate plots (30 m × 40 m) in each forest type. In each plot, soil samples were randomly collected from 30 to 40 points in the 0-10 cm soil layer using a soil auger (diameter 6 cm), and mixed together. Soils were immediately passed through a 2-mm sieve to remove visible roots, gravel, and stones. Soil samples that were used to determine humic carbon fractions and texture were air-dried, while other subsamples that were used to determine soil microbe were stored at 4ºC, following an established protocol (Wang et al., 2015).

2.3 Physical and chemical analyses

SOC and soil total nitrogen (STN) were determined by dry combustion using a C/N analyzer (Elementar, Vario Max CN, Germany). Soil total phosphorous (STP) was measured using a Bran+Luebbe AutoAnalyzer by the phosphoric acid-molybdenum antimony colorimetric method (Bao, 2008). Soil available phosphorus (SAP) was extracted and measured using the method of Olsen (1954). Soil pH was determined with a pH meter (Ultrameter II; Myron L. Company, Carlsbad, CA) from a slurry of soil mixed with distilled water (1:2.5). A LS230 laser-diffraction particle-size analyzer (Beckman Coulter Inc., Miami, FL) was used to divide the soil into clay (<2 μm), silt (2-20 μm), and sand (20-2000 μm), according to the international soil texture classification standard. The phospholipid fatty-acid (PLFA) method (White et al., 1979) and gas chromatography-mass spectrometry (GC-17A/GCMS-QP5000; Shimadzu Corp., Kyoto, Japan) were jointly used to determine bacterial, fungal, and actinomycete biomasses; and these data are published elsewhere (Xu et al., 2017).

2.4 Humic substances composition analysis

Soil humic substances composition was analyzed using the protocol of Kumada (1987), with minor modifications (Zhang et al., 2011).The processes can be divided into five steps: (1) 5-g soil samples were passed through a 60-mesh sieve and placed in 100-mL centrifuge tubes. Eighty milliliters of distilled water was added to each tube and then the tubes were shaken for 1 h at 70°C in a thermostatic water bath oscillator. The mixture was then centrifuged at 3500 r min-1 for 15 min and the supernatant discarded. The residue, which was the precipitate in the centrifuge tube, was washed twice with distilled water. (2) a 30-mL mixture of 0.1 mol L-1 NaOH and 0.1 mol L-1 sodium pyrophosphate was added to the soil residue (pH=13), which was shaken for 1 h at 70 °C, and then centrifuged at 3500 r min-1 for 15 min. The supernatant was filtered into a 50-mL volumetric flask. The residue was washed with 10 mL of the above mixture (two times). (3) The supernatant from the second centrifugation step was filtered into the same 50-mL volumetric flask for a final volume of 50 mL. The solution contained extracted humus substances (HE). The residue in the centrifuge tube that was washed with distilled water, dried at 55°C, and passed through a 60-mesh sieve contained HU. (4) 0.5 mol L-1 H2SO4 was added to 30 mL of the HE solution, adjusting the pH to 1.0-1.5. The mixture was heated at 60-70°C for 1.5 h and then left overnight. (5) The following day, the solution was filtered into a 50-mL volumetric flask to obtain FA, after the volume was determined. The precipitate on the filter paper was washed three times with 0.25 mol L-1 H2SO4 and dissolved in a 50-mL volumetric flask with 0.05 mol L-1 NaOH to obtain HA, after determining the volume with distilled water.
The contents of HEC, HUC, and HAC were determined using a C/N analyzer (Elementar, Vario Max CN), while FAC was calculated by subtracting HAC from HEC.

2.5 Data analysis

One-way analyses of variance and Duncan’s multiple range tests were used to investigate differences in the soil humic fractions and the distribution ratios of the humic carbon fractions to SOC. Relationships between climatic factors, soil textures, and soil microbes and the humic fractions were analyzed using Pearson’s correlation.
A partial regression with redundancy analysis (partial RDA) was conducted to divide the total effect into independent and interactive effects. To investigate variations in latitudinal patterns of SOC and humic carbon fractions, environmental factors were divided into climatic factors (MAT and MAP), soil features (clay, silt, sand, STN, STP, SAP, and pH), and soil microbial characteristics (PLFA, bacteria, fungi, and actinomycetes). Here, it led to seven fractions: 1) pure effect of climate (a); 2) pure effect of soil features (b); 3) pure effect of microbial (c); and combined variation caused by the joint effects of 4) climate and soil features (d); 5) climate and microbial (e); 6) soil features and microbial (f) and finally 7) the three groups of explanatory variables (g) (Figure 5). The general linear model (GLM) was conducted to assess the variances explained by climate, soil features, and soil microbial characteristics. A series of partial RDA were then performed to partition the variance explained by climate, soil feature, and soil microbial characteristics, independently and interactively, which is presented as a Venn diagram (Heikkinen et al., 2005).
All of the analyses were performed using SPSS 13.0 and the R package. Statistical significance was set at P=0.05.

3 Results

3.1 Latitudinal patterns of forest humic carbon fractions

The contents of SOC, HAC, FAC, HUC, and HEC ranged between 23.12 and 77.00 g kg-1, 2.19 and 8.12 g kg-1, 4.86 and 11.74 g kg-1, 11.37 and 49.98 g kg-1, and 8.53 and 19.94 g kg-1, respectively (Figure 2 and Table 2); their contents all differed significantly between the nine forest soils (all P<0.001). Furthermore, SOC and the four humic carbon fractions all significantly increased with increasing latitude (all P<0.001, Figure 2).
According to climatic zone classification, the humic C fractions of the forest soils were of the order tropical < subtropical < temperate. The contents of HAC were 2.19, 3.67, and 6.47 g kg-1 in tropical, subtropical, and temperate forest soils, respectively. The contents of HEC were 8.91, 10.88, and 17.26 g kg-1, respectively. HAC and HEC contents were significantly different between the different climatic zones (P<0.05) (Figures 2g and 2j). The contents of SOC, FAC, and HUC were significantly lower in tropical and subtropical forests than in temperate forests (P<0.05), while the difference between tropical and subtropical forests was not significant (Figures 2f, 2h and 2i).
Figure 2 Humic carbon fractions in forest soils along the north-south transect of eastern China. Data are humus carbon fractions in different climatic zones. TF, Tropical forest; SF, Subtropical forest; MF, Temperate forest. Different letters represent significant differences at the P=0.05 level.
Table 2 Changes in soil humic organic carbon fractions of different forests along the North-South Transect of Eastern China
Sites Soil organic carbon (SOC, g kg-1) Humic acid carbon (HAC, g kg-1) Fulvic acid carbon (FAC, g kg-1) Humin carbon (HUC, g kg-1) Extractable humus carbon (HEC, g kg-1)
T-1 23.12±1.03 a 2.19±0.12 a 6.76±0.19 b 13.69±0.95 b 8.92±0.26 a
S-1 27.23±1.06 a 3.59±0.10 b 4.86±0.34 a 11.37±0.32 a 8.53±0.35 a
S-2 33.85±3.32 b 4.07±0.30 c 7.26±0.40 c 24.75±0.04 d 11.64±0.49 b
S-3 39.58±2.43 c 3.37±0.02 b 9.12±0.24 d 27.12±0.11 e 12.49±0.18 c
M-1 42.40±5.82 c 5.70±0.16 d 10.54±0.06 f 24.98±0.09 d 16.05±0.41 e
M-2 39.74±1.62 c 6.19±0.13 ef 9.07±0.35 e 18.29±0.06 c 14.93±0.11 d
M-3 68.29±3.80 e 6.39±0.16 f 11.29±0.13 g 49.98±0.94 g 17.70±0.06 f
M-4 77.00±7.67 f 8.12±0.08 g 11.74±0.83 h 48.79±0.96 f 19.94±0.20 g
M-5 49.14±1.05 d 5.94±0.39 de 11.48±0.07 g 27.25±0.17 e 17.68±0.19 f
F 88.72 386.29 173.66 2364.18 810.65
P <0.001 <0.001 <0.001 <0.001 <0.001

T-1, Jiangfenglin, tropical monsoon forest; S-1, Dinghushan, southern subtropical monsoon evergreen broad-leaved forest; S-2, Jiulianshan, subtropical evergreen broad-leaved forest; S-3, Shennongjia, northern subtropical deciduous evergreen mixed forest; M-1, Taiyue, warm temperate deciduous broad-leaved forest; M-2, Donglingshan, warm temperate deciduous broad-leaved forest; M-3, Changbaishan, temperate conifer broad-leaved mixed forest; M-4, Liangshui, temperate conifer broad-leaved mixed forest; M-5, Huzhong, cold temperate coniferous forest.
Data are expressed as means ± standard errors (n=4). Data with same lowercase letters indicate no significant differences at P=0.05 level

3.2 Ratios of humic carbon fractions to SOC

HAC:SOC ratios were estimated as 9.48%, 11.29%, and 12.27% in tropical, subtropical, and temperate forests, respectively, and did not significantly differ between climatic zones (P=0.087) (Figure 3a). FAC:SOC ratios were 29.31%, 20.87%, and 20.68% in tropical, subtropical, and temperate forests, respectively (Figure 3b). HUC:SOC ratios were relatively stable at 60% (Figure 3c), and did not significantly differ between climatic zones (F=0.084, P=0.92). HAC:FAC ratios were 32.37%, 55.76%, and 60.04%, and HAC:HEC ratios were 24.54%, 34.68%, and 37.49% in tropical, subtropical, and temperate forests, respectively, and all followed the order tropical < subtropical < temperate (Figure 4).
Figure 3 Distribution ratios of soil humic carbon fractions in different forest types. HAC:SOC (%), FAC:SOC (%), and HUC:SOC (%) represent ratios of humic acid carbon, fulvic acid carbon, and humin carbon to soil organic matter (SOC), respectively. TF, Tropical forest; SF, Subtropical forest; MF, Temperate forest. Different letters represent significant differences at the P=0.05 level.
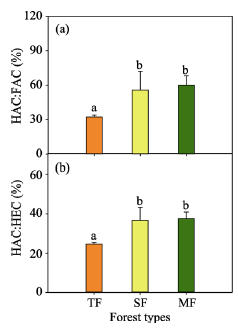
Figure 4 Soil humification in different forest soils. HAC:FAC (%) is the ratio of humic acid carbon to fulvic acid carbon; HAC:HEC (%) is the ratio of humic acid carbon to extractable carbon. TF, Tropical forest; SF, Subtropical forest; MF, temperate forest. Different letters represent significant differences at the P=0.05 level.

3.3 Latitudinal patterns of humic carbon fractions and their influencing factors

The contents of SOC, HAC, FAC, HUC, and HEC all increased with increasing latitude. Climate, soil features, and soil microbial characteristics together explained 92.41% of the variation in SOC, 91.32% of the variation in HAC, 90.94% of the variation in FAC, 94.22% of the variation in HUC, and 94.13% of the variation in HEC (Table 3 and Figure 5). The total effect of climate (Figures 5a, 5d, 5e and 5g) accounted for the largest variation in HAC, FAC, and HEC (approximately 78.72%, 88.61%, and 89.8%, respectively), while the total effect of soil features (Figures 5b, 5d, 5f and 5g) contributed most to SOC and HUC (approximately 85.92% and 87.72%, respectively). The greatest variation in SOC, HAC, FAC, and HEC was accounted for by the interactive effects of climate, soil texture, and soil microbes (g), while a joint contribution of soil features and soil microbial characteristics (f) was important for HUC (Figure 5). The independent effect of soil microbial characteristics was small (Figure 5 and Table 3).
Table 3 General linear model (GLM)analysis of environmental factors to soil humic organic carbon fractions
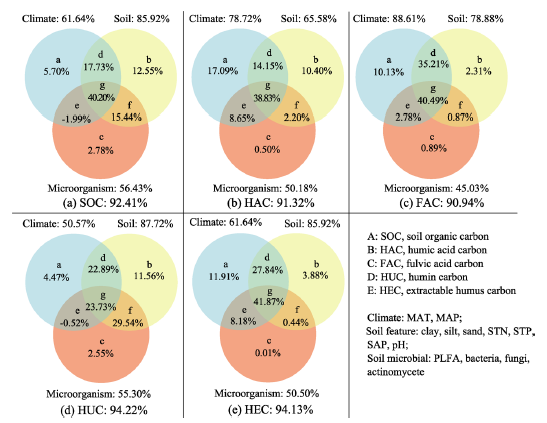
Figure 5 Effects of climate, soil environment, and soil microorganisms on soil humic organic carbon fractions along the north-south transect of eastern China. MAT, average annual temperature; MAP, average annual precipitation; STN, soil total nitrogen; SAP, soil available phosphorus; STP, soil total phosphorus; PLFA, total microbe by phospholipid fatty acid; bacteria, fungi, and actinomycetes represent the biomasses of different microbial groups; a, b, and c indicate the unique effects of climate, soil texture, and soil microbes, respectively; d, e, f, and g indicate their interactive effects.

4 Discussion

4.1 Humic carbon fractions in forest soils exhibit distinct latitudinal patterns

The contents of SOC, HAC, FAC, HUC, and HEC in forest soils increased with increasing latitude along the NSTEC transect. Martin et al. (1998) reported that HUC increased with increasing altitude, so the responses of soil humic carbon to temperature and precipitation are probably consistent with altitudinal and latitudinal gradients. The low temperatures at high latitudes and altitudes decrease microbial activity and the SOM decomposition rate, resulting in the accumulation of soil humic carbon (Curiel Yuste et al., 2007; Xu et al., 2017). High temperatures at low latitudes improve soil humification by stimulating the mineralization of polysaccharides and lignin, which form stable carbon-substituted non-lignin aromatics rich in carboxyl groups but poor in phenolic and methoxyl groups (Zech et al., 1992). Soil humic carbon (HAC, FAC, HUC, and HEC) was negatively correlated with MAT and MAP (Table 4), indicating that increases in the soil humic carbon fraction with increasing latitude were mainly caused by a reduction in oxidation and leaching with decreasing temperature and precipitation in high-latitude regions.
Changes in vegetation type along the transect also contributed to the latitudinal pattern of forest soil humic carbon fractions. The unique geographical location and monsoon climate of the NSTEC have resulted in a succession from broad-leaved to coniferous forest with increasing latitude, and forests along the transect produced different litter and roots with different qualities and chemical properties. Unpublished data show that the C:N ratios of roots and litters increase with increasing latitude along the NSTEC transect (personal communication). Furthermore, Berg et al. (1996) found that the root exudates and litter of broad-leaved tree species contained high levels of simple carbohydrates, organic acids, and amino acids, which are more easily used by microbes than those of coniferous species. Coniferous forests at high latitudes contain more phenolic resin components, lignin, and tannic acid (Gallet and Pellissier, 1997), and high phenol concentrations depress microbial activity (Blum et al., 1988). In addition, increases in SOC with latitude probably account for increases in soil humic carbon fractions, given that they are significantly correlated (Table 4).
Overall, the forest soil humic carbon fractions exhibited consistent latitudinal patterns, but differences were found between different climatic zones. HAC and HEC contents were significantly different between different climatic zones (P<0.001), and FAC and HUC contents in tropical and subtropical zones were significantly lower than those in the temperate zone (P<0.001). Differences in HAC and FAC content between the climatic zones might be correlated to soil pH, because the NSTEC mainly has acidic soil and the adsorption of HA on hematite is stronger than that of FA (Qin et al., 2015). One plausible explanation for this phenomenon is that HA molecules aggregate at a low pH, and the high molecular weight of HA, which usually includes aliphatic and hydrophobic carbon, results in it occupying a small area on the surface of hematite particles, thereby allowing many molecules to adsorb to each hematite particle. More research is required to explore the underlying mechanisms for the formation of soil humic carbon fractions at a large scale. The effect of climatic zone on HAC content was greater than that on FAC content, and HAC content was lower than FAC content in forest soils (Guggenberger and Zech, 1994). There were no significant differences in HUC content in tropical and subtropical forests, although the content of HUC in forest soils increased with increasing latitude along the NSTEC transect.
The structure of HU is mainly characterized by a combination of aliphatic hydrocarbon hydrocarbon and mineral colloids (Chang et al., 2014), and HU is the recalcitrant SOM to microbial decomposition (Song et al., 2008), which should not be influenced by MAT and MAP. Consequently, there were no significant differences in HUC content in tropical and subtropical forests.
Table 4 Correlations among soil humic carbon fractiona,soil nutrients,soil texture,soil microbes,and climate factors

4.2 Ratios of soil humic carbon fractions to SOC differ between climatic zones

Ratios of HAC, FAC, and HUC to SOC were HAC:SOC < FAC:SOC < HUC:SOC, and ratios of HUC:SOC were relatively stable over approximately 60% of the transect (Figure 3c). The humic substances of forest soils are characterized by higher level of FA than HA (Guggenberger and Zech, 1994; Guimaraes et al., 2013), as observed in this study. Guimaraes et al. (2013) explained that the frequent input of fresh organic residues in forest soil contributed to the higher proportion of FA.
There were no significant differences in HAC:SOC and HUC:SOC ratios between the climatic zones (P>0.05), but there were significant differences in the FAC:SOC ratio (P=0.001). This was mainly caused by differences in the stabilities of different humic carbon fractions. FA contains considerable amounts of labile components, such as proteins and carbohydrates, while HA contains aromatic and aliphatic molecules, and HA polymers readily bind clay minerals to form stable complexes (Pettit, 2004). HU is mainly composed of aliphatic methylene with small amounts of carbohydrate and protein, and its hydrophobic properties inhibit their dissolution in aqueous media and protect these components from microbes (Mylotte et al., 2015). Due to its high stability, the HUC content increased from tropical to temperate zones, but HUC:SOC ratios were not significantly different.

4.3 Soil humification in forests along the transect

HAC:FAC and HAC:HEC ratios indicate the degree of soil humification (Doran, 1980; Dou et al., 1990). In this study, HAC:FAC and HAC:HEC ratios were significantly correlated (Table 4), and both were lowest in tropical forests (Figure 4). The probable reason is that the large amount of litter in tropical forests is rapidly decomposed, which results in less humification. The HAC:FAC ratio has also been used as an indicator of soil maturity and fertility; a high ratio indicates high soil fertility (Li et al., 2008). In tropical forests, high soil temperatures increase microbial activity, thereby accelerating SOM decomposition and SOM reutilization by plants. In this study, the ratios of HAC:FAC were less than 1 in all of the forests studied, and the pattern was tropical < subtropical < temperate forests, indicating that the accumulation rate of HAC is greater than FAC, i.e., the more labile FAC fraction is lost with increasing latitude. This explains why trends in the HAC:SOC ratio and HAC were similar in different climatic zones but opposite to those of the FAC:SOC ratio and FAC (Figure 3).

4.4 Climate and soil features determine the latitudinal patterns of soil humic carbon

Climate, soil features, and soil microbial characteristics significantly influenced the latitudinal patterns of soil humic carbon, explaining 91%-94% of the variance. Climate explained about 80% of the latitudinal variance in HAC, FAC, and HEC, while soil features explained about 85% of the latitudinal variance in SOC and HUC. Lignin is a chemical intermediate during humus formation; the 13C values of lignin are similar to those of HA and FA (Silva et al., 2013), which may partially explain the high similarity of the influencing factors in HAC and FAC. Soil physical protection may protect humic substances from microbial biodegradation and oxidation (Balesdent et al., 2000; Spaccini et al., 2000). All of the sampled forest plots were in climax forests that were relatively undisturbed by humans, so their soil was relatively protected, which may consolidate the dominant effects of climate on the latitudinal patterns of HAC and FAC along the forest transect. Furthermore, FAC is more easily utilized than HAC as an energy source by soil microbes, because of its characteristics and low physical protection by clay (de Moraes et al., 2011); therefore, the effects of soil microbes are greater on FAC than on HAC.
The factors that influenced HUC differed from those that influenced the other humic fractions (Figure 4), and the interactive effects of soil features and soil microbial characteristics explained most of the variance in HUC. HU differs in its formation and structure from other humic fractions (Hempfling and Schulten, 1991; Fabbri et al., 1996). HU complexes are considered macro-organic substances and are the more resistant to decomposition (Pettit, 2004). HUC represents the oldest soil humic carbon fraction (Campbell et al., 1967), and the protogenesis of soil biological molecules has a huge contribution to HUC formation (Preston et al., 1994). Therefore, climatic and microbial factors mainly influence the latitudinal pattern of HUC, with relatively stable ratios of HUC in the forest transects (about 60%).

5 Conclusions

Soil humic carbon fractions exhibited similar latitudinal patterns, and all increase with increasing latitude. Soil humic carbon fractions were ordered HAC < FAC < HUC, where the ratio of HUC to SOC was about 60% in all forest soils and was not significantly different between tropical, subtropical, and temperate forests. The HAC:SOC ratios increased from tropical to temperate forests, while the FAC:SOC ratios decreased. Furthermore, HAC:FAC and HAC:HEC ratios were both higher in subtropical and temperate forests than in tropical forests. The latitudinal patterns of soil humic carbon fractions in forests are mainly controlled by climate, and the interactive effect of climate, soil features, and soil microbial characteristics accounted for most of the variation in SOC, HAC, FAC, and HEC; the interactive effect of soil features and soil microbes could explain the largest variations in HUC. Our findings elucidate the latitudinal patterns of soil humic carbon fractions in forests at a large scale and provide new insights into forest soil carbon sequestration.

The authors have declared that no competing interests exist.

[1]
Balesdent J, Chenu C, Balabane M, 2000. Relationship of soil organic matter dynamics to physical protection and tillage.Soil and Tillage Research, 53(3): 215-230.

[2]
Bao S D, 2008. Soil and Agricultural Chemistry Analysis, third edition. Beijing: China Agriculture Press. (in Chinese)

[3]
Benbi D K, Boparai A K, Brar K, 2014. Decomposition of particulate organic matter is more sensitive to temperature than the mineral associated organic matter.Soil Biology and Biochemistry, 70: 183-192.

[4]
Berg B, Ekbohm G, Johansson M B et al.Johansson M B , 1996. Maximum decomposition limits of forest litter types: A synthesis.Canadian Journal of Botany, 74(5): 659-672.

[5]
Blum U, Shafer S, Blum Uet al., 1988. Microbial populations and phenolic acids in soil.Soil Biology and Biochemistry, 20(6): 793-800.

[6]
Brunetti G, Plaza C, Clapp C Eet al., 2007. Compositional and functional features of humic acids from organic amendments and amended soils in Minnesota, USA.Soil Biology and Biochemistry, 39(6): 1355-1365.

[7]
Campbell C, Paul E, Rennie Det al., 1967. Applicability of the carbon-dating method of analysis to soil humus studies.Soil Science, 104(3): 217-224.

[8]
Canadell J G, Steffen W L, White P S, 2002. IGBP/GCTE terrestrial transects: Dynamics of terrestrial ecosystems under environmental change: Introduction. Journal of Vegetation Science, 13(3): 298-300.

[9]
Chang R R, Mylotte R, Hayes M H Bet al., 2014. A comparison of the compositional differences between humic fractions isolated by the IHSS and exhaustive extraction procedures.Naturwissenschaften 101(3): 197-209.

[10]
Curiel Yuste J, Baldocchi D D, Gershenson Aet al., 2007. Microbial soil respiration and its dependency on carbon inputs, soil temperature and moisture.Global Change Biology, 13(9): 1-18.

[11]
Davidson E A, Janssens I A, 2006. Temperature sensitivity of soil carbon decomposition and feedbacks to climate change.Nature, 440(7081): 165-173.

[12]
de Moraes G M, Xavier F A D, Mendonca E D et al.Mendonca E D , 2011. Chemical and structural characterization of soil humic substances under agroforestry and conventional systems.Revista Brasileira de Ciencia do Solo, 35(5): 1597-1608.

[13]
Doran J W, 1980. Soil microbial and biochemical changes associated with reduced tillage.Soil Science Society of America Journal, 44(4): 765-771.

[14]
Dou S, Hua S, Zhu T, 1990. 13C NMR studies of humic acids from soil.Chemical Journal of Chinese Universities, 11(7): 768-770. (in Chinese)

[15]
Fabbri D, Chiavari G, Galletti G C, 1996. Characterization of soil humin by pyrolysis(/methylation) gas chromatography mass spectrometry: Structural relationships with humic acids.Journal of Analytical and Applied Pyrolysis, 37(2): 161-172.

[16]
Gallet C, Pellissier F, 1997. Phenolic compounds in natural solutions of a coniferous forest.Journal of Chemical Ecology, 23(10): 2401-2412.

[17]
Guggenberger G, Zech W, 1994. Dissolved organic-carbon in forest floor leachates - simple degradation products or humic substances.Science of Total Environment, 152(1): 37-47.

[18]
Guimaraes D V, Gonzaga M I S, da Silva T O et al.da Silva T O , 2013. Soil organic matter pools and carbon fractions in soil under different land uses.Soil and Tillage Research, 126: 177-182.

[19]
Heikkinen R K, Luoto M, Kuussaari Met al., 2005. New insights into butterfly-environment relationships using partitioning methods.Proceedings of the Royal Society of London B: Biological Sciences, 272(1577): 2203-2210.

[20]
Hempfling R, Schulten H R, 1991. Pyrolysis-(gas chromatography) mass-spectrometry of agricultural soils and their humic fractions.Zeitschrift fur Pflanzenernahrung und Bodenkunde, 154(6): 425-430.

[21]
Huan Z Q, Xu Z H, Chen C Ret al., 2008. Changes in soil carbon during the establishment of a hardwood plantation in subtropical Australia.Forest Ecology and Management, 254(1): 46-55.

[22]
Jenkinson D S, Andrew S P S, Lynch J Met al., 1990. The turnover of organic-carbon and nitrogen in soil.Philosophical Transactions of the Royal Society of London B: Biological Sciences, 329(1255): 361-368.

[23]
Krull E S, Baldock J A, Skjemstad J O, 2003. Importance of mechanisms and processes of the stabilisation of soil organic matter for modelling carbon turnover.Functional Plant Biology, 30(2): 207-222.

[24]
Kumada K, 1987. Chemsitry of Soil Organic Matter. Tokyo: Japan Scientific Societies Press.

[25]
Lal R, Kimble J E,Levine E et al., 1995. World soils and greenhouse effect: An overview. In: Soils and Global Change. Boca Raton: Lewis Publication, FL, 1-7.

[26]
Li H B, Han X Z, Wang Fet al., 2008. Distribution of soil organic carbon and nitrogen in density fractions on black soil as affected by land use.Acta Pedologica Sinica, 45(1): 112-119. (in Chinese)

[27]
Lu N, Sun G, Feng X Met al., 2013. Water yield responses to climate change and variability across the North-South Transect of Eastern China (NSTEC).Journal of Hydrology, 481: 96-105.

[28]
Martin D, Srivastava P, Ghosh Det al., 1998. Characteristics of humic substances in cultivated and natural forest soils of Sikkim.Geoderma, 84(4): 345-362.

[29]
Murage E W, Voroney P R, Kay B Det al., 2007. Dynamics and turnover of soil organic matter as affected by tillage.Soil Science Society of America Journal, 71(4): 1363-1370.

[30]
Mylotte R, Verheyen V, Reynolds Aet al., 2015. Isolation and characterisation of recalcitrant organic components from an estuarine sediment core.Journal of Soils and Sediments, 15(1): 211-224.

[31]
Neff J C, Hooper D U, 2002. Vegetation and climate controls on potential CO2, DOC and DON production in northern latitude soils.Global Change Biology, 8(9): 872-884.

[32]
Olsen S R, 1954. Estimation of available phosphorus in soils by extraction with sodium bicarbonate. Miscellaneous Paper Institute for Agricultural Research Samaru. Washington: United States Department of Agriculture.

[33]
Parton W J, Schimel D S, Cole C Vet al., 1987. Analysis of factors controlling soil organic-matter levels in Great-Plains Grasslands.Soil Science Society of America Journal, 51(5): 1173-1179.

[34]
Pettit R E, 2004. Organic matter, humus, humate, humic acid, fulvic acid and humin: Their importance in soil fertility and plant health. CTI Research.

[35]
Preston C M, Hempfling R, Schulten H Ret al., 1994. Characterization of organic-matter in a forest soil of coastal british-columbia by nmr and pyrolysis-field ionization mass-spectrometry.Plant and Soil, 158(1): 69-82.

[36]
Qin X P, Liu F, Wang G Cet al., 2015. Adsorption of humic acid from aqueous solution by hematite: effects of pH and ionic strength. Environmental Earth Sciences, 73(8): 4011-4017.

[37]
Qualls R G, 2004. Biodegradability of humic substances and other fractions of decomposing leaf litter.Soil Science Society of America Journal, 68(5): 1705-1712.

[38]
Silva A C, Silva V E, Silva B P Cet al., 2013. Lignocellulosic and isotopic composition of vegetation and soil organic matter of a tropical peat: II humic substances and humification processes.Revista Brasileira de Ciencia do Solo, 37(1): 134-144.

[39]
Skjemstad J, Spouncer L, Cowie Bet al., 2004. Calibration of the Rothamsted organic carbon turnover model (RothC ver. 26.3), using measurable soil organic carbon pools.Soil Research, 42(1): 79-88.

[40]
Song G, Novotny E H, Simpson A Jet al., 2008. Sequential exhaustive extraction of a Mollisol soil, and characterizations of humic components, including humin, by solid and solution state NMR.European Journal of Soil Science, 59(3): 505-516.

[41]
Spaccini R, Piccolo A, Haberhauer Get al., 2000. Transformation of organic matter from maize residues into labile and humic fractions of three European soils as revealed by C-13 distribution and CPMAS-NMR spectra.European Journal of Soil Science, 51(4): 583-594.

[42]
Stevenson F J, 1994. Humus Chemistry: Genesis, Composition, Reactions. John Wiley & Sons.

[43]
von Lutzow M, Kogel-Knabner I, Ekschmittb Ket al., 2007. SOM fractionation methods: Relevance to functional pools and to stabilization mechanisms.Soil Biology and Biochemistry, 39(9): 2183-2207.

[44]
Wang C Y, He N P, Zhang J Jet al., 2015. Long-term grazing exclusion improves the composition and stability of soil organic matter in Inner Mongolian Grasslands.Plos One, 10(6): e0128837.

[45]
Wang Q, He N P, Yu G Ret al., 2016. Soil microbial respiration rate and temperature sensitivity along a north-south forest transect in eastern China: Patterns and influencing factors.Journal of Geophysical Research: Biogeosciences, 121(2): 399-410.

[46]
Wang J Y, Song C C, Wang X Wet al., 2012. Changes in labile soil organic carbon fractions in wetland ecosystems along a latitudinal gradient in Northeast China.Catena, 96: 83-89.

[47]
Watanabe A, Sarno Rumbanraja J, Tsutsuki Ket al., 2001. Humus composition of soils under forest, coffee and arable cultivation in hilly areas of south Sumatra, Indonesia.European Journal of Soil Science, 52(4): 599-606.

[48]
Wen D, He N P, 2016. Spatial patterns and control mechanisms of carbon storage in forest ecosystem: Evidence from the North-South Transect of Eastern China.Ecological Indicators, 61: 960-967

[49]
White D C, Davis W M, Nickels J Set al., 1979. Determination of the sedimentary microbial biomass by extractable lipid phosphate.Oecologia, 40(1): 51-62.

[50]
Xu Z W, Yu G R, Zhang X Yet al., 2015. The variations in soil microbial communities, enzyme activities and their relationships with soil organic matter decomposition along the northern slope of Changbai Mountain.Applied Soil Ecology, 86: 19-29.

[51]
Xu Z W, Yu G R, Zhang X Yet al., 2017. Soil enzyme activity and stoichiometery in forest ecosystems along the North-South Transect in Eastern China (NSTEC).Soil Biology and Biochemistry,104: 152-163.

[52]
Yang Z, Singh B R, Sitaula B K, 2004. Fractions of organic carbon in soils under different crop rotations, cover crops and fertilization practices.Nutrient Cycling in Agroecosystems, 70(2): 161-166.

[53]
Zech W, Ziegler F, Kogelknabner Iet al., 1992. Humic substances distribution and transformation in forest soils.Science of the Total Environment, 117/118: 155-174.

[54]
Zhang J J, Dou S, Song X Y, 2009. Effect of long-term combined nitrogen and phosphorus fertilizer application on 13C CPMAS NMR spectra of humin in a Typic Hapludoll of northeast China.European Journal of Soil Science, 60(6): 966-973.

[55]
Zhang J J, Hu F, Li H Xet al., 2011. Effects of earthworm activity on humus composition and humic acid characteristics of soil in a maize residue amended rice-wheat rotation agroecosystem. Applied Soil Ecology, 51: 1-8.

[56]
Zhang X S, Yang D A, 1995. Allocation and study on global change transects in China.Quaternary Sciences, 1(4): 43-52.

[57]
Zhao N, Yu G R, He N Pet al., 2016. Coordinated pattern of multi-element variablility in the leaves and roots across Chinese fores biomes. Global Ecology and Biogeography, 25: 359-367.

Outlines

/