Research Articles

Determinants and identification of the northern boundary of China’s tropical zone

  • XU Qian , 1, * ,
  • DONG Yuxiang , 1, 2 ,
  • WANG Yuying 1 ,
  • YANG Ren 1 ,
  • XU Chengdong 3
Expand
  • 1. Guangdong Provincial Key Laboratory of Urbanization and Geo-simulation, School of Geography and Planning, Sun Yat-sen University, Guangzhou 510275, China
  • 2. Xinhua College of Sun Yat-sen University, Guangzhou 510275, China
  • 3. LREIS, Institute of Geographic Sciences and Natural Resources Research, CAS, Beijing 100101, China

Author: Xu Qian (1984-), PhD, specialized in exploitation and protection of land resources. E-mail:

Received date: 2017-06-09

  Accepted date: 2017-07-10

  Online published: 2018-01-10

Supported by

National Natural Science Foundation of China, No.41371030

Copyright

Journal of Geographical Sciences, All Rights Reserved

Abstract

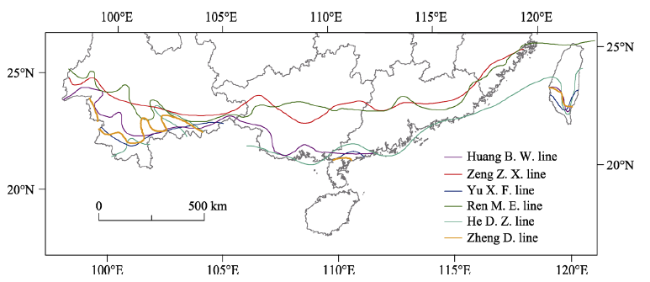
The influence of monsoon climatic characteristics makes the tropics of China different from those of other parts of the world. Therefore, the location of the northern boundary of China’s tropical zone has been one of the most controversial issues in the study of comprehensive physical regionalisation in China. This paper introduces developments in the study of the northern boundary of China’s tropical zone, in which different scholars delimit the boundary with great differences based on different regionalisation objectives, indexes, and methods. The main divergence of opinion is found in different understandings of zonal vegetation, agricultural vegetation type, cropping systems, tropical soil type and tropical characteristics. In this study, we applied the GeoDetector model, which measures the spatial stratified heterogeneity, to validate the northern boundaries of the tropical zone delimited by six principal scholars. The results show that the mean q-statistic value of the higher latitude boundary delimited by Ren Mei’e is the largest (q=0.37), suggesting that, of the rival views, it best reflects the regional differences between China’s tropical and subtropical zones, but it is not necessarily suitable for guiding the development of tropical agriculture. The mean values of the q-statistics of Zheng Du’s line and Yu Xianfang’s line around the Leizhou Peninsula at a lower latitude were smaller, at 0.10 and 0.08 respectively, indicating that the regional differences were smaller than those of Ren Mei’e’s boundary. Against the background of global climate change, the climate itself is changing in fluctuation. It is, thus, worth our further research whether the northern boundary of the tropical zone should not be a fixed line but rather should fluctuate within a certain scope to reflect these changes.

Cite this article

XU Qian , DONG Yuxiang , WANG Yuying , YANG Ren , XU Chengdong . Determinants and identification of the northern boundary of China’s tropical zone[J]. Journal of Geographical Sciences, 2018 , 28(1) : 31 -45 . DOI: 10.1007/s11442-018-1457-1

1 Introduction

Comprehensive physical regionalisation employs the similarity of and differences in the natural surface as means to divide the natural region, the unit of division being the characteristics of natural complex systems and their laws of occurrence, development and distribution (Bailey, 1983; Bailey et al., 1985); the delimitation of the regionalisation boundary is based on the principle of maximum difference inter-region and maximum similarity intra-region (Fortin and Drapean, 1995). The delimitation of a certain boundary in the regionalisation process is often controversial, as there is no clear global definition of the tropical zone (Oliver, 1991). According to the astronomical division, the tropics range lies between the Tropic of Cancer and the Tropic of Capricorn, but the tropical zone cannot be delimited accurately. Supan (1879) first delimited the physiographic boundary of the temperature zone, proposing the isotherm of sea-level annual mean temperature 20°C as the boundary between the tropical and temperate zones. Subsequently, hundreds of schools of thought have contended and developed many tropical division methods based on climate, vegetation, soil, etc. Teriung and Louie (1972) summarised 169 tropical division methods with different climate indexes. The internationally popular division method of Köppen (1918, 1923, 1936), modified by Geiger and Pohl (1954), provided the world’s first climatic regionalisation scheme based upon the influence of temperature and precipitation on regional crop growth, and mainly uses the isoline of the coldest monthly mean temperature of 18°C (initially set at 20°C) as the tropical boundary, this temperature being the minimum caloric requirement for coconut trees in the tropical zone. Pelzer et al. (1955) disagreed with Köppen’s scheme: pointing out, for example, that the mean temperature of the coldest month in Hanoi, which should be in the tropical zone, is 16.7°C, they argued it would be more appropriate to use frost as a division standard. Troll and Paffen (1964) comprehensively analysed land cover and the restriction of the tropical zone to areas remaining above certain prescribed temperatures and precipitation levels, concluding that the restriction of daily temperature in the tropical zone is more important than the monthly mean temperature over the whole year. Alvin and Kozlowski (1977) considered that the monthly mean temperature over the whole year to range between 20°C and 30°C in the tropical zone. Holdridge (1987) proposed the ‘life zone partition system’, with the isoline of annual mean biological temperature of 24°C as the tropical boundary. Wissnann (1948) distinguished the tropical standard between marine climate and continental climate, and considered that the tropical standard in the marine region is a mean temperature of the coldest month of 18.3°C, while the standard in the continental region is being absolutely frost-free. Longman and Jenik (1974) and Golley (1983) divided the tropical zone according to the spatial distribution of tropical crops, and contended that there is no subtropical zone between the tropical zone and the temperate zone, as this is included in the tropical range. Bridges (1978) and Walter (1983) considered the relationship between climate and temperature zones according to vegetation and soil. Lauer (1974) proposed a regionalisation scheme that comprehensively considers the radiation condition and the number of humid months. Lauer and Frankenberg (1985, 1988) later adjusted Lauer’s (1975) scheme by also considering azonal factors such as landform. Even applying the same index of each scholar, the tropical boundary is different when measured in different periods; thus, it can be seen that the tropical boundary is one in fluctuating change, its essence being a transitional zone evolving over time (Lockwood, 1978; Nieuwelt, 1977).
Scholars from various countries have conducted extensive research on the division of the tropical zone; the zoning index also tends to conduct diversified development from singleness. However, due to differences in regionalisation objectives and the selection of the index system, the views of different scholars are inconsistent, and the delineation of the global tropical boundary is not totally applicable to China’s actual situation (Manfred, 2003). For example, based on the difference between the monsoon climate and continental climate, Wissmann (1939) points out that the Köppen scheme is not applicable to the monsoon climatic region in South China and, instead, divides the tropical boundary using the standard of the coldest monthly mean temperature of 13°C.
China is significantly affected by the relationship between land-sea differentiation, landform, terrain, etc.; the tropical monsoon climate is prevalent (Zhu and Wan, 1963) and the winter temperature is lower than other global regions with the same latitude; therefore, the terrestrial part of the northern boundary of China’s tropical zone is not as regular as that of other countries, and its position lies further south. China’s tropical zone has a wide range of land and sea, a short biological growth period, high natural productivity, and great potential for development; it is, therefore, important to determine the boundary of its spatial distribution for the purposes of physical regionalisation of China (He D Z and He D, 1988; Huang, 1959; Zhong et al., 1990).

2 Different regionalisation schemes of the northern boundary of China’s tropical zone

Comprehensive physical regionalisation has always been the focus and core of Chinese physical geography (Wu and Zheng, 2001; Zheng et al., 2015): as early as the 5th century BC, the book ‘Yugong Geography’ recorded that China was divided into nine regions using the indexes of soil type and soil fertility. In the 1930s, Chu Kochen and other scholars began to research the modern physical regionalisation of China (Zhu, 1958, 1963, 1979). In the 1950s, the Chinese Academy of Sciences undertook the comprehensive physical regionlisation of China, highlighting the zonality law of physical geography. Regional planning work has since been comprehensively conducted in different fields (Wu and Zheng, 2003), but there remains significant controversy over some boundaries.
Due to the particularity of China’s monsoon climate and the influence of the country’s land-sea distribution, China’s temperature zone is divided into three zones: the tropical, temperate and cold zones, according to international practice, the subtropical zone having been split between the tropical and temperate zones (Corlett, 2013). In other parts of the world with the same latitude, the subtropical zone usually forms a desert zone due to the subtropical high belt: for example, in the typical and subtropical climate zone, the Mediterranean climate is wet in winter and dry in summer (Qiu, 1993a), while China’s subtropical zone, which lies within the monsoon climatic region, is a synchronisation of high temperatures and ample precipitation. The subtropical zone is located in the transitional zone between the tropical and temperate zones, showing obvious transitional properties in climate, soil and vegetation types. It has obvious seasonality compared with the tropical zone and is warmer than the temperate zone (Huang, 1992).
The subtropical zone is of great significance for China’s physical regionalisation, in determining whether the northern boundary of the tropical zone is the boundary between the tropical and subtropical zones or between the tropical and temperate zones. Therefore, exploring the northern boundary of the tropical zone is of great significance to the development of the tropical regional system and coping with the global climate change.

2.1 Progress in research methods

The top-down division and bottom-up mergence are two basic methods in the study of comprehensive physical regionalisation. The method of top-down division is mainly used for the study of large-scale regionalisation, such as nationwide regionalisation: First, the higher units perform type regionalisation, based on regional differentiation regularity, then the lower units perform regional regionalisation. The method of bottom-up mergence is suitable for the study of mid-scale and small-scale regionalisation, the lower units being aggregated and merged into the higher units sequentially. However, the practical regional planning work of large-scale regionalisation often uses the two methods in conjunction: the method of top-down division serves as macroscopic guidance, while the method of bottom-up mergence, with higher accuracy, is added as a complement (Zheng et al., 2015).
The early study of comprehensive physical regionalisation was limited by the data and technical conditions, mainly using qualitative and expert integration methods. The regionalisation boundary was confirmed by field investigation, soil and vegetation type distribution and expert experience. With the rise of quantitative geography in the 1970s and the development of ‘3S’ (GIS, GPS and RS) technology in the mid-1990s, the research methods of comprehensive physical regionalisation became increasingly quantitative and comprehensive. The combination of the traditional regionalisation methods - such as the overlay metod, principal factor method, geographic correlation analysis method and land type graph method (Liu, 1994; Liu et al., 2010) and the application of ‘3S’ technologies and metrological methods - such as cluster analysis (Ding et al., 2007), principal component analysis (Miao et al., 1988), uncertainty reasoning method (Cong et al., 2007), SOFM (self-organizing feature map) neural network analysis (Huang et al., 2011), grid analysis method (Chai et al., 2008) and fuzzy set theory (Kuang, 2006) - greatly improved the objectivity of the results of comprehensive physical regionalisation and the level of mathematical verification (Wu, 2010), but also improved the research level of comprehensive physical regionalisation and the accuracy of delimiting the regionalisation boundary.

2.2 Typical regionalisation schemes

In comprehensive physical regionalisation, because of the differences in regionalisation objectives and index selection, and the transitional character and complexity of natural zones, there is a significant controversy in the delimitation of the northern boundary of China’s tropical zone (the southern boundary of the subtropical zone), especially in the middle segment of the tropical zone (He D Z and He D, 1988; Hou, 1988; Huang, 1992; Qiu, 1993b; Ren, 1962, 1991; Tang, 1964; Yu et al., 1986; Zeng, 1962; Zhang, 1965; Zheng, 1999, 2008; Zhu, 1958). We will now introduce six kinds of regionalisation scheme with important influence (Figure 1):
Figure 1 Different regionalisation schemes of the northern boundary of China’s tropical zone
(1) Ren’s regionalisation scheme
Ren’s regionalisation scheme (1991) suggests that vegetation and soil should be mainly considered as division indexes, as these can better reflect the regional bioclimatic conditions; to avoid the anthropogenic influence and subjective effect, it is not appropriate to rely too much on accumulated temperature. Ren Mei’e stressed the difference between zonal vegetation and azonal mountainous vegetation, positing the former as a more suitable indicator than the latter for delimiting the northern boundary of the tropical zone. Evidencing the tropical delimitation in his regionalisation scheme, he contended that tropical fruits such as litchi and longan cannot exceed the Nanling ridge, and referred to the elephants, peacocks, crocodiles and other large tropical animals distributed in the ancient Pearl River Delta and the southern Fujian Delta as further bases for his scheme. To explain the controversial issue of classifying Guangzhou within the tropical zone, Ren considered that the frost in Guangzhou is the result of the flatland wildwood destruction in the urban district; were it still covered by primeval forest, Guangzhou’s flatland vegetation would not be affected by frost. The boundary of Ren’s scheme mainly passes through the mid-northern Taiwan, south-eastern Fujian, southern mainland Guangxi and Guangdong.
(2) Huang’s regionalisation scheme
Huang Bingwei (1959) stressed the physical geography zonality law. The main division index of Huang’s scheme is active accumulated temperature greater than 8000°C, and the tropical zone should meet the mean temperature of the coldest month exceeding 12°C, the extreme lowest temperature of the annual average not being less than 5°C and the absolute minimum temperature recorded being not less than 0°C. The tropical zone of Huang’s scheme includes two thermal zones, three regions or sub-regions, three zones and six provinces (Table 1).
Table 1 The tropical zone of Huang’s regionalisation scheme
Thermal zone Region/sub-region Zone Province
Tropical zone Humid region Eastern sub-region Tropical monsoon forest and
latosol zone
Plain of southern Taiwan and Kaohsiung
Plain and hilly southern Guangdong
Plain and hilly Hainan
Mountains of Hainan
Western sub-region Tropical monsoon forest and
latosol zone
Basin among mountains of southern Yunnan
Equatorial zone Humid region Equatorial rainforest zone Nansha Islands
(3) Zeng’s regionalisation scheme
Zeng Zhaoxuan (1980) considered the tropical zone as the area of high temperatures throughout the year, claiming it is more reasonable to delimit the northern boundary of the tropical zone with the ‘snow-free line’ instead of the ‘frost-free line’. He stressed that south China belonging to the tropical region should not be denied by the radiation frost that follows a cold wave. The tropical boundary of Zeng’s scheme lies mainly in the valley basin of south-western and southern Yunnan, Youjiang Valley, Xijiang Valley, the northern margin of Pearl River Delta, coastal areas of eastern Guangdong, coastal areas of southern Fujian, Taiwan and the nearby islands.
(4) He’s regionalisation scheme
This scheme selected more indexes than others, using the coldest monthly average temperature of 15°C, the annual average extreme lowest temperature of 3°C, absolute minimum temperature 0°C, the annual average of 1-2 frost days, and ≥10°C accumulated temperature greater than 5000°C as the main indexes. The northern boundary of the tropical zone in He’s scheme passes, in turn, through Gaozhou in western Guangdong, eastward coastal areas of western Guangdong, the Pearl River estuary, coastal areas of eastern Guangdong, coastal areas of middle-southern Taiwan, westward coastal areas of southern Guangxi and southern Xishuangbanna of southern Yunnan (He D Z and He D, 1988).
(5) Yu’s regionalisation scheme
Yu Xianfang (1981) stressed that geographers should focus on the geographical domain of natural complex systems in the research of zonal differentiation and should not divide the tropical zone completely according to latitude lines. Instead, it should be divided with multiple indexes according to the influences of different aspects, with the region meeting three indexes to be classified as the tropical zone, comprising ≥10°C accumulated temperature greater than 8200°C, 365 days with daily temperature ≥10°C and the annual average extreme lowest temperature of 5°C.
Regarding the controversy over whether Guangzhou should be included in the tropical zone, Yu Xianfang considered that although the temperature difference between Guangzhou and Haikou is only 2-3°C, this small difference is critical in distinguishing Guangzhou’s agricultural production since the region cannot provide the growth and development conditions of rubber and other tropical crops in winter; thus, Guangzhou should not be included in the tropical zone. The tropical zone of Yu’s scheme included Hainan Island and the Leizhou Peninsula in north-eastern China’s monsoon region, Xishuangbanna of Yunnan and the estuary area in western China’s monsoon region.
(6) Zheng’s regionalisation scheme
Zheng Du and others (Wu and Zheng, 2000; Zheng et al., 2015) contend that the temperature conditions (especially the average temperature of the coldest month) should be considered as the main basis for dividing the tropical zone; they select ≥10°C accumulated temperature (the guarantee of normal crop growth), the mean temperature of the coldest month and the extreme lowest daily mean temperature (the guarantee of tropical crops overwintering) as the main indexes, while vegetation and soil are chosen as the verification indexes.
Zheng proposed the concept of the tropical boundary, annual tropical boundary, real tropical boundary and tropical fluctuating zone based on the transitional properties between the tropical and subtropical zones. The boundary of the hottest year on record is called the annual tropical boundary, and that of the coolest year on record is called the real tropical boundary; furthermore, the area from the real tropical boundary to the annual tropical boundary is called the tropical fluctuating zone. The tropical range of Zheng’s scheme comprises the tropical boundary ranging between 21°40′N and 22°10′N, the annual tropical boundary ranging between 23°N and 23°40′N, the real tropical boundary at 21°30′N and the tropical fluctuating zone ranging between 21°30′N and 24°40′N.

2.3 Differences in the soil and vegetation types in different schemes

According to the soil and vegetation types of the different schemes, the boundary in Ren Mei’e’s and Zeng Zhaoxuan’s schemes is basically delimited between lateritic red soil and red soil (Figure 2). As Xiong and Li (1981) observed, as ‘the properties of lateritic red soil are closer to latosol, the latosol is the suitable soil type for the tropical economic crops, and the lateritic red soil is a kind of soil type which is likely to be introduced and propagated in this kind of tropical crops’; thus, the soil clay minerals of lateritic red soil and latosol will generally be combined into one zone. Therefore, the northern boundary of China’s tropical zone basically corresponds to the boundary between the lateritic red soil and red soil.
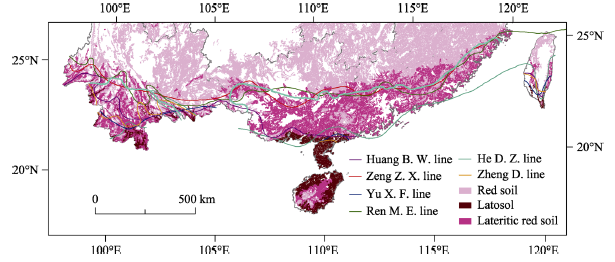
Figure 2 Map showing the northern boundary of China’s tropical zone with different regionalisation schemes and soil types
Regarding Hainan Island in the tropical zone, while the island’s periphery has latosol, the centre has lateritic red soil because of the terrain. However, this soil type differentiation cannot be used to determine that the island’s periphery with mainly latosol is in the tropical zone while the central area with lateritic red soil is mainly in the subtropical zone: the entire Hainan Island should belong to the tropical zone.
The northern boundary of the tropical zone coincides with the boundary between lateritic red soil and latosol based on Huang Bingwei’s scheme: the tropical area of Guangxi and Guangdong is mainly covered by latosol, but in southern Yunnan, due to the plateau terrain, the boundary between lateritic red soil and latosol is not clear; thus, the lateritic red soil and latosol are mixed in the tropical zone.
In terms of natural vegetation distribution, the focus of the controversy over the tropical zone’s northern boundary is different understandings of ‘zonal vegetation’. It is generally believed that flatland vegetation, the altitude of which is lower than 300-350 m, is zonal vegetation (Hou, 1988); the tropical rainforest, as zonal vegetation, is considered an important index in delimiting the tropical zone. However, in most parts of China, the original vegetation is almost non-existence due to human activities (Wu and Zheng, 2001); therefore, the division standards focus more on the crops, economic crop growth and the cropping system. In terms of the cropping system, the tropical zone of all the schemes belong to the category of double cropping rice or its continuous thermophile dry farming (Figure 3). However, according to the schemes of Ren Mei’e and Zeng Zhaoxuan, the boundary is basically consistent with the divide between double cropping rice or its continuous thermophile dry farming and single (double) cropping rice or its continuous chimonophilous dry farming, considering whether it is suitable for continuous cropping of winter crops after double cropping rice: for example, the flatland of central Guangdong and southern Fujian and the valley floor of Guangxi Youjiang, Xinjiang have generally implemented continuous cropping in winter of sweet potato after double cropping rice (Hou, 1988).
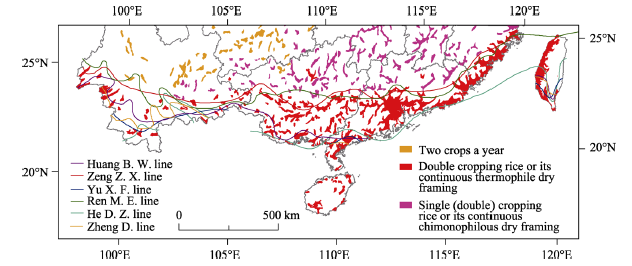
Figure 3 Map showing the northern boundary of China’s tropical zone with different regionalisation schemes and cropping systems
In conclusion, the difference of opinion between experts over the northern boundary of China’s tropical zone is mainly due to different understandings of ‘zonal vegetation’ and of regional agricultural cropping system and vegetation types. For example, Hou and Ren consider that an area in which there is continuous cropping of one winter crops after double cropping of rice can be considered tropical, but Huang Bingwei and Zhang Baokun strictly delimited the tropical zone to areas in which thermophilic crops grow all year round (Qiu, 1993a). Understanding of tropical characteristics is not consistent (Qiu, 1993b): for example, while some areas exhibit tropical signs due to fluctuant changes in the climate, these areas should not be classified within the tropical zone (Wu and Zheng, 2001).
In summary, the views of Chinese scholars on the northern boundary of China’s tropical zone are mainly divided into two factions:
(1) Nanling area
The advocates of this position are, Hou Xueyu (1988) and Ren Mei’e (1962, 1991). The boundaries of Hou’s and Ren’s divisions are very close, the boundary of Ren’s being further south than Hou’s, but Qiu Baojian (1993b) argues ‘division in Nanling area’, contending that longan and litchi should belong to the South Asian tropical crops, and that whether tropical crops can be planted in part of Guangdong and Guangxi is affected by the azonality, such as Nanling and the horseshoe landform. Moreover, if 90% guarantee of tropical crops growing normally is used to delimit the tropical zone, rubber trees, needing 7-8 years post-planting to start producing rubber and only delivering economic value for 1-2 years in every 10 years, will be devastated by suffering damage through excessive cold even once every 10 years on average; therefore, the northern boundary of the tropical zone should be further south.
(2) Near the Leizhou Peninsula
The advocates of this position are Huang Bingwei, Zhong Gongfu and others (Chen, 1984; Huang, 1959, 1992; Jing, 1962; Li and Wang, 1982; Pang, 1986; Qiu, 1993a; Sheng, 1987; Zhang B K, 1965; Zhang J M, 1991; Zhao, 1958; Zhong et al., 1990). Huang Bingwei believes that the tropical zone’s northern boundary should be the north of the Leizhou Peninsula (Huang, 1959), which is further north than others contend. Zhong Gongfu sets the northern boundary at about 22°N (Zhong et al., 1990), around the north end of the Leizhou Peninsula, dividing the tropical zone into four regions: Hainan and the Leizhou Peninsula, southern Taiwan, southern Yunnan and the South China Sea Islands. Zhang Baokun, Zhao Songqiao and others have a similar view, delimiting the northern boundary at the northern part of the Leizhou Peninsula: the main principle of division is that the tropical zone should be suitable for the growth of thermophilic crops all year round, and not affected seriously by the cold wave from China’s strong winter monsoons (Zhang, 1965), and the soil type should be latosol. Overall, the division scheme of ‘Nanling area’ is more focused on differences in the regional comprehensive characteristics, while the division scheme of ‘Near the Leizhou Peninsula’ is more inclined to the guiding significance of tropical crops.

3 Discriminatory analysis of different regionalisation schemes of the northern boundary of China’s tropical zone

The core of comprehensive physical regionalisation is spatial stratified heterogeneity, meaning minimum differences among the regions of the same regionalisation level and the biggest differences between different regions. Due to differences in understanding of the regional characteristics and the limits of traditional technology and methods, the northern boundary of the tropical zone is not quantification index; consequently, comparative analysis of different regionalisation schemes through quantitative methods was very difficult in previous studies. The GeoDetector model can quantify and objectively reflect geographical elements’ effects on natural complex systems, and the spatial stratified heterogeneity was realised (Wang and Hu, 2012; Wang et al., 2013; Yang et al., 2015; Yang et al., 2016). Therefore, faced by the controversial research status of the northern boundary of China’s tropical zone, and based on the GeoDetector model, this study conducted an empirical analysis aiming to detect and identify the different regionalisation schemes to achieve rich and clear cognition on this subject.

3.1 GeoDetector

Based on the law of regional similarity and difference, with regard to physical regionalisation, regions within the same natural area should share identity features, whereas different natural areas should have obvious regional differences (Fu et al., 2001). The GeoDetector model (Wang et al., 2010; Hu et al., 2011; Wang et al., 2016) (http://www.geodetector.org/) can measure the degree of spatial stratified heterogeneity and test its significance, through the within-strata variance less than the between strata variance. We now use the GeoDetector model to reveal spatial stratified heterogeneity through the process (q-statistic) of different climate indexes in the study area, aiming to assess different regionalisation schemes of the northern boundary of China’s tropical zone. The formula of the q-statistic is as follows:
$q=1-\frac{1}{N{{\sigma }
{2}}}\mathop{\sum }
{}{{N}_{h}}\sigma _{h}
{2}$ (1)
The spatial stratified heterogeneity will be realised by the northern boundary of China’s tropical zone, which is the major determinant of different climate indexes. We assessed spatial stratified heterogeneity between the tropical zone and subtropical zone by applying the q-statistic to the climate indexes. N is the number of all the samples in this study and σ2 denotes the variance of indexes. The study area is stratified into L stratums, denoted by h= 1, 2, …, L. q[0, 1]. The q-statistic can be used to test the significance of stratification through the process (q-statistic). An increase in the q-statistic denotes an increase in stratified heterogeneity, and vice versa. When q = 0, there is no spatial stratified heterogeneity in the study area, whereas when q=1, the study area has perfect spatial stratified heterogeneity.

3.2 Assess different regionalisation schemes

This study aims to tackle the controversial research status of the northern boundary of China’s tropical zone, using the GeoDetector model to assess its different regionalisation schemes. However, given the lack of climate data in Taiwan, we only assess China’s different regionalisation schemes. We chose six kinds of regionalisation scheme with important influence (Huang, 1959; He D Z and He D, 1988; Ren and Zeng, 1991; Yu et al., 1986; Zeng, 1962; Zheng, 2008) (Figure 1). From among the main regionalisation indexes of all the regionalisation schemes, we chose eight of the most commonly used indexes that can reflect the characteristics of the study area. These regionalisation schemes use main climate elements, comprising the annual average monthly mean temperature, the mean temperature of the coldest month, the lowest daily mean temperature, the extreme lowest temperature, ≥10°C accumulated temperature, the days with a daily temperature ≥10°C, the days with a daily minimum temperature ≤0°C, and the days with a daily minimum temperature ≤2°C (Figure 4). Except for the extreme lowest temperature, taken as the minimum of the 30 years from 1981 to 2010, the rest of the indexes use average values from 1981 to 2010 inclusive. All the climate data were taken from China’s 756 benchmark ground meteorological stations and automatic stations that recorded daily datasets from 1981 to 2010 (http://data.cma.cn). The point value data were interpolated using the Kriging interpolation method. All the raster data is at 250 m spatial resolution.
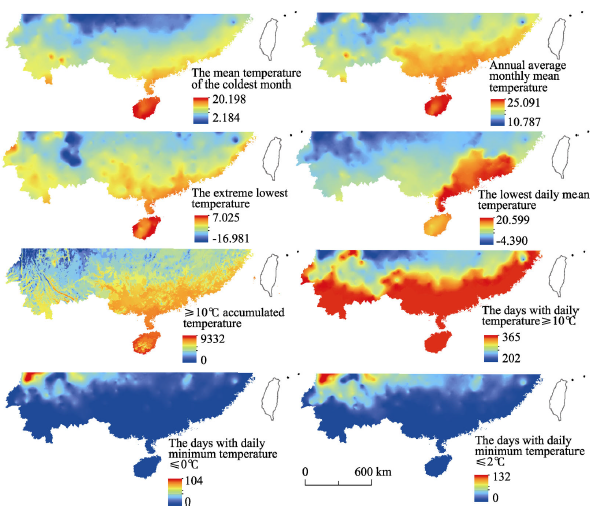
Figure 4 Annual average values of main climatic indexes in the northern boundary of China’s tropical zone from 1981 to 2010
Based on the GeoDetector model, the quantitative q-statistics of the different regionalisation schemes were acquired. The spatial stratified heterogeneity can be assessed by q-statistics. The northern boundary of the tropical zone differs in different regionalisation schemes, so the area of the tropical and subtropical zones are different. Therefore, the q-statistics of different regionalisation schemes must be different, using the GeoDetector probe for a total of 45,201 samples in the study area. For example, ≥10°C accumulated temperature of 7500°C and the mean temperature of the coldest month of 15°C were also used in He Dazhang’s and Yu Xianfang’s regionalisation schemes, but tropical scope of the two regionalisation schemes were different; thus, the variance of ≥10°C accumulated temperature in the two regionalisation schemes are different, and the q-statistics of the same index in the two regionalisation schemes must also be different. From the q-statistics of the six regionalisation schemes, the test results are as follows (Table 2): the highest score was q=0.37 for Ren Mei’e’s line, after which the other schemes scored as follows: Zeng Zhaoxuan (q=0.32) > He Dazhang (q=0.17) > Huang Bingwei (q=0.12) > Zheng Du (q=0.10) > Yu Xianfang (q=0.08). The maximum q-statistics of the eight indicators were all found along Ren Mei’e’s line and Zeng Zhaoxuan’s line. In the categories of the extreme lowest temperature, the mean temperature of the coldest month, the days with daily temperature ≥10°C, the days with a daily minimum temperature ≤2°C and the days with a daily minimum temperature ≤0°C, Ren Mei’e’s line has the highest q-statistics of the six regionalisation schemes, the values being 0.52, 0.52, 0.41, 0.30 and 0.20 respectively. In Zeng Zhaoxuan’s scheme, the q-statistics of ≥10°C accumulated temperature, annual average monthly mean temperature and the lowest daily mean temperature are highest in their respective categories among the six schemes, with values of 0.37, 0.37 and 0.35 respectively. Therefore, from the perspective of the spatial stratified heterogeneity of the tropical zone and subtropical zone, Ren Mei’e’s and Zeng Zhaoxuan’s regionalisation schemes should be considered the most valuable. The schemes of Zheng Du, Yu Xianfang and others are relatively weak in their expression of spatial stratified heterogeneity. Using the GeoDetector to study of the northern boundary of China’s tropical zone can satisfy the regionalisation principle regarding homogeneity of the within-strata value and maximum heterogeneity of the between-strata value. As the classification results are reasonably credible, the GeoDetector model can, thus, provide good technical support for comprehensive physical regionalisation.
Table 2 Detection results of the delimitation index of the northern boundary of China’s tropical zone (q value)
Regiona-
lisation
scheme
Mean temperature of the coldest month Extreme lowest temperature ≥10°C accumulated temperature Annual average of monthly mean temperature Days with daily temperature ≥10°C Days with daily minimum temperature ≤2°C Lowest daily mean temperature Days with daily minimum temperature ≤0°C Average of q value
Huang’s 0.24 0.20 0.11 0.10 0.10 0.07 0.07 0.05 0.12
Zeng’s 0.11 0.47 0.37 0.37 0.41 0.29 0.35 0.19 0.32
Yu’s 0.05 0.15 0.10 0.09 0.07 0.05 0.09 0.03 0.08
He’s 0.20 0.20 0.15 0.19 0.07 0.19 0.19 0.19 0.17
Ren’s 0.52 0.52 0.34 0.35 0.41 0.30 0.32 0.20 0.37
Zheng’s 0.23 0.16 0.09 0.09 0.07 0.05 0.07 0.03 0.10
Average 0.23 0.28 0.19 0.20 0.19 0.16 0.18 0.12 /
Maximum 0.52 0.52 0.37 0.37 0.41 0.30 0.35 0.20 /

4 Conclusion and discussion

Due to the uplift of the Qinghai-Tibet Plateau, China’s climate near the Tropic of Cancer is characterised by monsoons, causing delimitation of the subtropical and tropical boundaries to be a contentious issue in the research of physical regionalisation. This article summarises the principal scholars’ different viewpoints on the northern boundary of China’s tropical zones and uses the GeoDetector model to reveal spatial stratified heterogeneity, detecting and identifying different regionalisation schemes. The results are as follows: (1) The focus of the dispute over the northern boundary of China’s tropical zone has mainly been the middle segment of the tropical zone, concerning whether the regions from the north of the Leizhou Peninsula to the Tropic of Cancer belong to the tropical region. The boundary of Ren Mei’e’s scheme is set further north than others’, approximately in Nanling. However, the boundaries of Huang Bingwei’s, Zheng Du’s and others’ schemes are set further south, near the Leizhou Peninsula. The focus of the debate lies mainly in different cognitions about zonal vegetation, agricultural vegetation types, cropping systems, tropical soil types and other tropical characteristics. The differences in the soil and cropping systems are mainly displayed by some boundaries, with Ren Mei’e’s being the best representative, which divide the lateritic red soil and red soil, while the regionalisation schemes of Huang Binwei, Zhengdu and others set the dividing line nearly between lateritic red soil and latosol. Furthermore, the above boundaries, with Ren Mei’e’s being the best representative, are near the dividing line between double cropping rice or its continuous thermophile dry farming and single (double) cropping rice or its continuous chimonophilous dry farming. By detecting and identifying using the GeoDetector, the average q-statistic of Ren Mei’e’s scheme is the highest (q=0.37), followed by: Zeng Zhaoxuan (q=0.32) > He Dazhang (q=0.17) > Huang Bingwei (q=0.12) > Zheng Du (q=0.10) > Yu Xianfang (q=0.08). These findings show that, of the studied schemes, that of Ren Mei’e best expresses maximal within-strata homogeneity and between strata-variance between tropical and subtropical regions.
The problem of the northern boundary of China’s tropical zone needs to be further discussed as follows. (1) Though soil, vegetation, cropping systems, etc. are affected and restricted by climate conditions, they cannot fully reflect the characteristics of climate and they have certain lags as regards climate change (Qiu, 1993a). In addition, with the improvement of scientific and technological levels, soil properties, vegetation species, cropping systems, etc. will also change, with the result that regionalisation might be error-prone if only soil, vegetation and cropping systems are chosen as regionalisation indicators. It would be more reasonable for soil, vegetation and cropping systems to be used as auxiliary indicators for reference. In studying comprehensive physical regionalisation, climate indexes should be adopted as the dominant factors. (2) The region between the tropical and subtropical regions has gradient features, and its climate has been undergoing dynamic changes, with indicators of climate characteristics also varying. Thus, as the climate index in different time scales also presents certain differences, division of the tropical zone’s northern boundary through different methods produces different results, but the boundary must guarantee prominent regional characteristics. Furthermore, the northern boundary of the tropical zone should change dynamically, rather than being a fixed line (Yu, 1986). Therefore, changes in the boundary still need further analysis and research in the context of global climate change (Wu et al., 2015; Wu et al., 2016a; Wu et al., 2016b).

The authors have declared that no competing interests exist.

[1]
Alvin P D T, Kozlowski T T, 1977. Ecophysiology of Tropical Crops. New York: Academic Press.

[2]
Bailey R G, 1983. Delineation of ecosystem regions.Environmental Management, 7(4): 365-373.

DOI

[3]
Bailey R G, Zoltai S C, Wiken E B, 1985. Ecological regionalization in Canada and the United States.Geoforum, 16(3): 265-275.Present interest in environmental problems which are international, interstate or interprovincial in scope is drawing attention to the necessity for ecological regionalizations that will serve as a basis for intraregional transfer of experience. The major efforts at ecological regionalization by the national governmental agencies are described and compared. Although similar concepts have evolved in both countries, different systems of units have been developed for defining and mapping ecosystems at the regional scale. Before any regionalization is used it should be thoroughly tested, and modified if necessary.

DOI

[4]
Bridges E M, 1978. World Soils. Cambridge: Cambridge University Press.

[5]
Chai H X, Zhou C H, Chen Xet al., 2008. The new methodology of geomorphologic zonalization in Xinjiang based on geographical grid.Geographical Research, 27(3): 481-492. (in Chinese)A methodology was designed for the geomorphologic zonalization plan based on Srtm-DEM and TM imagery with a resolution of 90m. The method was demonstrated for Xinjiang. According to interpretation and classification of geomorphologic types, research on the distribution of differently geomorphologic types was conducted using the method of geographical grid from qualitative and quantitative analysis. On this basis, the new method of geomorphologic zonalization was put forward via the system clustering analysis method, by combining the merger from bottom to top with the partition from top to bottom. Firstly, the slope, relief, and altitude value from Srtm-DEM in spatial analyst were calculated and reclassified. Through testing, the 30m relief was regarded as the critical relief value for plain and mountain. And the 7 slope was regarded as the critical slope value for plain and mountain. Combined with the old map of geomorphologic zonalization of Xinjiang, the study area was divided into six subareas as Class 1 geomorphologic zonalization through the merger-partition from top to bottom. Secondly,the data format of geomorphologic types was transformed.The geomorphologic types data was interpreted from Srtm-DEM and TM imagery, and its data format was vector. For constructing the model of geographical grid, vector data was transformed to raster. Thirdly,parameters of the system clustering analysis were calculated. Then, based on the geomorphologic types, the method of merger from bottom to top was used to implement the system clustering analysis. Finally, the new method of geomorphologic zonalization in Xinjiang was primarily realized based on Srtm-DEM, TM imagery and geographical grid. And the new plan of geomorphologic zonalization in Xinjiang was put forward. By the new plan, geomorphologic zonalization in Xinjiang includes three classes,i.e.,macro geomorphology, medium geomorphology, and micro geomorphology. Class geomorphologic zonalization includes six geomorphologic subareas.Class geomorphologic zonalization includes 23 geomorphologic subareas.Class geomorphologic zonalization includes 200 geomorphologic subareas. This method can achieve the intelligentized partition of geomorphology by computer. After verification, based on the new method of geomorphologic zonalization, the precision of the boundaries of geomorphologic subareas in Xinjiang is very high.

DOI

[6]
Chen C J (Chinese Academy of Sciences “China’s Physical Geography” Editorial Committee), 1984. China’s Physical Geography (The Fascicule of Climate). Beijing: Science Press, 151-161. (in Chinese)

[7]
Cong W Q, Pan M, Li T F, 2007. Uncertainty reasoning and its application in the slope geological hazard zonation.Acta Scientiarum Naturalium Universitatis Pekinensis, 43(2): 891-302. (in Chinese)The uncertainty reasoning especially the probability reasoning was imported into the slope geological hazard zonation.Based on the analysis on the uncertain factor method,subjective bayes method,bayes network method and influence diagram method,the methods of their usage in the slope geological hazard zonation were pointed.A new way of the hazard zonation based on the uncertainty reasoning which is a development of the traditional methods was promoted and tested in Xiuyan County of Anshan city in Liaoning Province.

DOI

[8]
Corlett R T, 2013. Where are the subtropics?Biotropica, 45(3): 273-275.The tropics are clearly defined while ‘subtropics’ and ‘subtropical’ have been applied to a variety of zones, climates, and ecosystems. However, in the recent terrestrial biology literature, they have been used mainly for the zones between the tropics (±23.4oC) and ±30.0o. Adopting this standard would facilitate pan-subtropical comparisons.

DOI

[9]
Ding Y G, Zhang Y C, Liu J F, 2007. A new cluster method for climatic classification and compartment using the conjunction between CAST and REOF.Chinese Journal of Atmospheric Sciences, 31(1): 129-136. (in Chinese)It is theoretically demonstrated that the Cluster Analysis with Statistical Test(CAST) by Yao C.S.(1997) has a close relationship with the rotated empirical orthogonal function or principal component analysis(REOF/RPCA) to climatic classification and cluster compartment.Then,a new cluster method for climatic classification and compartment is proposed,which is theoretically based on CAST combined with REOF/RPCA in order to decide to accept or reject the assumption of a climatic category according to the ~2test from CAST.Euclidean distance coefficient d_(ij)(or c_(ij)) defined by the standard raw data in classical cluster analysis is related to the correlation coefficient of the raw data,both of them possess certain function relationship.Therefore,the calculation steps of the new cluster method proposed are, first,putting each principal component from RPCA to a meteorological variable field instead of the elected each central station corresponding to climatic classifications,second,determining the number of station(or variation) in every climatic category by using the ~2test from CAST.Then,the PCA or EOF is once again made at the stations with large loading,corresponding to every climatic category,and on the basis of the above result,the last climatic cluster and classification may be obtained.The result of the research shows that the CAST may considered a theoretical basis of the REOF/RPCA applied to climatic classification and cluster compartment,because REOF is a data-analytic technique which is based on the Principal Components Analysis(PCA) developed by Hotelling(1933),and it is not only applied to climatic classification and compartment but also used in other problems.In this paper,the theoretical relationship between CAST and REOF is verified by means of the statistical simulation experiment and real observational data calculations.For example,based on the daily data of maximum and minimum temperatures(1957-2001) from 203 meteorological stations in China by means of CAST combined with REOF/RPCA,the patterns of compartment for the extreme temperature sequences from 203 stations in China are obtained.This example also verifies that the new cluster method in this paper for climatic classification is more reasonable and reliable to determine each climatic category by using REOF(or RPCA) twice.

DOI

[10]
Fortin M, Drapean P, 1995. Delineation of ecological boundaries: Comparisons of approaches and significance tests.Oikos, 72(3): 323-332.In this study, quantitative spatial methods such as cluster analysis with spatial constraints and edge detection algorithms are compared with respect to their abilities to delimit boundaries from two-dimensional sampled data. While cluster analysis with spatial constraints forms clusters among neighboring sites that are similar, edge detection algorithms delimit areas of high rate of change. To determine whether the delineated boundaries could have arisen by chance, boundary and superfluity statistics are used and their statistical significance is assessed by permutation tests. Advantages and limits of each approach are illustrated using data sets of tree densities from a second growth stand of northern deciduous forest in southern Qu茅bec, Canada. It is found (1) that applying jointly these two types of approaches provides complementary information about the location and the intensity of the delineated boundaries; and (2) that the boundary and superfluity statistics are useful for assessing the statistical significance of boundaries.

DOI

[11]
Fu B J, Liu G H, Chen L D, 2001. Scheme of ecological regionalization in China.Acta Ecologica Sinica, 21(1): 1-6. (in Chinese)Ecological regionalization is a base for rational management and sustainable utilization of ecosystems and natural resources It can provide scientific basis for constructing healthy ecological environments and making policies of environmental management In this paper, based on synthetical analysis of the characteristics of ecological environments of China, the principles of ecological regionalization are discussed, and indices and nomenclature of ecological regionalization are proposed, The ecoregions in national scale are divided The results show that there are 3 domains, 13 ecoregions and 57 ecodistricts

[12]
Geiger R, Pohl W, 1954. Eine neue weltkarte der klimaebiete der erde.Erdkunde, 8(1): 58-60.

[13]
Golley F, 1983. Tropical Rain Forest Ecosystems, Structure and Functions. Amsterdam: Elsevier.The object of this book is to present selected data on the biology of tropical rain forests in the context of the ecosystem paradigm. These data are useful for the understanding and rational use of forests, and are especially important today when these forests are being so heavily exploited that they may virtually disappear by the end of the century. The approximately 16 million km2 of potentia...

[14]
He D Z, He D, 1988. North border of tropical climate of China.Acta Geographica Sinica, 43(2): 176-182. (in Chinese)

[15]
Holdridge L R, 1967. Life Zone Ecology. San Jose, Costa Rica: Tropical Science Center.

[16]
Hou X Y, 1988. Chinese Vegetation Geography. Beijing: Science Press, 183-185. (in Chinese)

[17]
Hu Y, Wang J F, Li X H et al., 2011. Geographical detector-based risk assessment of the under-five mortality in the 2008 Wenchuan earthquake, China.Plos One, 6(6): e21427.Abstract On 12 May, 2008, a devastating earthquake registering 8.0 on the Richter scale occurred in Sichuan Province, China, taking tens of thousands of lives and destroying the homes of millions of people. Many of the deceased were children, particular children less than five years old who were more vulnerable to such a huge disaster than the adult. In order to obtain information specifically relevant to further researches and future preventive measures, potential risk factors associated with earthquake-related child mortality need to be identified. We used four geographical detectors (risk detector, factor detector, ecological detector, and interaction detector) based on spatial variation analysis of some potential factors to assess their effects on the under-five mortality. It was found that three factors are responsible for child mortality: earthquake intensity, collapsed house, and slope. The study, despite some limitations, has important implications for both researchers and policy makers.

DOI PMID

[18]
Huang B W, 1959. A preliminary study of China’s comprehensive natural regionalization.Science Bulletin, 9(18): 594-602. (in Chinese)

[19]
Huang B W, 1992. Study on tropical limitation of China: I. Definitions of tropical and subtropical in the world.Scientia Geographica Sinica, 12(2): 97-104. (in Chinese)

[20]
Huang J, Gao Y, Zhao Z Q et al.Zhao Z Q , 2011. Comprehensive physiographic regionalization of China using GIS and SOFM neural network.Geographical Research, 30(9): 1648-1659. (in Chinese)Comprehensive physiographic regionalization has long been a core issue of physical geography in China.A great number of regionalization themes have been developed and applied as guidelines for regional development and geography teaching.However,these themes mainly use the traditional expertise-experiences-based regionalization methodology,which probably make themselves unreliable due to certain prejudices and different knowledge backgrounds of each individual.In order to overcome this obstacle,and to enrich regionalization research theoretically and methodologically,this paper tries to apply SOFM neural network to the regionalization.Supported by GIS technology and following the traditional three-level-strategy,we construct and operate SOFM neural networks at each level,using temperature factors,moisture factors and supplement factors respectively.Finally,we divide Chinese mainland into 8 temperature zones,17 moisture regions and 43 natural sub-regions,then compare this scheme with those based on traditional methods.The result shows that based on GIS platform,applying SOFM neural network into comprehensive physiographic regionalization has significant advantages,which is an important supplement and development to traditional regionalization paradigm.

DOI

[21]
Jing G H, 1962. Several basic questions about trying to talk about natural divisions.Acta Geographica Sinica, 28(3): 241-249. (in Chinese)

[22]
Köppen W, 1918. Klassifikation der klimate nach temperatur, niederschlag, und jahreslauf.Petermanns Mitteilungen, 64(193): 193-203.Klassifikation der klimate nach temperatur, niederschlag, und jahreslauf KOPPEN W. Petermann's Mitteilungen. 64, 193-203, 1918

[23]
Köppen W, 1923. Die Climate der Erde. Grundriβ der Klimakunde. Berlin: Leipzig.

[24]
Köppen W, 1936. Das geographische system der klimate. In: Köppen W, Geiger R. Handbuch der Klimatologie. Vol. 1,Part C, Berlin.

[25]
Kuang L H, Liu B C, Yao J C, 2006. Research on regionalization of debris flow risk degree with fuzzy and extension method.Journal of Catastrophology, 21(1): 68-72. (in Chinese)Regionalization of debris-flow risk degree is a complicated problem.Some influence factors on debris flow risk degree are qualitative and some are quantitative.We should combine them reasonably,then,we can obtained right regionalization result.Fuzzy mathematics and extension method are combined in this paper.Based on the matter-element theory,extension set theory and dependent function calculation,the risk degrees and membership degree of regionalization indexes of debris-flow are used to set up the classical and limited matter-elements.A fuzzy and extension model of regionalization of debris-flow risk degree is established in this paper.The example shows that this method can reflect truly the risk degree of the debris-flow.

DOI

[26]
Lauer W, 1975. Vom wesen der tropen. Klimaökologische studien zum inhalt und zur abgrenzung eines irdischen landschaftsgürtels. Akademie der wissenschaften und der literature mainz, Abhand.Math.-Naturwiss. Klasse, Wiesbaden, 3: 359-365.

[27]
Lauer W, Frankenberg P, 1985. Versuch einer geoökologische klassifikation der klimate.Geographische Rundschau, 37: 359-365.

[28]
Lauer W, Frankenberg P, 1988. Klimaklassifikation der erde.Geographische Rundschau, 40: 55-59.

[29]
Li S K, Wang S L, 1982. The National Agricultural Climate Zones of the Preliminary Discussion. Beijing: China Meteorological Press, 1-8. (in Chinese)

[30]
Liu P L, Liu C L, Deng Y Yet al., 2010. Landscape division of traditional settlement and effect elements of landscape gene in China.Acta Geographica Sinica, 65(12): 1496-1506. (in Chinese)The landscape division of traditional settlement is the job with a strong concept with theory and practicality.It is one of the most important topics in studies on cultural landscape division.In views of the characteristics of regional,systematic,stable,development,identical,typical and harmonious traditional settlement landscape in China,setting the inner similarity of traditional settlement landscape "Image" as precondition,and taking opposite consistency principle as main principle while considering other principles,this paper divides the nation's settlement landscape into three large-sized landscape regions,14 landscape regions and 76 landscape subregions.The division,from the practice,are based on the relevant landscape principle,such as the principle of environmental constraints,the principle of cultural guidance,the principle of integrated regions,the principle of relevant identity,the principle of covering and non-continuity,the principle of structures,the principle of comprehensive and landscape identity,etc.Naming principle of landscape area at all levels is area-name plus charecteristic and general name.These large-sized landscape regions,landscape regions and landscape subregions are all different in environmental quality and cultural background,so their integrated settlement and architectural landscapes show strong "identifiability" and "impressionality".The division of China's traditional settlement in this article is from the landscape gene perspective rather than based on cultural characteristics used before.Finally,the paper,in the view of "landscape gene",analyzes the main elements that influence the judges of China's traditional settlement landscape genes,from the elements of psychology,ecology,aesthetics,environment,culture,time and order and so on.

DOI

[31]
Liu W D, 1994. Land type and comprehensive physical regionalization in Jianghan Plain.Acta Geographica Sinica, 49(1): 73-83. (in Chinese)The Jianghan Plain, taking its name from the Changjiang and Hanshui Rivers. is located between 29°26' -31°23'N and 111°30'-114°32'E. and has an area of more than 36 000 square kilometers. The Plain. in the central south of Hubei Province. forms part of the Lianghu Plain (the Middle Reach Plain of Changjiang River) and the Donting Lake Plain in Hunan Province. It has a subtropical monsoon climate, with a frost-free period of 243-275 days and a mean annual precipitation of 980-1300mm. Low and flat and crisscrossed by rivers and lakes. it is the major farming area of Hubei Province. known as" ia land of fish and rice". Since the Ming Dynasty. the plain has been one of improtant commercial productive bases of China for grains and aquatic products. In this paper, land types in the Jianghan Plain are classified through the analysis of its physical environmental charactenstics. Some new quantitative methods for the analysis of land type structure are introduced.and the scheme for comprehensive physical regionalization is worked out on the bases of land type structure and the areal differentiation in this plain.

[32]
Lockwood J G, 1978. Tropical climatology.Nature, 272(5648): 104.

[33]
Longman K A, Jenik J, 1974. Tropical Forest and Its Environment. London: Longman.A fully revised edition aiming to summarize available biological information on the nature and functioning of tropical forests and practical implications for anyone using or managing tropical forest land. In addition to revised chapters on environmental factors, the forest community and tree growth physiology, new sections or chapters are added on nutrient cycling, productivity, flowering pheno...

DOI

[34]
Manfred D, 2003. Climatological characteristics of the tropics in China: Climate classification schemes between German scientists and Huang Bingwei.Journal of Geographical Sciences, 13(3): 271-285.Reviewing some important German scientists who have developed climatic regionalization schemes either on a global or Chinese scale, their various definitions of the tropical climate characteristics in China are discussed and compared with Huang Bingwei's climate classification scheme and the identification of the tropical climate therein. It can be seen that, due to different methodological approaches of the climatic regionalization schemes, the definitions of the tropics vary and hence also their spatial distribution in China. However, it is found that the tropical climate type occupies only a peripheral part of southern China, though it firmly represents a distinctive type of climate that is subsequently associated with a great economic importance for China. As such, the tropical climate type was mostly identified with its agro-climatological significance, that is by giving favourable growing conditions all-year round for perennial crops with a great heat demand. Tropical climate is, hence, conventionally regarded to be governed by all-year round summer conditions "where winter never comes".

DOI

[35]
Miao Q L, Li Z Y, Dou Y Z, 1988. Analysis of the major components of the climate and its demarcation in Shaanxi Province.Geographical Research, 7(2): 87-93. (in Chinese)Analysis has been made of the major components of phelimatic factors at n weather stations in Shanxi Province. The first m major components indicate the main characteristic features in the climatic field and thus types of climate in the Province are shown from the spatial distribution of the major components.In the analysis of the major components of the climatic field in the Province, the" first 3 components provide 88.8 percent informatin on the climatic field.The first component shows the water content, the second the heat condition and the third the snow accumulation and strong wind. Accordingly, the whole province can be divided into five climatic sub-zones and eleven climatic areas.

DOI

[36]
Nieuwelt S, 1977. Tropical Climatology. London: John Wiley.

[37]
Oliver J E, 1991. The history, status and future of climatic classification.Physical Geography, 12(3): 242-246.As an integral part of the organization of knowledge and discipline development, climatic classification has a long history. Earliest classifications were based upon a single variable, often day-length. Increased availability of data in the late 19th century permitted more quantitative approaches and the use of more than one variable. Vegetation distribution strongly influenced classification system development, with that devised by K ppen proving the most durable. Formulation of climatic indices permitted the development of an applied empiric approach and the development of the moisture-balance concept. Modern taxonomists have used air mass and synoptic climatological approaches in attempts to incorporate atmospheric processes. Synoptic approaches have been of importance since the introduction of methods of numerical taxonomy. The availability of large data sets and computer-generated analytic techniques has helped numeric classification to be of major research importance today. In the future, knowledge of classifications will remain an important component for an understanding of the climate system while newer techniques promise a highly utilitarian approach to the classification of climate. [Key words: alpine soils, alpine weathering, alpine loess, climate change.]

DOI

[38]
Pang Q T (The Agricultural Encyclopedia of China Editorial Committee), 1986. The Agricultural Encyclopedia of China (Agricultural Meteorology Volume). Beijing: Agriculture Press, 216-217, 332-333, 377-378. (in Chinese)

[39]
Pelzer K J, Gourou P, Laborde E D, 1955. The tropical world.Pacific Affairs, 28(4): 383

DOI

[40]
Qiu B J, 1993a. China’s tropical, subtropical, and temperate.Journal of Henan University (Natural Science Edition), 23(4): 11-12. (in Chinese)

[41]
Qiu B J, 1993b. The northern border of tropical zone in China.Scientia Geographica Sinica, 13(4): 297-306. (in Chinese)This paper makes comment on the article"The extent of tropical zone in China"in Vol.11,No.2 of this journal. The tropics,subtropics and temperate zone are divided by temperature in- dices.Temperature is only one of the climatic elements.Climatic zones are also divided by the other climatic elements.Their extents and borders are very different to each oth- er.Many climatologists do not agree the temperature zones.It is difficult that all of bio- geographers,pedogeographers and physical geographers agree to temperature zones. When subdividing physical geographical zone,it should be comprehensively consid- ered to all factors of physical geography,especially the factor of climate.It is not enough to consider the factors of vegetation and soil. The author considers that thermophilous crop,such as rice can be cultivated in whole year,and tropical woody plants,such as rubber tree do not suffer from freeze in tropical zone.The northern boundary of tropical zone coincides with 15 isotherm of the coldest month,and 5 isotherm of the mean annual minimum.Because the winter monsoon is very strong and very cold in China,so the Chinese tropics situates in the edge of world tropics,its boundary line should not lie too north,but in north of Leizhou Peninsula.

[42]
Ren M E, 1962. China’s approximate tropical zone.Journal of Nanjing University (Geography#), 29-34. (in Chinese)

[43]
Ren M E, Zeng Z X, 1991. The extent of tropical zone in China.Scientia Geographica Sinica, 11(2): 101-108. (in Chinese)From agricultural vegetation, clay-mineral assemblage in soils and history of disappearance of tropical fauna, it is suggested that central-southern Guangxi, central Guangdong, south-eastern Fujian and northern Taiwan should be included in tropical zone, known as Northern Tropics. These areas are centers of production of tropical fruits such as banana, lichi, mango etc. in the country. The prevailing cultivation system is double-cropping rice and winter sweet potato or corn. With intensive bio-chemical weathering, the dominant clay mineral in soils is kaolinite. These facts show that the dominant landscape in these areas is tropical. Therefore, these areas should not be designated as"Soutn-Subtropical". Study on historical data shows that during the Tang and Song dynasties(7th-12th century), large groups of typical tropical animals like elephant, crocodile and peacock could be seen here. This further supports the conclusion that these areas belong to tropical zone. Literature from Hong Kong and Taiwan have also been quoted to show that Shenzhen, Hong Kong and North Taiwan are within the Tropics.

[44]
Ruddle K, Manshard W, 1981. Renewable Natural Resources and the Environment. Dublin:Tycooly.

[45]
Sheng C Y (The Encyclopedia of China Publishing House Newsroom), 1987. Encyclopedia of China Publishing House (Volumes of Atmosphere Science, Ocean Science, Hydrology Science). Beijing-Shanghai: Encyclopedia of China Publishing House, 845-847. (in Chinese)

[46]
Supan A, 1879. Die temperaturezonen der erde.Petermanns Geog. Mitt., 2: 349.

[47]
Tang Y L, 1964. Basis and demarcation of tropical and subtropical of China in the view point of geo-flora.Collection of Plant Ecology and Geo-flora, 2(1): 135-143. (in Chinese)

[48]
Terjung W H, Louie S F, 1972. Energy input-output climates of the world: A preliminary attempt.Theoretical & Applied Climatology, 20(2): 129-166.A genetic climatic classification is presented which uses the fluxes of energy and moisture at the interface as its basis. Long and short wave inputs are abstracted into net radiation, whereas latent heat flux, vertical sensible heat flux and horizontal sensible heat flux (at interface level) are used as output components in this global classification. Six climatic groups and sixty-two climates result. For purposes of demonstration of the system, Budyko's model was used to derive the necessary data. It is believed, until future models generate more accurate data, that the main global features portrayed by the scheme are consistent and show reasonable trends.

DOI

[49]
Troll C, Paffen K H, 1964. Karte der jahreszeitenklimate der erde.Erdkunde, 18: 5-28.

DOI

[50]
Walter H, Breckle S W, 1983. Ecological Systems of the Geobiosphere. Berlin: Springer.

[51]
Wang J F, Li X H, Christakos Get al., 2010. Geographical detectors-based health risk assessment and its application in the neural tube defects study of the Heshun region, China.International Journal of Geographical Information Science, 24(1): 107-127.中国科学院机构知识库(CAS IR GRID)以发展机构知识能力和知识管理能力为目标,快速实现对本机构知识资产的收集、长期保存、合理传播利用,积极建设对知识内容进行捕获、转化、传播、利用和审计的能力,逐步建设包括知识内容分析、关系分析和能力审计在内的知识服务能力,开展综合知识管理。

DOI

[52]
Wang J F, Hu Y, 2012. Environmental health risk detection with GeogDetector.Environmental Modelling & Software, 33(10): 114-115.Human health is affected by many environmental factors. Geographical detector is software based on spatial variation analysis of the geographical strata of variables to assess the environmental risks to human health: the risk detector indicates where the risk areas are; the factor detector identifies which factors are responsible for the risk; the ecological detector discloses the relative importance of the factors; and the interaction detector reveals whether the risk factors interact or lead independently to disease.

DOI

[53]
Wang J F, Wang Y, Zhang Jet al., 2013. Spatiotemporal transmission and determinants of typhoid and paratyphoid fever in Hongta District, China.PLOS Neglected Tropical Diseases, 7(3): e2112.Background: Typhoid and paratyphoid fever are endemic in Hongta District and their prevalence, at 113 per 100,000 individuals, remains the highest in China. However, the exact sources of the disease and its main epidemiological characteristics have not yet been clearly identified. Methods and Findings: Numbers of typhoid and paratyphoid cases per day during the period 2006 to 2010 were obtained from the Chinese Center of Disease Control (CDC). A number of suspected disease determinants (or their proxies), were considered for use in spatiotemporal analysis: these included locations of discharge canals and food markets, as well as socio-economic and environmental factors. Results showed that disease prevalence was spatially clustered with clusters decreasing with increasing distance from markets and discharge canals. More than half of the spatial variance could be explained by a combination of economic conditions and availability of health facilities. Temporal prevalence fluctuations were positively associated with the monthly precipitation series. Polluted hospital and residential wastewater was being discharged into rainwater canals. Salmonella bacteria were found in canal water, on farmland and on vegetables sold in markets. Conclusion: Disease transmission in Hongta district is driven principally by two spatiotemporally coupled cycles: one involving seasonal variations and the other the distribution of polluted farmland (where vegetables are grown and sold in markets). Disease transmission was exacerbated by the fact that rainwater canals were being used for disposal of polluted waste from hospitals and residential areas. Social factors and their interactions also played a significant role in disease transmission.

DOI PMID

[54]
Wang J F, Zhang T L, Fu B J, 2016. A measure of spatial stratified heterogeneity.Ecological Indicators, 67: 250-256.Spatial stratified heterogeneity, referring to the within-strata variance less than the between strata-variance, is ubiquitous in ecological phenomena, such as ecological zones and many ecological variables. Spatial stratified heterogeneity reflects the essence of nature, implies potential distinct mechanisms by strata, suggests possible determinants of the observed process, allows the representativeness of observations of the earth, and enforces the applicability of statistical inferences. In this paper, we propose a q -statistic method to measure the degree of spatial stratified heterogeneity and to test its significance. The q value is within [0,1] (0 if a spatial stratification of heterogeneity is not significant, and 1 if there is a perfect spatial stratification of heterogeneity). The exact probability density function is derived. The q -statistic is illustrated by two examples, wherein we assess the spatial stratified heterogeneities of a hand map and the distribution of the annual NDVI in China.

DOI

[55]
Wissmann H V, 1939. Die Klima-und Vegetationsgebiete Eurasiens. Berlin: Zeitschr Ges Erdk, 1-14.

[56]
Wissmann H V, 1948. Klimagebiete der erde. In: Bluethgen J. Aligemaine Klimageographie. Berlin: Walter de Gruyter.

[57]
Wu S H, Liu W Z, Pan Tet al., 2016b. Amplitude and velocity of the shifts in the Chinese terrestrial surface regions from 1960 to 2011.Chinese Science Bulletin, 61(19): 2187-2197. (in Chinese)A terrestrial surface is characterized by a set of elements such as landform, climate, water, and soil and vegetation. The interaction of such elements forms a series of systematic regions on a terrestrial surface with a geographical zonation distribution; this is known as a terrestrial pattern. Realization of the internal relationship between the terrestrial elements and knowledge of their interaction and pattern formation would be helpful to further understand the physical geographical processes and the state of sustainable resource use and environmental protection planning. Changes in any one of the abovementioned terrestrial elements would lead to variations in the whole pattern. Currently, climate is the most variable element that could cause a shift in a terrestrial pattern. However, such transformation in a terrestrial pattern would contain a lag period. Previous studies show that China's climate has significantly changed, leading the other elements, such as phenology and crop planting distribution, to change as well. Consequently, the possibility of a terrestrial pattern shift has increased. A change in one element within a pattern shift would be a complicated nonlinear dynamic process. Therefore, the amplitude and velocity of a terrestrial pattern shift are the most important elements. The number of continuous days,(taken as the period of plant growing season) and accumulated temperature ?10°C are the main indicators used to describe the natural zone of a terrestrial pattern. Based on the homogenized mean daily temperature record from 545 meteorological stations in China from 1960 to 2011, the number of continuous days and accumulated temperature ?10°C were calculated to analyze the change in the characteristics of China's natural zone patterns. Changes in each natural zone and the mean latitude were calculated to represent the amplitudes of the land surface region shifts. A new function was set to represent the amplitude and velocity of regional boundary transformation. Then, the amplitudes, trends, and velocities of China's land surface region patterns and the typical region boundaries were calculated. The years in which significant regional shifts occurred were also identified. The results show a change in temperature states from a relative cold period(1960–1986) to a relative warm period(1987–2011); this change caused significant northward shifts of several major natural zones in China. The temperature zones in China, especially the northern boundary of the subtropical and warm temperate zones, had shifted northward during 1987–2011. During 1960–2011, the eastern part of the northern subtropical zone had moved 1.386°N. The northern and the eastern parts of the north boundary of the warm temperate zone had moved 0.354°N with velocities of 0.533°/10 a and 0.136°/10 a, respectively. The clustering of mutation testing showed that the northern boundaries of the subtropical and warm temperate zones substantially shifted northward in 1996 and 1997. Regional shifts occurred approximately 10 years after entering the relative warm period. This study has revealed the impacts of climate change on a macroscopic regional system; these findings could provide a scientific basis for climate-change adaptation.

DOI

[58]
Wu S H, Luo Y, Wang Het al., 2016a. Climate change impacts and adaptation in China: Current situation and future prospect.Chinese Science Bulletin, 61(10): 1042-1054. (in Chinese)The target of average global 2 warming compared to pre-industrial times was agreed by more than 100 countries, and was adopted at COP 21(21st session of the Conference of the Parties) to the UNFCCC(United Nations Framework Convention on Climate Change) in 2015. However, even if the INDCs(Intended Nationally Determined Contributions) for 2025 and 2030 could be fully implemented in the future, a warming of around 2.7 at least above pre-industrial would appear before 2100, which will result in negative impacts and risks for agriculture, natural ecosystem, socio-economic system, etc. Therefore, assessment on the climate change impacts and application of adaptation measures against climate change risks have been commonly accepted by the governments, scientific communities and international organizations. The newly-published Third Assessment Report of the Chinese Climate Change had assessed the newest findings about the impacts and adaptations of climate change in China, which was continually studied by Chinese scholars after the second assessment report. Most researchers have reached a consensus that the impacts of climate change had emerged in different fields(such as agriculture, water resource, ecosystem, cryosphere, and coastal zone) and areas of China. Climate change impacts have pros and cons, while the disadvantages outweighed, especially for the further warming under climate change scenarios. The characteristics of the impact assessments include: the assessment on the impacts of climate change on the key sectors are more comprehensive, the studies on the responding processes to the climate change for important sectors are more thorough, the assessing methods and data are more standardization, the pros and cons of climate change impacts were identified for different fields and areas. And then, this article analyzed the research gaps for the studies on the impacts and adaptations of climate change. Although several studies were entitled as-limate change impact', the influencing mechanism was poorly investigated. For example, most former studies just compared the range and trend of climate change with the changes in sectoral aspects, lacking the responding processes-based studies for vulnerability and adaptation. The impacts from climate factors and non-climate factors are difficult and hardly to separate, which, together with difficulties in climate change simulation and projection, caused the significant uncertainty in climate change risk assessment. As for the climate change adaptation, due to the above-mentioned problems existing in research on climate change impacts, the scientific basis for development of adaptive technologies is rather weak. Furthermore, in order to promote climate change adaptation, adaptive mechanism and capacity building are urgent to be strengthened. And last, the paper pointed out that the future studies should concentrate on reducing the research uncertainties for the impacts of climate change, the improvement of the quantitative level of risk assessment, enhancing the multi-disciplinarity studies, application of the adaptation principle of benefit tending and harm avoiding, promoting the orderly adaptation mechanism and the measurement of quantitative adaptation.

DOI

[59]
Wu S H, Yin Y H, Fan Jet al., 2010. Retrospect and prospect of regionalization system of China.Geographical Research, 29(09): 1538-1545. (in Chinese)Regionalization system of China has attained substantial achievements in the last decades by the Institute of Geographic Sciences and Natural Resources Research under the Chinese Academy of Sciences.Based on the stages of "integrated physical geographical regionalization-eco-geographical regionalization-comprehensive regionalization",significant progresses and achievements of some important regionalization schemes were introduced in this paper.In 1950s,integrated physical geographical regionalization was initiated in order to guide the distribution of agricultural production.In the 1990s,eco-geographical regionalization was carried out to instruct ecological development and environmental protection based on ecological theories and methods.Since the end of the 20th century,comprehensive regionalization has been developed along with the further research into earth science and sustainable development.A combination of physical factors with socio-economic factors has been the distinguishing characteristic of recent regionalization research.Moreover,the continuous innovation in methodology and technology,such as remote sensing,geographical information system and numerical simulation,has promoted the development of regionalization research.Regionalization system which was tightly coupled with national economic development and environmental protection would be an important direction of physical geography and even geography in future development.

DOI

[60]
Wu S H, Zhao Y, Tang Q Het al., 2015. Land surface pattern study under the framework of Future Earth.Progress in Geography, 34(1): 10-17. (in Chinese)Future Earth is a global platform for international scientific collaboration, which enables integrated research on grand challenges and transformations to sustainability, strengthens global partnerships between researchers, funders, and users of research, and communicates science to society and society to science. It combines IGBP, IHDP, WCRP, and DIVERSITAS. Its objectives are: to provide the knowledge required for societies in the world to face risks posed by global environmental change and to seize opportunities in a transition to global sustainability. It aims at scientific integration and co-production of knowledge. Analysis on characteristics of land surface pattern and its research progress shows that land surface is one of the main areas that Future Earth focuses on. Land surface pattern, formed by interaction of physical factors and different processes, may be taken as a fundamental regional frame for study of Future Earth. The prospective research of land surface pattern should make effort to improve the methodology to support progress of integrated research in physical geography.

DOI

[61]
Wu S H, Zheng D, 2001. Delineation of boundary between tropical/subtropical in the middle section for eco-geographic system of South China.Journal of Geographical Sciences, 11(1): 80-86.This paper discusses division on tropical/subtropical boundary of middle section in South China. This discussion results in new understanding on eco-geographic regions and their boundaries, especially on gradual changes of natural conditions between eco-geographic regions. It analyzes results of the same area by other researchers, clarifies differences and causes of the differences for the results. Boundaries of eco-geographic regions cannot be drawn as a line as changes from tropical to subtropical are gradual. Therefore, for an eco-geographic region like tropical zone, definite boundaries must be mapped while gradual changes are considered. Temperature, vegetation and soil are the indexes to divide tropical and subtropical. After indexes of tropical zone are confirmed, data of annual average index reflect general state of the tropical zone. Line from such data is called-ropical boundary-. On the other hand, affected by the monsoon climate, some years are hotter and some are cooler. In hotter years, temperature of north area of tropical boundary reaches tropical state whereas in cooler years, such area moves southward. Boundary of the hottest year is called annual tropical line and that of the coolest year true tropical line. Temperatures in areas south to annual tropical line can probably reach tropical in some years. Temperatures in areas south to real tropical line reach tropical every year. The area from true tropical to annual tropical is called tropical fluctuating zone. Therefore, new concepts of tropical, annual tropical, true tropical and tropical fluctuating zone are formed to understand tropical area from a new point of view in the paper. Based on the indexes of climate, vegetation and soil, boundaries of tropical, annual tropical, true tropical and tropical fluctuating zone of the study area are established. The tropical fluctuating zone explains different locating of different researchers. The paper also puts forward a new method to display boundary for eco-geographic regions.

DOI

[62]
Wu S H, Zheng D, 2003. Delineation of eco-geographic regional system of China.Journal of Geographical Sciences, 13(3): 309-315.

DOI

[63]
Xiong Y, Li Q K, 1987. China’s Soil. 2nd ed. Beijing: Science Press, 15. (in Chinese)

[64]
Yang R, Liu Y S, Long H L et al., 2015. Spatio-temporal characteristics of rural settlements and land use in the Bohai Rim of China.Journal of Geographical Sciences, 25(5): 559-572.Based on multiple remote-sensing image interpretation and classification, and economic and social data, this study focused on rural settlement and land use change amidst rapid urbanization. Rural settlements, spatial and temporal patterns of land use and influencing factors in the Bohai Rim were explored within 5 / 5 km grid cells, as per GIS spatial analysis and geostatistical analysis. Results show that the spatial distribution of rural settlements in the Bohai Rim is remarkably varied. The number of rural settlement sites in a 5 / 5 km grid cell exceeding 5.0 are distributed in a six-area pattern in the Bohai Rim; rural settlement dispersion is particularly high in agricultural regions in south Hebei and southwest Shandong, suggesting rural settlement density keeps increasing from northeast to southwest, characterized by high density and dispersed spatial distribution in traditional agricultural regions. Furthermore, rural settlements show dramatic spatial differences in terms of distribution and dynamic change degrees in the Bohai Rim. In terms of spatial distribution, rural residential land is always extensive in plains, with a high density of rural settlements, on the North China Plain in particular, and rural residential land in the south of Shandong province is also extensive, with most rural settlement land use areas in the 5 / 5 km grid cells exceeding 3 km 2 . However, traditional agricultural regions have underdeveloped economies, industrialization and tertiary industries, characterized by low urbanization rates, with farmers not feeling assimilated in rural or urban areas. In terms of the temporal sequence, urban expansion rapidly promotes the transformation of rural residential lands in rural-urban transitional belts of provincial capital or prefecture-level city into urban lands, and in traditional rural areas, residential lands are growing. The natural environment, transportation conditions, economic development and farmers- incomes all have effects on type of land use change and pattern of rural settlements. It is a core objective for future rural development to reconstruct a rational spatial pattern of villages or towns and well-organized village-town systems, build central villages, key towns or central towns, optimize or reconstruct production, living and eco-space of rural areas. It is of significance for rural geographical research to further interpret and explore spatial reconstruction theory.

DOI

[65]
Yang R, Xu Q, Long H L, 2016. Spatial distribution characteristics and optimized reconstruction analysis of China’s rural settlements during the process of rapid urbanization.Journal of Rural Studies, 47: 413-424.The population density of rural areas is generally lower than before due to rapid industrialization. Spatial optimized reconstruction of rural settlements is the key to rural sustainable development. Analyzing the distribution characteristics of rural settlements and their impact has profound implications for rural reconstruction. Several types of spatial distribution of rural settlements, such as clustered, random, and uniform discrete distribution, were found in China with significant regional differences. Rural settlements were denser in the southeastern regions compared to the northwestern regions. In regions such as plains, the spatial distribution of rural settlements was denser and the spatial distribution modes were mainly random and disperse. In regions such as cold alpine areas and desert fringes, the rural settlements density was low and mainly clustered. In the transition zone between hills and mountains, the density of rural settlements was high and the spatial distribution mode was mainly random. Rural settlements distribution was influenced by traditions and the economy, with economic development becoming increasingly influential. Additional factors that affected rural settlements distribution included average distance to main roadway, agricultural machinery, per capita grain production, per capita arable land, population density, elevation, precipitation, etc. Multiple distribution patterns should be used to reconstruct rural spaces in different geographical areas. Typical patterns included radially balanced, central land distribution mode; radially imbalanced distribution mode; multicore central land distribution mode, and corridor balanced and imbalanced distribution modes.

DOI

[66]
Yu X F, Huang Y L, Guo E H, 1986. China’s Tropical Zone. Guangzhou, Guangdong People’s Publishing House. (in Chinese)

[67]
Zeng Z X, 1962. China’s tropical place.Geographic Knowledge, (1): 12-14. (in Chinese)

[68]
Zeng Z X, Liu N W, Li G Zet al., 1980. The issue of China’s tropical boundary.Acta Geographica Sinica, 35(1): 87-92. (in Chinese)

[69]
Zhang B K, 1965. Climatic Regionalization of China. Beijing: National Commission on Atlas compiled, 197-201. (in Chinese)

[70]
Zhang J M (National Agricultural Climate Regionalization Committee), 1991. Agricultural Natural Resources and Agricultural Regionalization of China. Beijing: Agriculture Press, 14-17, 46-49, 114-117. (in Chinese)

[71]
Zhao S Q (Chinese Academy of Sciences, “China’s Physical Geography” Editorial Committee), 1958. China’s Physical Geography (The Fascicule of Pandect). Beijing: Science Press, 187-197. (in Chinese)

[72]
Zheng D, 2008. System Research of Ecological Geographic Area in China. Beijing: The Commercial Press, 132. (in Chinese)

[73]
Zheng D, Fu X F, 1999. A preliminary study on issues of integrated geographical regionalization.Scientia Geographica Sinica, 19(3): 2-6. (in Chinese)

[74]
Zheng D, Yang Q Y, Wu S H, 2015. Physical Geography Pandect in China. Beijing: Science Press, 339-347. (in Chinese)

[75]
Zhong G F, Huang Y L, Liang G Z, 1990. Characteristics and regional diversity of tropical China.Acta Geographica Sinica, 45(2): 245-252. (in Chinese)

[76]
Zhu K Z, 1958. Subtropical area of China.Science Bulletin, 8(17): 524-528. (in Chinese)

[77]
Zhu K Z, 1979. Zhu Kezhen Corpus. Beijing: Science Press, 350-356. (in Chinese)

[78]
Zhu K Z, Wan M Q, 1963. Phenology. Beijing: Popular Science Press, 21. (in Chinese)

Outlines

/