Research Articles

Links between Western Pacific Subtropical High and vegetation growth in China

  • HUANG Mei , 1 ,
  • HAO Man 1, 2 ,
  • WANG Shaoqiang 1, 2 ,
  • DAN Li 3 ,
  • GU Fengxue 4 ,
  • WANG Zhaosheng 1 ,
  • GONG He 1
Expand
  • 1. Key Laboratory of Ecosystem Network Observation and Modeling, Institute of Geographic Sciences and Natural Resources Research, CAS, Beijing 100101, China
  • 2. University of Chinese Academy of Sciences, Beijing 100049, China
  • 3. START Temperate East Asia Regional Center and Key Laboratory of Regional Climate-Environment for Temperate East Asia, Institute of Atmospheric Physics, CAS, Beijing 100029, China
  • 4. Key Laboratory of Dryland Agriculture, Ministry of Agriculture, Institute of Environment and Sustainable Development in Agriculture, Chinese Academy of Agricultural Sciences, Beijing 100081, China

Author: Huang Mei (1968-), specialized in the influence of climate change on ecosystems. E-mail:

Received date: 2017-02-06

  Accepted date: 2017-04-18

  Online published: 2018-01-10

Supported by

National Key Research and Development Program of China, 2017YFC0503905

National Natural Science Foundation of China, No.41671101, No.41630532, No.41575091

Copyright

Journal of Geographical Sciences, All Rights Reserved

Abstract

There is a lack of simple ways to predict the vegetation responses to the East Asian Monsoon (EAM) variability in China due to the complexity of the monsoon system. In this study, we found the variation of the Western Pacific Subtropical High (WPSH), which is one of the major components of the EAM, has a profound influence on the vegetation growth in China. When the WPSH is located more to the west of its climate average, the eastern and northwestern parts experience increased yearly-averaged normalized difference vegetation index (NDVI) and gross primary productivity (GPP) by 0.3%-2.2%, and 0.2%-2.2%, respectively. In contrast, when the WPSH is located more to the east of its climate average, the above areas experience decreased yearly-averaged NDVI and GPP by 0.4% to 1.6%, and 1.3% to 4.5%, respectively. The WPSH serves as a major circulation index to predict the response of vegetation to monsoon.

Cite this article

HUANG Mei , HAO Man , WANG Shaoqiang , DAN Li , GU Fengxue , WANG Zhaosheng , GONG He . Links between Western Pacific Subtropical High and vegetation growth in China[J]. Journal of Geographical Sciences, 2018 , 28(1) : 3 -14 . DOI: 10.1007/s11442-018-1455-3

1 Introduction

The Western Pacific Subtropical High (WPSH), which occupies about 20%-25% of the Northern Hemispheric surface, is a major permanent climate system (Zhou et al., 2009). It controls the movement of weather systems and water vapor transportation in the subtropical areas and often cause large-scale weather extremes. It has obvious seasonal cycles and remarkable variations in location and intensity on various timescales (Liu and Wu, 2004). Its variations in intensity, structure, and location strongly influence the climate in China, as it is closely associated with the summer monsoon in East Asia and the winter monsoon in northern China (Huang et al., 1985; Yang and Sun, 2003; Jiang et al., 2011). The spatial and temporal pattern of precipitation over eastern China depends to a large degree on the lateral displacement of the WPSH (Huang and Wang, 1985). Many studies have investigated the mechanism of the WPSH and its relationship with the summer precipitation and temperature in China (Sun and Ying, 1999; Lu 2002; Yang and Sun, 2003; Liu and Wu, 2004; Zhou and Yu, 2005). However, fewer studies have considered its impacts on the vegetation growth in China.
The trend of vegetation growth in China is thought to be driven by monsoon. Fu and Wen (1999) found the spatial and temporal variations of NDVI in East Asia are highly correlated with the variations in monsoon rainfall. Zhang et al. (2002) found the abrupt transition of the monsoon precipitation causes the seasonal variations of leaf area index (LAI) in eastern China. Previous studies on the vegetation-monsoon relationship in China depend much on the monsoon index. As the EAM system involves complex interactions among tropical, subtropical, and mid-latitude weather and climate systems, as well as the land-atmosphere-ocean interactions at various spatial and temporal scales, it is difficult to quantify the monsoon and its variation. Some indices, such as Webster and Yang Index (Webster and Yang, 1992), Monsoon Hadley Circulation Index (Goswami et al., 1999), Convection Index (Wang and Fan, 1999), Guo Index (Guo, 1983), Dynamical Normalized Seasonality Index (Li and Zeng, 2002), have notable differences which have led to discrepancies in the vegetation-monsoon relationship studies. For example, Jiang et al. (2013) reported a strong monsoon corresponds to positive net primary productivity (NPP) anomalies in southern China by using the Dynamical Normalized Seasonality Index while Li et al. (2015) found a strong monsoon corresponds to negative NPP anomalies in southern China by using the Guo Index. In general, there is a lack of simple methods for predicting the influences of the monsoon climate on vegetation growth. Due to the major influences of the WPSH on China’s weather and climate over vast areas, it is important to better understand the links between the WPSH activities and vegetation growth in China, and to predict the vegetation responses to monsoon climate.
To quantify the spatial and temporal variations of vegetation growth, NDVI is used as a measure of the vegetation growth, greenness and cover (Tucker, 1979). NDVI has been widely used in studying the linkages between climate signals and vegetation dynamics, such as the relationships between El Niño/Southern Oscillation (Li and Kafatos, 2000; Anyamba et al., 2002; Li et al., 2016), North Atlantic Oscillation (Li et al., 2015), sea surface temperature (Los et al., 2001), West African monsoon (Jarlan et al., 2005; Nicholson et al., 2010) and regional NDVI. The changes of NDVI in China have been intensively studied before (Piao and Fang, 2003; Ding et al., 2015). Previous studies show yearly and seasonal NDVI changes in China are closely correlated with precipitation and temperature change (Zhang et al., 2006; Cui and Shi, 2010; Zhang et al., 2013; Zhou et al., 2014).
The strength of a WPSH is usually measured by the extent of the 5880 gpm contours. The China Meteorological Administration (CMA) has defined a series of indices for quantifying the WPSH activities, including the area (Ia), intension (Ii), position (Ir), west boundary (Iw) and north boundary (In) indices which are routinely used for weather forecast and climate projection. In this study, we investigate the link between the WPSH indices and NDVI over China and the responsible mechanisms, focusing on the influences of the WPSH intensity and position anomalies. The objective of this study is to find a simple method for predicting and early warning the response of China’s vegetation to the monsoon climate.

2 Data sources and methods

2.1 Data sources

The NDVI datasets used in this study are produced by the Global Inventory Monitoring and Modeling Studies (GIMMS) group using the AVHRR/NOAA series satellites (http:// glcf.umd.edu/data/gimms/). The GIMMS NDVI datasets are at a spatial resolution of 8 km2 and 15 day interval and have been corrected to minimize the effects of volcanic eruptions, solar angle and sensor errors and shifts and thus can be used as the indicators of vegetation growth (Piao et al., 2003). We derive monthly NDVI from two images for each month using the maximum value composite (MVC) method (Holben, 1986). Pixels with average annual NDVI less than 0.05 were considered as non-vegetated areas and thus removed. We consider average NDVI from March to May, June to August and September to November, and December to February as the spring, summer, autumn and winter NDVI, respectively. The yearly averages of the NDVI is the average of monthly NDVI over a year. The yearly GPP data are the outputs of the atmospheric-vegetation interaction model (AVIM2) which is at a spatial resolution of 10 km2 (Ji et al., 2008; Li et al., 2015).
The monthly air temperature and precipitation data of 670 meteorological stations are obtained from the CMA. The station data are interpolated to the 8 km2 spatial resolution using ANUSPLINE (Hutchinson, 1989). The yearly water vapor flux data and the geopotential height at 500 hPa are from the NCEP/NCAR global reanalysis (Kalnay et al., 1996).
The monthly WPSH indices, including Ii and Iw are obtained from the CMA. They are derived from the geopotential height of 500 hPa. Ii is defined by a weighted sum of the grid points at which the geopotential height greater than 5880 gpm within the above region, with a weighting coefficient of 1 for geopotential height of 5880 gpm, of 2 for 5890 gpm, of 3 for 5900 gpm etc. Iw is the longitude of the WPSH western boundary of the 5880 gpm isoline. Ia is defined as the sum of grid points in which the geopotential height greater than 5880 gpm within the region of 10°-50°N and 180°-110°E, and Ir is defined as the average latitude of the range from 110°E to 150°E. Yearly Ii and Iw are the averages of the monthly Ii and Iw. The growth season Ii and Iw are defined as averaged over the period of March to September.

2.2 Methods

We use 95% of the standard deviation as threshold to identify the high and low values for Ii and Iw. In Equations (1) and (2), Ix represents a growth season WPSH index, \(\overline{{{I}_{x}}}\) is the mean of Ix, n is the length of the Ix time series and i is year. If the growth season NDVI anomaly of year i is greater (less) than 95% of the standard deviation of the growth season NDVI time series, then the year is defined as a high (low) WPSH year.
\[{{I}_{xi}}-{{\bar{I}}_{x}}>0.95\sqrt{\frac{\sum\nolimits_{i=1}
{n}{{{({{I}_{xi}}-{{{\bar{I}}}_{x}})}
{2}}}}{n}} \ \ (1)\]
\[{{I}_{xi}}-{{\bar{I}}_{x}}<-0.95\sqrt{\frac{\sum\nolimits_{i=1}
{n}{{{({{I}_{xi}}-{{{\bar{I}}}_{x}})}
{2}}}}{n}} \ \ (2)\]
Composite analysis is to average the variables, such as NDVI, air temperature, precipitation, 500 hPa geopotential height and water vapor fluxes, over high and low WPSH index years, respectively.

3 Results

3.1 Seasonal and annual variations of WPSH

Figure 1 shows the seasonal trajectory of WPSH, which exhibits a remarkable seasonal cycle. From January to April, the WPSH continues to extend westward, and then turns northeastward and reaches its northernmost position in August. After August, it turns southwestward and reaches its westernmost position in October. It then retreats southeastward to the sea. The WPSH intensity steadily increases from February to July and then decreases.
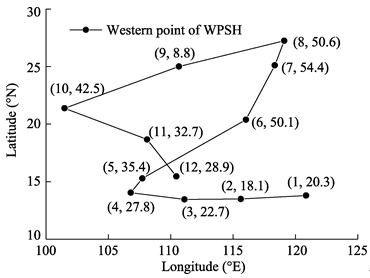
Figure 1 Seasonal trajectory of WPSH based on monthly means of Iw and Ir averaged over 1982-2010. The first number in the brackets denotes the number of month and the second number the monthly Ii averaged over the study period.
Yearly Ii is in the range of 13.2 and 68.5, and the year of 1994, 1995, 1998, 2005 and 2010 are identified as high Ii years, while 1984, 1985, 1986, 1999 and 2000 are identified as low Ii years. The high Ii year corresponds to a strong WPSP, while the low to a weak WPSH. Yearly Iw shifts between 93.3ºE and 132.5ºE with an average of 112.5ºE. The detected high Iw years are 1984, 1985, 1986, 1989, 1999 and 2000, while the low Iw years are 1983, 1987, 1995, 1998, 2003 and 2010. The high Iw year corresponding to the WPSP is located in the east position, while the low to a west position.

3.2 Variation of China’s NDVI

The spatial distribution of vegetation types in seven eco-regions and their regional mean yearly NDVI are shown in Figure 2. The seven eco-regions include Southwest China (SW), South China (SC), North China (NC), Inner Mongolia (IM), the Tibetan Plateau (TP) and North West China (NW). SW is dominated by tropical rain forest and subtropical evergreen forest, where the NDVI is the greatest. SC is mainly covered by subtropical evergreen forest and its NDVI is the second largest. NE is dominated by temperate forest and crops, while NC by crops with NDVI values of about 0.4. IM and the TP are dominated by grassland with NDVI values of around 0.2. NW mainly consists of desert, with sparse dry land vegetation of NDVI of around 0.14. Significant increasing trends are detected in the NDVI times series for SW, SC, NC and NW (P<0.05).
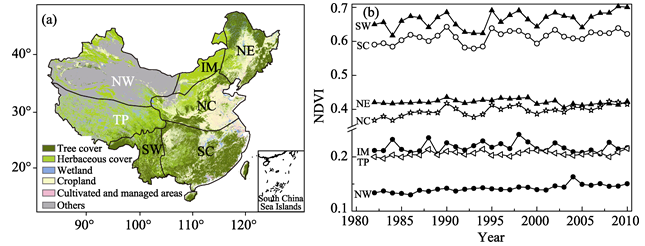
Figure 2 (a) Spatial distribution of vegetation types in the seven eco-regions of NE, IM, NW, NC, SC, TP and SW, representing Northeast China, Inner Mongolia, Northwest China, North China, Southeast China, Tibetan Plateau and Southwest China, respectively; (b) Regional mean yearly NDVI time series for eco-regions

3.3 Response of China’s NDVI to intensity of WPSH

Figure 3a shows yearly Ii is positively correlated with NDVI in most areas of NC and SC, but negatively in most areas of NE, NW and TP. Composite analysis shows yearly NDVI anomalies have almost opposite spatial patterns in strong and weak WPSH years (Figures 3b and 3c). In strong WPSH years, regional average yearly NDIV anomalies are positive in all of the eco-regions except for SW, while in weak WPSH years, they are negative in most of the eco-regions except for NE and IM.
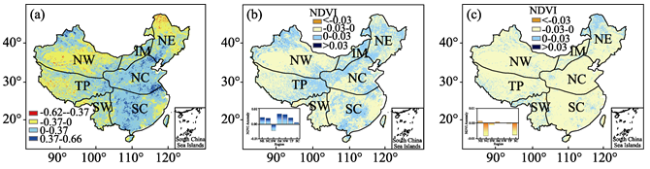
Figure 3 (a) Spatial distribution of correlation coefficient between yearly Ii and NDVI; (b) Spatial distribution of yearly NDVI anomalies composite for high Ii years; (c) As (b) but for low Ii years. All the anomalies in this research are relative to the average of 1982-2010.

3.4 Response of China’s NDVI to zonal shifts of WPSH

The zonal shifts of the WPSH have profound influences on China’s NDVI. The spatial pattern of NDVI anomalies for low Iw years are almost opposite to that for high Iw years. Most of China’s yearly NDVI anomalies are positive in the low Iw years, but negative in the high Iw years (Figures 4a and 4b). Regional averaged NDVI for NC, IM, NW and SC are about 3%, 0.4%, 1.3% and 1.6% lower than the 1982-2010 average for high Iw years, respectively, but are 1.1%, 0.5%, 0.3% and 2.2% higher for low Iw years, respectively.
However, not all areas in China are influenced by the variations of the WPSH. For example, average NDVI anomalies are negative in SW and TP for both high and low Iw years, indicating NDVI in SW and TP are not influenced by the zonal shifts of the WPSH. Figures 4a and 4b show NDVI anomalies are mostly negative in the southern part of NE in high Iw years, but mostly positive in low Iw years, which are consistent with NDVI anomalies in NC and IM during the two circulation patterns. However, the NDVI anomalies changes in the northern part of NE are opposite to that in the southern part of NE, indicating the northern part of NE may not be directly influenced by WPSH.
There is no simple one-to-one correspondence between the regional average NDVI and WPSH indices on annual time scale in most of the seven eco-regions. Only the regional NDVI average for NC and NW are significantly associated with Ia, with correlation coefficients of 0.38 and 0.48 (P<0.05), which explains 14% to 23% of the NDVI variations, respectively. Previous studies on the NDVI-monsoon relationships find no significant correlation between annual NDVI and monsoon index (Fu and Wen, 1999).
To better understanding the impacts of WPSH on vegetation growth, we conducted composite analysis of the GPP difference in low and high Iw years (Figures 4c and 4d). GPP is the amount of carbon assimilated by plants via photosynthesis, the process is believed to be influenced by climate and other environmental factors. The spatial pattern of model simulated GPP anomalies composite for low and high Iw years agree well with the corresponding NDVI anomalies. Regional averaged GPP for NC, IM, NW and SC are about 1.8%, 3.3%, 4.5% and 1.3% lower than the 1982-2010 average for the high Iw years, respectively, but are 2.2%, 1.4%, 0.8% and 0.2% higher for the low Iw years, respectively. The regional average GPP for NE, NC, IM and NW are significantly correlated with Ia, while for SW, TP and SC with Ir. Regional GPP average for NW is also significantly correlated with Iw. These correlation coefficients are between 0.37-0.40, indicting the variation of WPSH can explain 14%-16% GPP variations in China.
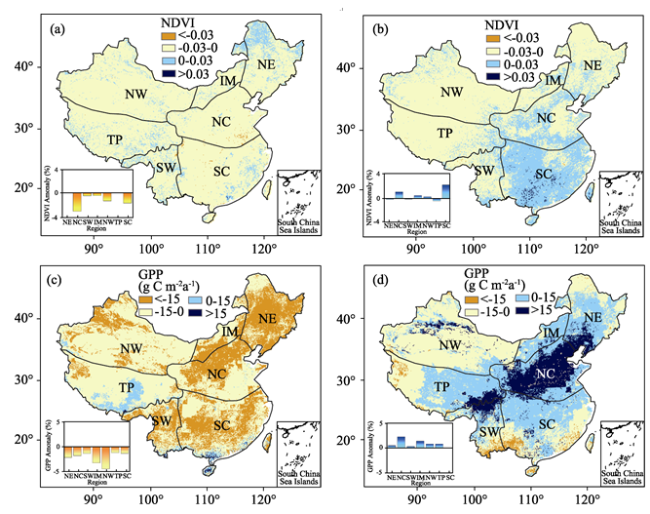
Figure 4 (a) Spatial distribution of yearly NDVI anomalies composite for high Iw years; (b) As (a) but for low Iw years; (c) Spatial distribution of yearly GPP anomalies composite for high Iw years; (d) As (c) but for low Iw years

4 Discussion

4.1 Impacts of anomalous zonal location of WPSH on water vapor transportation

The NDVI pattern differences in the high and low Iw years are associated with anomalous large-scale circulations. When the WPSH is in west position, the anomalous circulation pattern benefits the northeastward transport of the warmer tropical water vapor from the Bay of Bengal and the South China Sea along the northwestern flank of the WPSH. As Figure 5a shows, large quantities of water vapor are carried from the adjacent oceans to China. The convergence of the warmer tropical water vapor with the colder subtropical water vapor often results in heavy rainfall in eastern China. When the WPSH is in east position, it is relatively weak (Figure 5b). This circulation pattern suppresses the warmer water vapor transportation to east China, such that the vertically integrated water vapor anomalies are mostly negative over China.
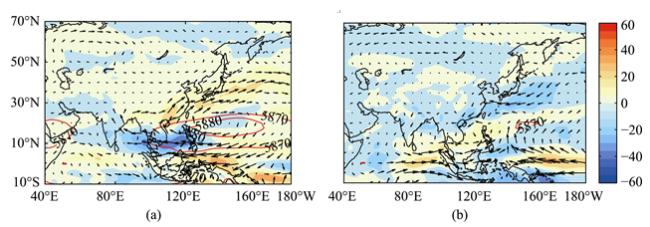
Figure 5 (a) The 500 hPa geopotential height and vertically integrated water fluxes anomalies composite for low Iw years; (b) As (a) but composite for high Iw years

4.2 Impacts of anomalous zonal location of WPSH on air temperature and precipitation

The spatial patterns of yearly precipitation anomalies are generally consistent with that of the yearly average vertically integrated water vapor flux. The yearly precipitation anomalies are positive in most areas of China in low Iw years, but negative in high Iw years (Figures 6a and 6b). Positive temperature anomalies occurred in most area of SC, NC, NW, IM and NE in low Iw years, while negative in high Iw years (Figures 6c and 6d).
Regional average precipitation is 10.0%, 8.7%, 12.3%, 9.1% and 3.7% higher than 1982-2010 average for NE, NC, IM, NW and SC in low Iw years, respectively, but are 0.9%, 3.0%, 5.9%, 5.4% and 2.4% lower than the average in high Iw years, respectively. Average temperature anomalies are in the range of -0.2ºC to 0.1ºC for NE, NC, IM, NW and SC in low Iw years, while in the range of -0.5ºC to -0.6ºC in high Iw years.
Figure 6e shows that NDVI is positively correlated with precipitation in IM and northwestern NW. Anomalous WPSH enhances precipitation which causes NDVI to increase in the low Iw years. However, it suppresses precipitation in the high Iw years, so the NDVI decreases. The NDVI-precipitation relationship in the above areas can generally explain the NDVI differences between the low and high Iw years.
NDVI is positively correlated with temperature in most areas of NC and SC (Figure 6f). The association of temperature and NDVI in the above regions can generally explain the NDVI variations during the two circulation patterns. Average temperature for low Iw years is higher than that for high Iw years in NC and SC, which cause higher NDVI in low Iw years than in high Iw years.
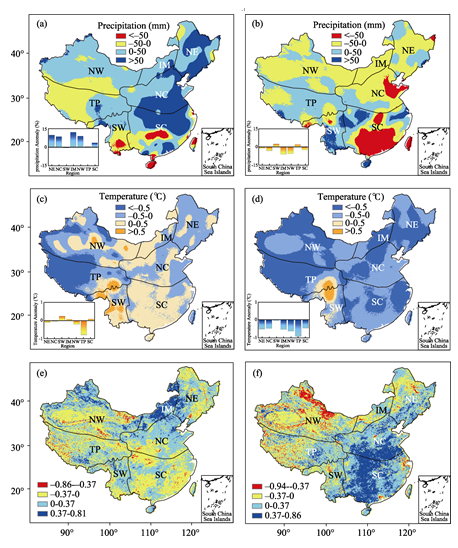
Figure 6 (a) Spatial pattern of yearly precipitation anomalies composite for low Iw years; (b) As (a) but for high Iw years; (c) Spatial pattern of yearly mean temperature anomalies composite for low Iw years; (d) As (c) but for high Iw years; (e) Spatial pattern of correlation coefficient between yearly NDVI and yearly precipitation; (f) As (e) but between yearly NDVI yearly mean temperature. 0.37 represents the threshold for 95% confidence level.

4.3 Impacts of anomalous WPSH zonal location on seasonal NDVI

The influence of climate factors on vegetation growth is the combination of precipitation, air temperature and other factors, and their impacts are different in seasons. Figure 8 shows spatial pattern of the correlation coefficients between seasonal NDVI and seasonal average air temperature and precipitation. Spring precipitation is positively correlated with NDVI in some areas of IM and NC, but negatively correlated with NDVI in eastern SC (Figure 7a). The higher spring precipitation in eastern SC is often accompanied by lower temperature corresponding to lower NDVI, so the precipitation is negatively correlated with NDVI in eastern SC. Spring temperature is positively correlated with NDVI in NC, IM, SC and northern NW (Figure 7b). Higher spring temperature favors snow melting, high soil moisture and thus vegetation growth.
Summer precipitation is negatively correlated with NDVI in some area of SC but it is positively correlated with NDVI in IM and northern NW (Figure 7c). Higher summer temperature is often accompanied by drought and heat wave, so summer temperature is negatively correlated with NDVI in most areas of IM, NW and NC, but it is positively correlated with NDVI in some areas of SC (Figure 7d).
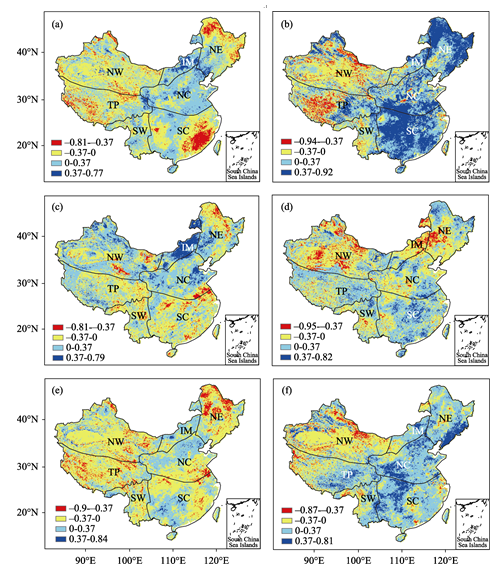
Figure 7 (a) Spatial pattern of correlation coefficient between spring precipitation and spring NDVI; (b) As (a) but for spring temperature; (c) Spatial pattern of correlation coefficient between summer precipitation and summer NDVI; (d) As (c) but for summer temperature; (e) Spatial pattern of correlation coefficient between autumn precipitation and autumn NDVI; (f) As (e) but for autumn temperature
Autumn precipitation is negatively correlated with NDVI in NW, NC and SC. Autumn temperature is positively correlated with NDVI in most areas of IM, NC and SC (Figure 7f). Higher autumn temperature prolongs vegetation’s growth season to increase NDVI.
Figure 8 shows seasonal NDVI composite for low Iw years is all greater than that composite for high Iw years in IM, NW, NC and SC. The seasonal relationships between NDVI and climate factors can generally explain the NDVI differences between low and high Iw years. For IM, higher spring and autumn temperature, as well as higher summer precipitation favors vegetation growth, so NDVI is greater in low Iw years. Although NW is not in the impact areas of the East Asian monsoon, its NDVI anomalies in low and high Iw years are consistent with those in IM. Higher spring and summer precipitation as well as higher autumn temperature can explain higher NDVI in low Iw years for NW and NC. Higher four seasons’ temperature for low Iw years can explain the NDVI increase in SC.
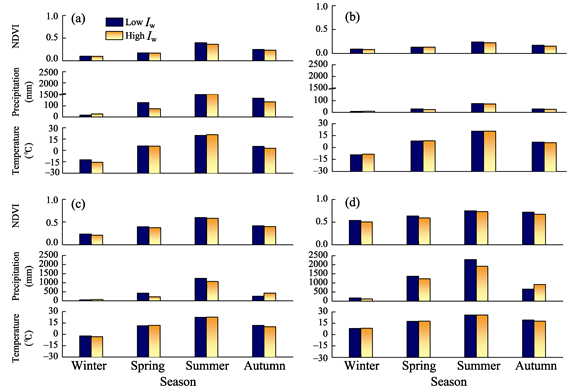
Figure 8 (a) Comparison of the seasonal mean NDVI, seasonal precipitation and seasonal mean temperature composite for low Iw and high Iw years for IM; (b) as (a) but for NW; (c) as (a) but for NC; and (d) as (a) but for SC

5 Conclusions

East Asian monsoon controls the precipitation and temperature change in most areas of China, but our understanding of its relationship with vegetation is limited because of its complexity. In present study, we focus on the impacts of the WPSH which is one of the most important components of the East Asian monsoon system. We found a strong WPSH favors NDVI increase in eastern China, while a weak WPSH corresponds to a reduction in NDVI. The zonal shifts of WPSH has a profound influence on the vegetation growth in eastern and northwestern China. If WPSH is located in the west position, then the circulation pattern favors warm water vapor transportation to eastern China, which leads to significant precipitation. The westward expansion of WPSH also brings higher spring and autumn temperatures to east China, which favors vegetation growth. If WPSH is in the east position, then precipitation greatly decreases in eastern and northwestern China and the spring and autumn temperature are lower than the average, accompanied by decreased NDVI.
Although the changes of climate factors in an area which control vegetation growth, yet they depend on the interaction of several climate systems. Our results show WPSH explains 14%-23% variations of the factors which affect NDVI in northern and northwestern China, and 14%-16% variations of the factors which affect GPP in China. The location and intensity of WPSH are easy to identify through 500 hPa geopotential height, and thus our results provide a simple way for the prediction of the vegetation growth trend in China.

The authors have declared that no competing interests exist.

[1]
Anyamba A, Tucker C J, Mahoney R, 2002. From El Niño to La Niña: Vegetation response patterns over East and Southern Africa during the 1997-2000 period.Journal of Climate, 15(21): 3096-3103.During the period 1997-2000, the global climate system experienced a transition from the strongest ENSO warm event this century in 1997/98 to a strong cold event in 1999/2000. Normalized difference vegetation index (NDVI) time series data derived from the Advanced Very High Resolution Radiometer (AVHRR) instrument aboard the NOAA polar-orbiting satellite series were analyzed to resolve the land surface response patterns over Africa during this period. The rearrangement of precipitation patterns induced by the change from El Nio to La Nia conditions had significant effects on biomass production in arid and semiarid lands of Africa as revealed by NDVI anomaly patterns, particularly in equatorial East Africa and southern Africa where the ENSO-precipitation linkage is most pronounced. In general, there was a reversal in NDVI response patterns in East (southern) Africa from positive (negative) during the El Nio in 1997/98 to negative (positive) during the La Nia event in 1999/2000. These changes can partially be attributed to east-west reversal in SST gradients in the Pacific Ocean basin but more significantly to the changes in the SST anomaly patterns in the equatorial western Indian Ocean (WIO) off the East African coast and the southern Indian Ocean off the southern African coast.

DOI

[2]
Cui Linli, Shi Jun, 2010. Temporal and spatial response of vegetation NDVI to temperature and precipitation in eastern China.Journal of Geographical Sciences, 20(2): 163-176.Temporal and spatial response characteristics of vegetation NDVI to the variation of temperature and precipitation in the whole year, spring, summer and autumn was analyzed from April 1998 to March 2008 based on the SPOT VGT-NDVI data and daily temperature and precipitation data from 205 meteorological stations in eastern China. The results indicate that as a whole, the response of vegetation NDVI to the variation of temperature is more pronounced than that of precipitation in eastern China. Vegetation NDVI maximally responds to the variation of temperature with a lag of about 10 days, and it maximally responds to the variation of precipitation with a lag of about 30 days. The response of vegetation NDVI to temperature and precipitation is most pronounced in autumn, and has the longest lag in summer. Spatially, the maximum response of vegetation NDVI to the variation of temperature is more pronounced in the northern and middle parts than in the southern part of eastern China. The maximum response of vegetation NDVI to the variation of precipitation is more pronounced in the northern part than in the middle and southern parts of eastern China. The response of vegetation NDVI to the variation of temperature has longer lag in the northern and southern parts than in the middle part of eastern China. The response of vegetation NDVI to the variation of precipitation has the longest lag in the southern part, and the shortest lag in the northern part of eastern China. The response of vegetation NDVI to the variation of temperature and precipitation in eastern China is mainly consistent with other results, but the lag time of vegetation NDVI to the variation of temperature and precipitation has some differences with those results of the monsoon region of eastern China.

DOI

[3]
Ding Mingjun, Li Lanhui, Zhang Yiliet al., 2015. Start of vegetation growing season on the Tibetan Plateau inferred from multiple methods based on GIMMS and SPOT NDVI data.Journal of Geographical Sciences, 25(2): 131-148.In this study,we have used four methods to investigate the start of the growing season(SGS) on the Tibetan Plateau(TP) from 1982 to 2012,using Normalized Difference Vegetation Index(NDVI) data obtained from Global Inventory Modeling and Mapping Studies(GIMSS,1982-2006) and SPOT VEGETATION(SPOT-VGT,1999-2012).SGS values estimated using the four methods show similar spatial patterns along latitudinal or altitudinal gradients,but with significant variations in the SGS dates.The largest discrepancies are mainly found in the regions with the highest or the lowest vegetation coverage.Between 1982 and 1998,the SGS values derived from the four methods all display an advancing trend,however,according to the more recent SPOT VGT data(1999-2012),there is no continuously advancing trend of SGS on the TP.Analysis of the correlation between the SGS values derived from GIMMS and SPOT between 1999 and 2006 demonstrates consistency in the tendency with regard both to the data sources and to the four analysis methods used.Compared with other methods,the greatest consistency between the in situ data and the SGS values retrieved is obtained with Method 3(Threshold of NDVI ratio).To avoid error,in a vast region with diverse vegetation types and physical environments,it is critical to know the seasonal change characteristics of the different vegetation types,particularly in areas with sparse grassland or evergreen forest.

DOI

[4]
Fu Congbin, Wen Gang, 1999. Variation of ecosystems over East Asia in association with seasonal, interannual and decadal monsoon climate variability.Climatic Change, 43(2): 477-494.Nearly half of the global low latitudes are characterized by a monsoon climate. This paper first analyzes the global spatial distribution of the rate of climate variation based on precipitation data. Results show that the monsoon regions in Asia and West Africa, and to a lesser extent in Australia, have the highest rate of climate variation on all time scales. These variations are manifested as seasonal jumps, high interannual and interdecadal variabilities, and abrupt changes between climate regimes. The monsoon regions are covered by various types of ecosystems which account for a large portion of the global biomass. Further analyses of the variations of ecosystems in the Asian region and their relationships with the monsoon climate have shown that the spatial and temporal variabilities of ecosystems are characterized by their strong response to variations in monsoon rainfall, one of the major energy flows in terrestrial ecosystems. The high rate of variation in monsoon climate strongly influences variation in Asian ecosystems. Changes in Asian ecosystems seem to be mainly driven by variations in monsoon climate over various time scales. This observation has led to the proposal of -onsoon-driven ecosystems- in Asia.

DOI

[5]
Goswami B N, Krishnamurthy V, Annmalai H, 1999. A broad-scale circulation index for the interannual variability of the Indian summer monsoon.Quarterly Journal of the Royal Meteorological Society, 125(125): 611-633.Abstract A broad-scale circulation index representing the interannual variability of the Indian summer monsoon is proposed and is shown to be well correlated with the interannual variability of precipitation in the Indian monsoon region. Using monthly precipitation analysis based on merging rain-gauge data with satellite estimates of precipitation for the period 1979-96, it is shown that the variability of precipitation on seasonal to interannual time-scales is coherent over a large region covering the Indian continent as well as the north Bay of Bengal and parts of south China. A new index, termed Extended Indian Monsoon Rainfall (EIMR), is defined as the precipitation averaged over the region 70°E–110°E, 10°N–30°N. the EIMR index is expected to represent the convective heating fluctuations associated with the Indian monsoon better than the traditional all India Monsoon Rainfall (IMR) based only on the precipitation over the Indian continent. It is shown that large precipitation over the Bay of Bengal with significant interannual variability cannot be ignored in the definition of Indian summer monsoon and its variability. the June-to-September climatological mean EIMR is found to be larger than that of the IMR even though the former is averaged over a larger area. the dominant mode of interannual variability of the Indian summer monsoon is associated with a dipole between the EIMR region and the north-western Pacific region (110°E–160°E, 10°N–30°N) and a meridional dipole between the EIMR region and the equatorial Indian Ocean (70°E–110°E, 10°S–5°N). It is argued that the interannual variability of the monsoon circulation is primarily driven by gradients of diabatic heating associated with variations of the EIMR, and that the regional monsoon Hadley circulation is a manifestation of this heating. an index of the monsoon Hadley (MH) circulation is defined as the meridional wind-shear anomaly (between 850 hPa and 200 hPa) averaged over the same domain as the EIMR, Using circulation data from two independent reanalysis products, namely the National Centers for Environmental Prediction/National Center for Atmospheric Research reanalysis and the European Centre for Medium-Range Weather Forecasts reanalysis, it is shown that the MH index is significantly correlated with the EIMR. Also it is shown that both the EIMR and MH indices have a dominant quasi-biennial variability, consistent with previous studies of IMR. Teleconnections of IMR, EIMR and MH indices with summer sea surface temperature (SST) have also been investigated. There are indications that the south equatorial Indian Ocean SST has a strong positive correlation with the EIMR. Also it is noted that the correlation of the monsoon indices with the eastern Pacific SST was weak during the period under consideration primarily due to almost a reverse relationship between monsoon and El Ni09o and Southern Oscillation during the latest eight years.

DOI

[6]
Guo Qiyun, 1983. The summer monsoon intensity index in East Asia and its variation.Acta Geographica Sinica, 38(3): 207-217. (in Chinese)Considering the fact that in winter the pressure is higher over the land than that over the sea and in summer the pressure gradient is reversed, the intensities of summer monsoon is designated by summing pressure differences between 110E (land) and 160E (sea) from 10N to 50N at 10 degree latitude interval, in the summing process, only the pressu-re differences -5mb were included. The annual intensities were calculated on the basis of 12 calendar months for each year from 1951 to 1980, and the normal was obtained as a thirty year mean. Finally the intensities for individual year from 1951 to 1980 are divided by the normal values, and the ratio are called as summer monsoon index (SMI). The rela-tionships between the SMI and the circulation in northern hemisphere and precipitation over China are analysed. The variation of the SMI for the 30 years period from 1951 to 1980 is discussed. The main results obtained are: (1) The SMI reflects in some extent the characteristics of atmospheric circulation over East Asia, correlation coefficients between the SMI and sea level pressure over East Asia show that the SMI closely relates to hot low over Asia continent. The large the SMI, the deeper the hot low and the later extends to the north and the east. On the contrary, the hot low is weaken as the SMI belows the normal. At the same time, the SMI is linked ob-viously with the geographical position of West Pacific High and the intensities of anticyclo-ne over Tibet Plateau at 500 mb level. When the SMI is above normal, the West Pacific High usually extends to the north and the east, and Tibet Plateau anticyclone is intensified. When the SMI is weaken the West Pacific High retreats to the South-East, and Tibet Plateau anticyclone weakens. The integrated seasonal mean circulation characteristics at 500 mb level and sea level for typical SMI years show an overall reversed features to that of typi-cal low SMI. (2) The summer rainfall over east China is also correlated closely to the SMI. In the high SMI period, north of the Huai River and south of the Yangtze River the precipitation is abundant, but the Yangtze River valley experienced severe drought. When the SMI is lower, the drought is observed in the north of Yangtze River. In the mid and low reaches of Yangtze River the wet period is appeared, when the SMI is approximated to the normal. (3) The variations of SMI indicate that three separate phase can be identified in the last thirty year period, that is the normal phase from 1951 to 1959, characterized by the less variability of SMI, the strong monsoon phase from 1960 to 1966, there are six years out of seven years the SMI were above normal, and finally the weak monsoon phase from 1967 to 1980, in this period the SMI decreased evidently most years. It is interesting to note that accompanying the abrupt transformation from second phase to the third phase, in the middle of 60's, the hot low over the Asia continent and West Pacific High both expe-rienced dramatic variations. This fact confirmes the close connection between SMI and the general circulation.

[7]
Holben B N, 1986. Characteristics of maximum-value composite images from temporal AVHRR data.International Journal of Remote Sensing, 7(11): 1417-1434.Red and near-infrared satellite data from the Advanced Very High Resolution Radiometer sensor have been processed over several days and combined to produce spatially continuous cloud-free imagery over large areas with sufficient temporal resolution to study green-vegetation dynamics. The technique minimizes cloud contamination, reduces directional reflectance and off-nadir viewing effects, minimizes sun-angle and shadow effects, and minimizes aerosol and water-vapour effects. The improvement is highly dependent on the state of the atmosphere, surface-cover type, and the viewing and illumination geometry of the sun, target and sensor. An example from southern Africa showed an increase of 40 per cent from individual image values to the final composite image. Limitations'' associated with the technique are discussed, and recommendations are given to improve this approach

DOI

[8]
Huang Jiayou, Wang Shaowu, 1985. Investigations on variations of the Subtropical High in the Western Pacific during historic times.Climatic Change, 7(4): 427-440.In this paper the 500 mb circulation field over East Asia was reconstructed by means of a stepwise regression technique, based on the relationship between summer (June to August) rainfall in China and 500 mb level heights. As a result of this study, three indices for the subtropical high, the longitude of the west border, and the latitude of the north border and intensity for the period AD 1471-1980 were extracted from reconstructed 500 mb level heights.The power spectrum analysis was carried out to investigate the variation of subtropical high indices for last 500 yr; it is shown that the prominent cycles are 22-, 36-, 55-yr and the quasi-biennial oscillation (QBO), among these the latter is more significant.The long-term variations of the 10 yr average 500 mb level heights and subtropical high indices are examined in relation to climate change; it was determined that the longitudinal variation of subtropical high plays an important role in the wetness variations over China.

DOI

[9]
Hutchinson M F, 1989. A new objective method for spatial interpolation of meteorological variables from irregular networks applied to the estimation of monthly mean solar radiation, temperature, precipitation and windrun.CSIRO Division of Water Resources, 89(5): 95-104.ABSTRACT The method has implications for network design, and projected further developments include the incorporation of more detailed local physical effects, often relatable to a detailed digital elevation model, with a view to obtaining more robust models. The spatial interpolation of complete simulated daily weather records, taking into account the inter-relations between the various meteorological variables, is also considered. -from Author

[10]
Jarlan L, Tourre Y M, Mougin Eet al., 2005. Dominant patterns of AVHRR NDVI interannual variability over the Sahel and linkages with key climate signals (1982-2003).Geophysical Research Letters, 32(4): 353-368.The spatio-temporal evolution of Sahelian vegetation is analyzed using the Normalized Difference Vegetation Index (NDVI) obtained from the NOAA/AVHRR sensor (1982-2003). Dominant patterns are identified using rotated EOFs. While the first four modes are associated with specific bio-geo-climatic conditions in space, significant time scales are detected using a multi-tapers method. Three interannual time scales (~6.2-, 4.5- and 3.6-year) are present in the first and third NDVI modes over the western Sahel. A quasi-biennial time scale (~2.6-year) is present in second and fourth NDVI modes over the northeast Sahel. During summer, significant lagged correlations are found between the NDVI second (9-month lag) and third (10-month lag) modes, the meridional Atlantic Sea Surface Temperature (SST) gradient, and the zonal SST gradient in the Indian Ocean. Potential physical linkages and dynamics with known climate fluctuations are discussed.

DOI

[11]
Ji Jinjun, Huang Mei, Li Kerang, 2008. Prediction of carbon exchanges between China terrestrial ecosystem and atmosphere in 21st century.Science in China Series D: Earth Sciences, 51(6): 885-898.The projected changes in carbon exchange between China terrestrial ecosystem and the atmosphere and vegetation and soil carbon storage during the 21st century were investigated using an atmos-phere-vegetation interaction model (AVIM2). The results show that in the coming 100 a, for SRES B2 scenario and constant atmospheric CO2 concentration, the net primary productivity (NPP) of terrestrial ecosystem in China will be decreased slowly, and vegetation and soil carbon storage as well as net ecosystem productivity (NEP) will also be decreased. The carbon sink for China terrestrial ecosystem in the beginning of the 20th century will become totally a carbon source by the year of 2020, while for B2 scenario and changing atmospheric CO2 concentration, NPP for China will increase continuously from 2.94 GtCa?1 by the end of the 20th century to 3.99 GtCa?1 by the end of the 21st century, and vegetation and soil carbon storage will increase to 110.3 GtC. NEP in China will keep rising during the first and middle periods of the 21st century, and reach the peak around 2050s, then will decrease gradually and approach to zero by the end of the 21st century.

DOI

[12]
Jiang Chao, Xu Yongfu, Ji Jinjun, 2013. Response of the summer terrestrial carbon cycle in the East Asian monsoon region to East Asian monsoon.Climatic & Environmental Research, 18(3): 329-341. (in Chinese)The temporal and spatial variability of the terrestrial ecosystem in the East Asia monsoon region reveals an obvious response characteristic to the monsoon climate. The Empirical Orthogonal Function (EOF) method is used to analyze the temporal and spatial distribution characteristics of Gross Primary Production (GPP), Net Primary Production (NPP), Net Ecosystem Production (NEP), and vegetation and soil respiration in the summer terrestrial ecosystem of the East Asian monsoon region obtained for the period 1953-2004 by off-line simulation of the Atmosphere Vegetation Interaction Model version 2 (AVIM2). In addition, the mechanism of influences of the East Asian monsoon on the terrestrial carbon cycle is discussed. Results show that during strong monsoon years with lower amounts of rainfall and higher temperatures in the Yangtze-Huaihe River basin, such restricted rainfall limits photosynthesis, which leads to lower GPP values. In southern China, however, rainfall amounts and temperatures are higher, which leads to stronger vegetation and, thus, higher GPP values. Because the East Asia summer monsoon does not significantly influence both plant and soil respiration, the changes in NPP, which marks the difference between GPP and vegetation respiration, and in NEP, which marks the difference between NPP and soil respiration, are consistent with that of GPP. During the strong summer monsoon years a hot and dry climate condition in the Yangtze-Huaihe River basin reduces NPP and NEP, whereas in Southern China the hot but wet climate increases NPP and NEP.

[13]
Jiang Xingwen, Li Yueqing, Yang Songet al., 2011. Interannual and interdecadal variations of the South Asian and western Pacific subtropical highs and their relationships with Asian-Pacific summer climate.Meteorology and Atmospheric Physics, 113(3): 171-180.In this study, interdecadal and interannual variations of the South Asian high (SAH) and the western Pacific subtropical high (WPSH), as well as their relationships with the summer climate over Asian and Pacific regions, are addressed. The variations of SAH and WPSH are objectively measured by the first singular value decomposition (SVD) mode of geopotential heights at the 100- and 500-hPa levels. The first SVD mode of summertime 100- and 500-hPa geopotential heights represents well the relationship between the variations of SAH and WPSH. Both SAH and WPSH exhibit large interannual variability and experienced an apparent long-term change in 1987. The WPSH intensifies and extends westward when SAH intensifies and extends eastward, and vice versa. The India-urma trough weakens when WPSH intensifies. The changes in SAH and WPSH at various levels are linked to broad-scale increases in tropical tropospheric temperature and geopotential height. When SAH and WPSH strengthen, monsoon flow becomes weaker over eastern Asia. In the meantime, precipitation decreases over eastern South China Sea, Philippines, the Philippine Sea and northeastern Asia, but increases over China, Korea, Japan and the ocean domain east of Japan. Similar features are mostly found on both interdecadal and interannual timescales, but are more evident on interannual timescale.

DOI

[14]
Kalnay E, Kanamitsu M, Kistler Ret al., 1996. The NCEP/NCAR 40-year reanalysis project.Bulletin of the American Meteorological Society, 77(3): 437-472.

DOI

[15]
Li Jing, Fan Ke, Xu Zhiqing, 2016. Links between the late wintertime North Atlantic Oscillation and springtime vegetation growth over Eurasia.Climate Dynamics, 46(3/4): 987-1000.In the present study, the linkages between the late wintertime (January-February-March; JFM) North Atlantic Oscillation (NAO) and springtime (April-May-June; AMJ) vegetation growth over Eurasia is investigated. Here, the proxy of vegetation growth is represented by normalized difference vegetation index (NDVI) gridded data, obtained from the advanced very high resolution radiometer. Over the period 1982-2006, the NAO (JFM) correlated well with the NDVI (AMJ) over Eurasia, wherein a positive NAO tended to increase the NDVI (AMJ) over Eurasia and vice versa. The results show that a positive phase of the late wintertime NAO leads to an increase in surface air temperature, soil temperature and rainfall in most parts of Eurasia in winter. These changes tend to produce weaker and thinner snow cover in spring compared to that that forms in a negative NAO phase. Corresponding to this, the albedo decreases and the surface air temperature increases over Eurasia in spring, which contributes an earlier snowmelt. Subsequently, the land surface over Eurasia becomes warmer and wetter earlier, as the snow melts. These conditions can then facilitate higher than average vegetation growth over Eurasia, in comparison to the conditions that occur in a negative NAO phase.

DOI

[16]
Li Jianping, Zeng Qingcun, 2002. A unified monsoon index. Geophysical Research Letters, 29(8): 115-1-115-4.

[17]
Li Yueyue, Huang Mei, Ji Jinjunet al., 2015. Studies on the response mechanisms of vegetation net primary productivity in Chinese monsoon region to the variations of East Asian summer monsoon.Climatic & Environmental Research, 20(5): 544-554. (in Chinese)The East Asian summer monsoon has a significant impact on climate change in the Chinese monsoon region, but the responses and mechanisms of the terrestrial net primary productivity(NPP) to summer monsoon climate change are still not clear. In this paper, an atmosphere-egetation interaction model(AVIM2) is used to simulate the NPP in the Chinese monsoon region. The correlation between NPP and summer monsoon index is analyzed, and the response mechanisms of NPP to the variations of summer monsoon are discussed. It is found that the vegetation responses and mechanisms to the variations of the summer monsoon are very different in North China and South China. Corresponding to strong summer monsoon years, the NPP in North China increases, while the NPP in South China decreases. The East Asian summer monsoon can affect precipitation over the North China Plain during vegetation growing seasons, and thus also affects the local NPP. Due to the superimposed effect of temperature and precipitation on NPP, Beijing, Tianjin, and Hebei become the most sensitive areas to the variations of the summer monsoon in the North China Plain region. During strong East Asian summer monsoon years, the NPP in South China decreases, and the main impact factors correlated to a strong East Asian summer monsoon are different: In Jiangsu, Anhui, Hubei, Hunan, and Jiangxi provinces, it is the reduced solar radiation; in Guangdong and Taiwan provinces, it is the lower temperature; and in Zhejiang and Fujian provinces, the major factor is the superimposed effect of reduced solar radiation and lower temperature.

[18]
Li Zuotao, Kafatos M, 2000. Interannual variability of vegetation in the United States and its relation to El Niño/Southern Oscillation.Remote Sensing of Environment, 71(3): 239-247.The normalized difference vegetation index (NDVI) is widely accepted as a good indicator for providing vegetation properties and associated changes for large scale geographic regions. Using multivariate time series data analysis methods based on principal component transform and wavelet decomposition, a sequence of 11-year monthly Advanced Very High Resolution Radiometer (AVHRR)-derived NDVI data from 1982 to 1992 is examined to study the vegetation and climate variation trends over the United States. We find that one interannual NDVI variation signal over the United States, exhibits a strong relationship with the El Nio/Southern Oscillation (ENSO) Index, which is a measure of the phase and amplitude of the Southern Oscillations (SOs). The corresponding spatial patterns of NDVI anomaly are also extracted for mapping the possible impacts of ENSO activity. The NDVI anomaly patterns approximately agree with the main documented precipitation and temperature anomaly patterns associated with ENSO, but also show additional patterns not related to ENSO. This study shows that ENSO activity effects may have regionally significant effects for vegetation in the United States.

DOI

[19]
Liu Yimin, Wu Guoxiong, 2004. Progress in the study on the formation of the summertime subtropical anticyclone.Advances in Atmospheric Sciences, 21(3): 322-342.The studies in China on the formation of the summertime subtropical anticyclone on the climate timescale are reviewed. New insights in resent studies are introduced. It is stressed that either in the free atmosphere or in the planetary boundary, the descending arm of the Hadley cell cannot be considered as a mechanism for the formation of the subtropical anticyclone. Then the theories of thermal adaptation of the atmosphere to external thermal forcing and the potential vorticity forcing are developed to understand the formation of the subtropical anticyclone in the three-dimensional domain. Numerical experiments are designed to verify these theories. Results show that in the boreal summer, the formation of the strong South Asian High in the upper troposphere and the subtropical anticyclone over the western Pacific in the middle and lower troposphere is, to a great extent, due to the convective latent heating associated with the Asian monsoon, but affected by orography and the surface sensible heating ov

DOI

[20]
Los S O, Collatz G J, Bounoua Let al., 2001. Global interannual variations in sea surface temperature and land surface vegetation, air temperature, and precipitation.Journal of Climate, 14(7): 1535-1549.Anomalies in global vegetation greenness, SST, land surface air temperature, and precipitation exhibit linked, low-frequency interannual variations. These interannual variations were detected and analyzed for 1982-90 with a multivariate spectral method. The two most dominant signals for 1982-90 had periods of about 2.6 and 3.4 yr. Signals centered at 2.6 years per cycle corresponded to variations in the El Nio-Southern Oscillation index and explained about 28% of the variance in anomalies of SST, land surface air temperature, precipitation, and vegetation; these signals were most pronounced in 1) SST anomalies in the eastern equatorial Pacific Ocean, 2) land surface vegetation and precipitation anomalies in tropical and subtropical regions, and 3) land surface vegetation, precipitation, and temperature anomalies in North America. Signals at 3.4 years per cycle corresponded to variations in the North Atlantic oscillation index and explained 8.6% of the variance in the combined datasets; their occurrence was most pronounced in 1) Atlantic SST anomalies, 2) in land surface temperature and vegetation anomalies in Europe and eastern Asia, and 3) in precipitation and vegetation anomalies in subSaharan Africa, southern Africa, and eastern North America. Anomalies in vegetation were positively related to anomalies in precipitation throughout the Tropics and subtropics and in midlatitudes in the central parts of continents. Anomalies in vegetation and temperature were positively linked in coastal temperate climates such as in Europe and eastern Asia. These associations between temperature and vegetation may be explained by the sensitivity of the length of growing season to variations in temperature.

DOI

[21]
Lu Riyu, 2002. Indices of the summertime western North Pacific subtropical high.Advances in Atmospheric Sciences, 19(6): 1004-1028.By averaging June-July-August (JJA) mean geopotential height anomalies at 850 hPa over the specified areas, the author proposes two innovative and succinct parameters to objectively define the zonal and meridional displacements of the western North Pacific subtropical high (WNPSH) in summer, respectively. Thus, these two indices and the present results may provide a basis for validating atmospheric general circulation models simulating the WNPSH. For the zonal index, the specified area is the west edge (110°-150°E, 10°-30°N) of the WNPSH. For the meridional index, the specified area is the northwest edge (120°-150°E, 30°-40°N) of the WNPSH. The interannual variations of these two indices are found to be independent. The results from a composite analysis based on the meridional index are in good agreement with previous studies based on case analyses.The two indices are compared with the existing indices announced by the National Climate Center (NCC) in China, on the interannual timescale. Despite slight differences, the interannual variations of the presented indices are basically similar to those of the NCC indices, and thus the circulation and precipitation associated with the present indices exhibit similar features to those associated with the NCC indices. Furthermore, an analysis of the differences between the associations of the present indices and the NCC indices shows that the presented indices are better than the NCC indices. An important result is that the zonal index is related to a more outstanding anomaly of precipitation, especially in East Asia and the Philippine Sea, both based on the presented indices and the NCC indices.The two indices can also be used to describe the seasonal march of the WNPSH during summer, namely, the poleward and eastward shifts. It is found that climatologically, the WNPSH shifts poleward and eastward rapidly in middle July, but the amplitudes of the poleward and eastward shifts are more remarkable in the summers when the WNPSH is located poleward and eastward in average.

DOI

[22]
Nicholson S E, Tucker C J, Ba M B, 2010. Desertification, drought, and surface vegetation: an example from the West African Sahel.Bulletin of the American Meteorological Society, 79(5): 815-829.Many assumptions have been made about the nature and character of desertification in West Africa. This paper examines the history of this issue, reviews the current state of our knowledge concerning the meteorological aspects of desertification, and presents the results of a select group of analyses related to this question. The common notion of desertification is of an advancing “desert,” a generally irreversible anthropogenic process. This process has been linked to increased surface albedo, increased dust generation, and reduced productivity of the land. This study demonstrates that there has been no progressive change of either the Saharan boundary or vegetation cover in the Sahel during the last 16 years, nor has there been a systematic reduction of “productivity” as assessed by the water-use efficiency of the vegetation cover. While it also showed little change in surface albedo during the years analyzed, this study suggests that a change in albedo of up to 0.10% since the 1950s is conceivable.

DOI

[23]
Piao Shilong, Fang Jingyun, 2003. Seasonal changes in vegetation activity in response to climate changes in China between 1982 and 1999.Acta Geographica Sinica, 58(1): 119-125. (in Chinese)In the present study, using normalized difference vegetati on index (NDVI) as an indicator of vegetation activity, seasonal trends of vegetation activity and their dynamic responses to climate changes in China were explored based on remotely sensed data (NOAA-AVHRR) from 1 982 to 1999. As a result, spatially averaged seasonal NDVI in China showed a pronounced increase in all four seasons (spring, summer, autumn and win ter) during the past 18 years. The average spring NDVI indicated the most significant increase (P0.001) with a mean rate of 1.3%, while the average autumn NDVI showed the least increase (P=0.075). Analyzing int erannual changes in seasonal mean NDVI by vegetation type, it was fou nd that the advance of growing season was a major way for response of vegetation activity to climate changes and that the way exhibited a large regional heterogeneity. In the past 18 years, regions with the largest increase rate of summer NDVI appeared in Northwest China and the Tibetan Plateau, while areas with that of spring NDVI occurred i n the eastern part of the country.

DOI

[24]
Piao Shilong, Fang Jingyun, Zhou Liminget al., 2003. Interannual variations of monthly and seasonal normalized difference vegetation index (NDVI) in China from 1982 to 1999. Journal of Geophysical Research Atmospheres, 108(D14): ACL 1-1.1] In this paper, we analyzed interannual variations of normalized difference vegetation index (NDVI) and their relationships with climatic variables (temperature and precipitation) and human activity in China between 1982 and 1999. Monthly and seasonal NDVI increased significantly at both the country and biome scales over the study period. NDVI shows the largest increase (14.4% during the 18 years and a trend of 0.0018 yr0908081) over 85.9% of the total study area in spring and the smallest increase (5.2% with a trend of 0.0012 yr0908081) over 72.2% of the area in summer. The NDVI trends show a marked heterogeneity corresponding to regional and seasonal variations in climates. There is about a 3-month lag for the period between the maximum trend in temperature (February) and that in NDVI (April or May) at the country and biome scales. Human activity (urbanization and agricultural practices) also played an important role in influencing the NDVI trends over some regions. Rapid urbanization resulted in a sharp decrease in NDVI in the Yangtze River and Pearl River deltas, while irrigation and fertilization may have contributed to the increased NDVI in the North China plain.

DOI

[25]
Sun Shuqing, Ying Ming, 1999. Subtropical high anomalies over the western Pacific and its relations to the Asian monsoon and SST anomaly.Advances in Atmospheric Sciences, 16(4): 559-568.Using the data of 500 hPa geopotential height from 1951 to 1995, SST roughly in the same period and OLR data from 1974 to 1994, the relation between the anomalies of subtropical high (STH for short) and the tropical circulations including the Asian monsoon as well as the convective activity are studied. In order to study the physical process of the air-sea interaction related to STH anomaly, the correlation of STH with SST at various sea areas, lagged and simultaneous, has been calculated.Comparing the difference of OLR, wind fields, vertical circulations and SST anomalies in the strong and weak STH, we investigate the characteristics of global circulations and the SST distributions related to the anomalous STH at the western Pacific both in winter and summer. Much attention has been paid to the study of the air-sea interaction and the relationship between the East Asian monsoon and the STH in the western Pacific. A special vertical circulation, related to the STH anomalies is found, which connects the monsoon current to the west and the vertical flow influenced by the SST anomaly in the tropical eastern Pacific.

DOI

[26]
Tucker C J, 1979. Red and photographic infrared linear combinations for monitoring vegetation.Remote Sensing of Environment, 8(2): 127-150.In situ collected spectrometer data were used to evaluate and quantify the relationships between various linear combinations of red and photographic infrared radiances and experimental plot biomass, leaf water content, and chlorophyll content. The radiance variables evaluated included the red and photographic infrared (IR) radiance and the linear combinations of the IR/red ratio, the square root of the IR/red ratio, the IR-red difference, the vegetation index, and the transformed vegetation index. In addition, the corresponding green and red linear combinations were evaluated for comparative purposes. Three data sets were used from June, September, and October sampling periods. Regression analysis showed the increased utility of the IR and red linear combinations vis-is the same green and red linear combinations. The red and IR linear combinations had 7% and 14% greater regression significance than the green and red linear combinations for the June and September sampling periods, respectively. The vegetation index, transformed vegetation index, and square root of the IR/red ratio were the most significant, followed closely by the IR/red ratio. Less than a 6% difference separated the highest and lowest of these four ER and red linear combinations. The use of these linear combinations was shown to be sensitive primarily to the green leaf area or green leaf biomass. As such, these linear combinations of the red and photographic IR radiances can be employed to monitor the photosynthetically active biomass of plant canopies.

DOI

[27]
Wang Bin, Fan Zhen, 1999. Choice of South Asian summer monsoon indices.Bulletin of the American Meteorological Society, 80(4): 629-638.In the south Asian region, two of the major precipitation maxima associated with areas of intensive convective activity are located near the Bay of Bengal and in the vicinity of the Philippines. The variations of monthly mean outgoing longwave radiation in the two regions are poorly correlated, particularly in the decade of 1980s. The enhanced convection over the Bay of Bengal and Indian subcontinents is coupled with reinforced monsoon circulation west of 80E over India, the western Indian Ocean, and the tropical northern Africa. In contrast, the enhanced convection in the vicinity of the Philippines corresponds to intensified monsoon circulation primarily east of 80E over southeast Asia including the Indochina peninsula, South China Sea, Philippine Sea, and the Maritime Continent. To better reflect regional monsoon characteristics, two convection indices (or associated circulation indices that are dynamically coherent with the convection indices) are suggested to measure the variability of the Indian summer monsoon (ISM) and the southeast Asian summer monsoon, respectively.The change in the Bay of Bengal convection (the ISM) has planetary-scale implications, whereas the change in Philippine convection has primarily a regional impact including a linkage with the east Asia subtropical monsoon. The equatorial western Pacific winds exhibit a considerably higher correlation with the ISM convection than with the Philippine convection. During the summers when a major Pacific warm episode occurs (e.g., 1982-83, 1986-87, 1991-92, and 1997), the convection and circulation indices describing the ISM often diverge considerably, causing inconsistency among various normally coherent monsoon indices. This poses a primary difficulty for using a single monsoon index to characterize the interannual variability of a regional monsoon. The cause of the breakdown of the coherence between various convection and circulation indices during ENSO warm phase needs to be understood.

DOI

[28]
Webster P J, Yang Song, 1992. Monsoon and ENSO: Selectively interactive systems.Quarterly Journal of the Royal Meteorological Society, 118(507): 877-926.A longer-period context for the anomalous summer monsoon circulation fields was sought. Based on the summer monsoon index, annual cycles for the years in which there were strong and weak monsoon seasons were composited. Large-scale coherent differences were apparent in the circulation fields over most of the globe including south Asia and the tropical Indian Ocean as far as the previous winter and spring. Although the limited data period renders the absoluteness of the conclusions difficult to confirm, the results indicate that the variable monsoon (and hence the signal in the Pacific Ocean trade regime) are immersed in a larger scale and slowly evolving circulation system. Based on the observation that the monsoon and the Walker circulation appear to be in quadrature, it is proposed that these two circulations are selectively interactive. During the springtime, the rapidly growing monsoon dominates the near-equatorial Walker circulation. During autumn and winter, the monsoon is weakest with convection fairly close to the equator; the Walker circulation is then strongest and may dominate the winter monsoon. During the summer the monsoon may dominate. Numerical experiments are proposed to test both propositions.

DOI

[29]
Yang Hui, Sun Shuqing, 2003. Longitudinal displacement of the subtropical high in the western Pacific in summer and its influence.Advances in Atmospheric Sciences, 20(6): 921-933.Using the relative vorticity averaged over a certain area, a new index for measuring the longitudinal position of the subtropical high (SH) in the western Pacific is proposed to avoid the increasing trend of heights in the previous indices based on geopotential height. The years of extreme westward and eastward extension of SH using the new index are in good agreement with those defined by height index. There exists a distinct difference in large-scale circulation between the eastward and westward extension of SH under the new definition, which includes not only the circulation in the middle latitudes but also the flow in the lower latitudes. It seems that when the SH extends far to the east (west), the summer monsoon in the South China Sea is stronger (weaker) and established earlier (later). In addition, there exists a good relationship between the longitudinal position of SH and the summer rainfall in China. A remarkable negative correlation area appears in the Changjiang River valley, indicating that when the SH extends westward (eastward), the precipitation in that region increases (decreases). A positive correlation region is found in South China, showing the decrease of rainfall when the SH extends westward. On the other hand, the rainfall is heavier when the SH retreats eastward. However, the anomalous longitudinal position of SH is not significantly related to the precipitation in North China. The calculation of correlation coefficients between the index of longitudinal position of SH and surface temperature in China shows that a large area of positive values, higher than 0.6 in the center, covers the whole of North China, even extending eastward to the Korean Peninsula and Japan Islands when using NCEP/NCAR reanalysis data to do the correlation calculation. This means that when the longitudinal position of the SH withdraws eastward in summer, the temperature over North China is higher. On the other hand, when it moves westward, the temperature there is lower. This could explain the phenomenon of the ser

DOI

[30]
Zhang Jiahua, Fu Congbin, 2002. Research on the response of China eastern ecosystem to East Asian monsoon by using leaf area index through remote sensing inversion.Progress in Natural Science, 12(10): 1098-1102. (in Chinese)

[31]
Zhang Jie, Zhang Qiang, Yang Lihuaet al., 2006. Seasonal characters of regional vegetation activity in response to climate change in West China in recent 20 years.Journal of Geographical Sciences, 16(1): 78-86.1 Introduction As a body of ecosystem, vegetation influences energy balance, climatic, hydrologic and biochemical cycles. Simultaneously it is also influenced by the above-mentioned factors. Therefore, vegetation activity is a perfect sensitivity guideli

DOI

[32]
Zhang Xuezhen, Dai Junhu, Ge Quansheng, 2013. Variation in vegetation greenness in spring across eastern China during 1982-2006.Journal of Geographical Sciences, 23(1): 45-56.

DOI

[33]
Zhou Tianjun, Yu Rucong, 2005. Atmospheric water vapor transport associated with typical anomalous summer rainfall patterns in China.Journal of Geophysical Research Atmospheres, 110(8): D08104.1] This paper attempts to reveal the atmospheric water vapor transports associated with typical anomalous summer rainfall patterns in China. The results show that origins of water vapor supply related to anomalous rainfall patterns are different from those related to the normal monsoon rainfall. Anomalous pattern 1, with a heavier rainbelt along the middle and lower reaches of the Yangtze River valley, follows from a convergence of the tropical southwest water vapor transport with the midlatitude northeast water vapor transport; the tropical water vapor transport comes directly from the Bay of Bengal and the South China Sea but originally from the Philippine Sea. The anomalous water vapor transport is associated with a southwestward extension of the western Pacific subtropical high and a southward shift of the upper East Asian jet stream. Anomalous pattern 2, with a main rainbelt along the Huaihe River valley, is supported by the convergence of the subtropical southwest water vapor with the midlatitude water vapor transport. The subtropical branch comes directly from the South China Sea but originally from the East China Sea and the adjacent subtropical Pacific to the further east along 20N. The background large-scale circulation change includes a northwestward extension of the western Pacific subtropical high and an eastward shift of the upper jet stream. Although the cross-equator flows including the Somali jet supply abundant water vapor for the normal condition of June, July, and August rainfall over China, the tropical water vapor transports related to typical anomalous rainfall anomalies originate from the tropical western Pacific Ocean. The northward transport of anomalous warm water vapor occurs mainly in the lower troposphere, while the transport of midlatitude cold water vapor occurs briefly in the upper troposphere.

DOI

[34]
Zhou Tianjun, Yu Rucong, Zhang Jieet al., 2009. Why the western Pacific subtropical high has extended westward since the late 1970s.Journal of Climate, 22(8): 2199-2215.The western Pacific subtropical high (WPSH) is closely related to Asian climate. Previous examination of changes in the WPSH found a westward extension since the late 1970s, which has contributed to the inter-decadal transition of East Asian climate. The reason for the westward extension is unknown, however. The present study suggests that this significant change of WPSH is partly due to the atmosphere's response to the observed Indian Ocean-western Pacific (IWP) warming. Coordinated by a European Union's Sixth Framework Programme, Understanding the Dynamics of the Coupled Climate System (DYNAMITE), five AGCMs were forced by identical idealized sea surface temperature patterns representative of the IWP warming and cooling. The results of these numerical experiments suggest that the negative heating in the central and eastern tropical Pacific and increased convective heating in the equatorial Indian Ocean/ Maritime Continent associated with IWP warming are in favor of the westward extension of WPSH. The SST changes in IWP influences the Walker circulation, with a subsequent reduction of convections in the tropical central and eastern Pacific, which then forces an ENSO/Gill-type response that modulates the WPSH. The monsoon diabatic heating mechanism proposed by Rodwell and Hoskins plays a secondary reinforcing role in the westward extension of WPSH. The low-level equatorial flank of WPSH is interpreted as a Kelvin response to monsoon condensational heating, while the intensified poleward flow along the western flank of WPSH is in accord with Sverdrup vorticity balance. The IWP warming has led to an expansion of the South Asian high in the upper troposphere, as seen in the reanalysis.

DOI

[35]
Zhou Wei, Gang Chengcheng, Chen Yizhaoet al., 2014. Grassland coverage inter-annual variation and its coupling relation with hydrothermal factors in China during 1982-2010.Journal of Geographical Sciences, 24(4): 593-611.GIMMS(Global Inventory Modeling and Mapping Studies) NDVI(Normalised Difference Vegetation Index) from 1982 to 2006 and MODIS(Moderate Resolution Imaging Spectroradiometer) NDVI from 2001 to 2010 were blended to extract the grass coverage and analyze its spatial pattern. The response of grass coverage to climatic variations at annual and monthly time scales was analyzed. Grass coverage distribution had increased from northwest to southeast across China. During 1982-2010, the mean nationwide grass coverage was 34% but exhibited apparent spatial heterogeneity, being the highest(61.4%) in slope grasslands and the lowest(17.1%) in desert grasslands. There was a slight increase of the grass coverage with a rate of 0.17% per year. Increase in slope grasslands coverage was as high as 0.27% per year, while in the plain grasslands and meadows the grass coverage increase was the lowest(being 0.11% per year and 0.1% per year, respectively). Across China, the grass coverage with extremely significant increase(P0.01) and significant increase(P0.05) accounted for 46.03% and 11% of the total grassland area, respectively, while those with extremely significant and significant decrease accounted for only 4.1% and 3.24%, respectively. At the annual time scale, there are no significant correlations between grass coverage and annual mean temperature and precipitation. However, the grass coverage was somewhat affected by temperature in alpine and sub-alpine grassland, alpine and sub-alpine meadow, slope grassland and meadow, while grass coverage in desert grassland and plain grassland was more affected by precipitation. At the monthly time-scale, there are significant correlations between grass coverage with both temperature and precipitation, indicating that the grass coverage is more affected by seasonal fluctuations of hydrothermal conditions. Additionally, there is one-month time lag-effect between grass coverage and climate factors for each grassland types.

DOI

Outlines

/