Research Articles

The influence of climate change and human activities on runoff in the middle reaches of the Huaihe River Basin, China

  • GAO Chao , 1 ,
  • RUAN Tian 2, 3
Expand
  • 1. Department of Geography and Spatial Information Techniques, Ningbo University, Ningbo 315211, Zhejiang, China
  • 2. College of Territorial Resources and Tourism, Anhui Normal University, Wuhu 241000, Anhui, China
  • 3. Climate Change and Water Resource Center of Jiang-Huai Basin, Anhui Normal University, Wuhu 241000, Anhui, China

Author: Gao Chao (1978-), PhD and Professor, specialized in climate change and hydrology and water resources.E-mail:

Received date: 2017-06-08

  Accepted date: 2017-08-16

  Online published: 2018-01-10

Supported by

National Natural Science Foundation of China, No.41571018

Copyright

Journal of Geographical Sciences, All Rights Reserved

Abstract

This study presents a soil and water integrated model (SWIM) and associated statistical analyses for the Huaihe River Basin (HRB) based on daily meteorological, river runoff, and water resource data encompassing the period between 1959 and 2015. The aim of this research is to quantitatively analyze the rate of contribution of upstream runoff to that of the midstream as well as the influence of climate change and human activities in this section of the river. Our goal is to explain why extreme precipitation is concentrated in the upper reaches of the HRB while floods tend to occur frequently in the middle reaches of this river basin. Results show that the rate of contribution of precipitation to runoff in the upper reaches of the HRB is significantly higher than temperature. Data show that the maximum contribution rate of upstream runoff to that of the midstream can be as high as 2.23%, while the contribution of temperature is just 0.38%. In contrast, the rate of contribution of human activities to runoff is 87.20% in the middle reaches of the HRB, while that due to climate change is 12.80%. Frequent flood disasters therefore occur in the middle reaches of the HRB because of the combined effects of extreme precipitation in the upper reaches and human activities in the middle sections.

Cite this article

GAO Chao , RUAN Tian . The influence of climate change and human activities on runoff in the middle reaches of the Huaihe River Basin, China[J]. Journal of Geographical Sciences, 2018 , 28(1) : 79 -92 . DOI: 10.1007/s11442-018-1460-6

1 Introduction

The global climate system has changed significantly over the last century. Coupled with intense human activities, the spatiotemporal distribution of water resources has tended to become increasingly imbalanced, while extreme events (such as floods and droughts) have occurred with increasing frequency (Song et al., 2013; Gao and Zhang, 2016; Birkinshaw et al., 2017). Thus, the risks of natural disasters and other problems associated with environmental change have aroused a great concern to researchers (Pierrehumbert, 2002; Wang et al., 2009; Chen et al., 2010; He et al., 2016). It is urgent to carry out flood risk assessments and associated research to improve the accuracy and suitability of disaster prediction (Piao et al., 2010).
Researchers from around the world have tended to concur that flood risk is the result of a combination of factors, including flood hazard as well as the exposure and vulnerability of hazard-bearing bodies. Thus, flood risk is closely related to the extreme precipitation that leads to runoff (Gao et al., 2015; Aamerya et al., 2016). The key consideration in past flood risk assessments has been the impact of precipitation on local runoff, including the impact of upstream precipitation on runoff in these river sections. However, due to its particular climatic conditions and geographical environment, extreme precipitation has tended to occur mainly in the upper reaches of the Huaihe River Basin (HRB) (Lu et al., 2015). At the same time, due to a large stream gradient and rapid flood discharge, the middle reaches of the HRB have frequently been flooded. The specific conditions influencing this basin mean attempt to separate the impact of climate change on runoff from that of human activities in the middle and upper reaches of the HRB will enable improvements to the accuracy of flood risk assessment. In this context, it is noteworthy that previous research on the combined effects of climate change and human activities on runoff have addressed two main themes. First, the contribution of climate change and human activities to variation in runoff has been studied via precipitation observations, runoff and calculated evaporation sequence changes (Lan et al., 2010; Bao et al., 2012; Deng et al., 2017), while secondly the evolution and role of natural and artificial water cycles within a basin (i.e., the social water cycle) have also been addressed (Zhang et al., 2000; Ahn et al., 2017). We utilize the first of these approaches in this study as it is relatively simple and easy to apply. Investigation of the social water cycle requires relatively more hydrometeorological and socioeconomic data and therefore necessitates more intensive research (Sun and Li, 2014).
In terms of specific methods, research on the impact of climate change on runoff include the watershed contrast method, an effective approach that can be applied to eliminate the influence of climate change in studies on small watersheds. This contrast method is, however, more problematic to apply to larger-scale watersheds (Mladjic et al., 2011). A second statistical approach (Piao et al., 2010; Gao et al., 2015; Lu et al., 2015) is also available, based on the analysis of hydrometeorological time series data. The modeling process that underlies this method is relatively simple but it does not take into account underlying surface factors. Thus, use of a third approach, the hydrological modeling method (Wang et al., 2002; He et al., 2015; Ma et al., 2015), is preferable as it takes into account the distribution of a given hydrological system as well as physical mechanisms in combination with past empirical modeling. This approach is also preferable because it also incorporates the underlying geographical environment, including human activities. The hydrological modeling approach is an effective research method because it can be used to simulate water resources affected by both climate change and human activities.
The results of previous research have demonstrated that human activities likely exert a greater impact on runoff than climate change (Wang et al., 2002; Mladjic et al., 2011; Sun and Li., 2014; Wu et al., 2016). Anthropogenic impacts on runoff are mainly due to land use changes, as well as artificial water use, non-point source pollution, the introduction of sediment into water courses, and eco-hydrological responses (Xia, 2009; Chen et al., 2010; Zhang et al., 2012; Bi et al., 2013). Research in this area has also passed through three evolutionary states, from the initial use of simple statistical reduction calculations to the application of rainfall-runoff relationship models, and, most recently, to the development of distributed hydrological modeling research methods (Liew and Garbrecht, 2003; Li et al., 2007; Juckem et al., 2008). A distributed hydrological model is therefore one of the most appropriate tools currently available for studying the impacts of climate change and human activities on runoff (Tong et al., 2012; López-Moreno et al., 2014).
This paper quantitatively evaluates the contribution rate of upstream runoff to that of the midstream river section as well as the influence of climate change and human activities. The results of this study provide an explanation for the concentration of extreme precipitation events in the upper reaches of the HRB while floods tend to occur frequently in the middle reaches of this basin. The results of this study are also of practical significance for HRB flood risk assessment.

2 Study area

The HRB (30°55'-36°36'N, 111°55'-121°25'E) is located in eastern China in the transitional zone between the north and south of the country. As a result of its unique location as well as the fact that this region is affected by both climate change and human activities, flood-related disasters within the HRB have become increasingly frequent. A series of spatial distribution maps based on extreme precipitation data are presented here for the middle and upper reaches of the HRB; these maps illustrate county-level flood disaster loss data for the period between 1984 and 2008 (Figure 1). It is noteworthy that previous research has demonstrated that extreme HRB precipitation (Lu et al., 2015) is mainly concentrated in the southwestern upper reaches of this basin, while the more serious flood-related disasters tend to occur within central areas, specifically in the middle reaches of the basin. Because the entire HRB covers a very large area, we selected the middle sections of this basin prone to flood disasters as well as the upstream region characterized by a high frequency of extreme precipitation as the study area for this research. This approach reduces the error in our hydrological model simulation (Figure 1) and encompasses the middle and upper reaches of the HRB from Tongbai to the Wujiadu hydrological station. Wangjiaba and Wujiadu was designated as water outlets for the purposes of this research and the sub-watershed was divided into the middle and upper reaches of the study area , respectively (Figure 2).
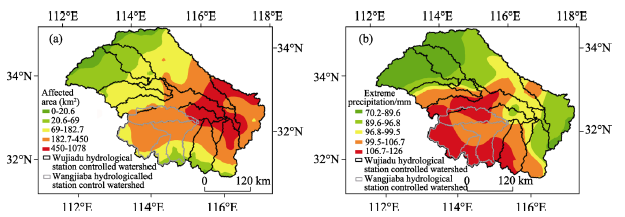
Figure 1 Maps illustrating the flood disaster affected areas (a) and spatial distribution of extreme precipitation (b) in the middle and upper reaches of the HRB
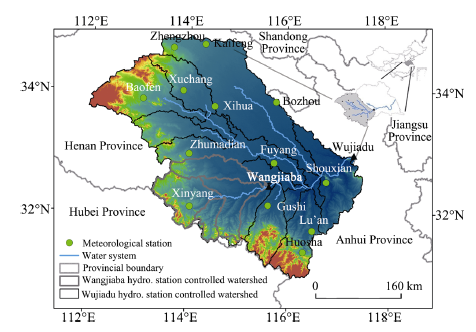
Figure 2 Map showing the study area as well as meteorological stations, the drainage system, and watershed

3 Data and methods

3.1 Data

The meteorological data used in this study was collected by the National Climate Center of China Meteorological Administration. Thus, daily observation data from 13 meteorological stations (Figure 2) throughout the middle and upper reaches of the HRB were collated for the period between 1959 and 2008. Data include maximum, minimum, and average temperature, as well as precipitation, sunshine hours, and daily radiation. Daily runoff data for the period between 1959 and 2008 were obtained from Wangjiaba and Wujiadu stations.
We utilized a digital elevation model (DEM) for the middle and upper reaches of the HRB that is based on Shuttle Radar Topography Mission data at a spatial resolution of 90 m. This DEM was downloaded from the geospatial data cloud site of the Chinese Academy of Sciences (CAS) (http://www.gscloud.cn); soil data at a 1:4 million scale were used in this analysis, obtained from the United Nations Food and Agriculture Organization world soil database (http://www.fao.org), while land use data (also at a 1:4 million scale) was downloaded from the data Center for Resources and Environmental Sciences, CAS (http://www.resdc.cn). This analysis encompasses the time period between 1980 and 2000 and all data were re-sampled to a uniform spatial resolution of 400 m. Reservoir quantity and water storage data between 1997 and 2015 were extracted from the HRB Water Resources Bulletin, while data on human activities between 1996 and 2015, including crop acreage, gross domestic product (GDP), and urbanization rate, were extracted from the regional statistical yearbook.

3.2 Methods

3.2.1 Precipitation and temperature contribution rates
We derived the relative runoff contribution rates of precipitation, temperature, and other meteorological factors by multiplying runoff sensitivity coefficients to meteorological factors as well as the relative changes in these factors over multiple years using Equation 1 and Equation 2 (Dong et al., 2015), as follows:
Convi = Svi × RCvi (1)
RCvi = (n × Trend) / |av| × 100% (2)
where vi denotes the meteorological factor, while Convi signifies the contribution rate of vi to runoff variation, Svi is the sensitivity coefficient of vi to runoff, RCvi denotes the relative change of vi over multiple years, n is time, av is the average value of vi between 1959 and 2008, and Trend stands for the annual rate of change. This latter component was calculated using trend analysis.
The sensitivity coefficient of runoff to precipitation and temperature was obtained using Equation (3) (Dong et al., 2015), as follows:
Cvx × Δt + Cvy × Δp = δp, Δt) (3)
where Cvx is the sensitivity coefficient of runoff change to temperature change, Δt is temperature change, Cvy is the sensitivity coefficient of runoff change to precipitation change, Δp is the precipitation change, and δ p, Δt) is the rate of runoff change. As the units of Δt, Δp, and δ p, Δt) are not uniform, z-scores from the software SPSS were used to standardize these data.
3.2.2 Runoff contribution rate
Midstream runoff in the HRB is mainly comprised of precipitation in the middle reaches as well as upstream runoff. Thus, we utilized the ratio of upstream to midstream runoff to calculate the relative contribution rates in each case using Equation (4), as follows:
\[\eta \text{=}\frac{{{Q}_{i}}}{{{Q}_{j}}} \ \ (4)\]
where η, Qi, and Qj refer to the contribution rates of upstream to midstream, upstream (m3•s-1), and midstream runoff (m3•s-1), respectively.
3.2.3 Quantitative analysis of climate change and human activities
In order to quantitatively analyze the effects of climate change and human activities on runoff in the middle reaches of the HRB, we used Mann-Kendall (MK) and sliding T-tests to determine runoff change points throughout the region. We then determined the base and evaluation periods for midstream runoff; of these, the first is a natural period where runoff is not affected by human activities, while human activities do play a role within the evaluation period. The main impact of human activities is revealed by land use types; thus, we initially applied a SWIM calibrated with the meteorological data input during the base period in order to simulate the runoff. Land use parameters were then held unchanged while meteorological data for the evaluation period were input into the model to simulate runoff given the impacts of climate change. Lastly, both meteorological and land use data were input into the model to simulate runoff due to the combined influence of both climate change and human activities throughout the evaluation period. A series of equations from Wang et al. (2006) were used for these calculations, as follows:
ΔWT = WHR – WB (5)
ΔWH = WHR – WHN (6)
ΔWC = WHN - WB (7)
ηH = ΔWH / ΔWT × 100% (8)
ηC = ΔWC / ΔWT × 100% (9)
where WB denotes simulated runoff during the base period, while WHN refers to simulated runoff that only takes into account climate change impacts during the evaluation period. Similarly, ΔWT refers to the impact of human activities and climate change on runoff volume during the evaluation period, while ΔWH and ΔWC refer to the impact of human activities and climate change on runoff volumes, respectively, during the evaluation period. Finally, ηC and ηH refer to the contribution rates of climate change and human activities on runoff during the evaluation period, respectively.

4 Analytical results

4.1 SWIM suitability analysis

The use of a SWIM in the context of an analysis of this type was first proposed by the Potsdam Climate Impact Research Institute, Germany. Subsequent use of this approach has been enhanced by development of the soil and water assessment tool and MATSALU models that enable improved runoff simulations in small scale watersheds (Krysanova et al., 1989). The latter of these two models was developed in Estonia for application to the Matsalu Bay agricultural watershed in the Baltic Sea. Thus, building on these previous approaches, we assessed the applicability of our model by using the Nash efficiency (NSE) coefficient; the closer a NSE efficiency coefficient value is to one, the more accurate the simulation results (Gao and Jin, 2012). We selected the period between 1959 and 1988 as the calibration period for this analysis and the period between 1989 and 2008 as the validation period. Data show (Figure 3) that SWIM application accurately simulated daily runoff in the upstream area of the HRB, as resultant NSE values are 0.70 and 0.81 during the calibration and validation periods, respectively. Additional simulation results (Figure 4) also show that the SWIM also accurately simulates daily runoff within the central part of the HRB; resultant NSE values in this case are 0.72 and 0.78 for the calibration and validation periods, respectively. A SWIM can therefore be used to assess the impacts of climate change on river runoff in both the middle and upper reaches of the HRB.
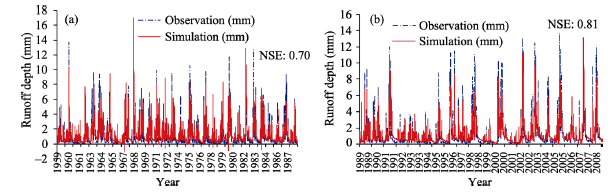
Figure 3 Graphs showing SWIM-simulated daily runoff depths for the upper reaches of the HRB during the calibration between 1959 and 1988 (a) and validation between 1989 and 2008 (b) periods of this study
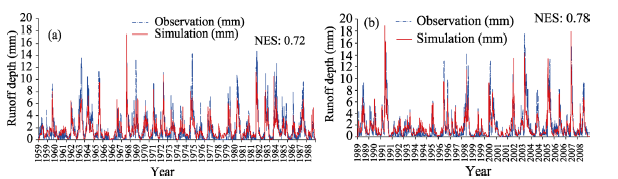
Figure 4 Graphs showing SWIM-simulated daily runoff depths for the middle reaches of the HRB during the calibration between 1959 and 1988 (a) and validation between 1989 and 2008 (b) periods of this study

4.2 Contribution rate of climate factors

4.2.1 Runoff versus temperature and precipitation sensitivity coefficients
The sensitivity of regional hydrological changes due to climate is usually based on the assumption that scenarios for the latter drive models for the former. Thus, a combination of precipitation and temperature change are usually input into climate change modeling scenarios; on the basis of observed trends within the HRB, we assume that plots for the upstream region of this river basin change along a scale of -20%, -10%, 0%, +10%, and +20% for precipitation alongside temperature changes of -1°C, 0°C, +1°C, +2°C, and +3°C. Our model allows for the construction of 25 different climate scenarios within which runoff is simulated; thus, on the basis of these runoff changes, sensitivity to climate change can be assessed.
The SWIM results presented in Table 1 show that when precipitation is constant, a smaller change in runoff with temperature will be seen. In contrast, when temperature is constant, the precipitation change rate increases from an initial constant to a linear rate of increase while the runoff change rate also increases up to a level as high as 20%. The precipitation change rate decreases from an initial constant to a linear rate of decrease while the runoff rate of change has a tendency to decrease, but the change rate is smaller than that caused by increasing precipitation. Overall, the change rate of the runoff varies greatly with the change in the precipitation. Simulation results show that when temperature decreases by 1°C and precipitation increases by 20%, the runoff rate is the highest (40%).
Table 1 SWIM runoff sensitivities given different levels of precipitation recorded at meteorological stations in the upper reaches of the HRB
Δt(°C) Δp (%)
-20 -10 +0 +10 +20
+3 -36.12 -18.35 0.33 20.54 39.93
+2 -36.24 -18.48 0.23 19.74 39.89
+1 -36.36 -18.62 0.09 19.62 39.78
0 -36.48 -18.72 0.00 19.08 39.73
-1 -36.29 -18.53 0.21 19.81 40.00
Data from Table 1 were standardized (Table 2) in order to determine the contribution rates of precipitation and temperature to runoff. To do this, any two groups of runoff change rates given a combination of precipitation and temperature were selected and the normalized results substituted into simultaneous sensitivity coefficient equations. These steps enabled the calculation of runoff sensitivity to both precipitation and temperature; results show that when the sensitivity coefficient (Cvx) of upstream runoff to temperature is between -0.098 and 0.269, that of upstream runoff to precipitation (Cvy) is between 0.909 and 1.145.
Table 2 Standardized runoff sensitivity results for the upper reaches of the HRB
Δp(%) Δt(°C)
-1.2649 -0.6324 0 0.6324 1.2649
1.26491 -1.3038 -0.6559 0.0249 0.7619 1.4687
0.63246 -1.3083 -0.6608 0.0213 0.7327 1.4675
0 -1.3128 -0.6658 0.0161 0.7285 1.4635
-0.63246 -1.3171 -0.6695 0.0130 0.7320 1.4614
-1.26491 -1.31028 -0.6624 0.0208 0.7352 1.4713
4.2.2 Precipitation and temperature contribution rates
We utilized the Tyson polygon method to analyze temperature changes in the upper reaches of the HRB over the last 50 years, between 1959 and 2008. To do this, we employed observational data from seven meteorological stations within this region. Although data reveal an average temperature of 15.3°C for the upper reaches of the HRB, these values have been increasing (Figure 5) at a speed of 0.156°C /10a over the study period. Thus, by applying the relative change in meteorological factors (Equation 1), we can see that the long-term relative temperature change is 4.91%. Similarly, by applying Equation (2) to evaluate the influence of meteorological factors on runoff and Equation (3), the sensitivity coefficient of runoff and temperature, results show that the calculated contribution rate of temperature to the upper reaches of the HRB ranged between -0.005 and 0.01. At the same time, the average annual precipitation in this region was 1060 m over the study period, conforming to a slight upward trend (Figure 5), while the long-term relative change in precipitation was 6.75%. The sensitivity coefficient of runoff compared to precipitation shows that the contribution rate of the latter within the upper reaches of the HRB ranged between 0.061 and 0.077.
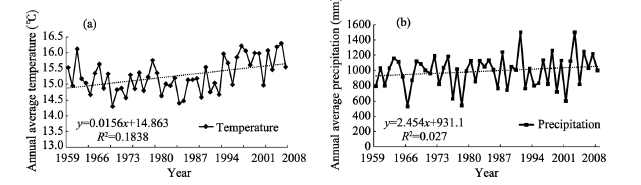
Figure 5 Trend in annual temperature (a) and precipitation (b) between 1959 and 2008

4.3 Contribution rate of climatic factors in upstream-to-midstream runoff

4.3.1 Contribution rate of upstream-to-midstream runoff
Based on daily runoff data collected at the Wangjiaba and Wujiadu stations between 1959 and 2008, we calculated the relative contribution rates of spring, summer, autumn, and winter runoff to the middle reaches of the HRB. These data are presented in Figure 6 and show that the contribution rates for the spring, summer, autumn, and winter seasons were 28.86%, 28.25%, 24.95%, and 25.34%, respectively. The highest contribution to overall runoff is in the spring, while the lowest contribution is in the autumn. The average annual contribution rate was 27.65%.
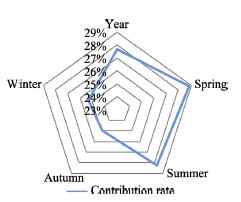
Figure 6 Contribution rates of spring, summer, autumn, and winter seasons to runoff in the middle and upper reaches of the HRB
4.3.2 Upstream climate change contribution rate to midstream runoff
The contribution rate of the precipitation and temperature from the upper reaches of the HRB to the midstream runoff was calculated by multiplying two contribution rates, the contribution rate of precipitation and temperature to runoff in the upper basin regions and the contribution rate of upstream runoff to midstream runoff (Table 3). These results show that the maximum contribution rate of upstream precipitation to midstream runoff is about 2.23%, while the minimum is about 1.53%. Similarly, the maximum contribution rate of upstream temperature to runoff is about 0.38% while the minimum is about ‒0.14%.
Table 3 Contribution rates of upstream meteorological factors to midstream runoff
Contribution rate of upstream meteorological factors to runoff (%) Contribution rate of upstream meteorological factors to midstream runoff (%)
Annual average Spring Summer Autumn Winter
Precipitation (min) 6.13 1.70 1.77 1.73 1.53 1.55
(max) 7.73 2.14 2.23 2.18 1.93 1.96
Temperature (min) -0.48 -0.13 -0.14 -0.14 -0.12 -0.12
(max) 1.32 0.37 0.38 0.37 0.33 0.33
These results show that the upstream HRB precipitation contribution rate to midstream runoff is higher than that of the temperature, while the maximum contribution rate of upstream precipitation (temperature) to runoff in the middle reaches is 2.23% (0.38%). These data show that runoff in the middle reaches of the HRB is not only influenced by upstream precipitation, but also by this process in middle river sections.

4.4 Midstream runoff responses to climate change and human activities

We determined the base and evaluation periods used in this study by analyzing runoff change points; land use data throughout these two periods were then input into our SWIM to simulate runoff. Runoff changes during the two periods were then calculated based on simulations in order to determine the contribution rates of climate change and human activities on the middle reaches of the HRB.
4.4.1 Runoff change points
In order to determine the base and evaluation periods in analyses of this type, runoff sequence change analysis has been applied in previous studies (Zhang et al., 2016). In this context, we applied MK and sliding T-tests to more accurately analyze and determine change points in runoff sequences.
The first of these tests (MK) was applied to annual runoff in the middle reaches of the HRB for the period between 1959 and 2008 (Figure 7). Although results reveal the presence of numerous intersections between Uf and Ub, no specific change years could be identified. However, re-analysis of annual runoff over this period in combination with use of a sliding T-test and selecting a step length of 6, suggests that 1983 was a change year (significance level, α = 0.05). We therefore considered the period between 1959 and 1983 to be the base period for this study, while that between 1984 and 2008 was used as the evaluation period.
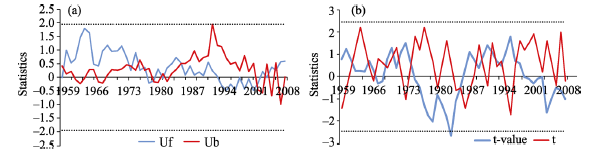
Figure 7 MK test results for runoff sequences (a), and the combined results of MK and sliding T-tests (b)
4.4.2 The effects of climate change and human activities on runoff
Calculations based on Equations (5)-(9) (Table 4) show that the base period for simulation is 7.627 × 10⁶ m3•s‒1. However, when the effects of climate change and human activities are taken into account, the evaluation period runoff is 7.041 × 10⁶ m3•s-1. The influence of human activities and climate change together on runoff during this period equated to 0.661 × 10⁶ m3•s-1; that of the former alone added up to 0.586 × 10⁶ m3•s-1, while that of the latter equated to 0.075 × 10⁶ m3•s-1.
Table 4 River runoff during base and evaluation periods in the middle reaches of the HRB (106 m3•s-1)
Different periods Runoff
WB 7.627
WHN 6.966
WHR 7.041
ΔWT 0.661
ΔWH 0.586
ΔWC 0.075
These results enabled us to calculate the relative contribution rate of climate change and human activities to runoff in the middle reaches of the HRB (Table 5). Data reveal a 12.80% contribution rate of the former and an 87.20% rate of the latter; thus, we can conclude that runoff within the middle reaches of the HRB is predominantly affected by human activities, while the influence of climate change is relatively small. This result is consistent with that for the upper reaches.
Table 5 Contribution rates of climate change and human activities to the HRB midstream runoff
Total variation (106 m3•s‒1) Climate change Human activities
Variation (106 m3•s‒1) Contribution rate Variation (106 m3•s‒1) Contribution rate
0.661 0.075 12.80% 0.586 87.20%
Data presented in the Huaihe River Water Resources Bulletin (http://www.hrc.gov.cn/) shows that the number of large- and medium-sized reservoirs increased from 287 to 322 within the HRB between 1997 and 2000. Similarly, the total reservoir capacity within the region increased from 10.9×10⁹ m3 in 1997 to 13.5× 10⁹ m3 in 2015, while the amount of surface water supply increased from 39.0×10⁹ m3 in 1998 to 43.8×10⁹ m3 in 2015. The data presented in Figure 8 shows that the surface water supply within the HRB has also increased rapidly over the past 20 years; thus, as the data in Figure 5 suggest no significant long-term increase in precipitation within the HRB, it is likely that the most significant impacts on the water supply in this region are from newly built reservoirs, industrial and agricultural water use, and other human activities.
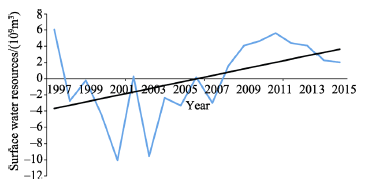
Figure 8 Anomalies in surface water resources in the HRB between 1997 and 2015
4.4.3 Causes of changes in runoff
Data suggest two main causes for runoff changes in the middle reaches of the HRB, the effects of climate change and the impacts of human activities. The contribution rate of precipitation in the upper reaches of the HRB to the middle reaches runoff can reach 2.23% implies that the occurrence of flood-related disasters in the middle reaches is also influenced by the precipitation in the upper reaches. The results presented in this paper show that human activities exert a greater impact on runoff while climate change has a relatively smaller impact. In terms of land use change, a reduction of agricultural area combined with an increase in urban use was also evident throughout both the evaluation and base periods of this study. The data presented in Figure 9 shows that GDP, crop acreage, and the urbanization rate within the HRB all increased significantly between 1996 and 2015. These changes are mainly the result of the rapid economic development characteristic of recent decades and have led to changes in the hydrological cycle.
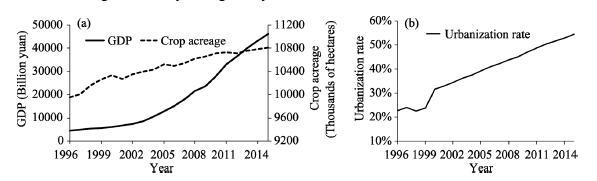
Figure 9 The changes in GDP, crop acreage, and the urbanization rate within the HRB between 1996 and 2015

5 Discussion

Considering the middle and upper reaches of the HRB, and utilizing daily meteorological data, runoff was simulated in this study using a SWIM. Thus, the contribution rate of climatic change to upstream-to-midstream runoff as well as the relative contribution rates of climate change and human activities to runoff were calculated. Combining SWIM outputs with further statistical analyses and taking the complex geographical environment of the region into account, this study quantitatively analyzed the impacts of climate change and human activities on the water resources of the HRB.
There are a number of similarities between the conclusions of this study and those of others; both climate change and human activities have been shown, for example, to have caused a decrease in river flow within the Chinese Loess Tableland, 24% in the case of the former and 76% in the case of the latter (Li et al., 2010). Our results are consistent with the interpretation that anthropogenic factors are the main driving forces underlying decreases in river flow. In the Baiyangdian Lake, for example, quantitative results show that climatic variations can account for between 38% and 40% of streamflow decreases, while human activities can account for between 60% and 62% (Hu et al., 2012). Human activities are the major cause of runoff reductions over the last 50 years, encompassing contribution rates of up to 58.9% and 65.2%, respectively, based on the two methods employed in this paper. Indeed, in light of different scenarios, the range of monthly runoff variation covers a wide range while the influence of precipitation change is stronger than that of temperature, indicating that the former is likely to be a major factor determining future variation in Beiluo River Basin water resources (Zhang et al., 2016). The impact of climate change and human activities on runoff is only likely to become stronger, as corroborated by research carried out Luanhe River catchment (Zhang et al., 2015). Nevertheless, some researchers have argued that climate change is the main factor underlying variation in runoff (Mo et al., 2016) and that this may also be caused by differences in geographical environments.
On the basis of quantitative analyses of the impacts of climate change, we conclude that floods in the middle reaches of the HRB are not just affected by climate change and human activities, but are also influenced by upstream changes in climate. Previous flood risk assessments of the HRB have employed daily maximum precipitation values obtained by fitting 20 kinds of distribution functions as major hazard factors and combining other indicators during different return periods. The predictions summarized in Figure 10 show that high-risk areas of extreme precipitation based on one-in-a-hundred and one-in-a-thousand- year events are concentrated in the upper reaches of the southwestern HRB (Zhang et al., 2014). At the same time, however, lower risk areas in the middle of the HRB are likely to be ost severely affected by floods. This phenomenon may, in part, be due to the fact that the effect of extreme upstream precipitation on midstream runoff. Thus, it may be necessary to consider the actual situation in future flood risk assessments, incorporating the impact of upstream precipitation on the middle reaches rather than just emphasizing the central part of the river basin. These changes to the modeling approach would improve the effectiveness and accuracy of risk assessments and provide support for the development of flood disaster early warning systems.
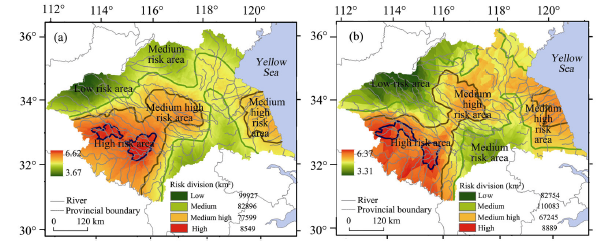
Figure 10 Risk assessment zoning maps for precipitation-related flooding disasters within the HRB over 100- (a) and 1000-year (b) return periods

6 Conclusions

(1) Sensitivity analysis results of runoff versus precipitation and temperature in the upper reaches of the HRB show that under different combination scenarios, the change rate of runoff increases with precipitation while temperature remains constant. At the same time, change in runoff is the largest when precipitation increases by 20%. The sensitivity of runoff to precipitation is thus markedly higher than it is to temperature.
(2) Results show that the contribution rate of precipitation to midstream runoff in the upper reaches of the HRB is significantly higher than the contribution rate of temperature.
(3) The results of this study suggest that two main reasons can explain the frequent flood disasters that characterize the middle reaches of the HRB. In the first place, extreme precipitation occurs frequently in this region, and this affects runoff in the middle reaches of the river basin. Secondly, intensified human activities in the middle reaches of the HRB have modified the normal circulation of natural runoff and evapotranspiration leading to a higher frequency of flood disasters.

The authors have declared that no competing interests exist.

[1]
Aamery N Al, Fox J F, Snyder M, 2016. Evaluation of climate modeling factors impacting the variance of streamflow.Journal of Hydrology, 542: 125-142.The present contribution quantifies the relative importance of climate modeling factors and chosen response variables upon controlling the variance of streamflow forecasted with global climate model (GCM) projections, which has not been attempted in previous literature to our knowledge. We designed an experiment that varied climate modeling factors, including GCM type, project phase, emission scenario, downscaling method, and bias correction. The streamflow response variable was also varied and included forecasted streamflow and difference in forecast and hindcast streamflow predictions. GCM results and the Soil Water Assessment Tool (SWAT) were used to predict streamflow for a wet, temperate watershed in central Kentucky USA. After calibrating the streamflow model, 112 climate realizations were simulated within the streamflow model and then analyzed on a monthly basis using analysis of variance. Analysis of variance results indicate that the difference in forecast and hindcast streamflow predictions is a function of GCM type, climate model project phase, and downscaling approach. The prediction of forecasted streamflow is a function of GCM type, project phase, downscaling method, emission scenario, and bias correction method. The results indicate the relative importance of the five climate modeling factors when designing streamflow prediction ensembles and quantify the reduction in uncertainty associated with coupling the climate results with the hydrologic model when subtracting the hindcast simulations. Thereafter, analysis of streamflow prediction ensembles with different numbers of realizations show that use of all available realizations is unneeded for the study system, so long as the ensemble design is well balanced. After accounting for the factors controlling streamflow variance, results show that predicted average monthly change in streamflow tends to follow precipitation changes and result in a net increase in the average annual precipitation and streamflow by 10% and 11%, respectively, for the wet, temperate watershed.

DOI

[2]
Ahn K H, Merwade V, 2017. The effect of land cover change on duration and severity of high and low flows.Hydrological Processes, 31(1): 133-149.Abstract Land cover has been increasingly recognized as an important factor affecting hydrologic processes at the basin and regional level. Therefore, improved understanding of how land cover change affects hydrologic systems is needed for better management of water resources. The objective of this study is to investigate the effects of land cover change on the duration and severity of high and low flows by using the Soil Water Assessment Tool (SWAT) model, Bayesian Model Averaging (BMA) and copulas. Two basins dominated by different land cover in the Ohio River basin are used as study area in this study. Two historic land covers from the 1950s and 1990s are considered as input to the SWAT model, thereby investigating the hydrologic high and low flow response of different land cover conditions of these two basins. The relationships between the duration and severity of both low and high flow are defined by applying the copula method; changes in the frequency of the duration and severity are investigated. The results show that land cover changes affect both the duration and severity of both high and low flows. An increase in forest area leads to a decrease in the duration and severity during both high and low flows, but its impact is highest during extreme flows. The results also show that the land cover changes have had significant influences on changes in the joint return periods of duration and severity of low and high flows. While this study sheds light on the role of land cover change on severity and duration of high and low flow conditions, more studies using various land cover conditions and climate types are required in order to draw more reliable conclusions in future. This article is protected by copyright. All rights reserved.

DOI

[3]
Bao Z X, Zhang J Y, Wang G Qet al., 2012. Attribution for decreasing streamflow of the Haihe River basin, northern China: Climate variability or human activities?Journal of Hydrology, 460/461(3): 117-129.Climate variability and human activities are regarded as the two driving factors for the hydrological cycle change. In the last several decades, there were statistically significant decreasing trends for streamflow and precipitation, but an increasing trend for mean temperature in the Haihe River basin (HRB). The attribution of climate variability and human activities for streamflow decrease was quantitatively assessed in three catchments located in different parts of the HRB. They are the Taolinkou catchment in the Luanhe River, Zhangjiafen catchment in the north of Haihe River, and Guantai catchment in the south of Haihe River. Based on the break point of streamflow, the whole period was divided into two periods: “natural period” (before the break point) and “impacted period” (after the break point). Using the Variable Infiltration Capacity (VIC) model calibrated in the “natural period”, the “natural streamflow” without the impact of human activities was reconstructed for the whole period. The differences of the “natural streamflow” between the “natural period” and “impacted period” indicated the impact of climate variability on streamflow decrease. The remaining contribution to streamflow decrease was made by human activities. The results indicated that the decrease of streamflow between the two periods could be attributed to 58.5% (41.5%), 40.1% (59.9%), and 26.1% (73.9%) from climate variability (human activities) in the Taolinkou, Zhangjiafen and Guantai catchment, respectively. That was to say, climate variability was the major driving factor for the streamflow decrease in the Taolinkou catchment; on the other hand, human activities was the main driving factor for the streamflow decrease in the Zhangjiafen and Guantai catchment.

DOI

[4]
Bi Caixia, Mu Xingmin, Zhao Guangjuet al., 2013. Effects of climate change and human activity on streamflow in the Wei River basin.Science of Soil and Water Conservation, 11(2): 33-38. (in Chinese)Research was conducted in a tributary of the Yellow River,Wei River.Streamflow at Huaxian station during the period of 1958-2011 were applied to identify the trends and abrupt changes by using Mann-Kendall test,non-parametric Pettitt test and double mass curve analysis in the Wei River basin.The simple water balance model was employed to quantify the effects of climate variability and human activities on streamflow.Results show that 1) a remarkable decrease trend in annual streamflow were detected with the rate of 0.86 mm/a.2) an abrupt change was identified in 1994.The streamflow time series were then divided into two periods,i.e.,the baseline period(1958-1994) and the changed period(1995-2011).3) Streamflow during the changed period decreased by 64.6%,41.3% and 45.5% in dry year,normal year and wet year,respectively.4) In the controlled region of Huaxian station,it was found that precipitation variability and human activities accounted for about 49.0% and 51.0% of the change in streamflow.Additionally,the effect of climate change on streamflow was mostly caused by precipitation decrease in the Wei River basin.

[5]
Birkinshaw S J, Guerreiro S B, Nicholson Aet al., 2017. Climate change impacts on Yangtze River discharge at the Three Gorges Dam.Hydrology and Earth System Sciences, 21(4): 1911-1927.The Yangtze River basin is home to more than 400 million people and contributes to nearly half of China's food production. Therefore, planning for climate change impacts on water resource discharges is essential. We used a physically based distributed hydrological model, Shetran, to simulate discharge in the Yangtze River just below the Three Gorges Dam at Yichang (1 007 200 km), obtaining an excellent match between simulated and measured daily discharge, with Nash-Sutcliffe efficiencies of 0.95 for the calibration period (1996-2000) and 0.92 for the validation period (2001-2005). We then used a simple monthly delta change approach for 78 climate model projections (35 different general circulation models - GCMs) from the Coupled Model Intercomparison Project Phase 5 (CMIP5) to examine the effect of climate change on river discharge for 2041-2070 for Representative Concentration Pathway 8.5. Projected changes to the basin's annual precipitation varied between -3.6 and +14.8 % but increases in temperature and consequently evapotranspiration (calculated using the Thornthwaite equation) were projected by all CMIP5 models, resulting in projected changes in the basin's annual discharge from -29.8 to +16.0 %. These large differences were mainly due to the predicted expansion of the summer monsoon north and west into the Yangtze Basin in some CMIP5 models, e.g. CanESM2, but not in others, e.g. CSIRO-Mk3-6-0. This was despite both models being able to simulate current climate well. Until projections of the strength and location of the monsoon under a future climate improve, large uncertainties in the direction and magnitude of future change in discharge for the Yangtze will remain.

DOI

[6]
Chen Xiaohong, Tu Xinjun, Xie Pinget al., 2010. Progresses in the research of human induced variability of hydrological elements.Advances in Earth Science, 25(8): 800-811. (in Chinese)This paper reviews the research progress of hydrological variability caused by intensive human activities in the following three subjects: ①For the responses of hydrological elements to human activities,presently two kinds of approaches,qualitative and quantitative analysis,have been put forward.The complex driving factors of human activities to hydrological change were revealed,and a series of hydrological models for quantitative analysis of hydrological response to human activities were developed.②Some achievements were found in recognition of changing point for time series of hydrological features by mainly using statistic methods,while some new approaches like difference entropy method were used in recognition of hydrological variability,and spatial variation of hydrological elements studied though this kind of research was just started.③Two kinds of methods,item by item investigation and hydrological modeling,were set up for decomposing the influences of climate change and human activities on hydrological variation.Mechanism and models describing the impact of land use and land cover change(LUCC) on hydrological variations were developed and the contribution of LUCC to hydrological changes in the agricultural areas was studied.Through this review,it was found that there exist some shortcomings in the present research in quantitative analysis of hydrological response to human activities,recognition of hydrological variation,and driving mechanism of LUCC to hydrological changes.Therefore,future research in these aspects should be strengthened.

DOI

[7]
Deng H J, Chen Y N, 2017. Influences of recent climate change and human activities on water storage variations in Central Asia.Journal of Hydrology, 544: 46-57.Terrestrial water storage (TWS) change is an indicator of climate change. Therefore, it is helpful to understand how climate change impacts water systems. In this study, the influence of climate change on TWS in Central Asia over the past decade was analyzed using the Gravity Recovery and Climate Experiment satellites and Climatic Research Unit datasets. Results indicate that TWS experienced a decreasing trend in Central Asia from 2003 to 2013 at a rate of -4.44-2.2 mm/a, and that the maximum positive anomaly for TWS (46 mm) occurred in July 2005, while the minimum negative anomaly (32.5 mm) occurred in March 2008-August 2009. The decreasing trend of TWS in northern Central Asia (-3.86-0.63 mm/a) is mainly attributed to soil moisture storage depletion, which is driven primarily by the increase in evapotranspiration. In the mountainous regions, climate change exerted an influence on TWS by affecting glaciers and snow cover change. However, human activities are now the dominant factor driving the decline of TWS in the Aral Sea region and the northern Tarim River Basin.

DOI

[8]
Dong Xuguang, Gu Weizong, Wang Jinget al., 2015. Quantitative analysis of climate factors for potential evapotranspiration changes in Shandong. Journal of Natural Resources, 30(5): 810-823. (in Chinese)Based on the daily data from 1961 to 2010 of 90 meteorological stations in Shandong Province, the changes of potential evapotranspiration () were studied by analyzing the sensitivity coefficients of to average wind speed, relative humidity, sunshine duration, daily maximum temperature and daily minimum temperature together with the relative changes of these climate factors by using the Penman-Monteith method recommended by FAO. The results showed that the annual was decreasing with the speed of -1.818 mm/a, and it is more significant in summer. The mutation of annual happened around 1983 and the annual increased indistinctly after that. The influence of average wind speed on the changes of was greater in northwest Shandong and was less in the coastal area. The influence of average relative humidity on the changes of was larger in the peninsula and was less in the middle mountain area. The influence of sunshine duration on the changes of was greater in southwest Shandong and south Shandong. The influence of maximum temperature on the changes of was greater in southwest Shandong, west Shandong, and north Shandong. The correlation between climate factors and the changes of was significantly different in space. The changes of was primarily attributed to the wind speed due to its significant trends of decreasing, and followed by sunshine duration. The maximum temperature and the minimum temperature had a little positive contribution to the change of . The positive contribution of relative humidity was greater in the coastal area. The main impacting factor was the wind speed generally in a whole year, and it was so in spring, autumn and winter, but it was sunshine duration in summer. However the peninsula is an exception, that the relative humidity was always the main factor. The sites dominated by the wind speed reduced obviously after the mutation, but that dominated by the relative humidity increased evidently. Because of the significant decrease of sunshine duration in summer, the main impacting factor in summer was sunshine duration in most areas after the mutation.

[9]
Gao Chao, Jin Gaojie, 2012. Effects of DEM resolution on results of the SWIM hydrological model in the Changtaiguan basin.Geographical Research, 31(3): 399-408. (in Chinese)

[10]
Gao C, Zhang Z T, Zhai J Qet al., 2015. Research on meteorological thresholds of drought and flood disaster: A case study in the Huai River basin, China.Stochastic Environmental Research and Risk Assessment, 29(1): 157-167.Together with affected areas of crops from 1978 to 2008, the daily precipitation of 110 stations located in the Huai River Basin during 1959-2008 was used to study the critical conditions when drought and flood occur, based on which the quantitative relationship between the critical condition and the affected area of crops was further studied. Based on the research on the hazard-formative factor of precipitation and the damage degree of crops, the spatial-temporal characteristics of disasters were analyzed, the drought and flood disaster-causing threshold was determined, and the quantitative relationship between the disaster-causing threshold and affected area of crops was established. The results are as the follows: (1) During 1959-2008, extreme precipitation levels were high in the eastern and western part of the Huai River Basin and were low in its central part; the spatial distribution of the coefficient of variation (CV) differed greatly from average extreme precipitation: the series of most stations were located in the central basin, and especially there was a positive trend in Anhui and Henan Provinces. (2) The cumulative precipitation during the disaster period of each station was divided by its mean cumulative precipitation during the same period in 1959-2008 to obtain the disaster-causing threshold, which has shown a good effect on reflecting the actual grade and affected areas in disasters. (3) The relationship among disaster grade, disaster-causing threshold and damage area of crops was established; this threshold can be used as a tool for agricultural disaster assessment and early warning, and can effectively improve the ability to prevent and mitigate disaster in the Huai River Basin. (4) The disaster-causing threshold can be an important input parameter for hazard assessment; other underlying surface indicators can be good supplements for determining the threshold in hazard assessment.

DOI

[11]
Gao L M, Zhang Y N, 2016. Spatio-temporal variation of hydrological drought under climate change during the period 1960-2013 in the Hexi Corridor, China.Journal of Arid Land, 8(2): 157-171.In recent years, climate change has been aggravated in many regions of the world. The Hexi Corridor is located in the semiarid climate zone of Northwest China, which is particularly affected by climate change. Climate change has led to the spatial and temporal variations of temperature and precipitation, which may result in hydrological drought and water shortage. Thus, it is necessary to explore and assess the drought characteristics of river systems in this area. The patterns of hydrological drought in the Hexi Corridor were identified using the streamflow drought index(SDI) and standardized precipitation index at 12-month timescale(SPI12) from 1960 to 2013. The evolution of drought was obtained by the Mann-endall test and wavelet transform method. The results showed that both the mean annual SDI and SPI12 series in the Hexi Corridor exhibited an increasing trend during the study period. According to the results of wavelet analysis, we divided the study period into two segments, i.e. before and after 1990. Before 1990, the occurrence of droughts showing decreased SDI and SPI12 was concentrated in the northern part of the corridor and shifted to the eastern part of the corridor after 1990. The probability of drought after 1990 in Shule River basin decreased while increased in Shiyang River basin. The wavelet analysis results showed that Shiyang River basin will be the first area to go through the next drought period. Additionally, the relationships between drought pattern and climate indices were analyzed. The enhanced westerly winds and increased precipitation and glacier runoff were the main reasons of wet trend in the Hexi Corridor. However, the uneven spatial variations of precipitation, temperature and glacier runoff led to the difference of hydrological drought variations between the Shule, Heihe and Shiyang River basins.

DOI

[12]
He Hui, Liao Xueping, Lu Honget al., 2016. Features of long-cycle drought-flood abrupt alternation in South China during summer in 1961-2014.Acta Geographica Sinica, 71(1): 129-141. (in Chinese)In this study, summer long-cycle drought-flood abrupt alternation index(LDFAI) is calculated based on the monthly precipitation data from May to August obtained from 110 weather stations in South China from 1961 to 2014. LDFAI, which compares the precipitation amounts under different disaster conditions, can reflect the features of drought- flood abrupt alternation in South China in summer. The spatial-temporal change of summer LDFAI in South China have been studied by rotated empirical orthogonal function analysis, trend coefficient estimation, linear trend analysis, t-test, and Mann-Kendall test. Results show the following:(1)the overall change trend of the average LDFAI in South China was not remarkable, whereas the LDFAI intensity exhibited significant periodic changes, including two strong periods and a weak period.(2) The summer LDFAI can be divided into five main spatial regions. The analysis of the data from the representative stations in different spatial regions showed that the summer LDFAI values in Region 1(North Guangdong and Northeast Guangxi) and Region 2(West Guangdong and Southeast Guangxi) demonstrated downward trends. The decline in Region 1 was significant, and an abrupt decline occurred in 1988. The summer LDFAI values in Region 3(East Guangdong) and Region 5(Hainan Island) showed significant upward trends.An abrupt rise occurred in Region 3 in 1980. The LDFAI in Region 4(West Guangxi) exhibited periodic change features.(3) As regards the interdecadal change features of the LDFAI for the study period, the LDFAI values in Region 1 and Region 2 declined, whereas the amount of precipitation in May and June increased over the years. In the 1990 s and 2000 s, The LDFAI values in Region 3 and Region 4 were high, and the precipitation amount in July and August were higher than that in other months. In Region 5, the LDFAI increased, and the precipitation in July and August increased over the years as well.

DOI

[13]
He Ruimin, Zhang Jianyun, Bao Zhenxinet al., 2015. Response of runoff to climate change in the Haihe River basin.Advances in Water Science, 26(1): 1-9. (in Chinese)The Variable Infiltration Capacity( VIC) model was used to investigate the response of runoff to climate change in the Haihe River basin( HRB). Firstly,the parameters of the VIC model were calibrated in six sub-catchments in the HRB. Secondly,using the parameter regionalization methodology,the model parameters were estimated in other parts of the HRB. Thirdly,The response of runoff to climate change in the HRB was estimated based on the hypothetical climate scenarios. The results indicated that a 2 increase of annual mean temperature would lead to a6. 5% decrease of runoff in the HRB. A 10% increase or decrease of annual precipitation would lead to a 26% increase or 23% decrease of runoff,respectively. A 10% increase or decrease of the percentage of precipitation in the flood season would lead to a 12% increase or 7% decrease of runoff,respectively. Spatially,under the change of temperature and / or precipitation,the runoff in the north-western HRB was more sensitive than that in the south-eastern HRB. Otherwise,under the change of the percentage of precipitation in the flood season,the runoff in the southeastern HRB was more sensitive than that in the north-western HRB. Overall,the more precipitation,the less sensitive of runoff to precipitation and / or temperature,but the more sensitive of runoff to the percentage of precipitation in the flood season.

DOI

[14]
Hu S S, Liu C M, Zheng H Xet al., 2012. Assessing the impacts of climate variability and human activities on streamflow in the water source area of Baiyangdian Lake.Journal of Geographical Sciences, 22(5): 895-905.作为在北方中国平原(NCP ) 的最大的沼泽地,拜伊昂达恩·莱克在维持水平衡和 NCP 的生态的健康起一个重要作用。在过去几十年,在与气候可变性和人的活动联系的 Baiyangdian 盆的减少的流速及流水量引起了一系列水和 eco 环境的问题。在这研究,我们确定了水里的流速及流水量上的气候可变性和人的活动的影响采购拜伊昂达恩·莱克的区域,基于从 1960 ~ 2008 的上面的 Tanghe 河集水(Baiyangdian 盆的亚盆) 的 hydrologic 变化的分析。气候弹性方法和水文学建模方法被用来区分气候可变性和人的活动的效果。结果证明年度流速及流水量显著地减少了(P > 0.05 ) 在 1.7, mm/a 和一个突然的变化在一年 1980 附近被识别。quantification 结果显示气候变化说明了减少的流速及流水量的 38%40% ,当人的活动说明了 60%62% 时。因此,人的活动的效果在拜伊昂达恩·莱克的水来源区域在流速及流水量的衰落上起了一个主导的作用。把生态系统作为拜伊昂达恩·莱克的健康,我们建议最小的生态的水需求和综合分水岭管理以后应该被保证。

DOI

[15]
Juckem P F, Hunt R J, Anderson M Pet al., 2008. Effects of climate and land management change on streamflow in the driftless area of Wisconsin.Journal of Hydrology, 355(1-4): 123-130.Baseflow and precipitation in the Kickapoo River Watershed, located in the Driftless Area of Wisconsin, exhibit a step increase around 1970, similar to minimum and median flows in many other central and eastern USA streams. Potential effects on streamflow due to climatic and land management changes were evaluated by comparing volumetric changes in the hydrologic budget before and after 1970. Increases in precipitation do not fully account for the increase in baseflow, which appears to be offset by a volumetric decrease in stormflow. This suggests that factors that influence the partitioning of precipitation into overland runoff or infiltration have changed. A transition from relatively more intensive to relatively less intensive agricultural land use is generally associated with higher infiltration rates, and likely influences partitioning of flow. Changes in agricultural land management practices in the Driftless Area, which began in the mid-1930s, do not coincide with the abrupt increase in baseflow around 1970. Instead, the timing of hydrologic change appears to coincide with changes in precipitation, whereas the magnitude of the change in baseflow and stormflow was likely amplified by changes in agricultural land management.

DOI

[16]
Krysanova V, Meiner A, Roosaare Jet al., 1989. Simulation modelling of the coastal waters pollution from agricultural watershed.Ecological Modelling, 49(1/2): 7-29.The purpose of this research was to assess nonpoint nutrient pollution on an agricultural watershed and its influence on the eutrophication process in a sea-bay ecosystem. The method of simulation modelling was used for reliable determination of nitrogen- and phosphorus-loss dynamics in time and space on the watershed and evaluation of the influence of excess nutrient flow on the sea-bay ecosystem. Discrete simulation was chosen as the level of approach for basin submodels to provide point-scale simulation of 501 areas of pollution. The model of the bay ecosystem was realized as four systems of ordinary differential equations. An analysis of scenarios allows us to range different measures leading to more effective management practices for the basin.

DOI

[17]
Lan Yongchao, Shen Yongping, Zhong Yingjunet al., 2010. Sensitivity of the mountain runoff of Urumqi River to the climate changes.Journal of Arid Land Resources and Environment, 24(11): 50-55. (in Chinese)Characteristics and trends of precipitation,temperature and runoff variation in the mountain watershed of Urumqi River basin in past over 40 years were analyzed based on the measured data at the relational hydrological and weather stations in the area,and a responding model was established to find out the sensibility of mountain runoff to climate change.The results showed that the mountain climate of Urumqi River basin has been transforming obviously from cold and arid to wet and warm during the period from late stage of 1980s to the turn of the century.Because there was a markedly positive correlation between Mountain runoff and temperature,precipitation,the mountain runoff also has been increasing under the influences of precipitation increasing and temperature rising in the mountain watershed.The mountain runoff was more sensitive to mountain precipitation change than temperature,comparatively speaking.the runoff was more sensitive to mountain precipitation change than temperature change.Change of the mountain runoff in future will be decided by primarily mountain precipitation,and temperature rising will be propitious to runoff increasing during a specified time.

DOI

[18]
Liew M W V, Garbrecht J, 2003. Hydrologic simulation of the Little Washita River experimental watershed using SWAT.Journal of the American Water Resources Association, 39(2): 413-426.ABSTRACT: Precipitation and streamflow data from three nested subwatersheds within the Little Washita River Experimental Watershed (LWREW) in southwestern Oklahoma were used to evaluate the capabilities of the Soil and Water Assessment Tool (SWAT) to predict streamflow under varying climatic conditions. Eight years of precipitation and streamflow data were used to calibrate parameters in the model, and 15 years of data were used for model validation. SWAT was calibrated on the smallest and largest sub-watersheds for a wetter than average period of record. The model was then validated on a third subwatershed for a range in climatic conditions that included dry, average, and wet periods. Calibration of the model involved a multistep approach. A preliminary calibration was conducted to estimate model parameters so that measured versus simulated yearly and monthly runoff were in agreement for the respective calibration periods. Model parameters were then fine tuned based on a visual inspection of daily hydrographs and flow frequency curves. Calibration on a daily basis resulted in higher baseflows and lower peak runoff rates than were obtained in the preliminary calibration. Test results show that once the model was calibrated for wet climatic conditions, it did a good job in predicting streamflow responses over wet, average, and dry climatic conditions selected for model validation. Monthly coefficients of efficiencies were 0.65, 0.86, and 0.45 for the dry, average, and wet validation periods, respectively. Results of this investigation indicate that once calibrated, SWAT is capable of providing adequate simulations for hydrologic investigations related to the impact of climate variations on water resources of the LWREW.

DOI

[19]
Li K Y, Coe M T, Ramankutty Net al., 2007. Modeling the hydrological impact of land-use change in West Africa.Journal of Hydrology, 337(3/4): 258-268.Numerical simulations of idealized deforestation and overgrazing are performed for the Niger and Lake Chad basins of West Africa with a terrestrial ecosystem model IBIS (integrated biosphere simulator) and an aquatic transport model THMB (terrestrial hydrology model with biogeochemistry). The study reveals how land use changes affect hydrological regimes at the watershed scale. The results show that tropical forests, due to being situated in the regions of highest rainfall and exerting strong influence on evapotranspiration, have a disproportionately large impact on the water balance of the entire basin. Total deforestation (clearcutting) increases the simulated runoff ratio from 0.15 to 0.44, and the annual streamflow by 35-65%, depending on location in the basin, although forests occupy only a small portion (<5%) of the total basin area. Complete removal of grassland and savanna, which occupy much greater areas of the basins, result in an increase in simulated annual streamflow by 33-91%. The numerical simulations indicate that the hydrological response to progressive land cover change is non-linear and exhibits a threshold effect. There is no significant impact on the water yield and river discharge when the deforestation (thinning) percentage is below 50% or the overgrazing percentage below 70% for savanna and 80% for grassland areas; however, the water yield is increased dramatically when land cover change exceeds these thresholds. This threshold effect is a combined result of the non-linearity of the separate response of transpiration and soil and canopy evaporation to the imposed land cover changes.

DOI

[20]
Li Zhi, Liu Wenzhao, Zheng Fenliet al., 2010. The impacts of climate change and human activities on river flow in the Loess Tableland of China.Acta Ecologica Sinica, 30(9): 2379-2386. (in Chinese)This study separated the effects of climate change and human activities on river flow in the Heihe watershed(a tributary of Jinghe river) during 1972-2000 using statistical methods of the Mann-Kendall trend tests and double mass curve.Results showed that climate tended to become warmer and drier while river flow became lower for the period.The whole study period could be divided into two sub-periods(1972-1992 and 1993-2000) by the year when river flow underwent abrupt change.Compared with the former period,precipitation decreased by 75.4 mm and temperature increased by 0.5 while rive flow decreased by 29 mm in the latter period.Both climate change and human activities caused a decrease in river flow,with contributions being 24% for the former and 76% for the latter.Overall,the results indicated that human activities were the main driving forces for the decrease of river flow.However,the impacts of climate change can not be ignored,and the effects should be taken into account when carrying out ecological construction and water resources management in the Loess Plateau.

DOI

[21]
López-Moreno J I, Zabalza J, Vicente-Serrano S Met al., 2014. Impact of climate and land use change on water availability and reservoir management: Scenarios in the Upper Aragón River, Spanish Pyrenees.Science of the Total Environment, 493: 1222-1231.61First simulation of combined land cover and climate change in the hydrology of the Pyrenees61First simulation of management of a Pyrenean reservoir under for future scenarios61Deep hydrological changes are projected for the next future in the Pyrenees.61Expected difficulties to supply water demand under obtained projections

DOI PMID

[22]
Lu Miao, Gao Chao, Su Budaet al., 2015. Spatial distribution and probabilistic characteristics of extreme precipitation in the Huaihe River basin.Journal of Natural Disasters, 24(5): 160-168. (in Chinese)Based on the precipitation data during Jan. 1,1959 and Dec. 31,2008 from 110 stations around Huaihe River basin,AM and POT extreme precipitation sequences were established,33 distribution functions of 4 categories were applied to fit the extreme precipitation sequences. Then the optimal probability distribution model was established. The results show that,daily spatial distribution of average precipitation of 1959- 2008 of the basin reduces gradually from both boundaries to the center of the basin,and there are two strong precipitation centers,namely Huaihe River upstream region and eastern Yishusi valley,exist in the region. Also,K- S method checking showed that,Wakeby function is the optimal probabilistic distribution function for the two series AM. The error rate of the estimated values from the observed values increases with the increase of the actual precipitation,and the errors of moststations are less than 20%. According to analysis of the shape and scale parameters of the optimal probability distribution model,the probabilities of extreme precipitation are larger in zhumadian,Funan,Huainan regions and the intersection region of Anhui,Shandong and Jiangsu Provinces; the changes of extreme precipitation are not stable in the surroundings of the Huaihe River main stream and downstream areas. Based on the shape and scale parameters of optimal probability distribution model,the extreme precipitation hazard map was drawn. The map may provide a theoretical reference for the work of disaster prevention and mitigation of extreme precipitation events.

DOI

[23]
Ma C K, Sun L, Liu S Yet al., 2015. Impact of climate change on the streamflow in the glacierized Chu River Basin, Central Asia.Journal of Arid Land, 7(4): 501-513.

DOI

[24]
Mladjic B, Sushama L, Khaliq M Net al., 2011. Canadian RCM projected changes to extreme precipitation characteristics over Canada.Journal of Climate, 24(10): 2565-2584.Changes to the intensity and frequency of hydroclimatic extremes can have significant impacts on sectors associated with water resources, and therefore it is relevant to assess their vulnerabilities in a changing climate. This study focuses on the assessment of projected changes to selected return levels of 1-, 2-, 3-, 5-, 7- and 10-day annual (April–September) maximum precipitation amounts, over Canada, using an ensemble of five 30-yr integrations each for current reference (1961–90) and future (2040–71) periods performed with the Canadian Regional Climate Model (CRCM); the future simulations correspond to the A2 Special Report on Emissions Scenarios (SRES) scenario. Two methods, the regional frequency analysis (RFA), which operates at the scale of statistically homogenous units of predefined climatic regions, with the possibility of downscaling to gridcell level, and the individual gridbox analysis (GBA), are used in this study, with the time-slice stationarity assumption. Validation of model simulated 20-, 50- and 100-yr return levels of single- and multiday precipitation extremes against those observed for the 1961–90 period using both the RFA and GBA methods suggest an underestimation of extreme events by the CRCM over most of Canada. The CRCM projected changes, realized with the RFA method at regional scale, to selected return levels for the future (2041–70) period, in comparison to the reference (1961–90) period, suggest statistically significant increases in event magnitudes for 7 out of 10 studied climatic regions. Though the results of the RFA and GBA methods at gridcell level suggest positive changes to studied return levels for most parts of Canada, the results corresponding to the 20-yr return period for the two methods agree better, while the agreement abates with increasing return periods, that is, 50 and 100 yr. It is expected that the increase in return levels of short and longer duration precipitation extremes will have severe implications for various water resource–related development and management activities.

DOI

[25]
Mo Shuhong, Wang Xuefeng, Gou Kuiet al., 2016. Impacts of climate changes and human activities on annual runoff of Bahe River basin.Journal of Hydroelectric Engineering, 35(9): 7-17. (in Chinese)River runoff is related to water security in the downstream region, and it is vital to water resources management to conduct reliable assessment to the impacts of climate changes and human activities. This paper presents an analysis on the impacts of these two factors on mean annual changes in the runoff of the Bahe River in Shaanxi, using the Kendall rank correlation method for temporal trends and based on the records of precipitation, evaporation and runoff at the Luolicun and Maduwang hydrological stations in the period of 1959-2010. The Mann-Kendall test and accumulative anomaly method were used in this study to detect the statistically significant change points in hydrometeorological series, and ratios of slope changes in cumulative quantities were compared to quantify the relative effects of climate and human factors on runoff variation. Results show that in this period, no change point was detected in the runoff of upper Bahe, while in the midstream runoff of 1988 a significant steep drop in the streamflow occurred, thus showing an evident change point. This rapid change indicates that, on the upper stream runoff, human activities had a relatively small effect but climate change was the main factor; on the midstream runoff after 1988, both climate and human factors played major roles in causing the significant runoff drop. Decomposition results reveal that, to the variations in the upper stream annual runoff, the two factors contributed 97% and 3% respectively, while in the midstream case the corresponding contributions were 37% and 63%. Overall, human impact was dominant in the runoff decline of the Bahe River basin.

DOI

[26]
Piao S L, Ciais P, Huang Yet al., 2010. The impacts of climate change on water resources and agriculture in China.Nature, 467(7311): 43-51.Abstract China is the world's most populous country and a major emitter of greenhouse gases. Consequently, much research has focused on China's influence on climate change but somewhat less has been written about the impact of climate change on China. China experienced explosive economic growth in recent decades, but with only 7% of the world's arable land available to feed 22% of the world's population, China's economy may be vulnerable to climate change itself. We find, however, that notwithstanding the clear warming that has occurred in China in recent decades, current understanding does not allow a clear assessment of the impact of anthropogenic climate change on China's water resources and agriculture and therefore China's ability to feed its people. To reach a more definitive conclusion, future work must improve regional climate simulations-especially of precipitation-and develop a better understanding of the managed and unmanaged responses of crops to changes in climate, diseases, pests and atmospheric constituents.

DOI PMID

[27]
Pierrehumbert R T, 2002. The hydrologic cycle in deep-time climate problems. Nature, 419(6903): 191-198.Hydrology refers to the whole panoply of effects the water molecule has on climate and on the land surface during its journey there and back again between ocean and atmosphere. On its way, it is cycled through vapour, cloud water, snow, sea ice and glacier ice, as well as acting as a catalyst for silicate-carbonate weathering reactions governing atmospheric carbon dioxide. Because carbon dioxide affects the hydrologic cycle through temperature, climate is a pas des deux between carbon dioxide and water, with important guest appearances by surface ice cover.

DOI PMID

[28]
Song Xiaomeng, Zhang Jianyun, Zhan Cheshenget al., 2013. Review for impacts of climate change and human activities on water cycle.Journal of Hydraulic Engineering, 44(7): 779-790. (in Chinese)The impacts of Climate change and human activities are two topics in the current evolution law research of hydrology and water resources. A lot of achievements have been found in the research of responses of water resources to climate change and human activities in recent years. The water circular system is an important part of the climate system,and climate change will result in temporal and spatial change in water resources. Meanwhile,human activities are another important driver in watershed hydrologic cycle system. Land use/cover changes and construction of large hydraulic engineering will affect mechanism of runoff yield and flow concentration through changing underlying surface. It is of importance to quantify the influence of climate change and human activities for the cognition of evolution law and sustainable development of water resources. In the paper,three aspects of the research have been concluded as follow ing:the research progress of the hydrologic impacts caused by the two major driving factors respectively has been summarized;the methods of detection and attribution analysis for variation of water cycle elements in a changing environment have been introduced;and then based on the current research contents, the problems or shortage of quantitatively decomposing the influences of climate change and human activities on hydrologic cycle were discussed. Finally,the future research to be further studied in the field of climate change and human activities impacting on hydrology and water resources were addressed.

[29]
Sun Yue, Li Dongliang, 2014. Features and response to climate-driven factors of the runoff in the upper reaches of the Weihe River in 1975-2011. Journal of Glaciology and Geocryology, 36(2): 413-423. (in Chinese)As the largest tributary of the YellowRiver,the Weihe River provides a great deal of water sources to the Gansu Province and Shaanxi Province,China,having strategic significance in regional development,ecosystem health and sustainability of socio-economic development in the YellowRiver basin. The catchment area of the upper reaches of the Weihe River is 2. 579 km2,which occupies 19. 1% of the total area of the Weihe River watershed. In this paper,the runoffs at Beidao and Wushan Hydrologic Stations of the upper reaches of the Weihe River from 1975 to 2011 were calculated and analyzed in order to understand the runoff features and their response to climate-driven factors. The climate change characteristics were analyzed using the data of monthly precipitation and potential evapotranspiration,which were estimated by using FAO Penman-Monteith method. After selecting the representative stations,the correlation coefficients between the annual,seasonal runoff and climate-driven factors were calculated,and the sensitivity of runoff to the climate change was analyzed. The following conclusions can be drawn:( 1) Annual runoff of the river has obviously decreased as a whole,especially in the 1990s,but shifted to increase in the early 21st century.( 2) Runoff concentrates in the flood season,and had different distribution forms in different decades.( 3) Runoff is affected by climate change; runoff decreases when climate is warm,precipitation decreases,potential evapotranspiration increases and water consumption increases.( 4) The response of runoff to climate-driven factors is not stable,changing with time.( 5) Both precipitation and potential evapotranspiration contribute to the change of runoff,and the contribution rate of potential evapotranspiration has increased from the 1990s,becoming the major factor to the runoff decreasing.

DOI

[30]
Tong S T Y, Sun Y, Ranatunga Tet al., 2012. Predicting plausible impacts of sets climate and land use change scenarios on water resources.Applied Geography, 32(2): 477-489.The Hydrologic Simulation Program - Fortran (HSPF) model was chosen in this study to simulate stream flow and nutrient transport process. Five hypothetical climate change scenarios were used to cover the possible ranges of variability in the year 2050. An enhanced population-coupled Markov-Cellular Automata (CA-Markov) land use model was developed to predict the 2050 land use pattern. When these scenarios were incorporated into the HSPF model, the future conditions in the LMR basin were postulated. The findings demonstrated that: 1) the LMR watershed would experience an increase in flow and nutrients under the 2050 land use projection, 2) stream flow and water quality impacts would be amplified when both climate and land use changes were simultaneously considered, 3) land use change (and in the case of the LMR watershed, urbanization) could help to alleviate water shortage during the dry years, 4) total phosphorus and nitrogen would increase under all future climate and land use scenarios; the highest increase was found under the combined wettest and future land use scenarios, and 5) the described approach is effective in simulating the hydrologic and water quality effects of climate and land use changes in a basin scale. These results are relevant to planners; they can be useful in formulating realistic watershed management policies and mitigation measures.

DOI

[31]
Wang Guoqing, Wang Yunzhang, Kang Lingling, 2002. Analysis on the sensitivity of runoff in Yellow River to climate change.Journal of Applied Meteorological Science, 13(1): 117-121. (in Chinese)Effects of climate change on runoff in Yellow River are studied with hypothetical scenarios using the monthly hydrological model. The results show that runoff is less sensitive to temperature change but more sensitive to precipitation change, and runoff in the middle reaches is more sensitive to climate change than that in upper reaches. While temperature increases 1 ℃, runoff in Yellow River decreases 5%; while precipitation changes 10%, runoff changes about 17%.

[32]
Wang Guoqing, Zhang Jianyun, He Ruimin, 2006. Impacts of environmental change on runoff in the Fenhe River basin of the middle Yellow River.Advances in Water Science, 17(6): 853-858. (in Chinese)Runoff in many rivers in China have presented decreasing trend over the past decades.How to identify the effects of climate change and human activities in the trend variation are a current hot topic,a difficulty problem as well.An assessment method to quantitatively distinguish the effects of climate change and human activities was put forward in the paper.SIMHYD rainfall runoff model was briefly introduced and calibrated with "natural" hydro-meteorological data in Fenhe River basin.Based on simulation of natural runoff in human-disturbed period with hydrological model,causes of runoff variation were analyzed.And results show that SIMHYD rainfall runoff model has good performance for natural monthly discharge simulation.On average,35.9% and 64.1% of total annual runoff reduction from 1970-1999 were induced by climate change and human activities respectively.Human activities are main reasons of runoff reduction in Fenhe River basin.

DOI

[33]
Wang Sheng, Tian Hong, Ding Xiaojunet al., 2009. Climate characteristics of precipitation and phenomenon of drought-flood abrupt alternation during main flood season in Huaihe River basin.Chinese Journal of Agrometeorology, 30(1): 31-34. (in Chinese)Huaihe River Basin locates in the north and south climate transition belt in China.The change rate of the inter-annual precipitation is obvious,and the flood-drought disaster occurs frequently in main flood season.Based on the precipitation data of 126 meteorological stations,the spatial-temporal distribution characteristics of the precipitation,the precipitation variations in typical dry-flood years and the phenomenon of drought-flood abrupt alternation during the main flood season in Huaihe River Basin were analyzed,by using EOF,linear-trend estimate and Mann-Kendall catastrophe test.The results indicated that the spatial distribution of the precipitation showed that there were more precipitation in the South,mountain areas and inshore areas,compared to the North,plain and inland.The drought and flood mainly occurred in the South.The inter-annual variation of precipitation was also significant,especially in the lately decade.The concentrating heavy rain mainly occurred in the first ten days of July.The phenomenon of drought-flood abrupt alternation frequently occurred.Its frequency had obviously increased since 2000.

DOI

[34]
Wu D, Chen F H, Li Ket al., 2016. Effects of climate change and human activity on lake shrinkage in Gonghe Basin of northeastern Tibetan Plateau during the past 60 years.Journal of Arid Land, 8(4): 479-491.

DOI

[35]
Xia Jun, 2009. Impact of water diversion project across basins on land water cycle and water security.Journal of Basic Science and Engineering, 17(6): 831-842. (in Chinese)Water diversion project across basins is one of important approaches to solve regional water resources allocation in China,which is also scientific frontal of the Global Water System Project(GWSP) and key issue of water security in North China.This paper addresses the issue of land water system related to climate change and water diversion project from South to North in China.Based on relative international development in this field and case study of the middle road of water diversion project from South to North in China,three issues are analyzed and discussed,that are key scientific issues,distributed water system model and impact evaluation of water project and climate change on water security in water diversion region and getting water region in China.It is shown that climate change and human activity such as the water diversion project from South to North in China will be key issues for large scale water allocation.Water system will be good approach to understand impact of environmental change on regional water security.

DOI

[36]
Yang L S, Feng Q, Yin Z Let al., 2017. Identifying separate impacts of climate and land use/cover change on hydrological processes in upper stream of the Heihe River, northwest China.Hydrological Processes, 31(1-5): 1100-1112.Climate change and land use/cover change (LUCC) are two factors that produce major impacts on hydrological processes. Understanding and quantifying their respective influence is of great importance for water resources management and socioeconomic activities as well as policy and planning for sustainable development. In this study, the Soil and Water Assessment Tool (SWAT) was calibrated and validated in upper stream of the Heihe River in northwest China. The reliability of the SWAT model was corroborated in terms of the Nash–Sutcliffe efficiency (NSE), the correlation coefficient (R) and the relative bias error (BIAS). The findings proposed a new method employing statistical separation procedures using a physically based modeling system for identifying the individual impacts of climate change and LUCC on hydrology processes, in particular on the aspects of runoff and evapotranspiration.The results confirmed that SWAT was a powerful and accurate model for diagnosis of a key challenge facing the Heihe River basin. The model assessment metrics, NSE, R and BIAS in the data were, respectively, 0.91, 0.95 and 1.14% for the calibration period and 0.90, 0.96 and -0.15%, respectively, for the validation period. An assessment of climate change possibility showed that precipitation, runoff and air temperature exhibited upward trends with a rate of 15.765mm, 6.165mm and 0.3865°C per decade for the 1980 to 2010 period, respectively. Evaluation of LUCC showed that the changes in growth of vegetation, including forestland, grassland and the shrub area has increased gradually while the barren area has decreased. The integrated effects of LUCC and climate change increased runoff and ET values by 3.2% and 6.6% of the total runoff and ET, respectively. Climate change outweighed the impact of LUCC, thus showing respective increases in runoff and ET of about 107.3% and 81.2% of the total changes. The LUCC influence appeared to be modest by comparison, and showed about -7.3% and 18.8% changes relative to the totals, respectively. The increase in runoff caused by climate change factors are more than the offsetting decreases resulting from LUCC. The outcomes of this study show that the climate factors accounted for the notable effects more significantly than LUCC on hydrological processes in the upper stream of the Heihe River.

DOI

[37]
Zhang Guosheng, Li Lin, Shi Xingheet al., 2000. Climatic changes over the upper Yellow River and its effects on water resources.Advances in Water Science, 11(3): 277-283. (in Chinese)The climatic variations since 1961 o ver the upper Yellow River were analyzed in this paper.It indicated that the tendency of annual air temperature rising was very obvious from the m ed and late 1980s, especially the annual air temperature in 1998.From 1990s ,the spring and summer temperature were rapidly increased.The preci pitation dit not have significant variat ion tendency in the annual and autumn,te nded to increas in the winter and spring , and to decrease in the summer.The effe c ts of the annual flow,rainfall,air tempe rature,and droughty climate on the water resources were andyzed.The results s howed that the water resoures were decreased,and the reductive tende ncy was very obvious since the late 1990s. This tendency consisted with that o f the summer precipitation.It indicated that the reductive precipitation du ring flood season was the dominant factor of climate for reducing flow of the upper Yellow River.

[38]
Zhang Jian, Li Tongsheng, Zhang Junhuiet al., 2016. The runoff abrupt change and periodic characteristics of the Wudinghe River during 1933-2012.Acta Geographica Sinica, 36(3): 475-480. (in Chinese)River is the path of water current on the land surface that collection and transmission, and the hydrological response of a catchment and hydrological processes which represents the global changes of the response of the earth- surface. It is of great importance to study the runoff evolvement process. Changing rules and the influence factors in the Yellow River and would enhance sustainable development of social economy and effectively protect our environment under the reasonable utilization of river basin water resources. If we want to identify the ways of response of runoff to climate change in semi-arid region in northwest of China,the study should be first based on the grasp of the long period evolvement rules of runoff. Based on the observed annual runoff data of the Wudinghe River during 1945-2012, the characteristic of the abrupt change had been diagnosed by employing the methods of Moving t-test technique and Mann-Kendall and Yamamoto. The analysis showed that the annual runoff of the Wudinghe River changed abruptly in 1972, in the year since, the decrease of the runoff is about 3.55 / 108m3on average. Precipitation decrease about 6.28% but runoff decrease about 26.62% on average after the abrupt change of the Wudinghe River runoff during 1933-2012. Although precipitation was the primary factor to affect surface water resource, precipitation was not the main reason for runoff decrease compared with human activities. Then reconstruct the sequence of natural runoff of the Wudinghe River during 1933-2012 according to the significant correlation between precipitation and runoff before1972. Morlet complex wavelet function was used to transform the sequence of runoff of Baijiachuan hydrologic stationin of the Wudinghe River during 1933-2012. According to wavelet to analyze the periodic characteristics of the natural annual runoff, the results showed that the average period of annual runoff change have multi-scale periods such as 35.5 a, 22.2 a, 16.8 a, 12.2 a, 9.3 a and 3.3 a. It will be able to calculate the influence degree of the natural runoff change because of human activities such as building a reservoir, building a dam that silting land for developing farmland, etc.

[39]
Zhang Lianpeng, Liu Dengfeng, Zhang Hongxueet al., 2016. Impact of climate change and human activities on runoff variation in the Beiluo River basin.Journal of Hydroelectric Engineering, 35(7): 55-66. (in Chinese)Studies on the attribution of runoff variation under climate change and human activities are valuable to understanding runoff change. This paper analyzes the quantitative contribution of climate change and human activities to runoff variation, using the Budyko assumption and TOPMODEL with application to a case study of the Beiluo River basin of the Wei River. We have examined 25 scenarios of temperature and precipitation changes in the possible range of climate changes, and analyzed the influence of all these scenarios on the runoff. Simulation results show that historic precipitation and runoff took a decreasing tendency while temperature had a rising trend and both temperature rising and precipitation decreasing made contribution to runoff change. But human activities were the major cause for runoff decreasing over the last 50 years and this had a contribution rate up to 58.9% and 65.2% by the two methods respectively. Under different scenarios, the variation in monthly runoff shows a wide range and the influence of precipitation change is stronger than that of temperature change, indicating precipitation change as a major factor of the future variation in water resources.

DOI

[40]
Zhang Liping, Li Lingcheng, Xia Junet al., 2015. Quantitative assessment of the impact of climate variability and human activities on runoff change in the Luanhe River catchment.Journal of Natural Resources, 30(4): 664-672. (in Chinese)The hydrological processes are largely influenced by climate variability and human activities, and the quantitative assessment of their impacts on runoff change is a hot issue in hydrological scientific research. With the quantitative assessment method of runoff change based on SWAT model, this study uses long hydro- climatic data of the Luanhe River Catchment to quantitatively assess the runoff's response to climate variability and human activities. By using Mann- Kendall method, the whole runoff time series were divided into three periods: baseline period, variability period I and II. Then the contribution rates of climate variability and human activities on runoff change in variability period I and II were analyzed with quantitative assessment method. The results show that there was a statistically significant decreasing trend of annual runoff during 1960- 2010. Compared with the average annual runoff in baseline period,the average annual runoff in variability period I and II decreased 49.71% and 70.03%, respectively. So the impact of climate variability and human activities on the runoff became much stronger. And the human activities were the main factors for the runoff decrease. In variability period I, the contribution rates of human activities and climate change on runoff's decrease were-26.30% and-73.70%, respectively. While in variability period II the contribute rates of human activities and climate change on runoff decrease were-26.15% and-73.85%, respectively. As for the impact of land use change on the runoff, it reduced the runoff with the contribution rate of-19.65% in variability period I, while it increased the runoff with the contribution rate of 3.83% in variability period II.

[41]
Zhang Shuifeng, Zhang Jinchi, Min Junjieet al., 2012. Drought-flood abrupt alternation based on runoff in the Huaihe River basin during rainy season.Journal of Lake Sciences, 24(5): 679-686. (in Chinese)Based on the monthly runoff data during 1950-2007at Wujiadu Hydrologic Station in the Huaihe River Basin,the drought-flood abrupt alternation phenomena(including drought to flood and flood to drought) based on runoff was analyzed during the main rainy season(MJJA) by using long-and short-cycle runoff drought-flood abrupt alternation index(RDFAI).The results are as follows: 1) the frequency of long-cycle runoff drought-flood abrupt alternations was higher in the period before 1986,and then decreased after the late 1980s;2) Inter-annual changes of the short-cycle runoff drought-flood abrupt alternation phenomena between the adjacent months varied from each other,with the change between June and July being the most obvious one,and the long-term changes are similar to that of the long-cycle runoff drought-flood abrupt alternation phenomena;3) Both the occurrence of long-and short-cycle runoff drought-flood abrupt alternation phenomena showed decreasing trends during the past 57 years,however,the total drought and total flood phenomena were on the rise;4) During the 2000s,both the long-cycle and short-cycle runoff drought to flood abrupt alternation in June and July increased,and this might be one of the major reasons for the runoff increase during the rainy season at the same period.

DOI

[42]
Zhang Zhengtao, Gao Chao, Liu Qinget al., 2014. Risk assessment on storm flood disasters of different return periods in Huaihe River basin.Geographical Research, 33(7): 1361-1372. (in Chinese)A new method is used to study the risk assessment on storm flood disasters of different return period in the Huaihe River Basin. The method is to make the maximum amount of daily precipitation(PMP), which is regarded as one of the major hazard factors, combined with other 11 kinds of second indexes to carry on the risk assessment. PMP is obtained by using different types of distribution functions fitting annual maximum sequence. The investigations show that the high-risk areas of flood disaster of the Huaihe River Basin are located in Mengwa detention area, Funan County, Anhui Province and the lowlands around it, the moderate-highrisk areas are in the central and southwestern parts of the basin and parts of the eastern basin.The southern-central and northern parts of the basin are low-risk areas. With the return period from 10 a to 1000 a, discrete spatial distributions of PMP in the southwestern basin are greatly increasing. In the eastern basin, the risk is gradually weakened. Moreover, the spatial distribution of flood disaster risk in the Huaihe River Basin shows that the moderate-high-risk areas remain stable. The high-risk and low-risk areas decrease gradually and the ratio of the total area decreases from 8.3% and 42.4% to 3.2% and 30.8%, respectively. The values of high-risk areas keeps invariant but regional concentration has become more obvious. For moderate-risk areas,the ratio increases from 28.3% to 40.9%. Overall, the changes of spatial distribution patterns present that major disasters have reduced but small disasters occurred frequently in the eastern basin. The high-risk areas of the western basin are vulnerable to flood, while the northern and central-southern parts of the basin are relatively safe.

DOI

Outlines

/