Research Articles

Examining urban land-cover characteristics and ecological regulation during the construction of Xiong’an New District, Hebei Province, China

  • KUANG Wenhui , 1 ,
  • YANG Tianrong 1, 2 ,
  • YAN Fengqin 2, 3
Expand
  • 1. Institute of Geographic Sciences and Natural Resources Research, CAS, Beijing 100101, China
  • 2. University of Chinese Academy of Sciences, Beijing 100049, China
  • 3. Northeast Institute of Geography and Agroecology, CAS, Changchun 130102, China

Author: Kuang Wenhui, PhD and Associate Professor, specialized in Land Use/Cover Change (LUCC) and urban ecology. E-mail:

Received date: 2017-04-26

  Accepted date: 2017-06-21

  Online published: 2018-01-10

Supported by

Key Project of Beijing Natural Science Foundation, No.8171004

Copyright

Journal of Geographical Sciences, All Rights Reserved

Abstract

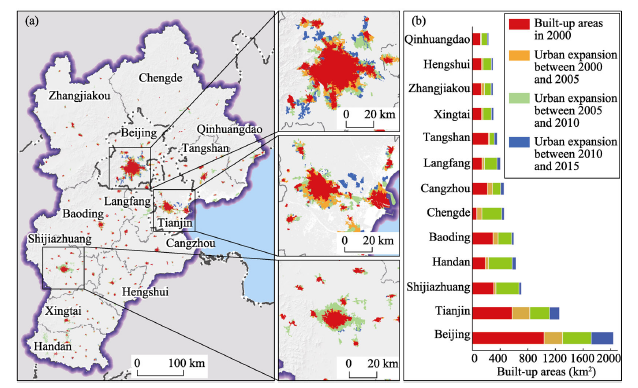
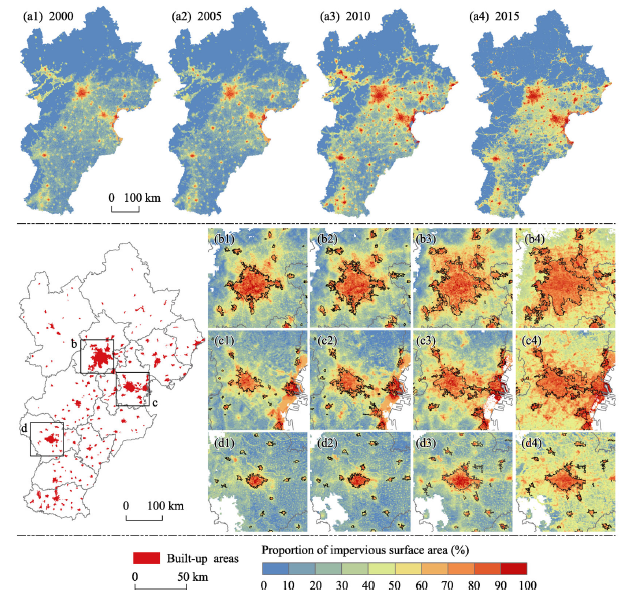
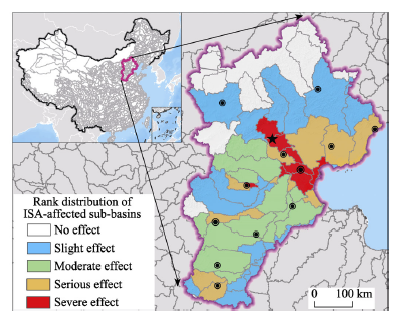
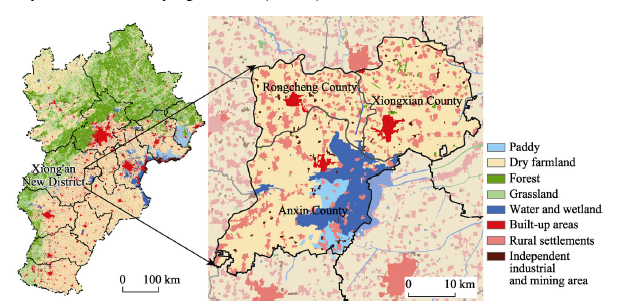
Development of Xiong'an New District (XND) is integral to the implementation of the Beijing-Tianjin-Hebei (BTH) Integration Initiative. It is intended to ease the non-capital functions of Beijing, optimize regional spatial patterns, and enhance ecosystem services and living environment in this urban agglomeration. Applying multi-stage remote sensing (RS) images, land use/cover change (LUCC) data, ecosystem services assessment data, and high-precision urban land-cover information, we reveal the regional land-cover characteristics of this new district as well as across the planned area of the entire BTH urban agglomeration. Corresponding ecological protection and management strategies are also proposed. Results indicated that built-up areas were rapidly expanding, leading to a continuous impervious surface at high density. Urban and impervious surface areas (ISAs) grew at rates 1.27 and 1.43 times higher than that in the 2000s, respectively, seriously affecting about 15% area of the sub-basins. Construction of XND mainly encompasses Xiongxian, Rongcheng, and Anxin counties, areas which predominantly comprise farmland, townships and rural settlements, water, and wetland ecosystems. The development and construction of XND should ease the non-capital functions of Beijing, as well as moderately control population and industrial growth. Thus, this development should be included within the national ‘sponge city’ construction pilot area in early planning stages, and reference should be made to international low-impact development modes in order to strengthen urban green infrastructural construction. Early stage planning based on the existing characteristics of the underlying surface should consider the construction of green ecological patches and ecological corridors between XND and the cities of Baoding, Beijing, and Tianjin. The proportion of impervious surfaces should not exceed 60%, while that of the core area should not exceed 70%. The development of XND needs to initiate the concept of ‘planning a city according to water resource amount’ and incorporate rainwater collection and recycling.

Cite this article

KUANG Wenhui , YANG Tianrong , YAN Fengqin . Examining urban land-cover characteristics and ecological regulation during the construction of Xiong’an New District, Hebei Province, China[J]. Journal of Geographical Sciences, 2018 , 28(1) : 109 -123 . DOI: 10.1007/s11442-018-1462-4

1 Introduction

It is well known that the processes of global warming and rapid urbanization are seriously affecting human well-being, urban settlements, and ecosystem services. Thus, as a result of major global research projects including the International Millennium Ecosystem Assessment, Urbanization and Global Environmental Change, and Future Earth, as well as the study of ‘global change and urban ecology’ and other key academic developments, upgrading urban ecosystem services and improving human well-being have become a focus for scholars around the world (Grimm et al., 2008; Pickett et al., 2014; Ouyang et al., 2016).
In concert with rapid global urbanization, Chinese cities have also expanded at an unprecedented rate, especially during the first decade of the 21st century; the present rate of urban expansion in China is about 2.16 times higher than that of the 1990s. The conversion of natural and semi-natural ecosystems to artificial ones as the result of urbanization can seriously affect ecosystem structures, processes (e.g., water and heat), and service functions (e.g., support, supply, regulation, and cultural services), leading to the development of urban heat island and the intensification of extreme heating events (Jones et al., 2015; Kuang et al., 2015a; Lelieveld et al., 2015), environmental pollution (Leichenko, 2011), and frequent disasters due to flooding (Jha et al., 2012). In order to improve environmental adaptability to mitigate the risk of natural disasters and realize ecological sustainable development, the concepts of Ecosystem-based approaches to Adaptability (EbA) (Jones et al., 2012) and ‘Resilience’ (Holling, 1973) have been applied in ecology. Gunderson and Holling (2002) proposed ‘panarchy’ and the ‘multi-scale nested adaptive cycle model’ as representative of urban ecological elasticity; these concepts can be applied to provide new scientific ideas and solutions to understand the underlying evolutionary mechanisms of urban ecosystems (Meerow et al., 2016).
Since the beginning of the 21st century, ‘urban agglomerations’ have become core to the concept of ‘new urbanization’ and economic development in China. However, the healthy and coordinated development of these areas is key to sustainable development, both nationally and globally (Lu, 2008; Guo et al., 2010; Gu, 2011). Subsequent to adoption of the ‘Beijing-Tianjin-Hebei Cooperation and Development Strategy’ at the meeting of the Political Bureau of the CPC Central Committee in April 2015, coordinated development of the Beijing-Tianjin-Hebei (BTH) urban agglomeration, the third largest urban agglomeration in China, became a priority at the national strategic level. Understanding how to efficiently and accurately extract surface coverage information from this urban agglomeration at different scales as well as conducting real-time dynamic monitoring to meet its application requirements is of great significance (Fang et al., 2016; Peng et al., 2016). The timely and accurate monitoring of urban surface features using remote sensing (RS) technology has also become a key topic in the study of urbanization and its eco-environmental effects. Monitoring is clearly of great significance to the scientific planning of towns, the rational distribution of industrial structures, and the improvement of urban system development strategies (Weng et al., 2009; Wu et al., 2011; Liu et al., 2012; Kuang et al., 2015b).
The CPC Central Committee and the State Council initiated the creation of Xiong’an New District (XND) on April 1st, 2017 and defined it as encompassing an initial development area of about 100 km2, a medium-term development area of about 200 km2, and a long-term control area of about 2000 km2. This new district has also been afforded national significance along the lines of the previously developed Shenzhen Special Economic Zone and Shanghai Pudong New District. The development of XND is a Millennium Plan, as well as a national event, recognized as a major historic strategic choice by the CPC Central Committee under the leadership of President Xi Jinping, and is of great strategic significance for the development of BTH and easing the non-capital functions of Beijing. At this critical moment, urgent planning and construction tasks necessitate an improved understanding of regional surface features within the proposed area of this new district to enable accurate estimations of future construction population and magnitude scale, as well as to propose land use, urban heat island, and other control measures to reveal future potential eco-environmental risks. Therefore, this study utilizes long-term data series of RS images, land use/cover change (LUCC), ecosystem service assessment, and high-precision urban land use information to synthetically analyze the ecosystem status of the counties of Xiongxian, Rongcheng, and Anxin (‘Xiong’an three counties’) in Hebei Province. We also proposed an ecological management and control strategy for this development and submitted ‘Suggestions on Strengthening Regional Ecological Control in Construction of Hebei Xiong’an New District by Chinese Academy of Sciences Experts’ to the CPC Central Committee on April 8th, 2017. Encompassing two aspects, the regional background of the BTH urban agglomeration and planning area coverage, this paper discusses the current urban agglomeration and impervious surface situation within the BTH area in the early 21st century in the context of the overall development situation of this area, specifically the planned XND. We also present a scientific forecast of the ecological risks caused by the construction of XND in this study. This work is therefore an important scientific reference for the coordinated development of BTH and the construction of XND.

2 Study area and data source

2.1 Study area

The BTH urban agglomeration is the third largest in China after the Yangtze River Delta and the Pearl River Delta. This urban agglomeration is also the center of national political, cultural, and international exchange as well as scientific innovation, and encompasses a total land area of 216,300 km2, including 13 cities with a permenant population of 111 million and GDP of 6667.45 billion yuan. Subsequent to the process of reform and opening up, both economy and society have developed rapidly in China, leading to imbalances in the development of urban systems and causing major impacts on regional eco-environments. At the end of April 2015 and 2017, the CPC Central Committee and the State Council enacted the ‘Beijing-Tianjin-Hebei Cooperation and Development Strategy’ and made the decision to build ‘Xiong’an New District’ in order to promote the major national strategy for BTH. The aims of these developments were to ease the non-capital core functions of Beijing, adjust and optimize the urban spatial structure of the region, and to promote coordinated development of the regional eco-environment and socio-economy.
The planned XND covers Xiong’an three counties as well as surrounding areas within the city of Baoding in Hebei Province. These areas together comprise an equilateral triangle along with the cities of Beijing and Tianjin, encompassing a distance of about 110 km. The total administrative area of Xiong’an three counties is about 1557 km2; the topography of this region is dominated by low altitude plains and depressions, while elevations range between 0 m and 44 m (average: 3.97 m). Almost 70% of our study area, however, falls within an elevation range between 0 m and 5 m, while 25% falls within a range between 5 m and 10 m. At the beginning of 2015, the total population of Xiong’an three counties was 1.13 million, of which the agricultural population comprised 64% of the total, or 0.722 million. The non-agricultural population was 0.41 million, or 36% of the total. The gross domestic product of Xiong’an three counties is 21.106 billion yuan, with primary, secondary, and tertiary industries accounting for 2.869 billion yuan, 13.375 billion yuan, and 4.862 billion yuan, respectively (Table 1).
Table 1 Area, population, and economic statistics of administrative division of Xiong’an three counties in 2015
Name Area (km2) Population (10,000) Economic status (billion yuan)
Total Agricultural Non-agricultural GDP Primary industry Secondary industry Tertiary industry
Rongcheng 314 27.31 13.73 13.58 5.775 0.971 3.415 1.389
Anxin 729 46.30 32.35 13.95 6.256 0.885 3.604 1.767
Xiongxian 514 39.41 26.12 13.29 9.075 1.013 6.356 1.706
Total 1557 113.02 72.20 40.82 21.106 2.869 13.375 4.862

Data extracted from the China County Statistical Yearbook, 2015.

2.2 Data sources

The main data sources used in this study include data on LUCC change, ecosystem macrostructure, digital terrain and geomorphology, and vegetation net primary productivity, as well as soil erosion RS data. We also downloaded Normalized Difference Vegetation Index (NDVI) data published by the National Aeronautics and Space Administration (https://ladsweb.modaps.eosdis.nasa.gov/archive/allData/6/MOD13Q1/), night light data released by the US National Oceanic and Atmospheric Administration (https://ngdc. noaa.gov/eog/download.html), high-resolution RS images from Google Earth, sub-basin boundary data from the United States Geological Survey and the Earth Resources Observation and Science Center (http://eros.usgs.gov/Find_Data/Products_and_Data_Available/gtopo30/hydro/asia), and data on Chinese administrative divisions from the National Geographic Information Center (http://ngcc.sbsm.gov.cn/), as well as other socio-economic and statistical information.

2.3 Extracting land cover information from the urban agglomeration

We extracted information about urban land use and ecosystem structure from the 2000, 2005, 2010, and 2015 National Land Use Datasets of China. These datasets are based on Landsat ETM/TM/OLI, HJ-1A, ZY-3 and other satellite images and rely on a unified standard artificial digital interpretation that comprises six classes (i.e., cropland, forest land, grassland, water, urban and rural construction land, and unused land) as well as 25 sub-classes. The average classification accuracy of these datasets is greater than 90%, meeting the requirements of 1:100,000 scale mapping (Liu et al., 2002, 2010; Kuang et al., 2016b).
We extracted urban impervious surface distributional information every five years between 2000 and 2015 from a number of data sources including the NDVI and DMSP/OLS images, using urban construction land as a spatial mask. This approach is based on the work of Lu et al. (2008) who proposed the use of the impervious surface index of residential area and Kuang et al. (2013) who later modified this by applying regression correction parameters. We extracted urban impervious surface distribution information based on this modified index (Kuang et al., 2013) by establishing an impervious surface regression model at the regional scale (Figure 1a). We then calculated correlation coefficients and root mean square (RMS) error using the impervious surface distribution in 2015 as an example, and evaluated the accuracy of this approach using Google Earth high-resolution images and random sampling (Kuang et al., 2011, 2013, 2016a). The results of this method yielded a correlation coefficient of 0.78 and a RMS error of 0.17, both of which satisfy the requirements of regional scale mapping.

2.4 Ecological RS parameter acquisition and methods to evaluate ecosystem services

The ecological RS parameter data used in this study includes vegetation cover, farmland productivity, and soil erosion. Vegetation cover was evaluated using the 250 m MODIS NDVI, while the NDVI maximum was obtained from preprocessed RS images. Farmland productivity data was expressed as net primary productivity (NPP) generated by the light energy utilization model satellite-based Vegetation Photosynthesis Model (VPM) based on MODIS RS and meteorological data (Xiao et al., 2004; Yan et al., 2007; Guo et al., 2015), while soil erosion data was obtained using the all-digital human-computer interaction analysis method founded on Landsat and other relevant auxiliary information, including digital elevation, soil type, vegetation coverage, and surface composition (Zhang et al., 2014).
Previous work has shown that there is a significant correlation between the area of impervious surface within a watershed and potential ecosystem health; thus, an increase in impervious surface area can seriously affect riverine ecosystems (Klein, 1979; Griffin et al., 1980; Schueler, 1987; Schueler, 1994; Elvidge et al., 2007; Peng et al., 2015). Because of this effect, we utilized the impact of urbanization on aquatic ecosystems as an indicator in this study; Bierwagen et al. (2010) found that when the proportion of impervious surface area (ISA) in a basin is less than 1%, it will have no effect on an aquatic ecosystem. In contrast, when this proportion is between 1% and 5%, there will be a slight effect on the aquatic ecosystem, but when the proportion is between 5% and 10%, there will be moderate impact. Serious impacts will be observed in aquatic ecosystems when the ISA of a basin is between 10% and 25%, and these effects will be severe when the proportion is larger than 25%. We therefore applied a sub-basin impervious surface index model in this study to calculate this proportion within the sub-basin, using these threshold levels to assess potential impacts on riverine ecosystems. We used the formulae described by Kuang et al. (2011, 2013, 2016a).

3 Results and analysis

3.1 Underlying characteristics of the BTH urban agglomeration

As discussed, we evaluated spatiotemporal changes in urban expansion within the BTH urban agglomeration between 2000 and 2015. We also quantified dynamic changes and the environmental impacts of urban ISA changes within the study area.
3.1.1 Dynamic characteristics of urban expansion
Dynamic changes in urban land use are illustrated in Figure 1, based on interpretation of LUCC data for the BTH urban agglomeration between 2000 and 2015. The data presented in Figure 1a reveal that the expansion of urbanization within the BTH urban agglomeration was significant at the start of the 21st century, especially in Beijing and Tianjin, and that built-up land within these cities exhibited a sprawling expansion mode. Results reveal a 4,500.44 km2 increase in the area of urban land since 2000, an average annual rate of increase of 300.03 km2/year, up to about 1.27 times the total area of 2000.
Results show significant differences in the expansion area of cities depending on stage. Expansion in urban land has mostly occurred within the six cities of Beijing, Tianjin, Shijiazhuang, Tangshan, Handan, and Langfang; taken together, these cities account for 71.76% of the total expansion area across the entire region. The cities of Beijing and Tianjin experienced the largest increases in urban expansion; the total expansion area of Beijing was 1004.78 km2, corresponding to a rate of 66.99 km2/year, while the total expansion area of Tianjin was 682.945 km2, corresponding to a rate of 45.53 km2/year. A large growth in urban land area has also been seen in Hebei Province and in the cities of Handan, Shijiazhuang, Tangshan, and Langfang, corresponding to a growth area of more than 300 km2 (Figure 1b).
Figure 1 Dynamic changes in the expansion of built-up areas within the BTH urban agglomeration between 2000 and 2015
3.1.2 Spatiotemporal patterns of urban impervious surface
There has been continuous growth in ISA within the BTH urban agglomeration (Figure 2a) since the beginning of the 21st century because of the expansion of urban construction land. Statistics show that the urban ISA of this region has increased by 3491.73 km2 over the last 15 years, 1.43 times the total area in 2000, and an average annual expansion rate of 232.78 km2/year. The largest contributions to this growth were in Beijing and Tianjin, where total areas increased by 691.38 km2 and 581.45 km2, respectively, encompassing more than 36.45% of the regional total growth area. Similarly, the total ISA increased by more than 300 km2 in Tangshan, Handan, and Shijiazhuang; the growth of these three accounted for 27.83% of the regional total growth area. Areas in Langfang, Baoding, and Xingtai also increased by relatively large amounts, while the area of Chengde increased the least, by just 91.01 km2. The city of Beijing had the largest ISA within the region by 2015, almost 1500 km2, followed by Tianjin, which experienced an increase of more than 1000 km2. Shijiazhuang, Tangshan, Handan, and Baoding all experienced increases of about 500 km2.
Figure 2 Maps showing the distribution of ISA within the BTH urban agglomeration and typical cities
Consistent with the overall trends in urban expansion, changes in ISA are characterized by sudden periods of rapid growth after slow growth before returning to their previous rates of change. Between 2000 and 2005, for example, the overall ISA of the region increased by 652.60 km2; within this, however, the cities of Beijing and Tianjin experienced substantial increases in ISAs, while other cities expanded more slowly. In contrast, between 2005 and 2010, the ISAs of all the cities within this region increased rapidly at a rate of expansion 3.05 times that of the earlier period. Between 2010 and 2015, this rate of growth suddenly reduced, however, to just 42.66% of the second period of analysis.
The data presented in Figures 2b-2d reveal that the area of built-up land within the three cities (Beijing, Tianjin, and Shijiazhuang) that comprise the BTH urban agglomeration has expanded significantly over the last 15 years and that the corresponding internal impervious surfaces have also gradually increased along with city expansion. Results show a more than 60% ISA proportion within each of the three cities, while growth of this type outside urban areas mainly includes increases in medium and higher density impervious surfaces radiating to surround urban, rural and suburban areas. These changes have resulted in the continuous layout and expansion of impervious surfaces within cities and surrounding areas.
We calculated the water-impermeable surface area proportion for each sub-basin in 2015 based on the boundaries of 92 regional sub-basins, and generated an ecological health impact rating for the water in each case. These results show that more than 60% of sub-basins within the study area were affected to different degrees by impervious surfaces; most of these sub-basins are located in the southeastern part of the study area and 78.15% of them were either affected seriously or severely, encompassing more than 57% of the total area (Figure 3 and Table 2). Seriously and severely affected sub-basin areas account for 21.12% of the total area, especially within Beijing and Tianjin, while the Bohai Bay region alongside sub-basins in Baoding, Shijiazhuang, and Handan have all been severely affected by impervious surfaces. In contrast, moderately affected sub-basins are predominantly and relatively continuously distributed in the southwestern part of the severely affected sub-basins, while northern, central, and southern parts of the sub-basins were least affected.
Figure 3 Map showing the ranked distribution of ISA affected sub-basins
Table 2 Statistics of ranked distribution of ISA affected sub-bains
Level Proportion
(%)
Sub-basin
Number Proportion (%) Area (km2) Area proportion (%)
No effect 0-1.0 36 39.13 47,049.57 21.85
Slight effect 1-5 16 17.39 71,577.27 33.25
Moderate effect 5-10 14 15.22 51,203.34 23.78
Serious effect 10-25 12 13.04 34,548.59 16.05
Severe effect 25-100 14 15.22 10,920.65 5.07
Total 92 100.00 215,299.4 100.00

3.2 Status of ecological system and spatial governing strategies of Xiong’an three counties

3.2.1 The ecological system structure of Xiong’an three counties
RS monitoring of ecological macrostructural changes between 2000 and 2015 revealed relatively large differences in farmland, townships, rural settlements, and water between Xiong’an three counties by the end of 2015 (Figure 4). Farmland ecosystems comprised the largest area (697.79 km2) within this region, encompassing 69% of the total area and mainly including dry farmland; just 51.56 km2 of paddy fields occur in Anxin County. The next most dominant LUCC types are urban and rural settlements (303.39 km2) which account for 19.49% of the region, especially townships and rural settlements, which comprise more than 80% of the urban and rural settlement area. Waters and wetland areas are ranked in third place, encompassing an area of 175.08 km2 and accounting for 11% of the region, most notably the freshwater Baiyangdian Lake (Table 3).
Figure 4 Maps showing the distribution of ecosystem types in Xiong’an three counties in 2015
Table 3 Area statistics of ecosystem classification of the Xiong’an three counties in 2015 (km2)
Name Cropland Forest Water and wetland Urban and rural settlements
Paddy Dry farmland Built-
up area
Township and rural settlements Independent industrial and mining land
Rongcheng 0.00 224.72 1.59 5.70 9.22 67.29 5.22
Anxin 51.56 391.61 1.02 163.90 7.56 99.79 10.55
Xiongxian 0.00 399.90 6.51 5.48 17.58 79.74 6.42
Total 51.56 1016.23 9.12 175.08 34.37 246.82 22.20
Data show that urban and rural settlement areas have expanded significantly over the last 15 years within the three counties studied in this paper. The total area of expansion was 113.89 km2, of which built-up areas, townships and rural settlements, as well as independent industrial and mining land use expanded by 15.11 km2, 82.99 km2, and 15.79 km2, respectively. At the same time, areas of cultivated land, water and wetlands within Xiong’an three counties decreased by 65.90 km2 and 96.80 km2, respectively.
The proportions of non-agricultural population (36%) as well as built-up areas (34.37 km2) within Xiong’an three counties in 2015 confirm that the level of urbanization within this region is relatively low. Data further demonstrate that the ISA of this region in 2015 was 110.45 km2, encompassing 36% of the urban and rural settlement area of Xiong’an three counties. The ISA contained within these three counties is 23.98 km2, corresponding to an average ratio of 70%. Thus, because the area of urban land is small, no obvious heat island is evident within this region.
3.2.2 Ecosystem services in Xiong’an three counties
Utilizing RS data products in combination with model retrieval results for the period between 2000 and 2015, we evaluated the key ecosystem factors within Xiong’an three counties, including vegetation cover status, farmland production capacity, and soil erosion. Results show that ecosystem services remain in good condition within this region, including vegetation coverage, farmland production capacity, and soil conservation. However, due to enhanced disturbance, the vegetation cover within Xiong’an three counties has been slightly degraded over the last 15 years, although the NDVI was stable at 0.79 by 2015 (Figure 5a). This ecosystem type encompasses 76.4% of the total farmland area, is high quality, and generates significant yields (Figure 5b). Indeed, because of enhanced vegetation coverage and the superiority of farmland ecosystems in this area, soil erosion has been effectively mitigated; this kind of erosion within this region is dominated by slight water and wind erosion, comprising the weakest level of Chinese soil erosion.
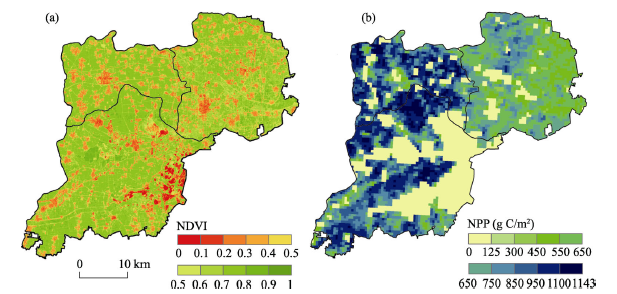
Figure 5 Maps showing the NDVI and NPP status of Xiong’an three counties in 2015

3.3 Potential impacts of future ecological construction

Comprehensive analysis and evaluation of potential eco-environmental impacts during different developmental stages has demonstrated that Xiong’an three counties is characterized by excellent ecological conditions as well as strong resources and environmental carrying capacities. This area is a low-lying plain as the average elevation of the three counties is just 3.97 m and 70% of the region has topography between 0 m and 5 m above sea level. In terms of ecosystem types, as about 80 km2 of cultivated land is present in addition to Baiyangdian Lake, this region lacks large ecological patches such as forests or ecological source protection in terms of a wider range of ecological sources as urban footprints. It is therefore clear that the future planned construction of XND will need to focus on accommodating the demographic and industrial targets of easing the non-capital fuctions of Beijing, in particular controlling population growth and industrial magnitude at moderate levels in order to create an ecological and healthy city with a population of five million or less. In light of the factors discussed above, potential eco-environmental impacts on the construction of XND as well as proposed control measures are presented in Table 4.
Table 4 Potential eco-environmental impacts on the construction of XND and proposed control measures
Expected impact and regulation index Initial stage Medium-term Long-term
Expected by 2020 Expected by 2025 Expected by 2030 Expected by 2050
Population size Between half a million and one million people Between one million and two million people Between two million and five million people Greater than five million people
Built-up area Between 60 km2 and 120 km2 Between 120 km2 and 240 km2 Between 240 km2 and 600 km2 Greater than 600 km2
Urban land use, industrial regulation, and control model Ease Beijing city non-capital functions via moderate control Strengthen the construction of the ecological zone in the fringe area, and strictly control continuous agglomerated sprawl growth
Impervious surface control in built-up areas Control the ratio of ISAs to less than 60% Control the ratio of ISAs to between 50% and 60%, and maintain the urban greening rate at a level higher than 40%
Land use Predominantly include cultivated land and township rural residential areas. Build an ecological protection zone between urban areas and Baiyangdian Lake Strengthen the control of green areas and an ecological corridor between the cities of Baoding, Beijing, and Tianjin to mitigate continuous development along the traffic axis
Urban heat island Although the space occupied by urban heat island will expand, this can be controlled via urban ecological structures to a variation of 1ºC The space occupied by urban heat island will continue to expand, but via scientific planning this can be limited to variation between 1ºC and 1.5ºC
Potential ecological impacts and proposed control strategies This region is low-lying and vulnerable to storm impacts. Construction, population, industry, and other urban agglomeration-related factors will reduce ecosystem water conservation and other service functions Expansion of impervious surfaces in urban areas, coupled with the low-lying terrain, will increase the risk of floods and other disasters. It will therefore be necessary to consider ecological protection and the development of a corridor mosaic as part of eco-city planning and design
Potential environmental impacts and proposed control strategies Low-lying flat, high-rise buildings will affect the diffusion capacity of the local atmosphere, leading to increases in haze and other pollution. In addition to being a source of pollution, impervious surfaces will enable other pollution sources and damage the freshwater quality of Baiyangdian Lake. It will be necessary to strictly develop systems to control industrial access as well as high standards to deal with waste The impervious surface proportion within the sub-basin will rise to between 15% and 25%, will significantly affect the health of the river basin ecosystem, and will have a serious impact on the water quality of Baiyangdian Lake. It will be necessary to draw an itinerary for urban green development, and guide construction according to these guidelines
The results of this study lead us to recommend that, during the early planning stage, XND should be included as part of the national ‘sponge city’ construction pilot so that it can benefit from the international success of this low impact development model as a way to strengthen green infrastructure during city construction. At the same time, various other forms of planning should be implemented to consider the area as a whole and to build green areas and ecological corridors between this new district and the regional cities (i.e., Baoding, Beijing, and Tianjin) in order to prevent continuous urban fringe development and impervious surfaces along traffic corridors. We recommend that, in addition to considering green rate indicators, the overall proportion of impervious surface should not exceed 60%, increasing to a maximum of 70% in the core area of this development.
International standards suggest that if the proportion of impervious surfaces within a city sub-basin exceeds 25%, there will be serious impacts on the surface water environment and ecosystem health, even potentially causing the destruction of the whole system. The development of XND is expected to lead to hundreds of square kilometers of artificial construction, triggering a very substantial increase in the area of impervious surfaces (i.e., buildings, roads, and squares). In concert with adverse topographic conditions, this will lead to increased surface water from rain and is likely to make flooding more frequent. This region is also likely to face a number of additional issues including the development of high-intensity urban heat island and weakened atmospheric diffusion. Considering the level of these surfaces in a number of typical cities across China and the United States, it is clear that when the impervious surface covered proportion within a city exceeds 70% of ground area there will be a concomitant exponential rise in urban heat island. Similarly, when the proportion of impervious surfaces within a city sub-basin exceeds 25%, indicators of river pollutants such as nitrogen and sulfur dioxide will increase significantly due to the effects of urban non-point source pollution (Kuang et al., 2011). It will therefore be necessary to prevent damage to the urban thermal environment as well as to mitigate adverse effects on the freshwater quality of Baiyangdian Lake that will result from large-scale continuous urban construction. It will also be important to comprehensively consider the effects of storm floods inside XND that might result from the presence of low-lying areas, poor wind diffusion caused by weak wind field intensity of prevailing wind, and the aggravation of urban heat island.
Finally, although XND includes Baiyangdian Lake, the largest expanse of freshwater on the North China Plain, this construction area is also located within the Daqinghezi watershed of the Haihe River Basin which generates total water resources of just only 246.21 million m3 (an average of 217 m3 per person). Data from the water sector shows that groundwater exploitation in Anxin, Xiongxian, and Rongcheng counties is currently mild, moderate, and seriously over-exploited, respectively, which translates to a marked lack of water and groundwater resources in Xiong’an three counties that support the development of XND. This new development therefore needs to be based on the concept of ‘planning city according to water resource amount’, taking full account of the carrying capacity status of water resources, as well as the ‘sponge city’ concept and the international ‘low impact development’ model. The construction of infrastructure, water supply and drainage within XND must therefore make full use of rainwater collection and recycling to improve the comprehensive utilization and ecological protection of these resources, including water ecology and environment.

4 Discussion and conclusions

This paper analyzes the natural and socio-economic development of the BTH urban agglomeration using the current development strategy as a basis. We conclude that the construction of XND is critical to organically mitigate the non-capital functions of Beijing, to promote regional socio-economic development, and to enhance the service functions of urban ecosystem. Based on the ‘multi-scale nested adaptive cycle’ and ‘Resilience’ theories proposed by Holling and Gunderson (2002), the dynamic evolution of urban ecosystems should include four stages of growth or exploitation, conservation or accumulation, collapse and release, and reorganization and renewal. According to these theories, the cities of Beijing, Tianjin, Shijiazhuang, and Baoding are all at different stages of development, while the current state of XND construction has also reached a level that is inevitable given the developmental evolution of urban agglomerations. Carpenter et al. (2001) also pointed out that a resilient urban system should include at least three characteristic attributes, i.e., an ability to absorb external disturbances yet remain in the same state, an ability to self-organize, and some degree of system learning and adaptive capacity. As one key goal of the national ‘Millennium Plan’, the development of XND has great significance to the re-organization and updated development of urban ecosystems, as well as to improvements in their self-organization and adaptability.
Since the beginning of the 21st century, the proportion of urban land and impervious surfaces within the BTH urban agglomeration has increased very rapidly. Data show that urban land area has increased by 4500.44 km2 since 2000, while the area of impervious surfaces has increased by 3491.73 km2. The internal impervious surface ratio within 15% of sub-basins is greater than 25%, leading to serious impacts on the health of aquatic ecosystems within watersheds. Thus, the nature of the overall underlying surface within the BTH urban agglomeration, especially impermeable areas, is a core issue that has led to ecological problems within the urban agglomeration. We would argue that insufficient attention has so far been paid to this problem. The XND construction site is located on a low-lying plain, 110 km from the cities of Beijing and Tianjin, and close to the freshwater Baiyangdian Lake. Although this location possesses certain resources and environmental advantages, considering topographic features, ecosystem types, urban rain, flood, and heat island regulations, as well as the necessity for clean urban air, construction must be characterized by the rational implementation of ecological controls and protection.
Utilizing geographical and ecological information obtained from high-resolution RS images and ecological models, this paper has reviewed the regional ecological characteristics, patterns, and service status of the construction of XND given the regional background of the BTH urban agglomeration and the area encompassed by this planned development. We also estimate the potential future ecological and environmental risks of this development and propose a series of ecological protection and control strategies for different developmental stages that we hope will be of significant value to the early planning and construction of XND.

The authors have declared that no competing interests exist.

[1]
Bierwagen B G, Theobald D T, Pyke C Ret al., 2010. National housing and impervious surface scenarios for integrated climate impact assessments.PNAS, 107(49): 20887-20892.

DOI

[2]
Carpenter S, Walker B, Anderies J M, et al.2001. From metaphor to measurement: Resilience of what to what?Ecosystems, 4(8): 765-781.

DOI

[3]
Chen J Q, Yan H M, Wang S Qet al., 2014. Estimation of gross primary productivity in Chinese terrestrial ecosystems by using VPM Model.Quaternary Sciences, 34(4): 732-742.Remote sensing model provides more real-time and more accurate simulation data for regional carbon flux observing.Accurate simulation needs sufficient validations of every ecosystem at the ecosystem scale by using flux observation data.More and more studies have shown that current Gross Primary Productivity(GPP) simulation still has great uncertainty,for example,MODIS GPP product(MOD17) doesn't take multiple cropping and C_4 plant as separate vegetation types,therefore,the simulation results of such ecological zones have large underestimation.VPM model has been developed based on MODIS data and flux observation data.After 10 years of effort,a series of studies on model calibration and validation has been carried out in 21 sites covering ten types of typical ecosystems throughout the world,including Haibei alpine shrub and alpine wetland,temperate semi-arid grasslands of Inner Mongolia,the Changbai Mountain conifer,winter wheat-maize rotation cropland of Yucheng flux station and Tongyu cropland(corn) station,which have shown good simulation capabilities and laid a scientific basis for the estimation of regional GPP.In this study,we build the VPM model for regional pattern evaluation of GPP in terrestrial ecosystems.Then we estimate the spatial pattern and temporal variation of GPP in China during 2006 ~ 2008 using MODIS data,rasterized temperature and photosynthetically active radiation(PAR) data with a resolution of 500 m at 8-day intervals as input data.The total annual GPP of China's terrestrial ecosystems is 5.OPg C/a during the period of2006~2008.Forests,grassland,cropland and shrub account for 34%,17%,37%,and 12%,respectively.These vegetation types can be arranged by GPP values in descending order as follows;evergreen broadleaf forest,deciduous broadleaf forest,mixed forest,triple-cropping cropland,double-cropping cropland,single-cropping cropland,evergreen needleleaf forest,shrub,deciduous needleleaf forest,grassland,alpine meadow and alpine grassland.The total annual GPP of China estimated in this study is close to the average of estimation results of other remote sensing models(5.40 Pg C/a).There are great discrepancies among estimation results of various ecosystems by different light use efficiency models.In this study,remote sensing data is used for the spatialization of the maximum light use efficiency in order to describe the spatial heterogeneity of light use efficiency within the same land cover type.In this study,the land cover data is extracted from most reliable land use and vegetation type data at present,and multiple cropping is input into the model as a separate vegetation type,thus the accuracy of input data ensures the reliability of estimation results of VPM model.

DOI

[4]
Elvidge C D, Tuttle B T, Sutton P Cet al., 2007. Global distribution and density of constructed impervious surfaces.Sensor, 7(9): 1962-1979.We present the first global inventory of the spatial distribution and density ofconstructed impervious surface area (ISA). Examples of ISA include roads, parking lots,buildings, driveways, sidewalks and other manmade surfaces. While high spatialresolution is required to observe these features, the new product reports the estimateddensity of ISA on a one-km2 grid based on two coarse resolution indicators of ISA 01040000“ thebrightness of satellite observed nighttime lights and population count. The model wascalibrated using 30-meter resolution ISA of the USA from the U.S. Geological Survey.Nominally the product is for the years 2000-01 since both the nighttime lights andreference data are from those two years. We found that 1.05% of the United States landarea is impervious surface (83,337 km2) and 0.43 % of the world0104000064s land surface (579,703km2) is constructed impervious surface. China has more ISA than any other country(87,182 km2), but has only 67 m2 of ISA per person, compared to 297 m2 per person in theUSA. The distribution of ISA in the world0104000064s primary drainage basins indicates that watersheds damaged by ISA are primarily concentrated in the USA, Europe, Japan, China and India. The authors believe the next step for improving the product is to include reference ISA data from many more areas around the world.

DOI PMID

[5]
Fang Chuanglin, 2014. Progress and the future direction of research into urban agglomeration in China.Acta Geographica Sinica, 69(8): 1130-1144. (in Chinese)Urban agglomeration has been the inevitable result of China's rapid industrialization and urbanization over the last 30 years. Since the early 2000 s,urban agglomeration has become the new regional unit participating in international competition and the division of labor. China has declared urban agglomeration the main spatial component of new types of urbanization over the next decade as clarified at the first Central Urbanization Working Conference and in the National New-type Urbanization Plan(2014?2020). However,research on urban agglomeration remains weak and needs to be strengthened. From 1934 to2013,only 19 papers published in Acta Geographica Sinica contained the theme of urban agglomeration(0.55% of the total number of articles published) and the first paper on urban agglomeration appeared less than 10 years ago. Despite a small number of divergent studies,this work has contributed to and guided the formation of the overall pattern of urban agglomeration in China. For example,spatial analyses have promoted the formation of the fundamental framework of China' s urban agglomeration spatial structure and guided the National New-type Urbanization Plan; spatial identification standards and technical processes have played an important role in identifying the scope and extent of urban agglomeration;serial studies have facilitated pragmatic research; and problems with the formation and development of urban agglomeration have provided a warning for future choices and Chinese development. Future research into urban agglomeration in China should(1) review and examine new problems in China's urban agglomeration options and cultivation;(2) critically consider urban agglomeration when promoting the formation of the 5+9+6 spatial pattern;(3)rely on urban agglomeration to construct new urbanization patterns such as 'stringing the agglomerations with the axis,supporting the axis with the agglomerations'; and(4) deepen national awareness about resources,environment effects and environmental carrying capacity in high density urban agglomerations,management and government coordination innovation,the construction of public finance and fiscal reserve mechanisms,the technical regulation of urban agglomeration planning,and standards for identifying the scope and extent of urban agglomeration.

DOI

[6]
Fang Chuanglin, Zhou Chenghu, Gu Chaolinet al., 2016. Theoretical analysis of interactive coupled effects between urbanization and eco-environment in mega-urban agglomerations.Acta Geographica Sinica, 71(4): 531-550. (in Chinese)Mega- urban agglomerations in China play a vital role in both national economic development strategies and national new- type urbanization, and undertake important historical responsibility with the world economic center transfer to China. However, they suffer a series of increasingly serious eco- environmental problems in the process of development. Thus,studies on the interactive coupled effects between urbanization and eco- environment in megaurban agglomerations are the frontier areas and high priority tasks in the earth system science for the future ten years. This paper analyses the basic theory frame of the interactive coupled effects between urbanization and eco- environment in mega- urban agglomerations systematically. In theoretical aspect, based on the nonlinear relationship and coupling characteristics of the natural and human elements in mega- urban agglomerations system, we could estimate the interactive coercing intensity, nearcoupling and telecoupling mechanism of the inside and outside mega- urban agglomerations system after scientific identification of the key elements, and then form the basic interactive coupling theory. Moreover, we could build a spatio- temporal coupling dynamic model, which is integrated with multi- elements, multiscales, multi-scenarios, multi-modules and multi-agents. The model will be used to develop the intelligent decision support system for urban agglomeration sustainable development. In methodology aspect, the mega- urban agglomeration is regarded as an open complex giant system. We should establish the standardized shared database for exploring the interactive coupled effects between urbanization and eco- environment. Then using new technology for analyzing big data and the integration methods incorporating of multi- elements, multi- scales,multi- targets, multi- agents, multi- scenarios and multi- modules, we can build a methodology framework to analyze the complex interaction coupling between urbanization and ecoenvironment. The technical route is to analyze spatiotemporal evolution characteristics, identify the key elements, interpret coupling relationship, reveal the mechanism of coercing effect, find the general rules, filtrate the control variables, solve the critical thresholds, conduct regulation experiments, simulate different scenarios, propose an optimized schemes, and achieve national goals. Furthermore, we could put forward the overall optimization scheme. In general, this research could provide theoretical guidance and method support for the transformation and sustainable development in mega-urban agglomerations.

DOI

[7]
Griffin D M, Grizzard T J, Randall C Wet al., 1980. Analysis of non-point pollution export from small catchments.Journal (Water Pollution Control Federation), 52(4): 780-790.A year-long study was conducted in the Occoquan and Four-Mile Run basins of northern Virginia to determine the effect of land use on the quantity and quality of runoff from the receiving area of small catchments. Twenty-one sites were selected ranging from undisturbed forest land to highly urbanized sites. All runoff events at all operable stations were monitored for flow and pollutant load. The results were analyzed using nonparametric statistical methods. Analysis showed that pollutant yield from residential/urban sites increased monotonically as the percentage imperviousness of the catchment receiving area increased for most pollutants. The flushing characteristics of runoff events from different sites were also investigated. It was found that insoluble pollutants exhibited a first flush response while soluble pollutants did not.

DOI

[8]
Grimm N B, Faeth S H, Golubiewski N Eet al., 2008. Global change and the ecology of cities.Science, 319(5864): 756-760.Abstract Urban areas are hot spots that drive environmental change at multiple scales. Material demands of production and human consumption alter land use and cover, biodiversity, and hydrosystems locally to regionally, and urban waste discharge affects local to global biogeochemical cycles and climate. For urbanites, however, global environmental changes are swamped by dramatic changes in the local environment. Urban ecology integrates natural and social sciences to study these radically altered local environments and their regional and global effects. Cities themselves present both the problems and solutions to sustainability challenges of an increasingly urbanized world.

DOI PMID

[9]
Gu Chaolin, 2011. Study on urban agglomeration: Progress and prospects. Geographical Research, 16(4): 82-88. (in Chinese)Urban agglomeration is a complex with the central city as the core surrounded by two or more cities.It is the objective reflection of the economic growth and social development as well as industrial layout in a region.It has also become a main form of urbanization in developed countries.In fact,the "urban agglomeration" concept in China is the characteristics of a noun,no equivalence in foreign countries.In Western literature,the "urban agglomeration" means "urban cluster",that is,a big city and its surrounding satellite towns in remote sensing image formed the connected irregularities each other,and the spatial range includes "urbanization area(UA)" and "metropolitan area(MA)".Sometimes,some of metropolises connected each other are also called as urban agglomeration.United Nations gave a definition of urban agglomeration as follows: "Comprises a city or town proper and also the suburban fringe or thickly settled territory lying outside,but adjacent to,its boundaries.A single large urban agglomeration may comprise several cities or towns and their suburban fringes." Therefore,urban agglomeration in the Western concept includes the cities,towns and urban-region outlying areas."Urban agglomeration" in China refers to geographical concepts of a group of major cities which are similar and interactions among administrative,transportation,economic,and social fields.In the 21st century,thanks to China's entry into the World Trade Organization,a national coastal urban agglomeration has become the main region for the national trade economy,export and the "world manufacturing bases".Urban agglomeration as an important urban spatial pattern was a unique choice to promote the process of urbanization in China.This article reviewed some progress in studies of urban agglomeration,such as the concept of urban agglomeration,overseas research of urban agglomeration,early researches of Chinese urban agglomeration and studies on Chinese urban agglomeration as a national strategy.This paper has prospects for the studies of Chinese urban agglomeration in the future.It argued that there is more complex mechanism for the rise and development of the Chinese urban agglomeration than those in Western developed countries,so that the relevant researches need innovations.

DOI

[10]
Guo Rongchao, Miao Changhong, Xia Baolinet al., 2010. Research on the model of optimization and reorganization of eco-spatial structure in urban agglomeration region and its application: A case study of the urban agglomeration in Central Plains Region.Progress in Geography, 29(3): 363-369. (in Chinese)

[11]
Guo W, Lu D S, Wu Y Let al., 2015. Mapping impervious surface distribution with integration of SNNP VIIRS-DNB and MODIS NDVI Data.Remote Sensing, 7(9): 12459-12477.Data from the U.S. Defense Meteorological Satellite Program’s Operational Line-scan System are often used to map impervious surface area (ISA) distribution at regional and global scales, but its coarse spatial resolution and data saturation produce high inaccuracy in ISA estimation. Suomi National Polar-orbiting Partnership (SNPP) Visible Infrared Imaging Radiometer Suite’s Day/Night Band (VIIRS-DNB) with its high spatial resolution and dynamic data range may provide new insights but has not been fully examined in mapping ISA distribution. In this paper, a new variable—Large-scale Impervious Surface Index (LISI)—is proposed to integrate VIIRS-DNB and Moderate Resolution Imaging Spectroradiometer (MODIS) normalized difference vegetation index (NDVI) data for mapping ISA distribution. A regression model was established, in which LISI was used as an independent variable and the reference ISA from Landsat images was a dependent variable. The results indicated a better estimation performance using LISI than using a single VIIRS-DNB or MODIS NDVI variable. The LISI-based approach provides accurate spatial patterns from high values in core urban areas to low values in rural areas, with an overall root mean squared error of 0.11. The LISI-based approach is recommended for fractional ISA estimation in a large area.

DOI

[12]
Holling C S, 1973. Resilience and stability of ecological systems.Annual Review of Ecology and Systematics, 4(1): 1-23.ABSTRACT THIS REVIEW EXPLORES BOTH ECOLOGICAL THEORY AND THE BEHAVIOR OF NATURAL SYSTEMS TO SEE IF DIFFERENT PERSPECTIVES OF THEIR BEHAVIOR CAN YIELD DIFFERENT INSIGHTS THAT ARE USEFUL FOR BOTH THEORY AND PRACTICE. THE RESILIENCE AND STABILITY VIEWPOINTS OF THE BEHAVIOR OF ECOLOGICAL SYSTEMS CAN YIELD VERY DIFFERENT APPROACHES TO THE MANAGEMENT OF RESOURCES. THE STABILITY VIEW EMPHASIZES THE EQUILIBRIUM, THE MAINTENANCE OF A PREDICTABLE WORLD, AND THE HARVESTING OF NATURE'S EXCESS PRODUCTION WITH AS LITTLE FLUCTUATION AS POSSIBLE. THE RESILIENCE VIEW EMPHASIZES DOMAINS OF ATTRACTION AND THE NEED FOR PERSISTENCE. BUT EXTINCTION IS NOT PURELY A RANDOM EVENT: IT RESULTS FROM THE INTERACTION OF RANDOM EVENTS WITH THOSE DETERMINISTIC FORCES THAT DEFINE THE SHAPE, SIZE AND CHARACTERISTICS OF THE DOMAIN OF ATTRACTION. THE VERY APPROACH, THEREFORE, THAT ASSURES A STABLE MAXIMUM SUSTAINED YIELD OF A RENEWABLE RESOURCE, MIGHT SO CHANGE THESE CONDITIONS THAT THE RESILIENCE IS LOST OR IS REDUCED SO THAT A CHANCE AND RARE EVENT THAT PREVIOUSLY COULD BE ABSORBED CAN TRIGGER A SUDDEN DRAMATIC CHANGE AND LOSS OF STRUCTURAL INTEGRITY OF THE SYSTEM. A MANAGEMENT APPROACH BASED ON RESILIENCE, ON THE OTHER HAND, WOULD EMPHASIZE THE NEED TO KEEP OPTIONS OPEN, THE NEED TO VIEW EVENTS IN A REGIONAL RATHER THAN A LOCAL CONTEXT, AND THE NEED TO EMPHASIZE HETEROGENEITY. THE RESILIENCE FRAMEWORK DOES NOT REQUIRE A PRECISE CAPACITY TO PREDICT THE FUTURE BUT ONLY A QUALITATIVE CAPACITY TO DEVISE SYSTEMS THAT CAN ABSORB AND ACCOMMODATE FUTURE EVENTS IN WHATEVER UNEXPECTED FORM THEY MAY TAKE.

DOI

[13]
Holling C S, Gunderson L H, 2002.Panarchy:Understanding Transformations in Systems of Humans and Nature. Resilience and Adaptive Cycles. Washington: Island Press, 25-62.

[14]
Jha A, Lamond J, Proverbs Det al., 2012. Cities and flooding: A guide to integrated urban flood risk management for the 21st century.General Information, 52(5): 885-887.The guide serves as a primer for decision and policy makers, technical specialists, central, regional and local government officials, and concerned stakeholders in the community sector, civil society and non-governmental organizations, and the private sector. The Guide embodies the state-of-the art on integrated urban flood risk management. The Guide starts with a summary for policy makers which outlines and describes the key areas which policy makers need to be knowledgeable about to create policy directions and an integrated strategic approach for urban flood risk management. The core of the Guide consists of seven chapters, organized as: understanding flood hazard; understanding flood impacts; integrated flood risk management (structural measures and non-structural measures); evaluating alternative flood risk management options: tools for decision makers; implementing integrated flood risk management; and conclusion. Each chapter starts with a full contents list and a summary of the chapter for quick reference.

DOI

[15]
Jones B, O’Neill B C, McDaniel Let al., 2015. Future population exposure to US heat extremes.Nature Climate Change, 5(7): 652-655.Extreme heat events are likely to become more frequent in the coming decades owing to climate change. Exposure to extreme heat depends not only on changing climate, but also on changes in the size and spatial distribution of the human population. Here we provide a new projection of population exposure to extreme heat for the continental United States that takes into account both of these factors. Using projections from a suite of regional climate models driven by global climate models and forced with the SRES A2 scenario and a spatially explicit population projection consistent with the socioeconomic assumptions of that scenario, we project changes in exposure into the latter half of the twenty-first century. We find that US population exposure to extreme heat increases four- to sixfold over observed levels in the late twentieth century, and that changes in population are as important as changes in climate in driving this outcome. Aggregate population growth, as well as redistribution of the population across larger US regions, strongly affects outcomes whereas smaller-scale spatial patterns of population change have smaller effects. The relative importance of population and climate as drivers of exposure varies across regions of the country.

DOI

[16]
Jones H P, Hole D G, Zavaleta E S, 2012. Harnessing nature to help people adapt to climate change.Nature Climate Change, 2(7): 504-509.Adapting to climate change is among the biggest challenges humanity faces in the next century. An overwhelming focus of adaptation strategies to reduce climate change-related hazards has been on hard-engineering structures such as sea walls, irrigation infrastructure and dams. Closer attention to a broader spectrum of adaptation options is urgently needed. In particular, ecosystem-based adaptation approaches provide flexible, cost-effective and broadly applicable alternatives for buffering the impacts of climate change, while overcoming many drawbacks of hard infrastructure. As such, they are a critical tool at adaptation planners' disposal for tackling the threats that climate change poses to peoples' lives and livelihoods.

DOI

[17]
Kuang W H, Chen L J, Liu J Yet al., 2016a. Remote sensing-based artificial surface cover classification in Asia and spatial pattern analysis.Science China Earth Sciences, 59(9): 1720-1737.

DOI

[18]
Kuang W H, Chi W F, Lu D Set al., 2014. A comparative analysis of megacity expansions in China and the U.S.: Patterns, rates and driving forces.Landscape and Urban Planning, 132: 121-135.中国科学院机构知识库(CAS IR GRID)以发展机构知识能力和知识管理能力为目标,快速实现对本机构知识资产的收集、长期保存、合理传播利用,积极建设对知识内容进行捕获、转化、传播、利用和审计的能力,逐步建设包括知识内容分析、关系分析和能力审计在内的知识服务能力,开展综合知识管理。

DOI

[19]
Kuang W H, Dou Y Y, Zhang Cet al., 2015a. Quantifying the heat flux regulation of metropolitan land use/land cover components by coupling remote sensing modeling with in situ measurement.Journal of Geophysical Research: Atmospheres, 120(1): 113-130.Abstract <p>Quantifying the effects of urban land use/land cover with regard to surface radiation and heat flux regulation is important to ecological planning and heat stress mitigation. To retrieve the spatial pattern of heat fluxes in the Beijing metropolitan area, China, a remote sensing-based energy balance model was calibrated with synchronously measured energy fluxes including net radiation, latent heat flux (LE), and sensible heat flux ( H ). Our model calibration approach avoided the uncertainties due to subjective judgments in previous empirical parameterization methods. The land surface temperature (LST), H , and Bowen ratio of Beijing were found to increase along the outskirt-suburban-urban gradient, with strong spatial variation. LST and H were negatively correlated with vegetation fraction cover (VFC). For example, the modern high-rise residential areas with relatively higher VFC had lower H and than the traditional low-rise residential areas. Our findings that indicate thermal dissipation through vegetation transpiration might play an important role in urban heat regulation. Notably, the thermal dissipating strength of vegetation (calculated as LE/VFC) declined exponentially with increased VFC. For the purpose of heat stress regulation, we recommend upgrading the traditional low-rise residential areas to modern high-rise residential areas and focusing urban greenery projects in areas whose VFC

DOI

[20]
Kuang Wenhui, Chi Wenfeng, Lu Dengsheng et al., 2015b. Remote Sensing Analysis and Ecological Control of Urban Surface Thermal Environment. Beijing: Science Press, 109. (in Chinese)

[21]
Kuang W H, Liu J Y, Dong J Wet al., 2016b. The rapid and massive urban and industrial land expansions in China between 1990 and 2010: A CLUD-based analysis of their trajectories, patterns, and drivers.Landscape and Urban Planning, 145: 21-33.The past two decades saw rapid and massive urbanization and industrialization in China. Despite much research has been reportedly done at local and regional scales, little has been reported on the trajectories, patterns, and drivers of these two intertwining processes at the national level. This is mainly due to the fact that until recently, high resolution spatial data of land use and land cover change were not available at national level. The research reported in this paper aimed to fill this knowledge gap. Employing the China Land Use/Cover Dataset (CLUD), a national land use/cover change database our research team developed over the past decade, we analyzed the two intertwining processes at a 5 year interval from 1990 to 2010 to identify their trajectories, spatiotemporal patterns, and driving forces. Among out key findings are that (1) the nation's urban and industrial land areas increased from 4.8502×0210 4 02km 2 in 1990 to 9.0802×0210 4 02km 2 in 2010; (2) compared to those in the 1990s, the expansion rates of urban land and industrial land in the 2000s were respectively 2.15 and 5.79 times higher; (3) the expansion rates varied significantly across regions, revealing a distinctive spatial pattern with coastal regions being the fastest and the northeastern the slowest; (4) national development strategies and regional land-use policies had prominent impacts on land expansions; while (5) socioeconomic factors along with local and regional land-use policies explained the regional variations.

DOI

[22]
Kuang Wenhui, Liu Jiyuan, Lu Dengsheng, 2011. Pattern of impervious surface change and its effect on water environment in the Beijing-Tianjin-Tangshan Metropolitan Area.Acta Geographica Sinica, 66(11): 1486-1496. (in Chinese)The impervious surface area(ISA)at the regional scale is one of important environmental factors for examining the interaction and mechanism of Land Use/Cover Change(LUCC)-ecosystem processes-regional climate change under the interactions of urbanization and global environment change.The timely and accurate extraction of ISA from remotely sensed data at the regional scale is becoming a bottle-neck issue.This study improved the MODIS NDVI and DMSP-OLS based ISA extraction method by incorporating LULC information of China.ISA datasets in Beijing-Tianjin-Tangshan Metropolitan Area (BTTMA)in 2000 and 2008 at a spatial resolution of 250 m were developed,their spatial-temporal changes were analyzed,and their impacts on water quality were evaluated. The results indicated that ISA in BTTMA has rapidly increased along urban fringe and urban transportation corridors and coastal belt both in intensity and extents from 2000 to 2008.The growth rates of ISA in Tianjin and three cities(Tanshan,Langfang,and Qinhuangdao)in Hebei Province were greater than that in Beijing.The ISA increase has great impacts on water quality;particularly,the water pollution in the Haihe River has deteriorated due to the increase and intensification of impervious surface areas.

DOI

[23]
Kuang W H, Liu J Y, Zhang Z Xet al., 2013. Spatiotemporal dynamics of impervious surface areas across China during the early 21st century.Chinese Science Bulletin, 58(14): 1691-1701.中国在过去的十年经历了崭新的都市化和工业化。在这研究,我们基于在 2000 和 2008 之间的陆地使用 / 盖住变化和 ISA 数据集检验了构造陆地和不可渗透的表面区域(ISA ) 的动力学,它被国家资源和环境遥感信息站台提供。结果显示构造区域和 ISA 首先由于国家宏发展策略和快成长的经济的实现在这个时期由 3468.30 和 2212.24 km2/a 增加了。在 2008, ISA 在中国说明了 0.86% 全部的陆地区域。城市的陆地区域在 2000 和 2008 之间增加了 43.46% 。在这个时期的 1788.22 km2/a 的年度生长率在 1990 年代是乘那的 2.18。特别地,城市的 ISA 与 1348.85 km2/a 的年度生长率在 2000 和 2008 之间增加了 53.30% 。在 8 年期间,在中国的 ISA 很快增加了,特别在 Beijing-Tianjin-Tangshan 大城市的区域,珀尔河三角洲,长江三角洲,和西方的中国区域。增加的 ISA 可以潜在地影响水在主要的盆的环境质量。特别地,有 ISA 的 subbasins 的数字比 10% 大更加增加了,它在 Haihe 河,长江和珀尔里主要是分布式的河盆。在 2008, 14.42% 盆区域被增加的 ISA 影响。

DOI

[24]
Kuang W H, Yang T R, Liu A Let al., 2017. An ecocity model for regulating urban land cover structure and thermal environment: Taking Beijing as an example.Science China Earth Sciences, 60(6): 1098-1109.

DOI

[25]
Leichenko R., 2011 Climate change and urban resilience.Current Opinion in Environmental Sustainability, 3(3): 164-168.The notion of resilience is gaining increasing prominence across a diverse set of literatures on cities and climate change. Although there is some disagreement among these different literatures about how to define and measure resilience, there is broad consensus that: (1) cities must become resilient to a wider range of shocks and stresses in order to be prepared for climate change; and (2) efforts to foster climate change resilience must be bundled with efforts to promote urban development and sustainability. Emerging issues for future study highlight some of the challenges associated with practical application of resilience approaches. These include responding to equity concerns associated with uneven patterns of resilience both within and across cities, assessing the costs of implementing resilience strategies, and identifying options for harnessing the innovation potential in cities as a means to foster resilience and sustainability.

DOI

[26]
Lelieveld J, Evans J S, Fnais Met al., 2015. The contribution of outdoor air pollution sources to premature mortality on a global scale.Nature, 525(7569): 367-371.Abstract Assessment of the global burden of disease is based on epidemiological cohort studies that connect premature mortality to a wide range of causes, including the long-term health impacts of ozone and fine particulate matter with a diameter smaller than 2.5 micrometres (PM2.5). It has proved difficult to quantify premature mortality related to air pollution, notably in regions where air quality is not monitored, and also because the toxicity of particles from various sources may vary. Here we use a global atmospheric chemistry model to investigate the link between premature mortality and seven emission source categories in urban and rural environments. In accord with the global burden of disease for 2010 (ref. 5), we calculate that outdoor air pollution, mostly by PM2.5, leads to 3.3 (95 per cent confidence interval 1.61-4.81) million premature deaths per year worldwide, predominantly in Asia. We primarily assume that all particles are equally toxic, but also include a sensitivity study that accounts for differential toxicity. We find that emissions from residential energy use such as heating and cooking, prevalent in India and China, have the largest impact on premature mortality globally, being even more dominant if carbonaceous particles are assumed to be most toxic. Whereas in much of the USA and in a few other countries emissions from traffic and power generation are important, in eastern USA, Europe, Russia and East Asia agricultural emissions make the largest relative contribution to PM2.5, with the estimate of overall health impact depending on assumptions regarding particle toxicity. Model projections based on a business-as-usual emission scenario indicate that the contribution of outdoor air pollution to premature mortality could double by 2050.

DOI PMID

[27]
Liu J Y, Liu M L, Zhuang D Fet al., 2002. Study on spatial pattern of land-use change in China during 1995-2000.Science in China: Series D, 32(12): 1031-1040.

[28]
Liu J Y, Zhang Z X, Xu X Let al., 2010. Spatial patterns and driving forces of land use change in China during the early 21st century.Journal of Geographical Sciences, 20(4): 483-494.

DOI

[29]
Liu Zhenhuan, Wang Yanglin, Peng Jian, 2012. Quantifying spatiotemporal patterns dynamics of impervious surface in Shenzhen.Geographical Research, 31(8): 1535-1545. (in Chinese)Rapid urbanization has changed urban land cover characteristics.Impervious surface has been the main land cover categories in urban landscape.How to quantify the spatial pattern of impervious surface and its temporal change are necessary for us to understand the dynamics of processes and patterns of urban landscape and their relationship between impervious surface and other heterogeneous landscapes.Remote sensing technology has been widely applied in urban impervious surface monitoring and change detection,but the spatial pattern and temporal change of impervious surface is rarely concerned.Taking Shenzhen as a case study area,we quatify the spatiotemporal patterns dynamics of impervious surface from 1990 to 2005.In order to analyze the spatial temporal change of impervious surface,we used an index of impervious surface area to show the heterogonous of impervious surface by linear spectral mixture method,which can be divided into six cover degrees.We use the matrix change method to explain the changes among four time periods and 3 stages and landscape pattern metrics to indicate the pattern change at three different levels.Results show that there were three changing types in the 15 years,namely,high and full density impervious surface area(HDISA,FDISA respectively)-continued increasing,and medium density(MDISA) and low density(LDISA)-irst increased and then decreased,while natural surface(NOISA) and very low density(VLISA) are contrary to MDISA and LDISA.However,the pattern of impervious surface indicates that cover degrees had a high landscape diversity and the value changed from low to high then decreased and reached a new high level.The landscape aggregation was very low overall in the four time periods,but had a significant fluctuation in classes level.The patches shape shows that natural surface had a high dominant position in 1990,but after that changed to medium density impervious surface and high density overtook the second position after 2005.Our research can provide a basis for the orderly development for planning urban impervious surface extension and aggregation;however,we also believe that mitigating the expansion of impervious surface is benefit to the improvement of the urban ecological and environmental quality.

DOI

[30]
Lu Dadao, 2008. The Regional Developing strategy, tendency and the development of Jing-Jin-Ji.Social Science of Beijing, (6): 4-7. (in Chinese)According to the analysis of the basic development tendency and the connotation of healthy development of regions,this article proposes that the primary reasons of the gap existing in various areas' economic development level and development strength.It argues that besides the position,the natural resource and the historical foundation,in recent years,the economic globalization,the informationization development as well as the form of metropolitan economic zone are the main factors that cause the disparity expansion of the regional developments.It takes a long period of time for the unbalancedly developed region to become a balanced one.The paper also argues that the metropolitan economic zone typified by Beijing and Tianjin is coming into being.

[31]
Lu D S, Tian H Q, Zhou G Met al., 2008. Regional mapping of human settlements in southeastern China with multi-sensor remotely sensed data.Remote Sensing of Environment, 112(9): 3668-3679.Mapping human settlements from remotely sensed data at regional and global scales has attracted increasingly attention but remains a challenge. The thresholding technique is a common approach for settlement mapping based on the DMSP-OLS data. However, this approach often omits the areas with small proportional settlements such as towns and villages and overestimates urban extents, resulting in information loss of spatial patterns. This paper explored an integrated approach based on a combined use of multiple remotely sensed data to map settlements in southeastern China. Human settlements for selected sites were mapped from Landsat ETM+ images with a hybrid approach and they were used as reference data. The DMSP-OLS and Terra MODIS NDVI data were combined to develop a settlement index image. This index image was used to map a pixel-based settlement image with expert rules. A regression model was established to estimate fractional settlements at the regional scale, which the DMSP-OLS and MODIS NDVI data were used as independent variables and the settlement data derived from ETM+ images were used as a dependent variable. This research indicated that a combination of DMSP-OLS and NDVI variables provided a better estimation performance than single DMSP-OLS or NDVI variable, and the integrated approach for settlement mapping at the regional scale was promising. Compared to the results from the traditional thresholding technique, the estimated fractional settlement image in this paper greatly improved the spatial patterns of settlement distribution and accuracy of settlement areas. This paper provided a rapid and accurate approach to estimate fractional settlements from coarse spatial resolution images at the regional scale by combining a limited number of medium spatial resolution images. This research is especially valuable for timely updating settlement databases at regional and global scales with limited time, labor, and cost.

DOI

[32]
Ma T, Zhou C H, Pei Tet al., 2014. Responses of Suomi-NPP VIIRS-derived nighttime lights to socioeconomic activity in China’s cities.Remote Sensing Letters, 5(2): 165-174.中国科学院机构知识库(CAS IR GRID)以发展机构知识能力和知识管理能力为目标,快速实现对本机构知识资产的收集、长期保存、合理传播利用,积极建设对知识内容进行捕获、转化、传播、利用和审计的能力,逐步建设包括知识内容分析、关系分析和能力审计在内的知识服务能力,开展综合知识管理。

DOI

[33]
Meerow S, Newell J P, Stults M, 2016. Defining urban resilience: A review.Landscape and Urban Planning, 147: 38-49.Fostering resilience in the face of environmental, socioeconomic, and political uncertainty and risk has captured the attention of academics and decision makers across disciplines, sectors, and scales. Resilience has become an important goal for cities, particularly in the face of climate change. Urban areas house the majority of the world's population, and, in addition to functioning as nodes of resource consumption and as sites for innovation, have become laboratories for resilience, both in theory and in practice. This paper reviews the scholarly literature on urban resilience and concludes that the term has not been well defined. Existing definitions are inconsistent and underdeveloped with respect to incorporation of crucial concepts found in both resilience theory and urban theory. Based on this literature review, and aided by bibliometric analysis, the paper identifies six conceptual tensions fundamental to urban resilience: (1) definition of -rban-; (2) understanding of system equilibrium; (3) positive vs. neutral (or negative) conceptualizations of resilience; (4) mechanisms for system change; (5) adaptation versus general adaptability; and (6) timescale of action. To advance this burgeoning field, more conceptual clarity is needed. This paper, therefore, proposes a new definition of urban resilience. This definition takes explicit positions on these tensions, but remains inclusive and flexible enough to enable uptake by, and collaboration among, varying disciplines. The paper concludes with a discussion of how the definition might serve as a boundary object, with the acknowledgement that applying resilience in different contexts requires answering: Resilience for whom and to what? When? Where? And why?

DOI

[34]
Ouyang Z Y, Zheng H, Xiao Yet al., 2016. Improvements in ecosystem services from investments in natural capital.Science, 352(6292): 1455-1459.In response to ecosystem degradation from rapid economic development, China began investing heavily in protecting and restoring natural capital starting in 2000. We report on China's first national ecosystem assessment (2000-2010), designed to quantify and help manage change in ecosystem services, including food production, carbon sequestration, soil retention, sandstorm prevention, water retention, flood mitigation, and provision of habitat for biodiversity. Overall, ecosystem services improved from 2000 to 2010, apart from habitat provision. China's national conservation policies contributed significantly to the increases in those ecosystem services.

DOI PMID

[35]
Peng J, Liu Y X, Shen Het al., 2016. Using impervious surfaces to detect urban expansion in Beijing of China in 2000s.Chinese Geographical Science, 26(2): 229-243.

DOI

[36]
Peng J, Liu Y X, Wu J Set al., 2015. Linking ecosystem services and landscape patterns to assess urban ecosystem health: A case study in Shenzhen City, China.Landscape and Urban Planning, 143: 56-68.Ecosystem health assessment is always one of the key topics of ecosystem management. However, few studies has focused on assessing ecosystem health of landscapes, which are geo-spatial units composed of different kinds of ecosystem mosaics. Healthy ecosystems should sustainably provide a range of ecosystem services to meet human needs, and such a concept often cannot be expressed using the traditional ecosystem health assessment. Using Shenzhen City in China as a case study area, this research aims to assess the ecosystem health of urban landscapes based on ecosystem services. Results showed a distinct deterioration of urban ecosystem health for all of the 30 units assessed in Shenzhen City during 1978–2005. Five levels were classified with respect to health using fixed thresholds. There were 12 towns appearing with the worst level and 4 towns disappearing with the best level in 2005 compared with the status in 1978. Although there was no significant decrease in the level of health during 1978–2000, by 2005 more than 70% of towns belonged to the top two levels, classifying them as unhealthy. Among all the assessing indicators, the indicators of ecosystem organization contributed least to ecosystem health, except in 1986, and ecosystem services were found to be the most contributive indicator during 1978–2005. It was also suggested that land use patterns provided an integrating bridge among regional ecosystem health, economic development, and environmental performances.

DOI

[37]
Pickett S T A, McGrath B, Cadenasso M Let al., 2014. Ecological resilience and resilient cities.Building Research & Information, 42(2): 143-157.The urban realm is changing rapidly and becoming increasingly interconnected across continents, and across contrasting types of land covers, while at the same time facing new environmental threats and experiencing new demographic and social pressures. The urban component of the global ecosystem can be made more sustainable by incorporating the ecological understanding of resilience into the discourse. Sustainability is seen as a social, normative goal, which can be promoted using the mechanisms of ecological resilience. Ecological resilience differs from engineering resilience. Ecological resilience emphasizes the capacity of a site to adjust to external shocks and changes in controlling interactions, while engineering resilience emphasizes its ability to return to a state that existed before perturbation. Ecological resilience is particularly appropriate to urban systems, given the extent and open-ended nature of the changes and challenges they face. Adaptive processes are explored as contributions to the achievement of a successful adaptive cycle in urban socio-ecological systems. Key tools for incorporating the ecological thinking about resilience into the social discourse include landscape or patch ecology, the novel idea of the metacity, an assessment of ecological and design models, and the use of designs as experiments.

DOI

[38]
Schueler T K, 1987. Controlling Urban Runoff: A Practical Manual for Planning and Designing Urban BMPs. Washington: MWCOG, 1-10.This manual provides detailed guidance for engineers and site planners on how to plan and design urban best management practices (BMPs) to remove pollutants and protect stream habitat. Describes water quality and habitat impacts in streams that result from uncontrolled watershed development. Contains a simple method for estimating pollutant export from development sites. Presents a series of tools to assist the site designer in selecting the best BMP option for a site. Provides detailed design guidance on seven major urban BMP practices in use in the Washington metropolitan area: extended detention ponds, wet ponds, infiltration basins and trenches, porous pavement, water quality inlets and vegetative practices. Each BMP is reviewed from the standpoint of stormwater management benefits, pollutant removal, physical feasibility, costs, maintenance requirements, and impacts to the environment and adjacent communities. A list of recommended design standards that enhance BMP performance is also presented.

[39]
Schueler T K, 1994. The importance of imperviousness.Watershed Protection Techniques, 1: 100-101.In this article a unifying theme is proposed based on a physically defined unit-imperviousness. Imperviousness here is defined as the sum of roads, parking lots, sidewalks, rooftops, and other impermeable surfaces of the urban landscape. This variable can be easily measured at all scales of development, as the percentage of area that is not "green". Imperviousness is a very useful indicator with which to measure the impacts of land development on aquatic systems. Reviewed here is the scientific evidence that relates imperviousness to specific changes in the hydrology, habitat structure, water quality and biodiversity of aquatic systems. This research, conducted in many geographic areas, concentrating on many different variables, and employing widely different methods, has yielded a surprisingly similar conclusion-stream degradation occurs at relatively low levels of imperviousness (10-20%). Most importantly, imperviousness is one of the few variables that can be explicitly quantified, managed and controlled at each stage of land development. The remainder of this paper examines in detail the relationship between imperviousness and stream quality.

DOI

[40]
Weng Q H, Lu D S, 2009. Landscape as a continuum: an examination of the urban landscape structures and dynamics of Indianapolis City, 1991-2000, by using satellite images.International Journal of Remote Sensing, 30(10): 2547-2577.The majority of the vast literature on remote sensing of urban landscapes has adopted a 090004hard classification090005 approach, in which each image pixel is assigned a single land use and land cover category. Owing to the nature of urban landscapes, the confusion between land use and land cover definitions and the constraints of widely applied medium spatial resolution satellite images, high classification accuracy has been difficult to achieve with the conventional 090004hard090005 classifiers. The prevalence of the mixed pixel problem in urban landscapes indicates a crucial need for an alternative approach to urban analyses. Identification, description and quantification, rather than classification, may provide a better understanding of the compositions and processes of heterogeneous landscapes such as urban areas. This study applied the Vegetation090009Impervious Surface090009Soil (V090006I090006S) model for characterizing urban landscapes and analysing their dynamics in Indianapolis, USA, between 1991 and 2000. To extract these landscape components from three dates of Landsat Thematic Mapper/Enhanced Thematic Mapper Plus (TM/ETM+) images in 1991 1995 and 2000, we used the technique of linear spectral mixture analysis (LSMA). These components were further classified into urban thematic classes, and used for analysis of the landscape patterns and dynamics. The results indicate that LSMA provides a suitable technique for detecting and mapping urban materials and V090006I090006S component surfaces in repetitive and consistent ways, and for solving the spectral mixing of medium spatial resolution satellite imagery. The reconciliation between the V090006I090006S model with LSMA for Landsat imagery allowed this continuum landscape model to be an alternative, effective approach to characterizing and quantifying the spatial and temporal changes of the urban landscape compositions in Indianapolis from 1991 to 2000. It is suggested that the model developed in this study offers a more realistic and robust representation of the true nature of urban landscapes, as compared with the conventional method based on 090004hard classification090005 of satellite imagery. The general applicability of this continuum model, especially its spectral, spatial and temporal variability, is discussed.

DOI

[41]
Wu J G, Jenerette G D, Buyantuyev Aet al., 2011. Quantifying spatiotemporal patterns of urbanization: The case of the two fastest growing metropolitan regions in the United States.Ecological Complexity, 8(1): 1-8.Urbanization is the most drastic form of land use change affecting biodiversity and ecosystem functioning and services far beyond the limits of cities. To understand the process of urbanization itself as well as its ecological consequences, it is important to quantify the spatiotemporal patterns of urbanization. Based on historical land use data, we characterize the temporal patterns of Phoenix and Las Vegas - the two fastest growing metropolitan regions in the United States - using landscape pattern metrics at multiple spatial resolutions. Our results showed that the two urban landscapes exhibited strikingly similar temporal patterns of urbanization. During the past several decades, urbanization in the two desert cities resulted in an increasingly faster increase in the patch density, edge density, and structural complexity at both levels of urban land use and the entire landscape. That is, as urbanization continued to unfold, both landscapes became increasingly more diverse in land use, more fragmented in structure, and more complex in shape. The high degree of similarity between the two metropolitan regions may be attributable to their resemblance in the natural environment, the form of population growth, and the stage of urban development. While our results corroborated some theoretical predictions in the literature, they also showed spatiotemporal signatures of urbanization that were different from other cities. Resolving these differences can certainly further our understanding of urban dynamics. Finally, this study suggests that a small set of landscape metrics is able to capture the main spatiotemporal signatures of urbanization, and that the general patterns of urbanization do not seem to be significantly affected by changing grain sizes of land use maps when the spatial extent is fixed. This landscape pattern analysis approach is not only effective for quantifying urbanization patterns, but also for evaluating spatial urban models and investigating ecological effects of urbanization.

DOI

[42]
Xiao X M, Zhang Q Y, Braswell Bet al., 2004. Modeling gross primary production of temperate deciduous broadleaf forest using satellite images and climate data.Remote Sensing of Environment, 91(2): 256-270.Net ecosystem exchange (NEE) of CO 2 between the atmosphere and forest ecosystems is determined by gross primary production (GPP) of vegetation and ecosystem respiration. CO 2 flux measurements at individual CO 2 eddy flux sites provide valuable information on the seasonal dynamics of GPP. In this paper, we developed and validated the satellite-based Vegetation Photosynthesis Model (VPM), using site-specific CO 2 flux and climate data from a temperate deciduous broadleaf forest at Harvard Forest, Massachusetts, USA. The VPM model is built upon the conceptual partitioning of photosynthetically active vegetation and non-photosynthetic vegetation (NPV) within the leaf and canopy. It estimates GPP, using satellite-derived Enhanced Vegetation Index (EVI), Land Surface Water Index (LSWI), air temperature and photosynthetically active radiation (PAR). Multi-year (1998-2001) data analyses have shown that EVI had a stronger linear relationship with GPP than did the Normalized Difference Vegetation Index (NDVI). Two simulations of the VPM model were conducted, using vegetation indices from the VEGETATION (VGT) sensor onboard the SPOT-4 satellite and the Moderate Resolution Imaging Spectroradiometer (MODIS) sensor onboard the Terra satellite. The predicted GPP values agreed reasonably well with observed GPP of the deciduous broadleaf forest at Harvard Forest, Massachusetts. This study highlighted the biophysical performance of improved vegetation indices in relation to GPP and demonstrated the potential of the VPM model for scaling-up of GPP of deciduous broadleaf forests.

DOI

[43]
Yan Huimin, Liu Jiyuan, Cao Mingkui, 2007. Spatial pattern and topographic control of China’s agricultural productivity variability.Acta Geographica Sinica, 62(2): 171-180. (in Chinese)Being home to one of every five people in the world, China always put the food security issue high on its agenda and has successfully provided adequate food for its people. However, the stagnation of global agricultural production during the 1990s is not a short-term phenomenon caused by policies or market. Therefore, it is significant for food security, agricultural policy making and ecosystem service functions adjustment to recognize the variability of agricultural productivity and its predominant controlling factors at decadal temporal scale. The effect of topography on agricultural productivity variation has been poorly understood due to the lack of spatially explicit agricultural productivity information. In this study, the agricultural productivity variation and its spatial heterogeneity between the 1980s and 1990s are analyzed using a satellite-based production efficiency model (GLO-PEM) driven with NOAA/AVHRR data. It is shown that spatial heterogeneity of agricultural productivity variability was predominantly controlled by the topographic conditions at decadal scale. The proportion of cropland area occurring in agricultural productivity reduction increased with the amplifying relief, and consequently, the probability of cropland in hilly areas suffering from agricultural productivity reduction was 10%-30% higher than cropland in plain areas. Although the total agricultural production had increased in each agricultural region of China during 1981-2000, there were parts of cropland area suffering from reduction of agricultural productivity, accounting for 24% of the total cropland area. In those croplands with decreased agricultural productivity, 71% were located at hilly areas, particularly on the Loess Plateau and Yunnan-Guizhou Plateau areas.

DOI

[44]
Zhang Zengxiang, Zhao Xiaoli, Wang Xiao et al., 2014. Remote Sensing Monitoring of Soil Erosion in China. Beijing: Planet Map Press, 23-30.

Outlines

/