
Journal of Geographical Sciences >
Spatial-temporal change in urban agricultural land use efficiency from the perspective of agricultural multi-functionality: A case study of the Xi’an metropolitan zone
Author: Zhou Zhongxue (1972-), PhD and Associate Professor, specialized in land resource and land use evaluation, urbanization and its impact on urban agricultural development and ecosystem services. E-mail: zhouzhx@snnu.edu.cn
Received date: 2017-01-19
Accepted date: 2017-05-04
Online published: 2017-12-10
Supported by
National Natural Science Foundation of China, No.41271550
Humanities and Social Sciences Project of Ministry of Education in the West and the Frontier Areas, No.12XJC790003
Copyright
The excessive expansion of urbanized areas has resulted in haphazard land utilization, immoderate consumption of superior agricultural land and water resources, significant fragmentation of agricultural landscape, and gradual deterioration of the agro-ecological environment. Combined, these factors cause poor land use efficiency. Under these circumstances, comprehensively assessing land use efficiency for urban agriculture is a key issue in land use research. Currently, evaluation methods for agricultural land use efficiency narrowly concentrate on aspects of economic input and output. However, urban agro-ecosystems can provide diverse economic, social, and ecological services and functions. In particular, the social and ecological services and functions originating from agricultural land, which have a higher value than economic services, play a significant role in ensuring regional social, ecological, and environmental security. However, recent research has rarely taken these benefits into consideration. Therefore, land use value has been greatly underestimated, which has resulted in mishandled and poor land use policies. In this study, we apply Landsat imagery and social and economic statistical data for the Xi’an metropolitan zone (XMZ) to investigate agricultural multi-functionality. We develop an evaluation framework for urban agricultural land use efficiency and identify agro-ecosystem services and functions as important outputs from agricultural land. The land use efficiency of urban agriculture is then evaluated using ecosystem services models, providing a mechanism for assessing spatial-temporal changes in land use efficiency in the XMZ from 1999 to 2015. Four important conclusions are reached from this analysis. First, the rapid urbanization and agricultural transformation from traditional cereal cultivation to modern urban agriculture has resulted in steadily increasing costs, outputs, and land use efficiency of urban agriculture. The total output value increased 41% and land use efficiency per hectare increased by 33.13% on average. Second, the spatial patterns of comprehensive output and land use efficiency were dominated by economic outputs from agricultural land. Areas near cities, which are dominated by orchard and arable land, provide more economic functions. These areas support and regulate services due to the transformation from extensive cereal production to intensive modern urban agriculture; therefore, they have higher output value and land use efficiency. In contrast, areas distant from cities, towns, and high traffic roads, namely, remote rural areas, provide more support and regulating services, but have relatively lower economic function due to inaccessibility to urban markets and slow agricultural transformation. Therefore, these areas have lower output value and land use efficiency. The spatial change in agricultural output and land use efficiency in urban areas is strongly dependent on the degree of urbanization and agricultural transformation. Third, the total output value and land use efficiency of urban agriculture measured with our approach are much higher than evaluations using traditional methods. However, the spatial patterns measured using the two approaches are in agreement. The evaluation framework integrates ecological services and economic and social functions into a comprehensive output from agricultural land. This approach is more methodical and accurate for evaluating the comprehensive efficiency of land use based on quantities and spatial scale because they are at the pixel scale. Finally, the evaluation results have important implications for enhancing current agricultural subsidies and even implementing ecological payment policies in China. Most importantly, they can be directly applied to agricultural transformation regulations, decision-making, and guidance for rational land utilization.
ZHOU Zhongxue , LI Mengtao . Spatial-temporal change in urban agricultural land use efficiency from the perspective of agricultural multi-functionality: A case study of the Xi’an metropolitan zone[J]. Journal of Geographical Sciences, 2017 , 27(12) : 1499 -1520 . DOI: 10.1007/s11442-017-1449-6
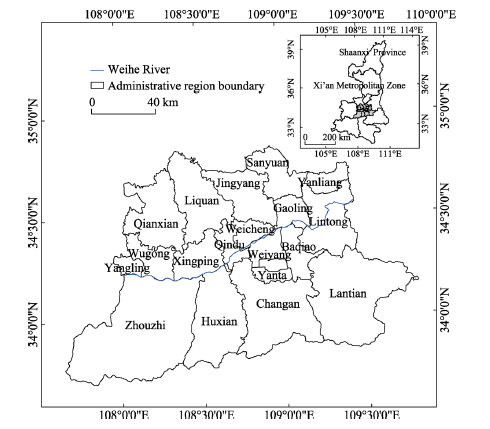
Figure 1 The Xi’an metropolitan zone (XMZ) |
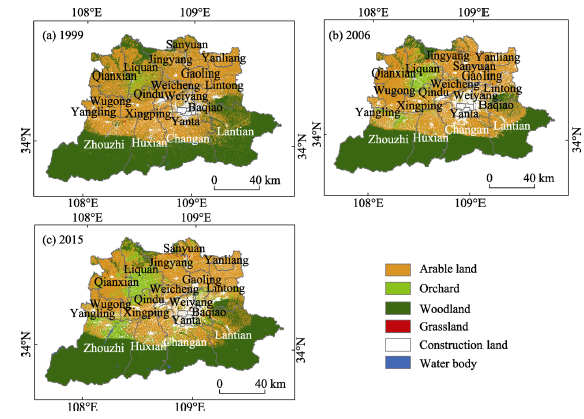
Figure 2 Land use in the Xi’an metropolitan zone from 1999 to 2015 |
Table 1 Evaluation indicators of agricultural land use efficiency |
| Item | Indicators | Description of the variables |
|---|---|---|
| Costs (Input) | Fertilizer | Fertilizer cost |
| Agricultural plastic film | Plastic film cost | |
| Agricultural pesticide | Pesticide cost | |
| Total power of agricultural machinery | Energy cost of agricultural machinery | |
| Labor | Labor cost for planting and managing crop | |
| Water resource | Water consumption for irrigating crops | |
| Seed or seedling | Cost of seed and seedling for planting crops or trees | |
| Food production | Provision of crops, fruits, vegetables, poultry, livestock, aquatic products, and foraging | |
| Goods and services (Output) | Basic livelihood security | Providing the minimum necessities for a sustainable life for a farmer |
| Employment | Stable employment opportunities provided by agriculture | |
| Aesthetic and recreation | Aesthetics, spiritual and psychological care, sense of place, leisure and ecological tourism, agricultural education services, etc. | |
| Carbon sequestration and oxygen release | Maintaining the balance of the atmospheric chemical composition by absorbing CO2 and releasing O2 | |
| Soil and water conservation | Effect of vegetation on soil retention and reduction in soil erosion | |
| Air purification | Ecological landscape absorption of SO2, NOx, dust, etc. | |
| Climate regulation | Regulating regional climate, such as increasing precipitation and decreasing the temperature | |
| Water purification and waste treatment | Decomposition and removal of residua and excess nutrients, purification of water | |
| Biodiversity | Maintaining the diversity of biological species | |
| Raw material production | Wood, forest products, medicinal plants, spices, etc. | |
| Hydrological regulation | Flood control and water storage | |
| Pest control and pollination | Pest and disease control, habitat for pollinators |
Table 2 Aesthetic and recreation value per unit area for each type of agricultural landscape in the Xi’an metropolitan zone (104 yuan·ha‒1·a‒1) |
| Land use | Arable land | Woodland | Grassland | Water body | Orchard |
|---|---|---|---|---|---|
| 1999 | 0.00082 | 0.10480 | 0.00328 | 0.35533 | 0.05404 |
| 2006 | 0.00142 | 0.18099 | 0.00565 | 0.58299 | 0.09333 |
| 2015 | 0.00252 | 0.32276 | 0.01009 | 1.09436 | 0.16642 |
Table 3 NPP per unit area for each agricultural land use type in the Xi’an metropolitan zone (t·ha‒1·a‒1) |
| Arable land | Woodland | Grassland | Water body | Orchard | |
|---|---|---|---|---|---|
| 1999 | 3.6235 | 7.3043 | 2.5339 | 2.0016 | 4.0168 |
| 2006 | 3.5277 | 7.2066 | 2.5082 | 1.9799 | 3.8176 |
| 2013 | 3.0757 | 6.8075 | 2.4594 | 1.8765 | 3.0065 |
Table 4 Pollutants absorbed per unit area for each agricultural landscape in the Xi’an metropolitan zone (kg∙ha‒1∙a‒1) |
| Land use | Pollutant types | |||
|---|---|---|---|---|
| SO2 | NOx | HF | Dust | |
| Woodland | 291.03 | 215.36 | 9.94 | 44300.00 |
| Grassland | 21.70 | 16.06 | 1.20 | 120.00 |
| Arable land | 45.00 | 33.30 | 0.33 | 940.00 |
| Orchard | 90.00 | 66.60 | 0.79 | 9000.00 |
| Water body | 427.15 | 316.17 | 3.56 | 8.86 |
Table 5 Water conservation parameters for each agricultural landscape in the Xi’an metropolitan zone (Liu et al., 2016) |
| Dry weight of litter layer (t/ha) | Saturation absorption rate (%) | Canopy interception rate (%) | Non-capillary porosity (%) | |
|---|---|---|---|---|
| Woodland | 24.56 | 276.45 | 19.35 | 13.46 |
| Orchard | 9.27 | 155.00 | 6.56 | 6.34 |
| Grassland | 4.43 | 40.74 | 4.10 | 6.07 |
Table 6 Climate regulation and biodiversity value per unit area for each agricultural land use type in the Xi’an metropolitan zone (104 yuan·ha-1·a-1) |
| Arable land | Woodland | Grassland | Water body | Orchard | |
|---|---|---|---|---|---|
| Climate regulation | 0.135 | 0.409 | 0.136 | 0.350 | 0.273 |
| Biodiversity | 0.108 | 0.591 | 0.295 | 0.002 | 0.442 |
Table 7 Change in input per unit area for each agricultural land type in the Xi’an metropolitan zone |
| 1999-2006 | 2006-2015 | 1999-2015 | ||||
|---|---|---|---|---|---|---|
| Amount of growth(yuan/ha) | Change (%) | Amount of growth (yuan/ha) | Change (%) | Amount of growth (yuan/ha) | Change (%) | |
| Arable land | 2198.81 | 0.28 | 5788.78 | 58.37 | 7987.589 | 103.49 |
| Orchard | 4405.87 | 0.43 | 11274.00 | 76.35 | 15679.867 | 151.35 |
| Woodland | 108.28 | 0.13 | 211.89 | 22.39 | 320.170 | 38.19 |
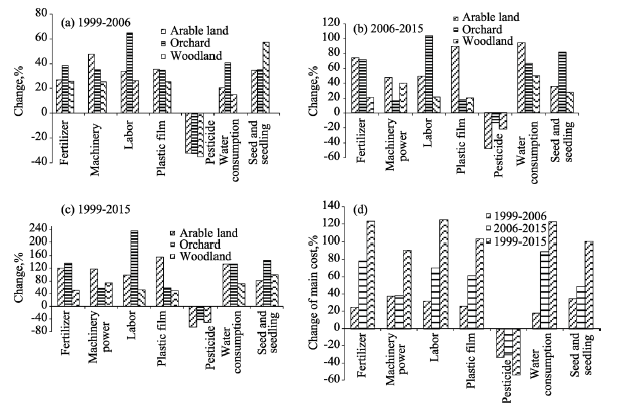
Figure 3 Change in main agricultural costs per unit area for agricultural land |
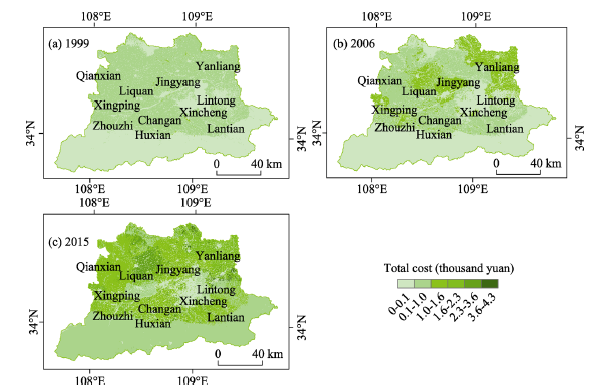
Figure 4 Spatial changes in agricultural land inputs in the Xi’an metropolitan zone from 1999 to 2015 |
Table 8 Change in output per unit area for each type of agricultural land in the Xi’an metropolitan zone |
| 1999-2006 | 2006-2015 | 1999-2015 | ||||
|---|---|---|---|---|---|---|
| Amount of change (104 yuan/ha) | Rate of change (%) | Amount of change (104 yuan/ha) | Rate of change (%) | Amount of change (104 yuan/ha) | Rate of change (%) | |
| Arable land | 1.70 | 55.66 | 0.75 | 15.77 | 2.45 | 80.21 |
| Orchard | -0.46 | -8.03 | 1.06 | 20.24 | 0.60 | 10.59 |
| Woodland | 0.17 | 7.10 | -0.09 | -3.43 | 0.08 | 3.42 |
| Grassland | 0.45 | 53.55 | -0.32 | -25.16 | 0.12 | 14.19 |
| Water body | -0.06 | -3.85 | 0.29 | 18.61 | 0.23 | 14.04 |
Table 9 Change in agricultural land use efficiency per hectare for each land type in the Xi’an metropolitan zone |
| 1999-2006 | 2006-2015 | 1999-2015 | ||||
|---|---|---|---|---|---|---|
| Amount of change (104 yuan/ha) | Rate of change (%) | Amount of change (104 yuan/ha) | Rate of change (%) | Amount of change (104 yuan/ha) | Rate of change (%) | |
| Arable land | 1.48 | 39.33 | 0.17 | 4.56 | 1.65 | 72.36 |
| Orchard | -0.90 | -23.90 | -0.07 | -1.83 | -0.97 | -20.77 |
| Woodland | 0.16 | 6.44 | -0.11 | -4.42 | 0.05 | 2.16 |
| Water body | -0.06 | -4.01 | 0.29 | 18.61 | 0.23 | 14.04 |
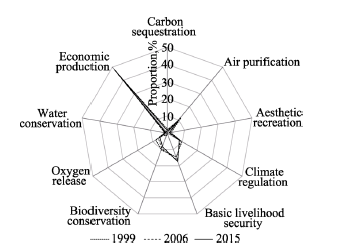
Figure 5 Primary changes in agricultural land use outputs in the Xi’an metropolitan zone from 1999 to 2015 |
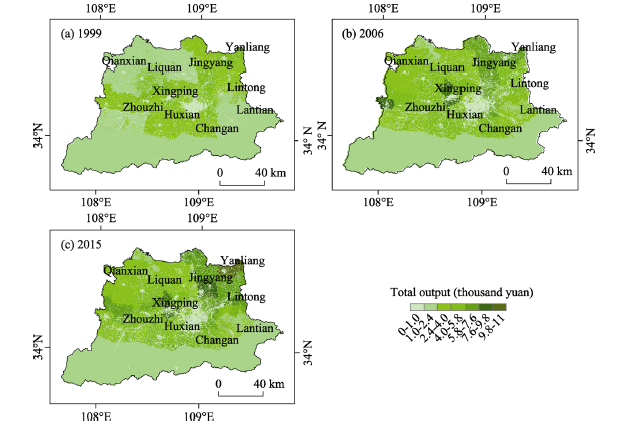
Figure 6 Spatial changes in agricultural land output in the Xi’an metropolitan zone from 1999 to 2015 |
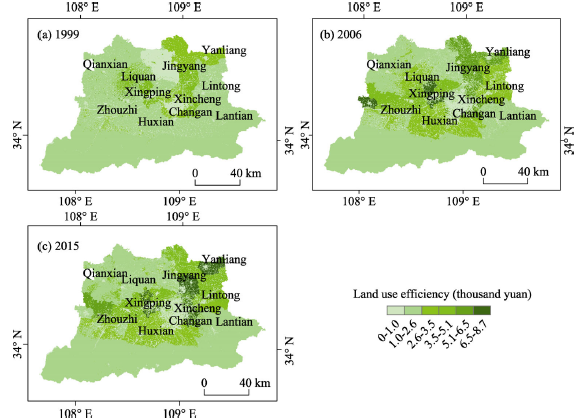
Figure 7 Spatial changes in agricultural land use efficiency in the Xi’an metropolitan zone from 1999 to 2015 |
Table 1 0 Comparison of results from comprehensive efficiency and traditional economic evaluations in the Xi’an metropolitan zone |
| 1999 | 2006 | 2015 | ||||
|---|---|---|---|---|---|---|
| Land type | Mean proportion (standard deviation), % | Correlation coefficient | Mean proportion (standard deviation), % | Correlation coefficient | Mean proportion (standard deviation), % | Correlation coefficient |
| Arable land | 40.03 (13.28) | 0.998 | 51.83(9.75) | 0.998 | 47.65(12.68) | 0.998 |
| Orchard | 46.14 (10.61) | 0.996 | 38.16(7.82) | 0.991 | 31.44(14.17) | 0.980 |
| Woodland | -3.07 (0.42) | 0.901 | -2.08(2.39) | 0.932 | -2.67(3.41) | 0.962 |
| Agricultural land | 0.768 | 0.933 | 0.958 | |||
The authors have declared that no competing interests exist.
| [1] |
|
| [2] |
|
| [3] |
|
| [4] |
|
| [5] |
|
| [6] |
|
| [7] |
|
| [8] |
|
| [9] |
|
| [10] |
|
| [11] |
|
| [12] |
|
| [13] |
|
| [14] |
|
| [15] |
|
| [16] |
|
| [17] |
|
| [18] |
|
| [19] |
|
| [20] |
|
| [21] |
|
| [22] |
National Development and Reform Commission Price Division(NDRCP),2005. National Agricultural Product Assembly of Profit and Cost 2005. Beijing: China Statistics Press. (in Chinese)
|
| [23] |
|
| [24] |
|
| [25] |
|
| [26] |
|
| [27] |
|
| [28] |
|
| [29] |
|
| [30] |
|
| [31] |
|
| [32] |
|
| [33] |
|
| [34] |
|
| [35] |
Xi'an Municipal Bureau of Statistics (XMBS), 2000. Xi'an Statistical Yearbook 2000. Beijing: China Statistics Press. (in Chinese)
|
| [36] |
Xi'an Municipal Bureau of Statistics (XMBS), 2007. Xi'an Statistical Yearbook 2007. Beijing: China Statistics Press. (in Chinese)
|
| [37] |
Xi'an Municipal Bureau of Statistics (XMBS), 2016. Xi'an Statistical Yearbook 2016. Beijing: China Statistics Press. (in Chinese)
|
| [38] |
Xianyang Municipal Bureau of Statistics (XYMBS),1999. Xianyang Statistical Yearbook 1999.
(internal data, unpublished)(in Chinese)
|
| [39] |
Xianyang Municipal Bureau of Statistics (XYMBS),2006. Xianyang Statistical Yearbook 2006.
(internal data, unpublished)(in Chinese)
|
| [40] |
Xianyang Municipal Bureau of Statistics (XYMBS),2015. Xianyang Statistical Yearbook 2015.
(internal data, unpublished)(in Chinese)
|
| [41] |
|
| [42] |
|
| [43] |
|
| [44] |
|
| [45] |
|
| [46] |
|
| [47] |
|
/
| 〈 |
|
〉 |