Research Articles

Impacts and effects of government regulation on farmers’ responses to drought: A case study of North China Plain

  • LI Xiaoyun , 1, 2, 3 ,
  • YANG Yu , 1, 2, 3, * ,
  • LIU Yi , 1, 2, 3, * ,
  • LIU Hui 1, 2, 3
Expand
  • 1. Institute of Geographic Sciences and Natural Resources Research, CAS, Beijing 100101, China
  • 2. Key Laboratory of Regional Sustainable Development Modeling, CAS, Beijing 100101, China
  • 3. College of Resources and Environment, University of Chinese Academy of Sciences, Beijing 100049, China

Author: Li Xiaoyun (1987-), PhD, specialized in man-land relationship and regional development. E-mail: ;

Received date: 2017-02-09

  Accepted date: 2017-03-07

  Online published: 2017-12-10

Supported by

National Natural Science Foundation of China, No.41430636, No.41590841

National Program on Key Basic Research Project (973 Program), No.2012CB95570001

Copyright

Journal of Geographical Sciences, All Rights Reserved

Abstract

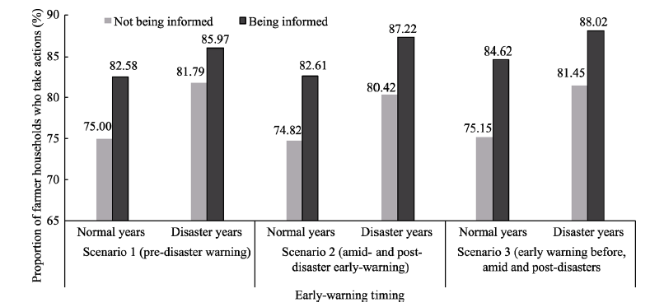
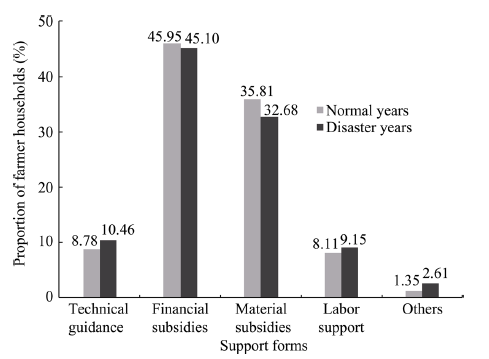
Frequent extreme weather events like drought, etc. in the context of climate change present huge challenges to agricultural production. To find out if farmers have taken measures against them and identify governments’ impact on their response measures are the foundation of and key to further improving relevant policies and farmers’ responsiveness. Taking the North China Plain as an example, the study analyzes farmers’ responses to frequent climate change-induced drought, and assesses the impacts of governments’ early- warning, policy support and other factors on farmers’ responses based on questionnaire survey data and an econometric approach. The results show that: (1) Farmers are responsive to drought, and they are more likely to take measures as the degree of drought deepening. (2) Governments’ regulation affects farmers’ responses, although only part of its regulation measures has remarkable effects. Governments’ early-warning messages can increase the possibility of farmers’ responding to drought, however, only when they get the early-warning in all the processes including before, during, and after disasters can the effects be significant. Currently, as the primary channel through which early-warning information is released, television cannot change farmers’ behaviors significantly. Early-warning is most effective when spread via two or more types of channels. In addition, governments’ (especially town and village level institutions’) policy support has certain impacts on farmers’ responses to drought, yet with less prominent effects in disaster years than in normal years; to provide subsidies, as a regulation measure, can encourage farmers’ initiative a lot in adopting response measures, but most of the farmers haven’t got support from any institutions. Both the structure and strength of government regulation need to be improved. (3) Farmers with different conditions respond differently. Farmer households in irrigation areas, those whose farmland is lower fragmented, and those with numerous agricultural family members tend to take response measures. The study can provide scientific reference to the making of relevant regulation policies under the background of acidifications.

Cite this article

LI Xiaoyun , YANG Yu , LIU Yi , LIU Hui . Impacts and effects of government regulation on farmers’ responses to drought: A case study of North China Plain[J]. Journal of Geographical Sciences, 2017 , 27(12) : 1481 -1498 . DOI: 10.1007/s11442-017-1448-7

1 Introduction

Drought disaster is considered as one of the major natural disasters threatening national grain security (UNDP, 2004; He et al., 2010). Especially under the background of climate change, the degree and frequency of all levels of drought disasters have still been increasing (IPCC, 2007; Dai, 2011; Li et al., 2003). As estimated by IPCC (2012), the total drought- attacked area all over the world will expand by 15%-44% by the end of this century (IPCC, 2012). In China, the area of crops affected by drought disasters has increased from 8% to 16% over the past 60 years, and drought-inundated area (where grain output has dropped over 30%) has also increased by nearly 12%. In 2000, the grain output lost in drought disaster reached 599.6 million tons, which amounted to about 13% of the total grain output of the year, causing huge economic and social losses (MWR, PRC, 2010). Many institutions and academics have pointed out that in a context where climate change is difficult to reverse, the issue of how to enhance the ability of all social groups to cope with risks by taking response measures is worth paying great attention to for policy makers (IPCC, 2007; Qin, 2014). Farmer households are the basic organizing unit of agricultural production (Weng, 2008), which is also a relatively fragile social group. To identify farmers’ responses and the affecting factors of their responses, especially the impacts of government policies, is the foundation of and key to further improving relevant policies and farmers’ responsiveness.
So far, there have been foreign and domestic studies focusing on the influences of climate change on agricultural production and farmers’ livelihoods, most of which begin with discussing the influences and then further investigate farmers’ response behaviors (Deressa et al., 2009) and future approaches to address climate change (Wang et al., 2014; Liu et al., 2012; Pan et al., 2010; Wang et al., 2010; Liu et al., 2010). Some academics have summarized possible measures for addressing disasters, including engineering ones like repairing or building new wells, irrigation and drainage ditches, water reservoirs, dams, etc., and non-engineering ones like adjusting the structure of crop planting, production factor input, intensity of irrigation and drainage, and dates for sowing seeds and harvesting, etc. (IPCC, 2007). To implement engineering measures is comparatively more complicated and relies on more capital and time investment, so their implementation is usually led by government departments or farmers’ cooperative organizations. So far as farmers themselves are concerned, non-engineering measures are more preferable when responding to sudden natural disasters (Chen et al., 2014). Other academics and research institutions have evaluated the effects of response measures in dealing with disasters, and found that appropriate response measures can significantly help reduce the negative impact of drought disasters on agricultural production (Xiao et al., 2014; Falco et al., 2011; Holden et al., 2004). For instance, according to IPCC (2012), when temperature going up, response measures like changing crop varieties or adopting other field management modes, etc. can help reduce drought-induced loss by 10%-15% (IPCC, 2012). It is even possible for agricultural production to benefit from global warming if countermeasures are taken properly (Tian et al., 2014; Xiong et al., 2005). Then the question arises: who should take the actions? More and more scholars point out that in order to enhance the adaptability of agricultural sector, only relying on farmers’ own initiatives in taking response measures is far from enough; related government departments should also take actions (Pan et al., 2010; Ye et al., 2013; Cui et al., 2011). The functions of government support are mainly found in encouraging farmers to or help them reduce vulnerability, resume and even expand production (Zhou et al., 2012). For example, Carter et al. found that government actions like improving infrastructures etc. could help prevent farmer from falling into a vicious circle of poverty due to damages of disasters (Carter et al., 2007). International organizations also call on countries to incorporate climate change adaptation into their national development plan systems (World Bank, 2010). In recent years, Chinese government has responded to the international call actively and included the development and implementation of climate change adaptation strategies into national priority action plans. It not only issued China’s Policies and Actions for Addressing Climate Change in 2008, but also took a step further and issued Drought Control Regulation of the People’s Republic of China in 2009. Besides, National Planning for Addressing Climate Change (2014-2020) and other policy documents have also been worked out. These policies, on the one hand, have shown the determination and steps of Chinese government in addressing climate change; on the other hand, they also encourage farmers to fight against the disasters through providing them with early-warning information and practical support.

2 Case study area and data sources

2.1 General introduction of the case study area

The North China Plain is located in the lower reaches of the Yellow River with most parts of it in the Warm Temperate Zone and having a semi-humid climate. It has a total area of 0.3 million km2 and a total arable land area of 366 million mu (15 mu = 1 ha) among which paddy field, irrigated land and arid land taking up 3%, 54% and 43% respectively. As a major producing area for agricultural products like wheat, corns and apples, etc., the North China Plain holds a prominent position in agriculture with its average annual grain yield accounting for 30% of the national total (Yang et al., 2010). Agricultural production, however, is greatly affected by climate factors. In this area, three-year drought is a common phenomenon. Spring and summer drought is the worst, and continuous seasonal drought also occurs frequently (Lu et al., 2010). The arid tendency of this area is particularly obvious under the background of climate change, leaving the advantages of arable land resource not brought into full play (Fei et al., 2007). According to related literature, from 1960 to 2009, the frequency of drought in the North China Plain reached 46.79%, with an average disaster-stricken area in disaster year accounting for as much as 28% of the total national disaster-stricken area (Lu et al., 2010). In recent years, the temperature in this area has been rising continuously with the temperature rise much larger than the national average value 0.76°C/100a, which makes the aridification process even worse (Tu et al., 1999; Li et al., 2004; Zou et al., 2010). The direct economic losses caused by drought exceed 100 billion yuan every year (Huang et al., 2006). Over the past three decades, this area has also shown apparent trends in decreasing rainfall and falling ground water levels. The amount of precipitation has decreased by 3128.7×108 m3 accumulatively and ground water resources decreased 594.5×10⁸ m3 correspondingly (Zhang et al., 2011). How to deal with the increasingly severe drought is the major challenge faced by the North China Plain (Ma et al., 2006; Liu et al., 2004).
It should be noted that the North China Plain is an ecologically fragile area where drought occurs frequently, so there is actually no such thing as a ‘normal year’ in a strict sense. To be precise, ‘disaster years’ refer to those with disasters severer in degree. Therefore, in this area, farmers usually need to take field management measures to ensure grain production benefits even in the ‘normal years’.

2.2 Data sources

The research data are mainly drawn from field questionnaire surveys conducted in Hebei, Henan and Shandong provinces, supplemented by reference material and statistical yearbook data. As important components of the North China Plain, these three provinces have long histories of agricultural production and a large population of which farmers take up a very large proportion. These three provinces are thus typical and representative of the North China Plain area. That is the reason why they are taken as the investigation provinces. Based on the overall development states of each area, four types of questionnaires aimed at counties, towns, villages and farmer households respectively are designed. Specifically, county-level questionnaire covers economic development, agricultural production and disaster situation of each county. Town-level questionnaire involves 267 indexes under 6 large categories: jurisdictions, socio-economic development, disaster prevention facilities construction, disaster situation, and aid and assistance provision. Village-level questionnaire concerns 1911 indexes under 22 categories such as socio-economic development, crop yields, impacts of disasters, public service facilities construction, responding measures that have been taken to address disasters and so on. Farmer household questionnaire covers 2626 indexes under 9 large and 39 medium categories including essential features of the family, farmland conditions, production inputs, impacts of disasters, disaster prevention measures, knowledge about climate change, awareness of disaster prevention, government policy implementation, etc. Survey sites (Figure 1) and interviewees were selected through stratified sampling and random sampling. Eventually among the questionnaire surveys that have been done, valid and relevant questionnaires to the study include 54 village-level questionnaires and 540 farmer household questionnaires.
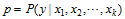
Figure 1 Location of the North China Plain and the survey sites

2.3 Data analysis methods

First of all, a descriptive statistical analysis method is employed for a general analysis of the questionnaire data. The analysis provides a general picture of farmer households’ responding behaviors and government regulation measures, including farmer households’ attitudes in taking responding measures and types of the measures taken in different years, presence of government policy regulation and its specific forms, etc. Secondly, the analysis of variance based on calculation of the values of F statistic is conducted to investigate the differences of farmer households’ responding behaviors in disaster years and in normal years and with different policy regulation measures. Binary logistic regression analysis is also used to build a model for further exploring major affecting factors of farmer households’ responses and the degree of their effects, especially the effects of policy factors. When building this model, ‘whether farmer households’ take responding measures or not’ is taken as the dependent variable and are set as binary dummy variables ‘take’ (=1) and ‘not to take’ (=0). Detailed structure of this model is as follows:
where 
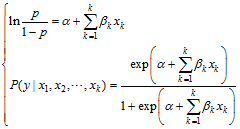
indicates the frequency of farmer households’ “taking” or “not taking” responding measures with independent variables x1, x2, …, xk. xk stands for the factors affecting farmer households’ selection of responding measures. Following the principles of ensuring data availability and avoiding colinearity of factors, the analysis tries to ensure the validity of this regression model by taking as many factors as possible into consideration. In the meantime, it also tries to verify the effectiveness of policy factors on the premise that other variables are controlled. By combining existing researches and field investigation, internal factors, external factors and policy measures are selected (internal and external factors are set as control variables). In this analysis, internal factors mainly include attributes of farmer households, their land and family features, e.g. age and education level of the head of household, size of the family, land structure, social connections, etc. External factors mainly refer to climate conditions, physical geographic conditions and development state of the villages where the farmer households live in, including disaster, topographical and irrigation conditions, etc. Policy measures refer to the measures that are implemented by governments, including whether disaster early-warning information is provided, early-warning channels, whether disaster relief activities are organized, whether material, financial, technical or labor supports are provided, etc. k stands for the total number of variables, α is a constant, and βk is the partial regression coefficient.

3 Results and discussion

3.1 Analysis of farmer households’ responding behaviors to drought and their attitudes

Taking responding measures or not is the major behavior of farmer households in front of drought, reflecting their attitudes in responding to drought disasters. The statistical analysis shows a positive attitude of farmer households. Most of the respondent farmer households choose to take actions, and as the degree of drought disasters deepening, the possibility of farmer households taking actions increases. In the 540 farmer household samples, 75.37% of them choose to take responding measures in normal years, and 82.78% of them choose to do so in disaster years (Table 1).
The types of measures that farmer households take can further reflect the degrees of their recognition of disasters. An analysis of the types of measures that farmer households have taken in different years show that, along with the deepening of severity of disasters, the degree of farmer households’ recognition of drought and their input cost both increase. In normal years, only 144 of the 407 farmer households who choose to take responding actions take multiple (two or more) measures, accounting for 35.38% of the total; while in disaster years, the percentage reaches 58.61%. There are even farmer households who have taken 5 different types of measures in disaster years in order to reduce the negative impacts of drought on agricultural production. Furthermore, the result of the variance analysis is significant (P=0.003<0.05), meaning farmer households’ behaviors in taking responding measures vary considerably in normal and disaster years. Farmers’ responding behaviors are significantly affected by the degrees of drought disasters. These provide further verification of farmer households’ positive attitude in addressing drought disasters.
Table 1 Farmer households’ responding measures
Number of measures taken Normal years Disaster years
Number of farmer households taking measures Percentage (%) Number of farmer households taking measures Percentage (%)
Number of farmer households
not taking measures
133 24.63 93 17.22
Number of farmer households
taking measures, among whom:
407 75.37 447 82.78
1 measure 263 48.70 185 34.26
2 measures 112 20.74 112 20.74
3 measures 29 5.37 95 17.59
4 measures 3 0.56 42 7.78
5 measures 0 0.00 13 2.41
Total 540 100.00 540 100.00
Variance
analysis
F value 9.011
Sig. 0.003

3.2 Governments’ early-warning and farmer households’ responding behaviors

Providing early-warning information is one of the commonly used measures for governments in addressing disasters. Governments get information about possible or ongoing natural disasters through meteorological monitoring, and then pass the information to farmer households via various media, reminding them to make preparations so as to reduce potential losses. In order to obtain detailed information about governments’ early-warning, the questionnaire has designed two separate scenarios-pre-disaster warning, and early warning amid and after disasters. For different years, the interviewees have been asked “have you received any related disaster prevention information before/during or after the disaster?” If the interviewees answered “Yes”, then inquire further by asking “through what media and from which institutes or whom did you obtain the information?”
3.2.1 Channels for releasing governments’ early-warning information
In both normal and disaster years, channels for releasing governments’ early warning information are basically the same for pre-disaster warning or early-warning amid and after disasters. Major channels include short mobile messages, meetings, issuing documents, broadcasting, television, and informing farmer households face to face, etc., among which television is most commonly used followed by broadcasting (Figure 2). For pre-disaster warning, 78.45% and 77.01% of the farmer households have received the information on TV in normal and disaster years respectively; 12.71% and 14.56% from radio broadcasts. The percentages of farmer households getting informed through other channels are extremely low. So far as early-warning during and after disasters is concerned, TV is still the most important media for releasing information, though the percentages of farmer households obtaining information in this manner are lower compared with pre-disaster warning, which are 66.30% and 65.44% in normal and disaster years respectively. The percentages for radio broadcasting increase, which are 20.11% and 23.16% respectively. In addition, the proportions of farmer households obtaining early-warning information through short messages during and after disasters are smaller than those before the disasters. The proportions of farmer households being informed through documents or face to face increase compared with pre-disaster warning, especially for face-to-face informing. These findings reveal that as the severity degree of drought disaster deepening, the governments also attach increasing importance to releasing the early-warming information and in more direct and formal ways.
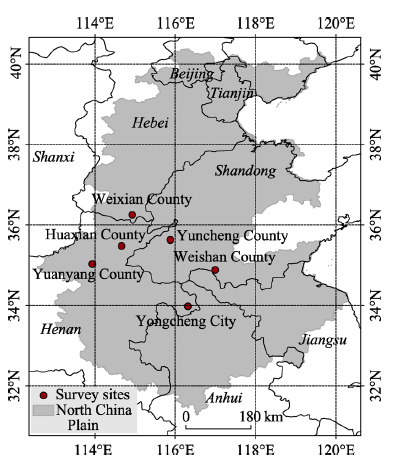
Figure 2 Major channels for releasing early-warning information
3.2.2 Farmer households’ access to early-warning information
Generally speaking, the farmer households who have access to early-warning information are the minority no matter in normal or disaster years, but the more severe the disaster is, the more likely for them to get governments’ early-warning information. For pre-disaster warning, only 155 of the 447 relevant and valid farmer household samples have accessed to the information in normal years, accounting for 34.68% of the total; the percentage rose to 43.16% in disaster years, still lower than half the valid samples though. The situation for early-warning during and after disasters is basically the same (Table 2). Furthermore, statistical analysis also shows that although governments are able to release early-warning information through multiple channels simultaneously, the proportions of farmer households who have obtained the information from multiple (two and more) channels are all very small no matter before, during and after the disasters. In normal and disaster years, there are only 23 and 36 farmer households respectively who have obtained pre-disaster information from multiple channels, accounting for 14.84% and 16.29% respectively of the total number of samples; the percentages are 13.04% (21 farmer households) and 17.18% (39 farmer households) respectively for amid-and post-disaster warning. It shows that the way of announcing early-warning information through multiple channels has not been widely adopted by the governments.
Table 2 Farmer households’ access to early-warning information
Got information
or not
Pre-disaster Amid- and post-disaster
Normal years Disaster years Normal years Disaster years
Number of farmer households Percentage (%) Number of farmer households Percentage (%) Number of farmer households Percentage (%) Number of farmer households Percentage (%)
No 292 65.32 291 56.84 282 63.66 286 55.75
Yes 155 34.68 221 43.16 161 36.34 227 44.25
Number of
channels
1 132 29.53 185 36.13 140 31.60 188 36.65
2 21 4.70 33 6.45 19 4.29 34 6.63
3 1 0.22 2 0.39 1 0.23 4 0.78
4 1 0.22 1 0.20 1 0.23 1 0.19
Total 447 100 512 100 443 100 513 100
3.2.3 Governments’ early-warning and farmer households’ selection of responding measures
Whether and when governments provide early-warning information affect farmer households’ responses to drought to a certain degree (Figure 3). When farmer households receive governments’ early-warning information before the disaster (Scenario 1), the proportion of those who choose to take actions is 82.58% in normal years and 85.97% in disaster years, 7.58% and 4.18% higher respectively than when they are not informed. When they get the warning messages during or after disasters (Scenario 2), the percentages of those who take actions are 82.61% in normal years and 87.22% in disaster years, 7.79% and 6.80% higher respectively than when they are not informed. When they get informed at every stage-before, during and after disasters (Scenario 3), the proportions are 84.62% in normal years and 88.02% in disaster years, being 9.47% and 6.57% higher respectively than when they haven’t got the information.
Furthermore, after comparing the proportions of farmer households who choose to take responding measures under the three scenarios, the authors find: the percentage of farmer households taking actions is higher if governments provide early-warning information at every stage (before, during and after disaster). It means that farmers are most likely to take responding measures when they get all the pre-warning, amid-disaster and post-disaster warning messages.

3.3 Governments’ policy supports and farmer household’s responding behaviors

Apart from indirectly helping farmers deal with drought disasters through providing early- warning and enhance their sensitivity to extreme weather events, governments can also intervene in farmers’ responding behaviors directly through policy measures like technological, material, financial and labor supports. In order to learn in detail about governments’ policy supports, the questionnaire asks, “Have you ever got any government support when disasters occur?” If the interviewee answers “Yes”, then inquires further, “What kind of supports are they?” “By whom were the supports provided?”, etc.
Figure 3 Relationship between early-warning and farmer households’ responding measures
3.3.1 Status quo of policy support
Statistics show that the institutions providing supports for farmer households include village, town and upper-level governments in a hierarchical order, but the majority of farmer households have never been given any policy support by any government sectors, even in years of severe drought disasters. In the 535 valid questionnaires for normal years, only 129 farmer households have ever received policy supports, accounting for 24% of the total; in the 534 valid questionnaires for disaster years, only 131 households have been supported by government policies, taking up 25% of the total (Table 3). An analysis of the structure of government sectors providing policy supports shows that above-town-level institutions give the most supports, claiming 46% and 44.6% of the total volume of supports respectively in normal and disaster years. Generally speaking, however, government policy supports cover a very small part of farmer households, and whether governments provide policy support or not is not affected by the severity level of drought disasters.
Table 3 Supports by different levels of government institutions
Being supported Normal years Disaster years
Number of samples Proportion (%) Number of samples Proportion (%)
No 406 76 403 75
Yes, by: 129 24 131 25
Village 32 23.40 37 26.60
Town 39 28.50 37 26.60
Upper-level institutions 63 46.00 62 44.60
Others 3 2.20 3 2.20
Total number of supports 137 100 139 100
Total number of samples 535 100 534 100
3.3.2 Forms of policy supports
The supports provided by governments mainly include technical guidance, financial subsidies, material subsidies, labor support and other forms of supports. In normal years, financial subsidies are the most common form of supports provided by different levels of institutions, accounting for 45.95% of the total, followed by material subsidies, which take up 35.81% of the total, including fertilizer, pesticide, seed, farmyard manure subsidies and other input factor subsidies for agricultural production. Besides, 8.78% of farmer households have received technical guidance, and 8.11% have got labor supports. This indicates that governments tend to support farm households in more convenient and rapid ways by providing funds and materials. In the long run, however, compared with technical guidance, financial and material subsidies will not be able to enhance farmer households’ perception of natural disasters significantly, so that will not help them strengthen their ability to deal with disasters. Therefore, the forms and structures of governments’ policy supports are in need of further improvement. It is also the case for disaster years and needs not to be repeated here (Figure 4).
Figure 4 Forms of government policy supports (multiple choices)
3.3.3 Government policy supports and farmer households’ selection of responding measures
Generally speaking, when drought disasters occur, government policy supports can encourage farmer households to take actions to a certain degree, but the effects are rather limited, especially in disaster years. Statistics show that if no government supports are given, the share of farmer households taking responding measures is 72.17% in normal years and 81.39% in disaster years; if farmer households have got government supports, then the proportions increase 12.9 and 5.47 percentage points respectively, reaching 85.07% in normal years and 86.86% in disaster years (Table 4). This shows that a larger proportion of farmer households will take responding measures with government supports than without any supports in both normal and disaster years, but the impacts of policy supports on farmer households’ initiative in taking responding measures are very limited in disaster years. Furthermore, by comparing farmer households’ responses when not being given any supports with the respective situation when they are given labor supports, technical guidance, financial subsidies and material subsidies, the authors find that the proportions of farmer households taking actions are 23.24%, 16.34%, 9.37% and 8.68% higher when being supported in respective forms. This indicates that labor supports have the greatest impacts on farmer households’ selection of responding measures, successively followed by technical guidance, financial subsidies and material subsidies.
Table 4 Forms of government supports and corresponding share of farmer households taking actions
Being supported Share of farmer households taking actions (%)
Normal years Disaster years
No 72.17 81.39
Yes 85.07 86.86
Technical guidance 100.00 87.50
Financial subsidies 85.29 86.96
Material subsidies 83.02 88.00
Labor support 100.00 100.00

3.4 Affecting factors of farmer households’ responses

To identify the affecting factors of farmer households’ responses is the key to enhance their response capacities. The simple statistical analysis above cannot control the influences of other factors, e.g. farmer households’ own personal attributes, socio-economic conditions, etc. (Chen et al., 2014; Wang et al., 2015), on farmer households’ decision-making. Therefore, in order to further explore the impacts of policies and other factors on farmer households’ responding behaviors based on the analysis above, the study, setting farmer households’ responses as the dependent variable, establishes logistic regression models for farmer households’ responding measures. In order to deepen the understanding on the effects of policy regulation factors and avoid the co-linearity of factors as well, the study builds three models based on different indexes of policy factors to probe into the impacts of policy regulation factors on farmer households’ responding behaviors step by step. Model 1 evaluates the effects of policy factors from an overall perspective (whether farmer households have received early-warning information or policy supports). Model 2 is established based on the regression results of Model 1, focusing on identifying the impacts of early-warning timing and government structures on farmer households’ responses. Model 3 is constructed on the basis of Model 1 and Model 2, further exploring the regulation effects of different information releasing channels and policy support forms (Table 5).
Table 5 The regression models of farmer households’ responses (Dependent variable: taking measures=1, not taking measures=0)
Independent variables Model 1 Model 2 Model 3
Coefficients Exp (B) Coefficients Exp (B) Coefficients Exp (B)
Internal factors
Total number of family members -0.063 0.939 -0.061 0.941 -0.062 0.940
Age of household head -0.01 0.99 -0.01 0.99 -0.012 0.988
Education level of household head 0.028 1.028 0.026 1.026 0.018 1.018
Farmland area of the household (mu) -0.051** 0.951 -0.049** 0.953 -0.040* 0.961
Farmland fragmentation level (mu/piece) -0.119** 0.888 -0.119** 0.887 -0.082 0.922
Total value of house (ten thousand yuan) 0.004 1.004 0.004 1.004 0.006 1.006
Joined cooperation organization
(Yes=1, No=0)
0.221 1.247 0.184 1.202 0.023 1.023
Family member is/are village cadre/s
(Yes=1, No=0)
-0.329* 0.719 -0.344* 0.709 -0.523** 0.593
External factors
Topography (plain=1, others=0) 19.523 3.012 19.595 3.236 19.538 3.056
Inirrigation area (Yes=1, No=0) 0.727*** 2.07 0.699*** 2.012 0.809*** 2.246
Average underground water level (m) 0.001 1.001 0.002 1.002 0.003 1.003
Policy factors
Received early-warning information
(Yes=1, No=0)
0.412** 1.51
Only received pre-disaster warning 0.076 1.079
Only received post-disaster warning 0.216 1.241
Received both pre- and post-warning 0.615*** 1.85
Only received warning via TV -0.342 0.711
Only received warning via one channel
apart from TV
0.499 1.646
Received warning via two or more channels 0.491** 1.633
The village organizes disaster prevention activities (Yes=1, No=0) 0.326* 1.386 0.321* 1.379 0.223 1.250
Received government supports
(Yes=1, No=0)
0.374* 1.454
Supported by town-level or lower levels of institutions 0.667** 1.949
Only technical guidance 0.197 1.218
Only financial subsidies 2.057** 7.821
Only material subsidies 0.019 1.019
Only labor supports 0.744 2.105
Two or more types of supports 1.100 3.003
Supported by above-town level institutions 0.308 1.361
Disaster years (Yes=1, No=0) 0.410** 1.507 0.412** 1.51 0.426** 1.532
Constants 1.025 2.786 1.043 2.838 1.400** 4.057
Accuracy of prediction 79.10% 79.20% 78.80%
Degrees of freedom 15 18 21
Number of samples 1070 1070 936

Notes: *, ** and *** indicate significance at confidence level 0.1, 0.05 and 0.01 respectively.

The regression shows that all of the prediction accuracies of the three models are above 78%, which has been a remarkable result for regression analyses of complicated and socio-economic issues. Most of the variable symbols are consistent with theoretical expectations with the significant levels being above 90%. Affecting factors of farmer households’ responses include their physical capital (farmland conditions) and social capital (family member/s is/are village cadre/s or not), physical geography conditions of the village (within irrigation area or not), external intervention (disaster prevention activities organized by the village, government early-warning information and practical supports), and weather conditions. Detailed results are as follows:
First of all, from the perspective of internal and external affecting factors of farmer households’ responses, the larger farmland areas the farmer households possess, the smaller chances there will be for them to take responding measures. The reason lies in farmers’ conception of ‘fairness’. In the process of agricultural production, if farmer households choose to take actions when their farmland is stricken with natural disasters, they will try their best to take care of their whole land; if they choose not to take actions, then they will not take actions on a single part of their land. For individual farmer household, the larger farmland area they have, the more restricted they will be by factors like explicit costs of agricultural materials and implicit costs of labor forces, which will thus discourage them from taking responding measures. Likewise, the greater the degree of fragmentation of their farmland is, the less likely they will take actions. That is, there exists a negative correlation between the degree of farmland fragmentation and farmer households’ initiative in taking responding measures under the scale effect. Moreover, the more immediate family members the farmer households have who work in village, town or upper levels of governments, the less likely they will take measures, i.e. the greater share the non-agricultural family members account for, the smaller chances there will be for them to take actions. The reason is that as the share of non-agricultural family members in a farmer household increases, its dependency on agricultural production decreases, and the likelihood for it to take actions when disaster occurs will also decrease as a result. Besides, “whether within irrigation area or not” is also a significant affecting factor of farmer households’ responses. According to the occurrence rate shown by Exp (B), farmer households within irrigation areas is 1.07 times more likely to take responding measures than those outside irrigation areas, which means that farmer households’ responses to drought disasters are also affected by external physical geographical environment. Lastly, farmer households are 0.5 times more likely to take actions in disaster years than in normal years, meaning the severer the disaster is, the more likely it is for farmer households to take responding measures.
Secondly, from the perspective of policy regulation factors, both government early-warning information and policy supports have significant impacts to a certain degree on farmer households’ responses. Model 1 shows that the farmer households who have received government early-warning information are 0.51 times more likely to take measures than those who have not obtained any information. Then Model 2 further shows that no matter the early-warning information is provided before, during or after disasters, they are able to increase the likelihood of farmer households taking actions, but only when the information are provided at all the stages. i.e. before, during and after disasters can they affect farmer households’ responding behaviors significantly, the coefficient of the marginal effect reaching 1.85. This indicates that governments’ early-warning information can enhance farmer households’ initiative in taking responding measures, and the longer the early-warning period can be, the more remarkable its effects will achieve. If the villages organize disaster prevention and mitigation activities, then the farmer households live there are 1.39 times as likely to take measures as when the villages do not organize these activities, indicating that village activities play a positive role in encouraging farmer households’ responses. The farmer households who have been supported by the governments are 0.45 times more likely to take actions than those who have not been supported, and according to the results of Model 2, the supporting measures taken by town or lower levels of institutions have the most significant effects. Moreover, all the 4 types of government supports (in Model 3)-technical guidance, financial subsidies, material subsidies and manpower support are positively correlated with farmer households’ responding behaviors, among which financial subsidies have the most significant effect. This shows that government supports are likely to encourage farmer households’ initiative in taking responding measures regardless of their forms of which financial subsidies having the most significant effect.

4 Conclusions and suggestions

How to adopt effective measures to address increasingly frequent drought disasters is of
great concern to both academics and policy makers. To identify the behaviors of farmer households as the main actor in agricultural production in response to drought disasters and the affecting factors of their behaviors, especially the effects of policy factor regulation, is of great practical value to further improving corresponding policies and enhancing farmer households’ ability to deal with disasters. Based on empirical research data, this study finds that the farmer households in the North China Plain hold positive attitudes in responding to drought disasters. They can adjust their own responding policies flexibly in accordance with the different severity levels of disasters so as to reduce their negative effects on agricultural production. The higher the severity level is, the more likely they will take measures. Apart from the severity level of disasters, farmer households’ responding behaviors are also under the combined influence of multiple factors such as their own family attributes, the physical geographical conditions of the villages where they live and so on. For instances, the degree of farmland fragmentation, being within or outside irrigation area, the proportion of non-agricultural family members in a household, etc., all have significant impacts on farmer households’ behaviors in addressing drought disasters.
Government policy factors can promote farmer households’ initiative in taking actions to a certain degree, albeit not all regulation measures have significant effects. Other researchers’ studies have also proved this conclusion (Deressa et al., 2009; Wang et al., 2015). So far as early-warning factor is concerned, governments’ early-warning can encourage farmer households to take responding measures in both normal and disaster years. The effects, however, are only remarkable when the warning messages are received in every stage of disasters. Although TV is the most commonly used information-releasing channel, its functions are limited. The results are more satisfactory when multiple channels are employed. The reason may be that early-warning information is actually a complicated potential regulation measure, the final effects of which are under the combined influence of multiple factors like the duration of information dissemination, media, recipients’ personal attributes, and their confidence in the accuracy of the information. That is why only when the information is perceived by farmer households for several times can they finally trigger farmer households’ practical actions. Through investigation the authors find that the major factors restricting farmer households’ behaviors include shortage of money, labor forces and technical information. Therefore, when governments (especially town or lower levels of governments) provide them with direct material, technical, labor and financial supports, their enthusiasm in taking responding actions will become greater. The result of providing financial subsidies is particularly remarkable. The effects of policy supports, however, are less obvious in disaster years than in normal years, for the reason that the force and reliability of government support are still not strong enough to compensate the losses caused by disasters. The severity degree of disasters is comparatively more likely to influence the behaviors of rational farmer households and encourage them to take actions on their own initiative. Furthermore, at present, policy supports only cover 25% of the farmer households in this area, which is definitely very limited. In general, there is still room for improvement in the channels for information dissemination and the force and range of policy supports.
Based on the conclusions and discussion above, the study offers the following suggestions for improving the effects of policy regulation: 1) Increase the force and duration of early warning for disasters. Early-warning information should be disseminated via multiple channels simultaneously. Pre-disaster warning should be tracked until the impacts of disasters have been relieved. For instance, apart from TV, computer and other commonly used communication media, posters and propaganda campaign are also useful forms for publicizing climate change and disaster prevention knowledge on a long-term basis, which could help improve farmers’ scientific literacy and perception of disasters. When disasters occur, the function of information dissemination should be reinforced continuously after early-warning information has been released. 2) Strengthen town- and village-level institutions’ supports for farmers in fighting droughts and choose appropriate forms of supports according to specific needs of farmers. Improve the quality of labor force by organizing regular production and disaster prevention trainings so as to offset household labor shortage in combating drought. Assign technical staff to work in the villages and provide regular one-to-one guidance for major farmers. Set experience exchange and technique sharing platforms for farmers, encouraging them to share their production and disaster prevention experiences. Enhance the collective capacities of villages in dealing with disasters and village cadres’ service consciousness. 3) Adjust thinking on and measures of policy regulation. Gradually set up a smooth cyclical disaster management pattern by constructing a security network for drought disasters that involves various levels of government sectors, private sectors, meteorological disaster monitoring institutions, disaster risk assessing institutions, non-governmental organizations, academic research institutions and the media, etc. Taking disaster reduction as the common goal, all parties of the network should cooperate following the cyclical network model of monitoring-making prevention plan in advance-early-stage warning-impact assessing-emergency response-summarizing and feedback-monitoring. Introduce social capital and market force, especially agricultural insurance market, into agricultural disaster prevention and mitigation activities to relieve the heavy burden of governments in addressing agricultural disasters gradually.
It should be noted that the research data are available only until 2012, so it does not cover the impacts of modern factors and new land policies on farmer households’ responses to disasters during the last 4 years. Follow-up research should study further on informatization factors, the application of mechanization in agricultural production, land rights policy, improvement of land market, and new characteristics of farmers’ responses to disasters in the new era. Moreover, this study mainly concerns farmer households’ responses to climate- change-induced drought disasters in the North China Plain where is typical of severe drought disaster area in China. However, in the context of climate change, natural disasters like flood, pests and diseases, Xerothermic wind disaster, etc. are also on the rise, so the impacts of other extreme weather events on farmers’ responses also need to be studied in later research. Climate change issues are complicated and cannot be resolved in the short run, and farmers’ response is a dynamic development process. Therefore, with the deepening of human knowledge in climate change issues and effects of new policies, long-term dynamic monitoring research and continuous testing on the effects of policies can be conducted in the future.

The authors have declared that no competing interests exist.

[1]
Carter M R, Little P D, Mogues Tet al., 2007. Poverty traps and natural disasters in Ethiopia and Honduras.World Development, 35(5): 835-856.Droughts, hurricanes, and other environmental shocks punctuate the lives of poor and vulnerable populations in many parts of the world. The direct impacts can be horrific, but what are the longer-term effects of such shocks on households and their livelihoods? Under what circumstances will shocks push households into poverty traps from which recovery may not be possible without external assistance? In an effort to answer these questions, this paper analyzes the asset dynamics of Ethiopian and Honduran households in the wake of severe environmental shocks. While the patterns are different across countries, both reveal worlds in which the poorest households struggle most with shocks, adopting coping strategies which are costly in terms of both short term and long-term well being.

DOI

[2]
Chen H, Wang J X, Huang J K, 2014. Policy support, social capital, and farmers’ adaptation to drought in China.Global Environmental Change, 24: 193-202.Increasingly severe drought has not only threatened food security but also resulted in massive socio-economic losses. In the face of increasingly serious drought conditions, the question of how to mitigate its impacts through appropriate measures has received great attention. The overall goal of this study is to examine the influence of policies and social capital on farmers- decisions to adopt adaptation measures against drought. The study is based on a large-scale household and village survey conducted in six provinces nationwide. The survey results show that 86% of rural households have taken adaptive measures to protect crop production against drought, most of which are non-engineering measures. In the case of non-engineering measures, changing agricultural production inputs and adjusting seeding or harvesting dates are two popular options. A multivariate regression analysis reveals that government policy support against drought such as releasing early warning information and post-disaster services, technical assistance, financial and physical supports have significantly improved farmers- ability to adapt to drought. However, since only 5% of villages benefited from such supports, the government in China still has significant room to implement these assistances. Moreover, having a higher level of social capital in a farm household significantly increases their adaptation capacity against drought. Therefore, the government should pay particular attention to the farming communities, and farmers within a community who have a low level of social capital. Finally, farmers- ability to adapt to drought is also associated with the characteristics of their households and local communities. The results of this study also have implications for national adaptation plans for agriculture under climate change in other developing countries.

DOI

[3]
Cui Shenghui, Li Xuanqi, Li Yanget al., 2011. Review on adaptation in the perspective of global change.Progress in Geography, 30(9): 1088-1098. (in Chinese)The study on adaptation attracts much attention in the field of global change.Based on the concepts of adaptation,this paper concluded scientific meanings of adaptation and the approaches to study adaptation.As listed below,there are three approaches to study adaption:(1) in the perspective of sensitivity-vulnerability-adap-tation,(2) in the perspective of adaptive capacity-resilience-vulnerability,and(3) in the perspective of of resil-ience-vulnerability-adaptation.Furthermore,this paper also discussed how to take the study of adaptation into practice and provided several examples.Finally,the aim and focal points of the study on adaption were dis-cussed in this paper.

DOI

[4]
Dai A G, 2011. Drought under global warming: A review.Wiley Interdisciplinary Reviews Climate Change, 2(1): 45-65.This article reviews recent literature on drought of the last millennium, followed by an update on global aridity changes from 1950 to 2008. Projected future aridity is presented based on recent studies and our analysis of model simulations. Dry periods lasting for years to decades have occurred many times during the last millennium over, for example, North America, West Africa, and East Asia. These droughts were likely triggered by anomalous tropical sea surface temperatures (SSTs), with La Ni01±a-like SST anomalies leading to drought in North America, and El-Ni01±o-like SSTs causing drought in East China. Over Africa, the southward shift of the warmest SSTs in the Atlantic and warming in the Indian Ocean are responsible for the recent Sahel droughts. Local feedbacks may enhance and prolong drought. Global aridity has increased substantially since the 1970s due to recent drying over Africa, southern Europe, East and South Asia, and eastern Australia. Although El Ni01±o-Southern Oscillation (ENSO), tropical Atlantic SSTs, and Asian monsoons have played a large role in the recent drying, recent warming has increased atmospheric moisture demand and likely altered atmospheric circulation patterns, both contributing to the drying. Climate models project increased aridity in the 21st century over most of Africa, southern Europe and the Middle East, most of the Americas, Australia, and Southeast Asia. Regions like the United States have avoided prolonged droughts during the last 50 years due to natural climate variations, but might see persistent droughts in the next 2009000950 years. Future efforts to predict drought will depend on models' ability to predict tropical SSTs. WIREs Clim Change 2011 2 4509000965 DOI: 10.1002/wcc.81For further resources related to this article, please visit the WIREs website

DOI

[5]
Deressa T T, Hassan R M, Ringler Cet al., 2009. Determinants of farmers’ choice of adaptation methods to climate change in the Nile Basin of Ethiopia.Global Environmental Change, 19(2): 248-255.This study identifies the major methods used by farmers to adapt to climate change in the Nile Basin of Ethiopia, the factors that affect their choice of method, and the barriers to adaptation. The methods identified include use of different crop varieties, tree planting, soil conservation, early and late planting, and irrigation. Results from the discrete choice model employed indicate that the level of education, gender, age, and wealth of the head of household; access to extension and credit; information on climate, social capital, agroecological settings, and temperature all influence farmers- choices. The main barriers include lack of information on adaptation methods and financial constraints.

DOI

[6]
Falco S D, Veronesi M, Yesuf M, 2011. Does adaptation provide food security? A micro-perspective from Ethiopia.American Journal of Agricultural Economics, 93(3): 825-842.We examine the driving forces behind farm households’ decisions to adapt to climate change, and the impact of adaptation on farm households’ food productivity. We estimate a simultaneous equations model with endogenous switching to account for the heterogeneity in the decision to adapt or not, and for unobservable characteristics of farmers and their farm. Access to credit, extension and information are found to be the main drivers behind adaptation. We find that adaptation increases food productivity, that the farm households that did not adapt would benefit the most from adaptation.

DOI

[7]
Fei Yuhong, Zhang Zhaoji, Zhang Fengeet al., 2007. An analysis of the influence of human activity and climate change on water resources of the North China Plain.Acta Geoscientica Sinica, 28(6): 567-571. (in Chinese)The North China Plain is an important area for food production, and the underground water resources constitute the main water-supply source of this region. The increasing production quantity and climate change have restricted the development of water resources. With the trend of decreasing precipitation and ascending air temperature in recent years, the originally insufficient water resources have continuously reduced the water supply. On the basis of an analysis of precipitation, evaporation, surface runoff, changes of underground water flow field and a series of changes of underground water resources, it is thought that such factors as decreasing precipitation, ascending air temperature, human river-taming work and exploitation of underground water seem to be the most important factors responsible for the decrease of water resources in this region.

DOI

[8]
He Bin, Wu Jianjun, Lv Aifeng, 2010. New advances on agricultural drought risk study.Progress in Geography, 29(5): 557-564. (in Chinese)The analysis of agricultural drought risk is not only the prerequisite of drought risk management,but also the theoretical basis of risk division and of the damages,and it has become a new research focus in recent years.The connotation,the constituent elements,the analysis sys-tem,and the study status of agricultural drought disaster were described in this paper.On this ba-sis,this paper pointed out that,from the agricultural drought hazard and vulnerability point of view,the systematic establishment of a comprehensive drought risk analysis framework,especially the development of dynamic mathematical models and index system for each risk factor,is the re-search priority in the study of temporal and spatial patterns of agricultural drought risk.

DOI

[9]
Holden S, Shiferaw B, 2004. Land degradation, drought and food security in a less-favored area in the Ethiopian highlands: A bio-economic model with market imperfections.Agricultural Economics, 30(1): 31-49.This paper presents a bio-economic model of Andit Tid, a severely degraded crop-ivestock farming system with high population density and good market access in the highlands of Ethiopia. Land degradation, population growth, stagnant technology, and drought threaten food security in the area. Drought or weather risk appears to have increased in recent years. The bio-economic model is used to analyse the combined effects of land degradation, population growth, market imperfections and increased risk of drought on household production, welfare and food security. We find that the indirect effects of drought on household welfare through the impact on crop and livestock prices are larger than the direct production effects of drought. Provision and adoption of credit for fertiliser, although risky in itself, may lead to increased grain production and improved household welfare and food security. Provision of credit may have a negative effect on conservation incentives but this effect may be mitigated by linking a conservation requirement to the provision of credit for fertiliser.

DOI

[10]
Huang Qingxu, Shi Peijun, He Chunyanget al., 2006. Modeling land use change dynamics under different aridification scenarios in Northern China.Acta Geographica Sinica, 61(12): 1299-1310. (in Chinese)Currently, in northern China, the impact of aridification on land system is not very clear, which would, to some extent, restrict the rational development and utilization of land resources. Therefore, based on the principle and method of system dynamics (SD), a SD model aims at simulating land use changes in northern China under different aridification scenarios and designed socio-economic status is developed in this paper. The accuracy assessment with historic data covering 1989 to 2001 indicates the SD model is helpful and reliable to understand the complex change process of land use system. The aridification scenarios in the next 30 years are defined as three types, from the reversal of aridification, gradual aridification to the acceleration of aridification with the increment of aridification degree. The results suggest that, in northern China, future aridification has great impact on the water resource, leading it to decline from 468.6 to 388.8 million m3 under different aridification scenarios. In other words, water resource is gradually becoming a rare resource restricting regional sustainable development. Furthermore, the results show that, under the pressure of population growth and economic development, the construction and traffic land will expand obviously and the conflict between cultivated land and construction and traffic land will be prominent. In all, in the future development, such issues as how to arrange land use structure and pattern rationally, and how to adapt to the pressures of climate change and socio-economic development together will be the main problems which would be faced and should be solved in the regional sustainable development in northern China.

DOI

[11]
IPCC (Intergovernmental Panel on Climate Change), 2007. Summary for policy-makers. In: Climate Change 2007: synthesis report. Contribution of Working Groups I, II and III to the Fourth Assessment Report of the Intergovernmental Panel on Climate Change. London: Cambridge University Press.

[12]
IPCC (Intergovernmental Panel on Climate Change), 2012. Summary for policy makers. Food security and food production systems. A Special Report of Working Groups I and II of the Intergovernmental Panel on Climate Change. London: Cambridge University Press.

[13]
Li Maosong, Li Sen, Li Yuhui, 2003. Studies on drought in the past 50 years in China.Chinese Journal of Agrometeorology, 24(1): 6-9. (in Chinese)Based on the statistical data of drought in China in the last 5 decades (1950 - 2000), the characteristics of occurrence and development of drought were studied. The drought-occurred areas and drought-induced disaster areas had been increasing in the latter 50 years of 20th century. Ratio between drought-induced disaster areas and drought-occurred areas had an increased trend. The drought occurred in China in 2000 was the most serious one since 1949, while the drought-occurred areas and drought-induced disaster areas reached at 40.5 million haand 26.8 million ha respectively. More than 60% of the drought-occurred areas and drought-induced disaster areas occurred in the Huang-Huai-Hai Region and the Middle and Lower Reaches of Yangtze River, which were the two most drought-induced disaster regions in China. According to the research results on drought prediction, the possibilities of drought occurrence in the future were analyzed and some precautions against drought were recommended.

[14]
Li Xinzhou, Liu Xiaodong, Ma Zhuguo, 2004. Analysis on the drought characteristic in the main arid regions in the world since recent hundred-odd years.Arid Zone Research, 21(2): 97-103. (in Chinese)There are many criterions for judging drought degrees, such as the precipitation, humidity index, actual evapotranspiration and soil moisture content. Along with the increase of content of carbon dioxide and other greenhouse gases in atmosphere, the air temperature and the evapotranspiration are increased, thus the droughts occur more frequently. The drought pattern and its trend may be changed along with the increase of human activities. Therefore, it is necessary to analyze the drought characteristics in the main arid regions in the world. This paper analyzes the change trend of Palmer Drought Severity Index (PDSI) and the possible response of drought change rate to global warming in the main arid regions in the world since recent hundred odd years by using the data of Palmer Drought Severity Index of the global grids of 2.5lat.2.5lon. during the period of 1860-1995 and by calculating the PDSIs in the arid and semiarid regions in China during the period of 1951-2002 with the amended PDSI software. The results show that the climate has been in an obvious drying trend in the main arid regions in South America, South Africa, North America, Central Asia and northwest China except the arid regions in Australia and North Africa since recent hundred odd years, and the occurring frequency of drought years has been higher during the global warming periods. In China, the climate in the semiarid regions has become drier but the drought degree in the arid regions has mitigated and even reversed since recent 52 years. The study reveals that the shortage of water resources in the semiarid and arid regions should be paid great attention to under global warming.

DOI

[15]
Liu Huamin, Wang Lixin, Yang Jieet al., 2012. Influence of climate change on farming and grazing households and its adaptation: A case study in Uxin Banner in Inner Mongolia.Resources Sciences, 34(2): 248-255. (in Chinese)Meteorological observations show that Uxin Banner,situated in Ordos City,Inner Mongolia,has experienced a rising trend in annual mean temperature and strong rainfall variability during past decades,with an increase in drought frequency.Based on methods of questionnaire survey,semi-structured interview,and mathematical statistics,farming and grazing households in Uxin Banner were interviewed in 2009 concerning their perceptions on climate change, quantification of the influence on their livelihoods,the major methods used by farmers and herders to adapt to climate change,and factors affecting their choice of methods and the barriers to adaptation.Results are given as follows.1)Decreased rainfall and rising temperature were generally recognized across the agricultural and animal husbandry areas.Drought was found to be the most recognized meteorological disaster affecting the livelihoods of farmers and herders in Uxin Banner,followed by rising temperature and increasing sand wind.Most of respondents believe that droughts lead to poor growth and declined production.Over the grassland area,77.6% of herders interviewed have artificially sown pastures in their families for bad grass and decreased production of natural grassland.Almost all artificially sown pastures are irrigated.In agricultural areas,irrigation was not practiced before 1982 for high rainfall and shallower ground water. Irrigated agriculture has emerged as a result of decreased rainfall and increased droughts since 2000;2)Different areas differ in their vulnerability to the impacts of climate variability.Being faced with increased droughts and large natural grassland areas,the herders do not know exactly how to adapt to climate change except irrigating artificial grasslands more times.Grazing households are therefore more vulnerable compared with their counterparts in the agricultural areas;3)The major methods used by farmers and herders to adapt to climate change are digging wells,loans,and seeking other work.The respondents of the two areas take a positive approach to coping with current and future climate changes,but all the measures lead to increases in production expenditure;4)The major barriers preventing farmers and herders from taking adaptation measures are lack of money and lack of technology and water shortage.A series of adaptation measures taken by the herders,farmers,and related government departments are less than satisfactory to deal with long-term climatic change.In the two areas,most of the respondents consider that they need more capital investment in production inputs(e.g.,fodder,seeds,pesticides,fertilizer,and electricity fees),and more enrichment projects can be provided by governments,guiding people to make more money by their own efforts.

DOI

[16]
Liu Xiaoying, Lin Erda, 2004. Impact of climate change on water requirement of main crops in North China.Journal of Hydraulic Engineering, (2): 77-87. (in Chinese)This paper examined the impact of given temperature scenario on water requirment of the main crops in North China. It shows that climate change will have great impact on water requirement of winter wheat, followed by cotton, and the least impact on summer maize. It indicates that winter wheat shows poorly in adapting the future climate change. Contrarily, summer maize and cotton show relatively adaptability to the climate. The magnitude of impact is spatial dependent. Climate change will have the greates impct on crops in Jinan, Shangdong Province and will have the least impact on crops in Taiyuan, Shanxi Province. According to the current planting planning in North China, the given temperature scenario will cause an additional water requirement of 1.47×10~(9)~19\^1×10~9m~3 for winter wheat,5\^87×10~8~68\^6×10~8m~3 for summer maize and 1\^35×10~8~16\^5×10~8m~3 for cotton, making the situation of water shortage more severe.

DOI

[17]
Liu Yansui, Liu Yu, Guo Liying, 2010. Impact of climatic change on agricultural production and response strategies in China. Chinese Journal of Eco-Agriculture, 18(4): 905-910. (in Chinese)

DOI

[18]
Lu Hongjian, Mo Xingguo, Hu Shi, 2010. Spatiotemporal variation characteristics of meteorological droughts in North China Plain during 1960-2009. Journal of Natural Disasters, 21(6): 72-82. (in Chinese)North China Plain(NCP),one of most vulnerable climatic region in the world,located in the mainland monsoon circulation of Eastern Asian,severely and repeatedly suffers from drought hazards.In this paper,according to daily meteorological data of 60 stations from 1960 to 2009,and based on the modified Palmer drought severity index(PDSI),the M-K detecting method and the EOF analysis method,the spatial and temporal variations characteristics of meteorological drought of NCP was studies.The NCP was divided into three sub-regions(A,B and C,respectively) according to the rainfall contours of 600 mm and 750 mm.It is found that droughts happening in NCP could be characterized well by the PDSI index,and usually last for more than two years,not only going through one season after another,but also with significant inter-annual and inter-decadal variations.Moreover,there are two leading patterns of the spatial distributions: severity and duration of drought always increase from south and southeast to north and northwest.Droughts in district A are the most serious,and increase significantly with an abrupt change at about 1983,while droughts in district B also have a remarkable increase since 1970s which last for a two-decade dry spell.However,the drought frequencies of C-subregion drop down gradually during last 50 years with the year of 1997 of abrupt change point.

DOI

[19]
Ma Z G, Fu C B, 2006. Some evidence of drying trend over northern China from 1951 to 2004.Chinese Science Bulletin, 51(23): 2913-2925.The surface wetness index, Palmer drought sererity index and the retrieval of soil moisture over China were calculated using monthly precipitation and monthly mean surface air temperature. Based on the contrast analysis of the variation of the above three indices and precipitation, the dry/wet spatio-temporal pattern of northern China in the last 54 years was revealed, and the evidence of drying trend over northern China was analyzed, especially. The results show the following four facts: (1) The drying trend is the main characteristic of the eastern part of Northwest China and the central part of North China since the 1980s and it was enhanced in the last 15 years mainly due to the precipitation decrease and the temperature increase; (2) During the last 54 years, there was only one dry/wet shift at the interdecadal scale occurring in the eastern part of Northwest China and the central part of North China in the late 1970s, which was related to 1977/1978 global abrupt change, whereas there were three shifts in Northeast China, one was in the mid 1990s and the other two were in 1965 and 1983, respectively; (3) Unlike the variation trend of other subregions of northern China, the western part of Northwest China is currently located in a relatively wetting period, which is weak-ened due to the temperature increase; (4) The extreme drought frequency is obviously increasing in the eastern part of Northwest China, the central part of North China and Northeast China since the 1980s, which is closely related to the precipitation decrease and temperature increase in these subregions.

DOI

[20]
Ministry of Water Resources (MWR), P.R. China, 2010. Bulletin of Flood and Drought Disaster in China. (in Chinese)

[21]
Pan Jiahua, Zheng Yan, 2010. Analytical framework and policy implications on adapting to climate change.China Population Resources and Environment, 20(10): 1-5. (in Chinese)First,based on the extensive literature review on the adaptation research,this paper proposes a basic analytical framework for the adaptation to climate change,which theorizes that considoring the different needs at different phases of economic and social development,it is important to discriminate the developmental adaptation from the incremental adaptation.This paper further suggests that three adaptation methods,engineering adaptation,technical adaptation as well as institutional adaptation,should be actopted to increase our adaptive abilities.Incremental adaptation means additional input required of by emerging risks under current circumstances.This type of adaptation is purposefully designed to meet the demands made by risks related to climate change when the basic needs concerning social development have been achieved.The developmental model is created to solve the problem of insufficient inputs so as to prepare ourselves to cope with various types of climate-related risks.The developmental model is particularly suitable in places where the economy is underdeveloped and social systems are incapable of dealing with conventional risks.These places should engage in collaborative development and in the meantime,give the fullest consideration to the climate-related risks.Next,this paper provides a detailed analysis of the four steps in regards to adaptation.The first step is to evaluate the climate risks and the related vulnerability of measures.The second step is to formulate feasible adaptation policies.The third step is to choose the appropriate adaptation measures.The last step is to advocate the "exemplar" adaptation measures such as presenting the analytical methods,evaluating vulnerability,socioeconomic impacts as well as the cost-benefit analysis,etc.Finally,based on the basic needs concerning climate change in China and the areas which need to receive urgent consideration such as agriculture,water resources,public health,coastal areas,etc.,this paper states a series of policy suggestions,including developing adaptation technologies in agriculture,improving management of important river valleys,monitoring health risks as well as providing calamity-related insurance,et al.

DOI

[22]
Qin Dahe, 2014. Climate change science and sustainable development.Progress in Geography, 33(7): 874-883. (in Chinese)Since the Fourth Assessment Report(AR4) was released by the Intergovernmental Panel on Climate Change(IPCC) in 2007, new observations have further proved that the warming of the global climate system is unequivocal. Each of the last three successive decades before 2012 has been successively warmer at global mean surface temperature than any preceding decade since 1850. 1983-2012 was likely the warmest 30-year period of the last 1400 years. From 1998 to 2012, the rate of warming of the global land surface slowed down, but it did not reflect the long- term trends in climate change. The ocean has warmed, and the upper 75 m of the ocean warmed by more than 0.11 per decade since 1970. Over the period of 1971 to 2010, 93% of the net energy increase in the Earth's climate system was stored in the oceans. The rate of global mean sea level rise has accelerated, which was up to 3.2 mm yr-1between 1993 and 2010. Anthropogenic global ocean carbon stocks were likely to have increased and caused acidification of the ocean surface water. Since 1971, the glaciers and the Greenland and Antarctic ice sheets have been losing mass. Since 1979, the Arctic sea ice extent deceased at 3.5% to 4.1%per decade, and the Antarctic sea ice extent in the same period increased by 1.2% to 1.8% per decade. The extent of the Northern Hemisphere snow cover has decreased. Since the early 1980s, the permafrost temperatures have increased in most regions. Human influence has been detected in the warming of the atmosphere and the ocean,changes in the water cycle, reductions in snow and ice, global mean sea level rise, and changes in climate extremes. The largest contribution to the increase in the anthropogenic radiative forcing was by the increase in the atmospheric concentration of CO2since 1750. It led to more than half of global warming since the 1950s(with95 % confidence). It is predicted using Coupled Model Intercomparison Project Phase 5(CMIP5) and Representative Concentration Pathways(RCPs) that the global mean surface temperature will continue to rise for the end of this century, the frequency of extreme events such as heat waves and heavy precipitation will increase, and precipitation will present a trend of "the dry becomes drier, the wet becomes wetter". The temperature of the upper ocean will increase by 0.6 to 2.0compared to the period of 1986 to 2005, heat will penetrate from the surface to the deep ocean which will affect ocean circulation, and sea level will rise by 0.26 to 0.82 m in 2100.Cryosphere will continue to warm. To control global warming, humans need to reduce the greenhouse gas emissions. If the increase in temperature is higher than 2 than before industrialization, the mean annual economic losses worldwide will reach 0.2% to 2.0% of income, and cause large-scale irreversible effects, including death,disease, food insecurity, inland flooding and water logging, and rural drinking water and irrigation difficulties that affect human security. If taking prompt actions, however, it is still possible to limit the increase in temperature within 2. To curb the gradually out-of-control global warming and achieve the goal of sustainable development of the human society, global efforts to reduce emissions are needed.

[23]
Tian Z, Zhong H L, Sun L Xet al., 2014. Improving performance of agro-ecological zone (AEZ) modeling by cross-scale model coupling: An application to japonica rice production in Northeast China.Ecological Modelling, 290: 155-164.The challenges to food security posed by climate change require unprecedented efforts and ability to simulate and predict the interactions between crop growth dynamics, and the environment and crop management at various scales. This calls for model coupling and fusion efforts, which aims to explore the interaction of agro-ecological processes across different scales. In this research, we proposed a coupling framework between two widely used crop models, the process-based and site-specific Decision Support System for Agro-Technology Transfer (DSSAT) model, and the cropping zone centered Agro-Ecological Zone (AEZ) model, with the intention to establish a coupling procedure between them, and to consequently enhance the micro foundation and improve the performance of the AEZ model. The procedure takes three major steps: (1) derive, calibrate and validate the key cultivar parameters using DSSAT, (2) translate these cultivar parameters into AEZ eco-physiological parameters and validate them using AEZ and DSSAT, (3) apply AEZ with these enhanced eco-physiological parameters and compare the new results with the old ones. An illustrative application of this procedure to japonica rice production in Northeast China is carried out for individual year between 1980 and 1999. The application results in a significant improvement in the spatial performance of the AEZ model. Calibration of the crop genetic parameters increases regional average potential yield from 6.5t/ha, which is substantially lower than the observed yield of 7.3t/ha in 2000 to 9.3t/ha. Predicted rice planting areas using the refined AEZ parameterization expands significantly to coincide with the paddy field map of 2000 generated by remote sensing applications. Importantly, the procedure presents a convenient way to update the AEZ model with calibrated genetic parameters, which reflecting observed technological progresses at farm sites.

DOI

[24]
Tu Qipu, Deng Ziwang, Zhou Xiaolan, 1999. Study of regional characteristics on mean annual temperature variation of near 117 years in China.Journal of Applied Meteorological Science, 10(Suppl.): 34-42. (in Chinese)Based on the mean annual temperature serials of 160 stations in near 47 years, the eight subregions of annual temperature variation are categorized by using the REOF method. Eight representative long temperature time serials of 117 years are created for the eight subregions based on the long time serial data of some stations in China and adjacent countries. In the last 117 years, there is a temperature warming trend for all the I~VIII subregions. The mean annual temperature trends of China and Northern Hemisphere are 0.76℃/100a and 0.64℃/100a,respectively. There is a high correlation between smoothed serials of China and Northern Hemisphere with a coefficient of 0.93. It shows that the difference of temperature variation is mainly in interannual change.

[25]
UNDP (United Nations Development Programme), 2004. A global report: Reducing disaster risk: A challenge for development, New York. Available at www.undp.org/cpr/bcpr.

[26]
Wang Y J, Huang J K, Wang J X, 2014. Household and community assets and farmers’ adaptation to extreme weather event: The case of drought in China.Journal of Integrative Agriculture, 13(4): 687-697.

DOI

[27]
Wang J X, Huang J K, Yang J, 2014. Overview of impacts of climate change and adaptation in China’s agriculture.Journal of Integrative Agriculture, 13(1): 1-17.

DOI

[28]
Wang J X, Mendelsohn R, Dinar Aet al., 2010. How Chinese farmers change crop choice to adapt to climate change.Climate Change Economics, 1(3): 167-185.A multinomial logit model is estimated across the crop choices of a sample of thousands of Chinese farmers. As temperatures warm, farmers are more likely to choose cotton and maize, but less likely to choose soybeans, and vegetables. As precipitation increases, farmers are more likely to choose wheat and less likely to choose vegetables and potatoes. We simulate how crop choice outcomes might change using the empirical results and a set of climate change predictions for 2100. The magnitude of the change is sensitive to the climate scenario and to the seasonal and regional variation of climate change predictions within China.

DOI

[29]
Wang J X, Yang Y, Huang J Ket al., 2015. Information provision, policy support, and farmers’ adaptive responses against drought: An empirical study in the North China Plain.Ecological Modelling, 318: 275-282.As an important agricultural production region in China, the North China Plain (NCP) is an ecologically vulnerable region that frequently is hit by drought. Faced with drought and other extreme climate events, policy makers have given top priority to the formulation and implementation of adaptation policies. This paper assessed the effectiveness of adaptation policies, including the provision of early warning information and policy supports, on farmers- adaptive decisions regarding the planting of the wheat crop in the NCP. Based on a unique dataset from a large-scale village and farm survey in five provinces in the NCP, an econometric model of farmers- adaptation practices is estimated. Results show that when faced with a more severe drought, farmers change their management practices to mitigate its effects by adjusting seeding or harvesting dates and enhancing irrigation intensity. The provisions of early warning and prevention information and policy supports against drought facilitate farmers to make farm management adaptations. However, the effectiveness of early warning and prevention information or policy supports differs by their provision channels or types. The findings of this study have policy implications in coping with the rising frequency and seriousness of extreme weather events in China as a whole and in ecologically more vulnerable NCP in particular.

DOI

[30]
Weng Zhenlin, 2008. The application research advance and review of the farmer theory. Issues in Agricultural Economy, (8): 93-99. (in Chinese)

[31]
World Bank, 2010. Economics of Adaptation to Climate Change: Synthesis Report..

[32]
Xiao D P, Tao F L, 2014. Contributions of cultivars, management and climate change to winter wheat yield in the North China Plain in the past three decades.European Journal of Agronomy, 52(1): 112-122.The detailed field experiment data from 1980 to 2009 at four stations in the North China Plain (NCP), together with a crop simulation model, were used to disentangle the relative contributions of cultivars renewal, fertilization management and climate change to winter wheat yield, as well as the relative impacts of different climate variables on winter wheat yield, in the past three decades. We found that during 1980–2009 cultivars renewal contributed to yield increase by 12.2–22.6%; fertilization management contributed to yield increase by 2.1–3.6%; and climate change contributed to yield generally by 613.0–3.0%, however by 6115.0% for rainfed wheat in southern part of the NCP. Modern cultivars and agronomic management played dominant roles in yield increase in the past three decades, nevertheless the estimated impacts of climate change on yield accounted for as large as 6123.8–25.0% of observed yield trends. During the study period, increase in temperature increased winter wheat yield by 3.0–6.0% in northern part of the NCP, however reduced rainfed winter wheat yield by 9.0–12.0% in southern part of the NCP. Decrease in solar radiation reduced wheat yield by 3.0–12.0% across the stations. The impact of precipitation change on winter wheat yield was slight because there were no pronounced trends in precipitation. Our findings highlight that modern cultivars and agronomic management contributed dominantly to yield increase in the past three decades, nevertheless the impacts of climate change were large enough in some areas to affect a significant portion of observed yield trends in the NCP.

DOI

[33]
Xiong Wei, Xu Yinlong, Lin Erda, 2005. The simulation of yield variability of winter wheat and its corresponding adaptation options under climate change.Chinese Agricultural Science Bulletin, 21(5): 380-385. (in Chinese)The changed climate resource due to the climate change will impact the agricultural production in China in future. Based on the emission scenarios of greenhouse gases - A2 and B2, and by using RCM (Regional Climate Model)- PRECIS and CERES-Wheat model, the paper simulated the impacts of climate change on the winter wheat yield variability at North China, and simulated the performance of two adaptation options under climate change scenarios. The results shows: maximum yield, average yield as well as the yield variability will increase under both A2 and B2 climate change scenarios at all periods. Advancing the sowing date and changing to the middle-term cultivars can decrease the yield variability, stabilized the yield.

[34]
Yang Jianying, Mei Xurong, Yan Changronget al., 2010. Study on spatial pattern of climatic resources in North China.Chinese Journal of Agrometeorology, 31(Suppl. 1): 1-5. (in Chinese)Based on data of the Chinese Meteorological Administration(CMA) from 1961 to 2008,the geographical coordinates of 155 meteorological stations and the global digital elevation map(GTOPO30,DEM),the author analyzed the spatial pattern of averagely annual sunlight and temperature,accumulated temperature over 10℃,annual precipitation and the precipitation of the four seasons in North China and obtained the climate resources pattern map.The results showed that the annual sunshine time was higher in northern than southern.The pattern of annual average temperature and accumulated temperature over 10℃ were that south was higher than the north and the east was higher than west.The tendency of the precipitation overall pattern from the north to the south was on the increase.The precipitation of the four seasons was unusual non-uniform and mainly concentrates in the summer.Generally speaking,heat resource and precipitation in the southern region was rich.While the light resource was relatively short.Light and heat resources in the northern region of North China were adequate,but the precipitation was the key limiting factor.

[35]
Ye L M, Xiong W, Li Z Get al., 2013. Climate change impact on China food security in 2050.Agronomy for Sustainable Development, 33(2): 363-374.Climate change is now affecting global agriculture and food production worldwide. Nonetheless the direct link between climate change and food security at the national scale is poorly understood. Here we simulated the effect of climate change on food security in China using the CERES crop models and the IPCC SRES A2 and B2 scenarios including CO2 fertilization effect. Models took into account population size, urbanization rate, cropland area, cropping intensity and technology development. Our results predict that food crop yield will increase +3–1102% under A2 scenario and +402% under B2 scenario during 2030–2050, despite disparities among individual crops. As a consequence China will be able to achieve a production of 572 and 615 MT in 2030, then 635 and 646 MT in 2050 under A2 and B2 scenarios, respectively. In 2030 the food security index (FSI) will drop from +2402% in 2009 to 614.502% and +10.202% under A2 and B2 scenarios, respectively. In 2050, however, the FSI is predicted to increase to +7.102% and +20.002% under A2 and B2 scenarios, respectively, but this increase will be achieved only with the projected decrease of Chinese population. We conclude that 1) the proposed food security index is a simple yet powerful tool for food security analysis; (2) yield growth rate is a much better indicator of food security than yield per se; and (3) climate change only has a moderate positive effect on food security as compared to other factors such as cropland area, population growth, socio-economic pathway and technology development. Relevant policy options and research topics are suggested accordingly.

DOI

[36]
Zhang Guanghui, Lian Yingli, Liu Chunhuaet al., 2011. Situation and origin of water resources in short supply in North China Plain.Journal of Earth Sciences and Environment, 33(2): 172-176. (in Chinese)Based on the idea of water resources sustainable utilization,the evolution cycles of bearing capacity of water resources,water consumption for economic and social development and relation between supply and demand of water resources in the future were analyzed;the situation of water resources in North China Plain over the past 60 years was introduced,especially the characteristic of actual water consumption and the quantity of water resource and exploiting groundwater;origin of water resources in short supply in North China Plain were discussed with the trend of water consumption for regional economic and social development in the coming 10-30 years.The results showed that water scarcity were from 59.3% to 62.5% of the total water scarcity for imperfect policy,from 22.1% to 24.2% for faulty management and from 15.1% to 16.4% for rainfall decrease in North China Plain.The solutions for the above three kinds of water scarcity were different.The groundwater overexploitation could not be substantially restrained,even if 70.3脳108 m3/a of water resources transferred into North China Plain by south-to-north water diversion project.The fundamental approach for improving the groundwater overexploitation and water capacity in North China Plain were that new water source was found;domestic water and industrial consumption were strongly controlled;agricultural water decreased sharply;the structures of economic and social distribution and industry were gradually optimized;water use efficiency could be improved for irrigation agriculture.

DOI

[37]
Zhou Li, Zhou Shudong, 2012. Post-disaster adaptability to extreme weather events.China Population Resources and Environment, 22(4): 167-174. (in Chinese)Based on the provincial panel data of main grain producing areas from 1985 to 2008,this paper empirically analyzes the mechanism and performance of post-disaster adaptability to extreme weather events.The conclusion shows that Southwest,Central and South China do not adjust the agricultural structure to breeding industry after disasters;on the contrary,plant farming is revived by government supports and innovate incentives,particularly for the Southwest where less developed,stronger post-disaster adaptability is the result of lower opportunity cost of agricultural production.For the same reason,labor-transfer phenomenon occurred after floods in East China.At present,the post-disaster adaptability to extreme weather events is merely from farmers' response;therefore,the government should input more and more to promote the adaptability against meteorological disasters.

[38]
Zou Xukai, Ren Guoyu, Zhang Qiang, 2010. Droughts variations in China based on a compound index of meteorological drought.Climatic and Environmental Research, 15(4): 371-378. (in Chinese)Based on the calculation results of a Compound Index (CI) of meteorological drought,the variations in drought conditions for ten major river basins and China as a whole are investigated. In recent 60 years,a weak increasing trend of drought areas is found for the entire country. Most northern river basins of China experience upward trends of drought areas,with significant trends being found in the Songhuajiang River basin,the Liaohe River basin,and the Haihe River basin. Severe and prolonged droughts occurred in the areas of Liaohe River,Haihe River,and Yellow River basins during the periods from the late 1990s to the early 2000s. There are no significant long-term upward or downward trends in drought areas in most river basins of southern China,except for the southwestern rivers basin where a significant decreasing trend can be detected.

DOI

Outlines

/