Research Articles

Spatio-temporal evolution of drought and flood disaster chains in Baoji area from 1368 to 1911

  • WAN Honglian , 1, 2 ,
  • SONG Hailong 1, 3 ,
  • ZHU Chanchan 1 ,
  • ZHANG Beibei 1, 2 ,
  • ZHANG Mi 1
Expand
  • 1. College of Geography and Environment, Baoji University of Arts and Sciences, Baoji 721013, Shaanxi, China
  • 2. Key Laboratory of Disaster Monitoring and Mechanism Simulation of Shaanxi Province, Baoji University of Arts and Sciences, Baoji 721013, Shaanxi, China
  • 3. Suide Middle School, Suide 718000, Shaanxi, China

Author: Wan Honglian (1969-), PhD and Professor, specialized in resource development and environmental change, the disaster in history and other works of research and teaching. E-mail:

Received date: 2017-03-22

  Accepted date: 2017-05-04

  Online published: 2018-03-10

Supported by

National Natural Science Foundation of China, No.41601016

Philosophy and Social Science Research Fund in Shaanxi, No.2017E003

Fundamental Research Funds for Key Subject Physical Geography of Baoji University of Arts and Sciences

Copyright

Journal of Geographical Sciences, All Rights Reserved

Abstract

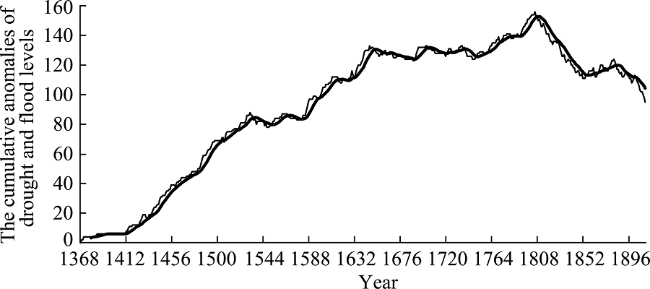
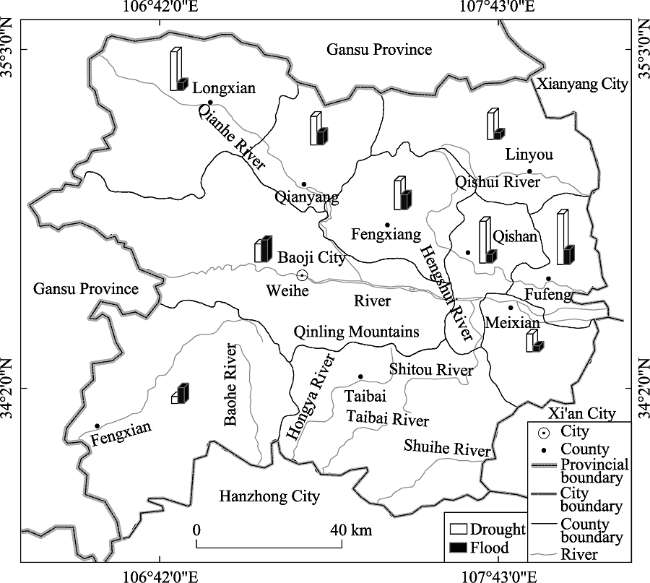
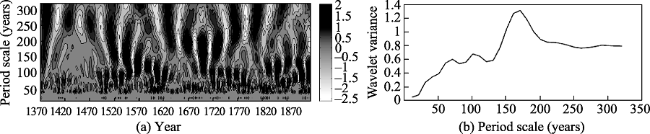
Based on the collation and statistical analysis of flood and drought information in Baoji area from 1368 to 1911, and in the context of climate change, we investigated the spatio-temporal evolution characteristics of drought and flood disaster chains in this area during the Ming and Qing dynasties using the methods of moving average, cumulative anomaly and wavelet analysis. The results are as follows: (1) We found a total of 297 drought and flood events from 1368 to 1911 in Baoji. Among these events, droughts and floods occurred separately 191 and 106 times, which accounted for 64.31% and 35.69% of the total events, respectively. (2) We observed distinct characteristics of flood and drought events in Baoji in different phases. The climate was relatively dry from 1368 to 1644. A fluctuant climate phase with both floods and droughts occurred from 1645 to 1804. The climate was relatively wet from 1805 to 1911. Moreover, we observed a pattern of alternating dry and wet periods from 1368 to 1911. In addition, 3 oscillation periods of drought and flood events occurred around 70 a, 110 a and 170 a, which corresponded to sunspot cycles. (3) We also observed an obvious spatial difference in drought and flood events in Baoji. The northern and eastern parts of Weihe River basin were regions with both frequent droughts and floods. (4) The sequential appearance of drought and flood disaster chains in Baoji from 1368 to 1911 was in response to global climate change. Since the 1760s, global climatic deterioration has frequently led to extreme drought and flood events.

Cite this article

WAN Honglian , SONG Hailong , ZHU Chanchan , ZHANG Beibei , ZHANG Mi . Spatio-temporal evolution of drought and flood disaster chains in Baoji area from 1368 to 1911[J]. Journal of Geographical Sciences, 2018 , 28(3) : 337 -350 . DOI: 10.1007/s11442-018-1476-y

1 Introduction

Drought and flood are common meteorological events, which have severe regional impacts on production, daily life and socioeconomic development. China is located in eastern Asia. The droughts and floods exhibit regionally distinct patterns of distribution, which are affected by both monsoon intensity and global climate change. Droughts and floods were collectively the worst natural disasters during the span of successive dynasties of China (Wang and Zhao, 1979; Ge et al., 2013; Xiao et al., 2015). In the context of global warming, extreme weather events have increased the frequency of droughts and floods in recent years. Therefore, a number of research areas, including identifying climate change patterns, reducing the influence of drought and flood disasters on regional development, and studying the human response to global climate change, have gradually become the hotspots and focus of academic research (Zhou, 2003; Wang et al., 2007; Xiao et al., 2014; Li and Li, 2016).
The occurrence of droughts and floods is closely linked to climate change. According to the study of Zhu (1973), at the end of the Yuan Dynasty and the beginning of the Ming Dynasty, the method of documenting climatic events shifted from “documental period” to “gazetteer period”, and the records of various disasters became more elaborate. In the same time span, China entered a cold period of 500 years called “the little ice age (LIA) of Ming and Qing dynasties”. The frequency of various natural disasters in this period also reached a historic high (Wang et al., 1998; Wang et al., 2006; Zhu, 2012), which has become a focus of research in recent years (Ye et al., 2012; Wan et al., 2017). Additionally, the sequential and adequate historical records provide us the opportunity to study the regional history of droughts and floods, and reconstruct the process of climate evolution (Bradley, 1993; Zheng et al., 1993; Shi et al., 2012). Moreover, drought and flood disasters have become important factors that impede economic development. As such, drought and flood related research has become the focus of regional disaster prediction and mitigation.
Currently, researchers have obtained fruitful results from their studies of drought and flood events in different historical periods (Lee and Zhang, 2010; Yuan et al., 2015; Pei et al., 2015; Ge et al., 2016). Zhou analyzed the spatio-temporal distribution characteristics and patterns of drought and flood events in Baoji area in the past 1500 years (Zhou, 2003a, 2003b). He found that the occurrence of droughts and floods in Baoji corresponded to global climate change, and these disasters were the regional responses to environmental changes. Wan et al. found that the occurrence of drought and flood events in Baoji in the past 1400 years primarily resulted from the combination of geographic location, abnormal climatic fluctuations and human activities, which greatly impacted the regional socioeconomic development (Wan, 2014; Wan et al., 2013, 2017). The research outcomes described above are consistent with the conclusions of drought and flood studies at larger spatial scales (Zheng et al., 1993; Lee and Zhang, 2010; Yuan et al., 2015; Pei et al., 2015), which analyzed both the disasters and their impacts. However, the relationship between regional drought and flood disaster chain and global climate change remains largely unexplored.
In this study, based on historical records of droughts and floods in Baoji from 1368 to 1911, and also in reference to the recent domestic studies of the relationship between drought and flood disasters and global climate change in 100 to 1000 year timescales (Ge et al., 2013; Zheng et al., 2014), we studied the spatio-temporal distribution and periodical change pattern of droughts and floods in Baoji during the climatic fluctuation period of the LIA of Ming and Qing dynasties using “disaster chain” as the entry point. In addition, we also discussed the relationship between regional drought and flood disaster chains and global climate change. The results of this study will provide a reference basis for the early prediction, preparedness and mitigation of drought and flood disasters in Baoji.

2 Overview of the study area

Baoji area is located in western Guanzhong region (106°18'-108°03'E and 33°35'-35°06'N). The west-to-east length is 156.6 km and the north-to-south width is 160.6 km. The 2015 total population estimate of Baoji, comprising 3 districts and 9 counties, was 3.76 million. Baoji lies in the Guanzhong Plain and is located in the upstream and midstream of Weihe River basin with the Qinling Mountains to the south, the Beishan Mountains to the north and the Guanshan Mountain to the west, belonging to the southwest Loess Plateau. The Qinling Mountains to the south of Baoji are the dividing line of southern and northern China. Northern Baoji faces the hinterland of the Loess tablelands. The interior of Baoji has intricate geological formations, and distinct topographic and geomorphologic features. Mountains, rivers and plains co-exist with mountainous and hilly landforms in predomination. In terms of climate, Baoji is located in the warm temperate and semi-humid climate zone. Local climate change is blocked by the Qinghai-Tibet Plateau, Qilian Mountains and Qinling Mountains. The spatio-temporal distribution of local precipitation varies significantly with the influence of the East Asian monsoon, Qinghai-Tibet high and western Pacific Subtropical High. The average annual precipitation is between 590 and 900 mm (BLCCC, 1998). Consequently, natural disasters have occurred frequently due to the influence of climatic conditions, topographic features and geological formations, and droughts and floods are the major form of natural disasters in this area.

3 Data sources and method

Data sources of this study are based on “The Historical Inundation and Drought of Baoji” (WCN, 1985) and “Encyclopaedia of China’s Meteorological Disasters; Shaanxi Volume” (Wen and Zhai, 2005), from which we collated the flood and drought information of Baoji using lunar calendar. Moreover, we further analyzed and verified these collected data with references, including “A Compendium of Chinese Meteorological Records of the Last 3000 Years” (Zhang, 2000), “Disaster History in Northwest China” (Yuan, 1994), “Brief Records on Historical Natural Disasters in Shaanxi” (Wang, 2002), and local chronicles of Baoji and the counties of Fengxiang, Qishan, Meixian, Fufeng, Longxian, Qianyang, Linyou, Fengxian and Taibai (CLCSSP, 1991; Baoji CCCC, 1998; Fufeng CCCC, 1993; Linyou CCCC, 1993; Longxian CCCC, 1993; Meixian CCCC, 2000; Qishan CCCC, 1992; Taibai CCCC, 1998). By this means, we removed incomplete data and improved the creditability of historical data. Additionally, for the classification of drought and flood levels in Baoji, we referred to past classifications of drought and flood levels in Baoji from Yearly Charts of Dryness/Wetness in China for the Last 500 Years Period (CMA, 1981), The Atlas of Drought and Flood Distribution over Northwest China in Past 500 Years: 1470-2008 (Bai et al., 2010; Xu et al., 2015), the national standard of Classification of Meteorological Droughts (GB/T20481-2006) and the national hydraulic industry standard of Flood Disaster Assessment (SL 579-2012). According to the descriptions of droughts and floods in our data sources, we classified droughts and floods into 7 levels based on the standards described in Table 1, including catastrophic flood, severe flood, mild flood, normal, mild drought, severe drought and catastrophic drought (Bai et al., 2010; Xu et al., 2015). Furthermore, we processed and analyzed the drought and flood levels using statistical analysis software, ArcGIS and MATLAB, and we also investigated the drought and flood disaster chains in Baoji and the response to climate change during the Ming and Qing dynasties.
Table 1 The classification standard of drought and flood events
Event level Event type Classification standard
1 Catastrophic flood The flood lasted for a long time and affected most of the area. Had a remarkable effect on local production activities and living conditions, and caused casualties.
2 Severe flood The flood affected a large portion of the area, resulting in submerged agricultural lands, damaged crops, reduced production, destroyed housing, and prompted tax exemption.
3 Mild flood The flood slightly affected local living conditions, crop production and socioeconomic development.
4 Normal No droughts or floods were recorded.
5 Mild drought The drought affected sowing and reduced crop production, and resulted in food shortages and high food prices.
6 Severe drought The drought caused starvation, locust infestation and severe pandemic, forced people to consume wood bark and grass, and led to extremely high food prices, relocation of people and even casualties.
7 Catastrophic drought The drought affected most of the area, resulting in nearly no harvest, extreme poverty, severe food shortages, cannibalism, frequent sightings of starved corpses and numerous casualties.

4 Results and analysis

4.1 The inter-annual variation in drought and flood characteristics

We statistically analyzed the drought and flood characteristics in Baoji based on a period of every 50 years. The results showed that in the Ming and Qing dynasties, drought and flood events occurred 297 times in Baoji, and the average frequency was 1.83 years. These events occurred more frequently in the middle and late stages of the study period, and the frequency showed an upward trend. Moreover, we conducted cumulative anomaly analysis of the drought and flood levels in Baoji from 1368 to 1911. The moving average of 11 years was selected to match the periodic fluctuations in solar activity that follows the approximate 11-year cycle (Figure 1). The characteristics of drought and flood events in Baoji in different phases are presented in Figure 1. In the years between 1368 and 1644, the curve of the anomalies slopes upward. We observed two sharp rises spanning 1368-1530 and 1581-1644, and one gradual rise in 1531-1580, which indicates that droughts occurred more frequently than floods. From 1645 to 1804 was a phase marked by fluctuant climate with both floods and droughts, indicating unstable climate and abnormal patterns of droughts and floods. From 1805 to 1911, the curve slopes downward. We observed a sharp drop from 1868 to 1911, and a relatively flat curve from 1854 to 1867, which indicate that floods occurred more frequently than droughts in this phase. Overall, from 1368 to 1911 in Baoji, drought and flood events showed considerable fluctuations, and we observed a pattern of alternating dry and wet periods. In the whole study period, droughts occurred more frequently in the early and middle stages, and floods occurred more frequently in the late stage.
Figure 1 The anomalies of drought and flood levels in Baoji area from 1368 to 1911

4.2 The seasonal characteristics of drought and flood changes

We divided the four seasons according to the lunar calendar as follows: spring from January to March (March to May in Georgian calendar), summer from April to June (June to August in Georgian calendar), fall from July to September (September to November in Georgian calendar) and winter from October to December (December to following February in Georgian calendar). Based on our data sources, 87 drought and flood events were recorded without seasonal information, and with seasonal information there were 210 drought and flood events recorded, which included 128 droughts and 82 floods.
In Baoji, drought and flood events usually spanned a single season. However, we also found instances where continuous droughts and floods spanned two to four seasons in total (Figure 2). In terms of drought and flood disasters in Baoji, droughts were dominant and typically occurred within a single season. In particular, droughts occurred most frequently in summer with a total of 41 events. The two-season droughts mainly continued from summer into fall with a total of 20 events. We also observed that some droughts continued for three or four seasons. Meanwhile, the majority of floods occurred within a single season. Fall had the highest frequency of floods with a total of 35 events. The two-season floods mainly continued from summer into fall with a total of 9 events. We did not find historical records of floods that lasted three or four seasons. From the above analysis, the droughts and floods in Baoji from 1368 to 1911 mainly occurred during summer or fall months or lasted from summer into fall, and the seasonal distributions of droughts and floods were associated with summer monsoon activities. Baoji is located in the inland monsoon boundary zone. Under the influences of the East Asian monsoon, Indian Low and Western Pacific Subtropical High, warm and rainy weather alternates with hot and dry weather in summer. Under the influences of the Qinghai-Xizang high and Siberian high, the weather is cold and dry in winter. Because spring and fall are the transition periods between winter and summer monsoons, precipitation in these two seasons is highly unstable, which also primarily accounts for the high frequency of droughts and floods in summer and fall seasons, and causes the average annual precipitation to fluctuate between 590 and 900 mm.
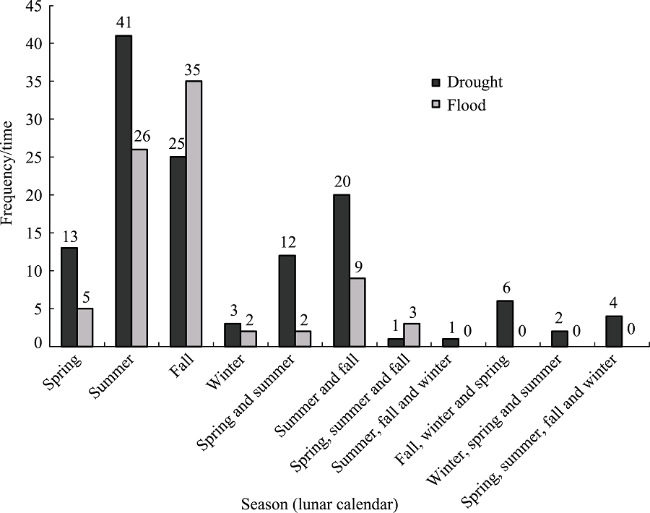
Figure 2 The seasonal distribution of droughts and floods in Baoji area from 1368 to 1911

4.3 The spatial characteristics of changes in droughts and floods

The Baoji area includes 3 districts and 9 counties (Wan et al., 2013, 2014, 2016, 2017). The drought and flood information of Taibai County was not included because the county was established in 1961. Through collating all drought and flood events based on where the disasters occurred, we found that the distribution of drought or flood varies in different counties of Baoji from 1368 to 1911 (Figure 3).
Figure 3 The spatial distribution of droughts and floods in Baoji area from 1368 to 1911
From the distribution of droughts and floods in every county, Fufeng County had the most droughts with 51 events. Qishan and Longxian counties had the 2nd and 3rd most droughts, with 42 and 39 events, respectively. On the contrary, Fengxian County located to the south of Qinling Mountains had the least droughts with only 7 events. Meanwhile, Baoji City had the most floods with 22 events and Fengxian County had the 2nd most floods with 16 events. With only 6 floods, the least number of floods occurred in Meixian County. In terms of the entire Baoji area, droughts were mainly distributed in the region to the north of the Qinling Mountains with the distinction that more droughts occurred in the north than in the south. Droughts occurred frequently in the 6 counties located in the Qianhe and Qishui river basins in the northern Weihe River basin, which accounted for 86.91% of the total number of droughts in the entire Baoji. Meanwhile, floods mainly occurred in the southern Weihe River basin and eastern Baoji area, including Baoji City, and Fengxian, Fufeng and Fengxiang counties and accounted for 64.15% of the total number of floods in Baoji. As such, the northern and eastern parts of the Weihe River basin (the midstream and downstream of Weihe River), and the midstreams and downstreams of Qian and Qishui river basins, had frequent occurrences of both droughts and floods in Baoji from 1368 to 1911.

4.4 The periodical characteristics of droughts and floods

We performed wavelet analysis of the series of drought and flood levels in Baoji during the 544-year period in the Ming and Qing dynasties using MATLAB (Figure 4), and we also conducted correlation analysis of drought and flood cycles. From the real wavelet analysis (Figure 4a), we found an obvious pattern of alternating droughts and floods in Baoji from 1368 to 1911, where a flood followed a drought, and vice versa. Meanwhile, we demonstrated that the drought events were still dominant in this period, which is consistent with the conclusions from studies of Zhu (1973) and Zhu et al. (1998). They also posited that the climate in China was dry during the Ming and Qing dynasties, and during the LIA of Ming and Qing dynasties. The wavelet variance analysis (Figure 4b) showed that there were 3 oscillation periods around 60-80 a, 95-115 a, and 160-180 a, and the oscillation period around 160-180 a was most intense. Our findings match well with the research of Li and Zhao (2008), which demonstrated that there was a period around 168 a for the drought and flood disasters in northwestern China. In addition, our findings also corresponded with Xu and Jiang’s research (1990), which showed that the sunspot cycles were around 5.5 a, 11 a, 17 a, 80 a, and 178 a, indicating that the drought and flood disasters in Baoji were very closely associated with sunspot cycles.
Figure 4 Real wavelet and wavelet variance analyses of droughts and floods in Baoji area from 1368 to 1911

4.5 The characteristics of the change in drought and flood levels

According to the classification standard of droughts and floods in Table 1, we found that a total of 297 drought and flood events occurred in Baoji from 1368 to 1911. There were 191 droughts and 106 floods, which accounted for 64.31% and 35.69% of the total events, respectively. Droughts occurred more frequently than floods. There were 31 catastrophic floods, 39 severe floods, 36 mild floods, 247 normal weather conditions, 68 mild droughts, 101 severe droughts and 22 catastrophic droughts, which respectively corresponded to 5.7%, 7.17%, 6.62%, 45.4%, 12.5%, 18.57% and 4.04% of the total events (Table 2). Overall, the higher frequency of droughts than floods indicates a relatively dry climate in Baoji from 1368 to 1911. In addition, we noted a pattern of continuity between droughts and floods. Namely, an extreme flood event was always followed by an extreme drought event, and vice versa. This alternating pattern continuously existed in the flood and drought disaster chains in Baoji from 1368 to 1911.
Table 2 The numbers and percentages of drought and flood events in Baoji area in 544 years
Year Frequency
(%)
Level
Level 1
Catastrophic flood
Level 2
Severe flood
Level 3
Mild flood
Level 4
Normal
Level 5
Mild drought
Level 6
Severe drought
Level 7
Catastrophic drought
Frequency
(%)
Frequency
(%)
Frequency
(%)
Frequency
(%)
Frequency
(%)
Frequency
(%)
Frequency
(%)
1368-1420 8 (2.69) 0 (0) 0 (0) 0 (0) 45 (84.91) 4 (7.55) 4 (7.55) 0 (0)
1421-1470 29 (9.76) 0 (0) 3 (6) 3 (6) 21 (42) 11 (22) 10 (20) 2 (4)
1471-1520 25 (8.42) 1 (2) 2 (4) 0 (0) 25 (50) 10 (20) 8 (16) 4 (8)
1521-1570 22 (7.41) 4 (8) 2 (4) 1 (2) 28 (56) 2 (4) 11 (22) 2 (4)
1571-1620 23 (7.71) 1 (2) 1 (2) 4 (2) 27 (54) 1 (2) 9 (18) 7 (14)
1621-1670 40 (13.47) 1 (2) 5 (10) 9 (18) 10 (20) 5 (10) 16 (32) 4 (8)
1671-1720 16 (5.39) 0 (0) 5 (10) 2 (4) 34 (68) 2 (4) 6 (12) 1 (2)
1721-1770 23 (7.74) 2 (4) 4 (8) 1 (2) 27 (54) 7 (14) 9 (18) 0 (0)
1771-1820 35 (11.78) 7 (14) 5 (10) 1 (2) 15 (30) 9 (18) 13 (26) 0 (0)
1821-1870 36 (12.12) 7 (14) 3 (6) 7 (14) 14 (28) 10 (20) 8 (16) 1 (2)
1870-1911 40 (13.47) 8 (19.51) 9 (21.95) 8 (19.51) 1 (2.44) 7 (17.07) 7 (17.07) 1 (2.44)
A total of 544 a 297 (100) 31 (5.7) 39 (7.17) 36 (6.62) 247 (45.4) 68 (12.5) 101 (18.57) 22 (4.04)

5 Discussion

5.1 The causes of floods and droughts

Baoji area is located in western Guanzhong Plain and has distinct climate, temperature and precipitation characteristics due to the influences of intricate topographic and geomorphologic features, and monsoons. Temperature and precipitation changes in this area are uneven at both spatial and temporal scales. Ren (1986) reported that the periodic climate change in China was not only related to the gravitation generated by the exceptional alignment of planets in our solar system, but it was also consistent with the periodic temperature oscillations of the Northern Hemisphere, which are induced by the Pacific Decadal Oscillation (PDO) phenomenon. PDO, which presents above the Pacific Ocean with alternating warm and cool phases, can potentially aggravate natural disasters when it meets El Niño and La Niña. The PDO has greatly impacted the periodic climate change in China and particularly in Baoji, resulting in the uneven distribution of flood and drought events in this area. This uneven distribution is basically constant with monsoon activities, which indicates a good correspondence between floods and droughts in Baoji and global climate change.
According to previous studies at a regional scale, the temperature change and the variation in dryness and wetness greatly affected precipitation during the last 2000 years (Ge et al., 2012, 2014, 2015; Zheng et al., 2005, 2010; Fang et al., 2014). Notably, although the Northern Hemisphere entered the cold stage during the Ming and Qing dynasties, climate change in China exhibited instability under the joint influences of location, geographic environment and monsoon, which consequently resulted in the alternating pattern of flood and drought events during this period. Moreover, the climate fluctuated from wetness to dryness during the Ming Dynasty, and the worst droughts since the Qin and Han dynasties had occurred in the late Ming Dynasty (Ge et al., 2012, 2014, 2015; Zheng et al., 2005, 2010; Fang et al., 2014). In the Qing Dynasty, climate was generally wet but with significant fluctuation. The uneven climate change induced flood and drought events profoundly impacted the socioeconomic development in China. In Baoji, drought and flood events occurred alternately from 1368 to 1911, which was linked to the regional terrain and the factors affecting monsoon activities in this period. The general circulation of the atmosphere, sunspot activities and regional centralization of human activities aggravated the frequency of drought and flood events in this period. Since the 1760s, under the influence of industrial revolution, human activities have led to the deterioration of the global climatic environment. Global temperature has risen continuously, climatic environment change has become unpredictable, and extreme flood and drought events have occurred frequently.

5.2 The changes in drought and flood disaster chains from 1368 to 1911

In 1987, Chinese seismologist Guo Zengjian firstly proposed the concept of “disaster chain”, which describes the phenomenon that a series of disasters occur successively (Guo et al., 2007). Since then, this concept has been gradually introduced and applied to other disasters. Drought and flood disaster chain refers to the alternating occurrence of droughts and floods, which results from the interactions among regional disaster-prone environment, disaster-inducing factors, and regional society and economy. Drought and flood disaster chains can not only lead to regional agricultural production loss, but also greatly impact regional socioeconomic development, and even cause social instability and casualties. Baoji is located in the monsoon boundary zone, and the climate instability of this area may cause variations in temperature and precipitation, and further change regional climate (Fang et al., 2015). The cold-dry and warm-wet change in water-heat regime is mainly affected by monsoon. Regional precipitation exhibits remarkable increases in the years with relatively strong summer monsoon activities, and conversely, decreases with weaker summer monsoon activities. In the Ming and Qing dynasties, the drought and flood disaster chains in Baoji exhibited an obvious alternating pattern. Drought was the dominant type of disaster before 1644, the frequencies of droughts and floods were balanced from 1645 to 1804, and flood became dominant from 1805 to 1911. Although the occurrence of droughts and floods in Baoji had distinct characteristics in each phase, a common phenomenon we observed was that a flood event usually preceded or followed a drought event, and vice versa. One such example is the extreme drought events that occurred from 1632 to 1635 and from 1638 to 1642, and the widespread starvation and cannibalism during these droughts were historically recorded. Furthermore, we found that extreme flood events occurred from 1630 to 1631 and from 1647 to 1655, which respectively preceded and followed the extreme drought events, and the crop loss and cannibalism during these floods were also historically recorded. In general, the drought and flood disaster chain is a real and subjective phenomenon, and the primary reason underlying this particular disaster chain is the conservation, conversion and transmission, and redistribution of energy in drought and flood disasters (Guo et al., 2007; Yang, 2008).

5.3 The relationship between the drought and flood disaster chain and climate change

Under the influence of the little ice age of Ming and Qing dynasties, the climate obviously became cold in eastern China, but the climate in western China did not change significantly (Zheng et al., 2010). Moreover, the climate change in various small areas exhibited various characteristics (Zhang et al., 2007; Zhang et al., 2008; Yang et al., 2014; Ge et al., 2014). In the region from the eastern part of the Qilian Mountains and the eastern edge of the Qaidam Basin to the western side of the Qinling Mountains, the climate was wet in the 14th century, from the second half of the 16th century to the beginning of the 17th century, and in the second half of the 18th century. On the contrary, the climate in the above area was dry in other periods, and the driest periods appeared in the 15th century and from the late 17th century to the beginning of the 18th century (Ge et al., 2012, 2014, 2015). Zhu et al. (1998) studied the historical climate change in Guanzhong region, and they reported that the climate was relatively warm in the second half of the 14th century, from the 1500s to the 1570s, in the 18th century and the first half of the 19th century. However, the climate was very cold in the second half of the 15th century, from the 1580s to the 1630s, in the second half of the 17th century and the second half of the 19th century. From the second half of the 14th century to the beginning of the 20th century, the global climate was in a little ice age, and accordingly, the climate in China was relatively dry and cold (Zhu, 1973; Zhu et al., 1998). Although the climate change exhibited some differences at small spatial scales, abundant precipitation usually occurred regionally in the warm period, and less precipitation occurred regionally in the cold period. In the period with abnormal climate fluctuations, extreme climate disasters occurred frequently (Yuan et al., 2015; Zhu et al., 1998; Zheng et al., 2005, 2010; Fang et al., 2014). Since the 1470s, the changes in flood and drought levels in China and Guanzhong region that were reported in the above studies are consistent with those recorded in Yearly Charts of Dryness/Wetness in China for the Last 500 Years Period (CMA, 1981) and The Atlas of Drought and Flood Distribution over Northwest China in Past 500 Years: 1470-2008 (Bai et al., 2010).
In the aforementioned climate change scenario, the flood and drought levels in Baoji during the Ming and Qing dynasties were smoothed using an 11-year moving average filter (Figure 5), which showed a good correspondence with the flood and drought level changes in Guanzhong region. In Figure 5, an upward curve indicates that more droughts occurred compared to floods, and conversely, a downward curve indicates that more floods occurred. The curve above the normal level line indicates a relatively dry climate, while the curve below the normal level line indicates a relatively wet climate. More droughts occurred in Baoji and the overall climate was relatively dry before the 16th century, from the end of the 16th century to the first half of the 17th century, and in the second half of the 18th century, indicating a relatively cold and dry climate in Baoji during these periods. Meanwhile, more floods occurred in Baoji and the overall climate was relatively wet in the 16th century, from the second half of the 17th century to the first half of the 18th century, and after the 19th century, indicating a relatively warm and wet climate in Baoji during these periods. The above results are consistent with the spatio-temporal distribution characteristics of flood and drought events in Baoji. The occurrence of flood and drought disaster chains in Baoji was basically constant with the overall climate change in Guanzhong region. However, the flood and drought disaster chains in Baoji moved in the same direction, yet not completely simultaneously, with global climate change during the Ming and Qing dynasties, which was linked to the location and geographic environment of this area. In Baoji, under the combined influences of the western Pacific subtropical high, Qinghai-Xizang high, Siberian high and monsoons, the regional droughts and floods exhibited unstable changes and occurred in chains. In each period described above, some fluctuations existed in the regional drought and flood events and temperature at smaller scales. Droughts and floods were dependent on regional precipitation and its intensity, while precipitation was highly influenced by the regional temperature (Zhu et al., 1998). If the weather is warm and wet and influenced by regional climate fluctuations, regional droughts and floods will also occur with intensive precipitation.
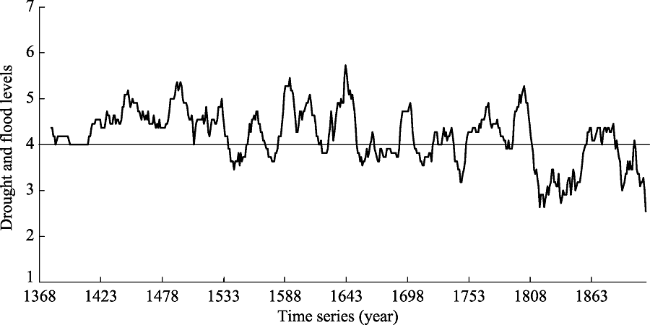
Figure 5 The 11-year moving average of drought and flood levels in Baoji area from 1368 to 1911

6 Conclusions

(1) From 1368 to 1911, a total of 297 drought and flood events occurred in Baoji area. Among these events, droughts and floods occurred separately 191 and 106 times, which accounted for 64.31% and 35.69% of the total events, respectively. The number of droughts outnumbered floods during the Ming and Qing dynasties, and the climate was relatively dry. We observed a pattern of continuity between droughts and floods, which exhibited the alternating occurrence of drought and flood disaster chains.
(2) We observed distinct characteristics of flood and drought events in Baoji in different phases. The climate was relatively dry from 1368 to 1644. A fluctuant climate phase with both floods and droughts occurred from 1645 to 1804. The climate was relatively wet from 1805 to 1911. Moreover, we observed a pattern of alternating dry and wet periods from 1368 to 1911. In addition, 3 oscillation periods of drought and flood events occurred around 70 a, 110 a, and 170 a, which corresponded to sunspot cycles and moved in the same direction as global climate change. In Baoji, drought and flood events usually spanned a single season. However, we also found instances where continuous droughts and floods spanned two to four seasons.
(3) We observed an obvious spatial difference in drought and flood events in Baoji from 1368 to 1911. In terms of the entire Baoji area, droughts were concentrated in the region to the north of Qinling Mountains with the distinction that more droughts occurred in the north than in the south. Meanwhile, floods mainly occurred in the southern Weihe River basin and in eastern Baoji. Moreover, the northern and eastern parts of the Weihe River basin, and the midstreams and downstreams of Qianhe and Qishui river basins had frequent occurrences of both droughts and floods from 1368 to 1911.
(4) From 1368 to 1911, the drought and flood disaster chains in Baoji corresponded well with global climate change and served as a response process to global climate change. Since the 1760s, under the influence of human activities, global climatic deterioration has frequently led to extreme drought and flood events.

The authors have declared that no competing interests exist.

[1]
Bai Huzhi, Dong Anxiang, Zheng Guangfen et al., 2010. The Atlas of Drought and Flood Distribution over Northwest China in Past 500 Years: 1470-2008. Beijing: China Meteorological Press. (in Chinese)

[2]
Baoji Local Chronicles Compilation Committee (BLCCC), 1998. Baojizhi (First Volume). Xi’an: Sanqin Press. (in Chinese)

[3]
Bradley R S, 1993. High Resolution Record of Past Climate from Monsoon Asia, the Last 2000 Years and Beyond, Recommendations for Research. PAGES Workshop Report, Series 93-1, 1-24.

[4]
Central Meteorological Administration (CMA), 1981. Yearly Charts of Dryness/Wetness in China for the Last 500 Years Period. Beijing: Cartographic Publishing House. (in Chinese)

[5]
Chinese Local Chronicles Series in Shaanxi Province (CLCSSP), 1991. Qianyang County Annals. Xi’an: Shaanxi People’s Education Publishing House. (in Chinese)

[6]
Fang Xiuqi, Su Yun, Yin Junet al., 2015. Transmission of climate change impacts from temperature change to grain harvests, famines and peasant uprisings in the historical China.Scientia Sinica (Terrae), 45(6): 831-842. (in Chinese)

[7]
Fang Xiuqi, Zheng Jingyun, Ge Quansheng, 2014. Historical climate change impact-response processes under the framework of food security in China.Scientia Geographica Sinica, 34(11): 1291-1298. (in Chinese)It is one of the core themes of the Past Global Change Sciences(PAGES) that to understand the mechanism and process of the past human-climate-ecosystem's interaction in various spatial and temporal scales in order to improve the understanding of contemporary climate change impacts and adaptation. The topic is also the important theme of historical man/milieu relationships that is a big issue of concern by geographers. In this article, concepts of vulnerability and food security in the regime of Global Changes are used to illustrate historical climate change impact-response processes in China. Corresponding to the food access, food availability and food utilization, the food security of historical China is simplified to three levels of food production safety, food supply safety and food consumption safety. The food production safety was the base of food security which could reflect the social sensitivity to climate change. The food supply safety was the capacity of the society to accommodate the crisis of regional food security which could indicate the social capacity to response the impacts of climate change. The food consumption safety was the final state of food security.The insecurity of food consumption was essential for the occurrence of social instability impacted by climate change. The processes related to the impacts of climate change to grain productivity, food supply production security, individual food security, and social security are discussed. For human society, climate change means the changes of climatic resources or disasters. Impacts of climate change occurred from the direct impact on the grain harvest, then transferred further up to the sub-systems of economy, population and society mainly though the impact-response chain of climate change, agriculture harvest per capita food supply, famine, and social stability. However, the impact-response processes of climate change could not be attributed to a simple causality.The initial impact could be amplified or suppressed in feedback processes affected by many factors in each sub-system, such as arable land, population, policy, foreign forces, and so on. Both people's spontaneous behaviours and the government's organized policies and operations played very important roles in all steps of adjusting the responses on the impacts of climate change. But each adjustment had its limitation under the given historical condition. The impact of climate change could be positive or negative. To a certain degree, even the negative impacts could be converted into new opportunity for development if right countermeasures were taken. This article has provided a framework on the impact-response processes of historical climate change. Further research should be carried out to measure the processes quantitatively on the base of the framework.

[8]
Fufeng County Chronicles Compilation Committee (Fufeng CCCC), 1993. Fufeng County Annals. Xi’an: Shaanxi People’s Publishing House. (in Chinese)

[9]
Ge Quansheng, Fang Xiuqi, Zheng Jingyun, 2014. Learning from the historical impacts of climatic change in China.Advances in Earth Science, 29(1): 23-29. (in Chinese)The social impact of global climate change is one of the hotspots in the current research. To deal with the challenges from climate change,it could be learned from the adapting experiences and lessons to climate change in the history. The main achievements of cognition on the historical impacts of climatic change in China and on coping with the climate changes in the future based the published papers in recent years is summarized. The followings are the main conclusions. ①The general characteristics of the impacts of climatic change in the history was negative in the cold periods and positive in the warm periods,but there were regional differences in the impact and responses. ②The cooling trend on centurial scale and the social-economic decline run concurrently. The rapid development supported by better resources and environment in the warm period could lead to the increase of the social vulnerability when the climate turned to the cold period. ③Strategies and policies to cope with the climate change in the history were adopted according to the temporal and spatial circumstances and the subjects. Initiative adaptation promoted by governments was an effective way.

DOI

[10]
Ge Quansheng, Liu Jian, Fang Xiuqiet al., 2013. General characteristics of temperature change and centennial warm periods during the past 2000 years.Acta Geographica Sinica, 68(5): 579-592. (in Chinese)The characteristics of warm/cold fluctuation for Northern Hemisphere(NH) and China during the past 2000 years were analyzed using the proxy-based temperature change series published recently.The duration of centennial warm periods before the 20th century and the difference between the warmth of the 20th century and the centennial warm periods that occurred prior to the 20th century were also investigated.The conclusions are summarized as follows:(1) Most of proxy-based NH temperature series show that the warm climate occurred in the periods of AD 1-270,841-1290 and 1911-2000.In general,it was cool with multi-decadal temperature fluctuations from 271 to 840,and cold from 1291 to 1910.These centennial periods of warm/cold fluctuation over NH are corresponding to the Roman Warm Period(the 1st century BC to the mid-4th century AD),Dark Age Cold Period(the end of 4th century to the early of 10th century AD),Medieval Warm Period(the mid-10th century to the end of 13th century AD),Little Ice Age(the 15th to 19th century) and Warming Period in the 20th century illustrated by Lamb respectively.But they have different durations between the NH centennial warm/cold periods and those Warm/Cold Periods identified by Lamb.(2) The duration and amplitude of regional centennial phases of warm/cold fluctuation are different in China,but the timing of centennial periods of warm/cold over whole China,i.e.warm in AD 1-200,551-760,941-1300,1901-2000 and cold in the others,which are consistent with that observed in NH approximately.(3) Most of proxy-based NH temperature change series show that the warmth in Medieval Warm Period is at least comparable to that during the Warming Period in the 20th century.The warmest 100-year and 30-year(i.e.,warm peak duration) for whole China occurred in the periods of 941-1300 during the past 2000 years,which are slightly higher than in the 20th century respectively.Moreover,the temperature anomalies in the warmest 100-year and 30-year for whole China that occurred in the periods of 571-760 and 1-200 are comparable to and a little lower in the 20th century respectively.

DOI

[11]
Ge Quansheng, Liu Lulu, Zheng Jingyunet al., 2016. Spatial patterns of drought/flood over eastern China in the periods of anomalous solar activity during the past millennium.Acta Geographica Sinica, 71(5): 707-717. (in Chinese)Based on five new reconstructions of solar irradiance, the anomalous solar activity periods during the past millennium, including 5 Solar Minimum periods, 2 Solar Maximum,and 4 high solar irradiance periods, were identified. Furthermore, the spatial patterns of drought/flood over eastern China for these 11 periods were reconstructed using an index of difference between drought and flood frequency derived from a 63-site yearly drought/flood grade dataset.It was found that there are different drought/flood patterns over eastern China within 11 solar activity anomalies. Spatial patterns showed alternative distribution of drought and flood among5 Solar Minimum(1010-1050, 1280-1350, 1460-1550, 1645-1715, 1795-1823), with a higher probability of drought(flood) dominating the middle and lower reaches of the Yangtze River(North China). In the periods of solar maximum and high solar irradiance, drought prevailed over eastern China in Medieval Maximum(1100- 1250), while flood prevailed over eastern China in 1845- 1873. The remaining four periods(1351- 1387, 1593- 1612, 1756- 1787, 1920-2000) presented a pattern of alternate drought and flood. The ensemble mean patterns of drought/flood for all the 5 Solar Minimum presented a zonal distribution with flood in South China, drought in the middle and lower Yangtze River and flood in most parts of North China,whereas the reverse distribution, drought in South China, flood in the middle and lower Yangtze River and drought in most parts of North China, were shown in the ensemble mean patterns of drought/flood for all the 6 periods with solar maximum and high solar irradiance.

DOI

[12]
Ge Quansheng, Zheng Jingyun, Hao Zhixinet al., 2012. General characteristics of climate changes during the past 2000 years in China.Scientia Sinica (Terrae), 42(6): 934-942. (in Chinese)The general characteristics of climate changes over the past 2000 years in China, regional differences and uncertainties were analyzed based on the recently peer-reviewed high time-resolution climatic reconstructions. The results showed that there exists four warm periods of the temperature variation in China since the Qin Dynasty, including the western and eastern Han Dynasties (200 BC-AD 180), the Sui and Tang dynasties (541–810), the Song and Yuan dynasties (931–1320), and the 20th century, and three cold phases involving the Wei, Jin, and North-South Dynasties (181–540), the late Tang Dynasty (811–930), and the Ming and Qing dynasties (1321–1920). The Song and Yuan warm period is consistent with the Medieval Warm Period over the Northern Hemisphere, and the cold phases of the North-South Dynasties and the Ming and Qing dynasties are paralleled to the Dark Ages Cold Period and the Little Ice Age, respectively. The 13th-15th century could be a shift to the wet condition of the climate, and the low precipitation variability is exhibited in western China prior to 1500. In the context of the climate warming, the pattern of the drought in north and flood in south is prevalent over the eastern China. In addition, the published reconstructions have a high level of confidence for the past 500 years, but large uncertainties exist prior to the 16th century.

DOI

[13]
Ge Q S, Zheng J Y, Hao Z Xet al., 2013. General characteristics of climate changes during the past 2000 years in China.Science China: Earth Sciences, 56(2): 321-329.The general characteristics of climate changes over the past 2000 years in China, regional differences and uncertainties were analyzed based on the recently peer-reviewed high time-resolution climatic reconstructions. The results showed that there exists four warm periods of the temperature variation in China since the Qin Dynasty, including the western and eastern Han Dynasties (200 BC-AD 180), the Sui and Tang dynasties (541–810), the Song and Yuan dynasties (931–1320), and the 20th century, and three cold phases involving the Wei, Jin, and North-South Dynasties (181–540), the late Tang Dynasty (811–930), and the Ming and Qing dynasties (1321–1920). The Song and Yuan warm period is consistent with the Medieval Warm Period over the Northern Hemisphere, and the cold phases of the North-South Dynasties and the Ming and Qing dynasties are paralleled to the Dark Ages Cold Period and the Little Ice Age, respectively. The 13th-15th century could be a shift to the wet condition of the climate, and the low precipitation variability is exhibited in western China prior to 1500. In the context of the climate warming, the pattern of the drought in north and flood in south is prevalent over the eastern China. In addition, the published reconstructions have a high level of confidence for the past 500 years, but large uncertainties exist prior to the 16th century.

DOI

[14]
Ge Quansheng, Zheng Jingyun, Hao Zhixinet al., 2014. State-of-the-arts in the study of climate change over China for the past 2000 years.Acta Geographica Sinica, 69(9): 1248-1258. (in Chinese)We reviewed the state-of-the-arts of climate change research in China over the past2000 years and summarized the achievements during recent 10 years; the research works perspectives of this field were discussed as well. The overview mainly focuses on the development of proxy data, reconstructions of temperature and precipitation(wetness/dryness)changes for the past 2000 years, and recognition on the cold/warm periods, modeling simulation and diagnosis of climate changes for the last millennium, as well as the new findings on impacts of climate change on society in historical times. It is found that spatial coverage of proxy data increased largely and that quantifications of climate proxy indicator interpretation and impacts of climate change on society were improved. The understanding of the decadal to centennial climate change and its possible driving forces and impacts were improved. These achievements provide a solid scientific basis for revealing the rhythms of past changes in earth system, in particular for a better understanding of the spatial and temporal characteristics of climate change in China and dynamics of regional climate change.

DOI

[15]
Ge Quansheng, Zheng Jingyun, Hao Zhixin, 2015. PAGES synthesis study on climate change in Asia over the last 2000 years: Progresses and perspectives.Acta Geographica Sinica, 70(3): 355-363. (in Chinese)The established background and goals of the last 2 millennia climate research network, past global changes(PAGES2K) were introduced, and the distinctive significance of Asia2 k in PAGES project was expounded. The main research progresses from PAGES-Asia2 k working group and contributions of China to the synthetic climate reconstructions of the last2000 years were also addressed in this paper. In addition, we analyzed the challenge and key issues during the studies on climate reconstructions over Asia, and discussed the research activities in the future work. Asia is an ideal area to conduct synthesis studies on the climate changes for the past 2000 years due to its long history and abundant proxy types with a high time-resolution; however, at present, the related research work is still in its infancy. The recent progresses showed that during the past 1200 years there was a warmer period(830- 1220), a colder period(1340- 1880), and a rapid warming period(the 20 th century). However, the climate of Asia is characterized by various types, complicated process changing and large regional differences. Thus, the future work of this project will focus on the following topics:developing the new methodologies for climate change reconstructions to improve the reliabilities of reconstructed results in individual sites(regions) and the temporal- spatial resolutions, data coverage for the whole continent; developing the PAGES- Asia2 k proxy climate database for synthesis study to reconstruct the regional temperature series and spatial patterns of wet and dry changes; furthermore, studying the mechanism and impact of climate change and its adaptation at regional scale.

DOI

[16]
Guo Zengjian, Guo Anning, Zhou Kexing, 2007. Geophysical Disaster Chain. Xi’an: Xi’an Map Publishing House. (in Chinese)

[17]
Lee HF, Zhang DD, 2010. Changes in climate and secular population cycles in China, 1000 CE to 1911.Climate Research, 42: 235-246.Many studies of secular population cycles in historical China conclude that when population is large - relative to the land's carrying capacity - further population increase can lead to mortality crises through war, famine and epidemics, resulting in subsequent population decline. In these studies, population cycles are thought to be driven primarily by population growth. Nevertheless, some scholars have noted a strong correlation between deteriorating climate, dynastic change, and population collapse in historical China. They suggest climate forcing as the underlying driver of population cycles, but quantitative evidence has been lacking to date. In the present study, we employed high resolution temperature data, reports on mortality events, and population datasets to quantitatively examine the extent to which climate change was responsible for Chinese population cycles. Results show that there were 5 major population contractions in China between 1000 CE and 1911, and all of them occurred in periods with a cold climate, when mortality crises triggered population collapses. Nevertheless, the climate-population association is non-linear, because it is mediated by population pressure. Although social buffers were increasingly effective in dissipating climate forcing, they could not prevent population collapses from occurring during periods of long-term cooling. Our results challenge classic Malthusian and post-Malthusian interpretations of historical Chinese population cycles. Inter-Research 2010.

DOI

[18]
Li Xiaogang, Li Min, 2016. Analysis of change law of drought and flood disasters from 1430 to 2000 in Shangluo.Acta Agriculturae Jiangxi, 28(2): 101-105, 111. (in Chinese)Collecting and classifying the data about drought and flood disasters in Shangluo from 1430 to 2000,and using methods of moving average,accumulative anomaly and wavelet analysis,analyzed the change law of drought and flood disasters in the recent 570 years. The results showed that the occurrence years of droughts and floods were 340,accounting for 59.6%,the average occurred droughts and floods once every 1.68 years in nearly 570 years of Shangluo,droughts and floods occurred frequently in Shangluo. which could be divided into three stages in nearly 570 years of Shangluo,From 1430 to 1640,were partial drought periods,from 1640 to 1920,were comparable balance periods,from 1920 to 2000,were more flooding periods,which could further divide them into seven drought- partial or flood- partial periods. Existed obvious periodic droughts and floods regulation in Shangluo,its main period was about 175 ~ 205 years,and existed 77 to 89 years cycle and 178 to 205 years cycle,roughly 80 years and 178 years cycle of solar activity phase correspondence,showed that there existed a certain correlation between the occurrence of drought and flood disasters with the action of the sun. Which had important practical significance for the development of disaster prevention and mitigation measures in Shangluo.

[19]
Li Yanfang, Zhao Jingbo, 2008. The research on the flooding disaster in Guanzhong in recent 200 years.Journal of Arid Land Resources and Environment, 22(4): 96-99. (in Chinese)Through the collection and analysis to the historical materials of the flooding disasterinGuanzhong areain1801-2005,and with7 multinomials in the least squares method,the flooding disaster development tendency in this areain future five years(2006-2010) was forecasted,the time and spatial characteristicsof the flooding disaster in Guanzhong were studiedbyMATLAB.The results showed that flooding disaster of the recent200 yearsaltogether accured 83 times,and averagely occurredone time per 2.47 years.The frequency of flooding disaster increased obviously during 1850-1930,in the 30's of 20th century the frequency of flooding disaster increased obviously,especially in the 1960's.In the five districtsofGuanzhong area,Weinan City suffered the flooding disastermost frequently,Tongchuan did lightly. It was forecasted that therewill have 0.9653 times of flooding disaster in the future 5 years(2006-2010).

[20]
Linyou County Chronicles Compilation Committee (Linyou CCCC), 1993. Linyou County Annals. Xi’an: Shaanxi People’s Publishing House. (in Chinese)

[21]
Longxian County Chronicles Compilation Committee (Longxian CCCC), 1993. Longxian County Annals. Xi’an: Shaanxi People’s Publishing House. (in Chinese)

[22]
Meixian County Chronicles Compilation Committee (Meixian CCCC), 2000. Meixian County Annals. Xi’an: Shaanxi People’s Publishing House. (in Chinese)

[23]
Pei Lin, Yan Zhong Wei, Yang Hui, 2015. Multidecadal variability of dry/wet patterns in eastern China and their relationship with the Pacific Decadal Oscillation in the last 413 years.Chinese Science Bulletin, 60(1): 97-108. (in Chinese)We analyzed dryness/wetness indices at 55 sites across eastern China(east of 105 E) for the period AD 1600 2012 using the Ensemble Empirical Mode Decomposition(EEMD) method to investigate decadal-to-centennial timescale variations of dry/wet patterns in this region and their relationship with the Pacific Decadal Oscillation(PDO). Empirical Orthogonal Function(EOF) analysis shows that the most important regional dry/wet pattern is a monopole(consistently dry or wet throughout eastern China), with a center of variability in northern China. The southern-flood-northern-drought(SFND) pattern represents a secondary type of variability for the historical period; however, this tended to intensify and has become the dominant pattern over the 20 th century. Multidecadal SFND events, such as that prevailing from the late 1970 s to the early 21 st century, have rarely occurred during the last 413 years. Multi-decadal dry/wet variations in northern China exhibit positive correlation with an ensemble mean PDO index of various reconstructed indices throughout this historical period.

DOI

[24]
Qishan County Chronicles Compilation Committee (Qishan CCCC), 1992. Qishan County Annals. Xi’an: Shaanxi People’s Publishing House. (in Chinese)

[25]
Qing Fengxiang Magistrate Da Line, 2002. Revision on the Fengxiang Government Record. Xi’an: Xi’an Map Publishing House, The Chinese Local Chronicles the Baoji Office Jiaozhu Reprint. (in Chinese)

[26]
Ren Zhenqiu, 1986. Climate anomalies and astronomy nearly five thousand years of China.Agricultural Archaeology, (1): 298-303. (in Chinese)

[27]
Shi F, Yang B, Von Gunten L, 2012. Preliminary multiproxy surface air temperature field reconstruction for China over the past millennium.Science China Earth Sciences, 55(12): 2058-2067.We present the first millennial-length gridded field reconstruction of annual temperature for China, and analyze the reconstruction for spatiotemporal changes and associated uncertainties, based on a network of 415 well-distributed and accurately dated climatic proxy series. The new reconstruction method is a modified form of the point-by-point regression (PPR) approach. The main difference is the incorporation of the “composite plus scale” (CPS) and “Regularized errors-in-variables” (EIV) algorithms to allow for the assimilation of various types of the proxy data. Furthermore, the search radius is restricted to a grid size; this restriction helps effectively exclude proxy data possibly correlated with temperature but belonging to a different climate region. The results indicate that: 1) the past temperature record in China is spatially heterogenic, with variable correlations between cells in time; 2) the late 20th century warming in China probably exceeds mean temperature levels at any period of the past 1000 years, but the temperature anomalies of some grids in eastern China during the Medieval climate anomaly period are warmer than during the modern warming; 3) the climatic variability in the eastern and western regions of China was not synchronous during much of the last millennium, probably due to the influence of the Tibetan Plateau. Our temperature reconstruction may serve as a reference to test simulation results over the past millennium, and help to finely analyze the spatial characteristics and the driving mechanism of the past temperature variability. However, the lower reconstruction skill scores for some grid points underline that the present set of available proxy data series is not yet sufficient to accurately reconstruct the heterogeneous climate of China in all regions, and that there is the need for more highly resolved temperature proxies, particularly in the Tibetan Plateau.

DOI

[28]
Taibai County Chronicles Compilation Committee (Taibai CCCC), 1998. Taibai County Annals. Xi’an: Sanqin Press. (in Chinese)

[29]
Wan Honglian, 2014. Flood disaster and its social impacts in Baoji area during the past 1400 years.Journal of Arid Land Resources and Environment, 28(4):79-82. (in Chinese)The frequencies of flood disasters and their impacts in Baoji during 600 ~ 2000 were analyzed according to the statistics of local historical disaster data and relating information. The results show that in Baoji area the flood disaster level might be divided into small,middle,great and the greatest. Flood disasters with middle and great danger were at the main station,and their took 71. 55% of total. The flood disasters with the greatest danger occurred scarcely,and their took 8. 94% of total. The period could be divided into six phases,in 10, 11,12,13,14 and 15 century there were no or scarcely flood disasters,and in 7,8,9,16,17,18,19and 20 century there were plenty of flood disasters. Seasonally,the disaster occurrence frequency concentrated on summer and autumn. Main factors producing flood disaster are geography position,climatic anomaly undulation and the synthetically action of artificial flexible affection.

[30]
Wan Honglian, Liu Dongyue, Song Hailong, 2016. Earthquake disasters and its spatial and temporal distribution characteristics of Baoji in history period.Journal of Baoji University of Arts and Sciences (Natural Science Edition), 36(3): 1-5. (in Chinese)

[31]
Wan Honglian, Song Hailong, Zhu Chanchanet al., 2017. Analysis of hail disasters and its spatial and temporal distribution characteristics in Shaanxi region from 1368 to 2013.Journal of Arid Land Resources and Environment, 31(2): 123-127. (in Chinese)Hail disasters events between 1368- 2013 in Shaanxi province were collected to statistically analyze the characteristics of spatial and temporal distribution and cycle change discipline of hail disasters by using ArcGIS and Matlab software. The results showed that 991 times of hail disasters occurred in Shaanxi region during1368- 2013 a,about 1. 54 times occurred each year,including elementary,secondary and special hailstorms that accounted for 25. 43%,61. 96% and 12. 61% of total hail disasters,respectively. Hail disasters existed three periods of oscillation on time scale by 175 a,250 a and 500 a. Hail disasters occurring frequency presented a wave of rising trend in time distribution,obviously increased after the 18 th century; it mainly concentrated in summer and autumn. On the spatial distribution,hail disasters also existed obvious difference,mainly occurred in the western of Guanzhong plain and north region. There had three high frequency centers in Yulin,Yanan and Longxian area.

[32]
Wan Honglian, Song Hailong, Zhu Chanchanet al., 2017. Drought and flood disaster chain and its response to climate change in Baoji region during the Ming and Qing dynasties.Acta Geographica Sinica, 72(1): 27-38. (in Chinese)In this paper, the literatures about the drought and flood disasters in Baoji region during the Ming and Qing dynasties were collected and sorted. The drought and flood disaster chains were discussed, while the response to climate change in Baoji region during 1368-1911 years was analyzed by using the accumulative anomaly method, moving average method and wavelet analysis and so on. The results showed that 297 events of drought and flood disasters occurred in Baoji during 1368- 1911, while drought occurred 191 times and flood 106 times,accounting for 64.31% and 35.69%, respectively. There were obvious stage characteristics for drought and flood disasters, with drought episodes mainly observed from 1368 to 1644, while during 1645- 1804 a fluctuant phase emerged, and the period 1805- 1911 experienced drought episodes, presenting the alternating drought- wet period on the whole. Meanwhile there were three periods(70a, 110 a and 170a) of oscillation on time scale of drought and flood existence,which had relationship with sunspot activity cycle. Drought and flood disasters had obvious variations in space; the northern and eastern parts of the Weihe river basin were prone to drought and flood. The occurrence of drought and flood disaster chains was a response to global climate change during the Ming and Qing dynasties in Baoji. Since the 1760 s, the global climate deterioration has led to frequent extreme drought and flood disaster events.

DOI

[33]
Wan Honglian, Zhou Qi, Fan Weihanet al., 2013. Flood disasters in the Baoji region during the period of AD. 600-2000.Arid Zone Research, 30(4): 697-704. (in Chinese)Through collecting and analyzing the historical data,the variation stages,trends,grades and causes of flood disasters in the Baoji region during the period of A.D.600-2000 were researched.The results showed that flood disasters in the Baoji region may be divided into 4 grades,i.e.the slight,moderate,serious and extremely serious grades,in which the moderate and serious flood disasters were dominant,and their proportion was 71.55% of the total.Extremely serious flood disasters occurred seldom,and their proportion was 8.94% only.In the past 1 400 years,flood disasters occurred seldom in the 10th,11th,12th,13th,14th and 15th centuries but frequently in 7th,8th 9th,16th,17th,18th,19th 20th centuries.There was a spatial difference in occurring frequency of flood disasters,and the frequency was in an order of Baoji Fufeng Qianyang Fengxiang Feng County Long County Linyou Qishan Mei County.The difference of occurring frequency of flood disasters between the highest and lowest values was 26 times.Seasonally,flood disasters occurred mainly in summer and autumn.Flood disasters were jointly affected by the geographical location,precipitation,climatic anomaly undulation and human activities.

[34]
Wang Jinsong, Chen Fahu, Yang Baoet al., 2006. New advances in research on the Little Ice Age climate change.Advances in Climate Change Research, 2(1): 21-27. (in Chinese)CateGory Index】: P467

[35]
Wang S W, Wen X Y, Luo Yet al., 2007. Reconstruction of temperature series of China for the last 1000 years.Chinese Science Bulletin, 52(23): 3272-3280.This paper reports a study on reconstructing temperature series for ten regions of China over the last 1000 years with a time resolution of 10 a. The regions concerned are: Northeast, North, East, South China, Taiwan, Central, Southwest, Northwest China, Xinjiang and Qinghai-Tibet Plateau. A variety of proxy data, such as ice core, tree-rings, stalagmites, peat, lake sediments, pollen and historical records, were validated with instrumental observations made in the last 120 years, and applied in the reconstruction of the temperature series. A temperature series for whole China is then established by averaging the ten regional series with a weighting proportional to the area of each region. Finally, temperature variations for the last 1000 years are examined, with special focus placed on the characteristics of the Medieval Warm Period (MWP), the Little Ice Age (LIA), and Modern Warming (MW).

DOI

[36]
Wang Shaowu, Ye Jinlin, Gong Daoyi, 1998. Climate in China during the Little Ice Age.Quaternary Sciences, 18(1): 54-64. (in Chinese)Usually, 1550-1850, while the climate was relatively cold, was called as theLittle Ice Age. 30-year mean temperature in the coddle latitude of the NorthernHemisphere during the Little Ice Age was generally 1.0℃ lower than the observed inthe coddle and late present century. Lowering of temperature increased to 1.5- 2.0℃in the higher latitudes in the Southern Hemisphere.Zhu had indicated in 1973 that cold winters in China were concentrated in threePeriods; 1470-1520, 1620-1720, and 1840-1890, though he did not use theterminology of the Little Ice Age.Wang had reconstructed in 1990 decadal mean seasonal temperature anomalies ofNorth and East China for the period of 1470's to 1980' s. It provided at the firstbine an opportunity to examine the Little Ice Age in China based on a homogeneoustemperature series. Wang et al. (1990) then identifled three cold periods, which hadbeen denoted as Ⅰ, Ⅱ, and Ⅲ. Moreover, two colder stages were found in each ofthe cold periods, which were indicated as foot note 1 or 2. The cold stages in Chinawere as follows: 1,-1450' s- 1470' s, Ⅰ 2-1490' s-1510' s, Ⅱ1-1560' s-1600' s,Ⅱ2-1620' s- 1690' s,Ⅲ1-1790' s- 1810's and Ⅲ2-1830' s-1890' s.Recently, annual temperature series of 1880-1996 were constructed for each often regions of China. which covered whole territory of China, including Tibet andTaiwan. It provided good bases for reconstruction of tempeatre series for the last500 to 1000 years. In the following, data sources used in reconstruction were outlinedfrom region to region.(1) Northeast. Tree-ring data was used to reconstruct annual temperature between1748 to 1880 (Wei Sonlin personal communication). New tree-ring data of ShaoXuemei was used for the period 1600 to 1748.(2) North. Decadal mean temperature anomaly series were used, which werereconstructed by Wang on the basis of documentary data.(3) East The same as used for North.(4) South. Decadal mean temperature anomaly series were reconstructed recentlyby using of the same method as for the North and East China.(5) Taiwan. The same as for South.(6) Central-South. Decadal mean temperature series were reconstructed by YeYuyuan et al. (Personal commnication ) on the basis of documentary data.(7) Southwest. The same as used for South.(8) Northwest. Ice core δ18O data in Dunde were used.(9) Xinjiang. Ice core δ18O data in Guliya were used.(10) Tibet. Tree-ring data of Kang Xingcheng were used.Decadal means of temperature are used in present study, for the limit of theresolution of proxy data. Firstly, all kinds of the proxy dare are normalized, and thenthe regional standard deviation of decadal mean temperature is multiplied, which wascalculated by using of observatory data of 1961-1990. It insures the homogeneity ofthe series. Finally, regional decadal-mean temperature anomaly series are obtained.However, the length of the series varies from region to region. The longest seriesavailable now are that for Xinjiang, Northwest and Tibet. Historical documents allowtO reconstruct the series only since 1380 to 1470, for the scarce of dare in early time.However, thes is the first bine one can examine the Little Ice Age in the wholeterritory of China.Main results are as following:(1) To establish the series of China, regional temperature anomalies are averagedwith the weighting factors, which are proportional to the size of the region.(2) All of the regional series positively correlate to the series of China.Maximum correlation coefficients are found between Northwest Tibet on the one handand National on the others.(3) Ten regions can be divided into three groups: 1) Mainland areal, includingNorth, Ease Northwest and Tibet. 2) South territory, including South, Central-Southand Southwest. 3) Surrounding area including Xinjiang and Northeast.(4) Five cold periods are identified for the last millennium; 1100's- 1150' s, 1300' s- 1390' s, 1450' s- 1510' s, 1560' s- 1690's and 1790' s- 1890' s.However, temperature anomaly varied from region to region in each of the coldperiods. The first two periods can be regarded as a transition to the L

[37]
Wang Shaowu, Zhao Zongci, 1979. An analyses of historical data of droughts and floods in last 500 years in China.Acta Geographica Sinica, 34(4): 330-334. (in Chinese)This article is a study of droughts and floods in China by using chronological materials. The spatical characteristics of distributions of droughts and floods were exa-mined by empirical orthogonal function analysis for 25 stations in last 500 years, for 100 stations in last 100 years using historical documents, and for 100 stations in last 24 years using instrumental rainfall data. The first three eigenvectors combine to yield a picture of zonal distribution of droughts and floods. But the high-order eigenvectors give a rather meridional character. Comparison of eigenvectors for historical docu-ments and for instrumental data shows a good accordance. It indicates that the histori-cal documents of droughts and floods may be satisfactorily used to investigate variations of summer rainfall during historical time. Furthermore, the full set of historical documents for 500 years has been divided into five groups to search into the stability of eigenvectors. Bach group consists of 100 years, that is 1471-1570, 1571-1670 and so on. Eigenvector charts for each group show a very similar characteristics. It indicates that the spatical characters of the drought and flood distribution remain principally unchanged at least in recent 500 years. The distribution of droughts and floods in China has classified into six types: 1a, floods all over country, mainly in Chang Jiang, It, floods in Chang Jiang, droughts in the North and the South, 2, floods in the South, droughts in the North, 3, droughts in Chang Jiang, floods in the North and the South, 4, floods in the North, droughts in the South, 5, droughts over all country. The chronicles of types of droughts and floods in last 500 years are given. The method of classification is reviewed and the change of frequency of types in last 500 years is discussed.

[38]
Wang Shousen, 2002. Brief Records on Historical Natural Disasters in Shaanxi. Beijing: China Meteorological Press. (in Chinese)

[39]
Water Conservancy Newsroom (WCN), 1985. Baoji: The historical inundation and drought of Baoji. (in Chinese)

[40]
Wen Kegang, Zhai Youan, 2005. Encyclopaedia of China’s Meteorological Disasters: Shaanxi Volume. Beijing: China Meteorological Press. (in Chinese)

[41]
Xiao L B, Fang X Q, Zhang Y Jet al., 2014. Multi-stage evolution of social response to flood/drought in the North China Plain during 1644-1911.Regional Environmental Change, 14(2): 583-595.How the past human society responded to climatic disasters could provide better understanding on the nature of climate–human–ecosystem interactions and the knowledge of the vulnerability for the society in the context of changing climate. In this paper, the North China Plain in the Qing dynasty (1644–1911) is selected as a typical regional social-ecological system; with historical information kept in official documents, social responsive behavior and measures to flood/drought (e.g., reclamation, disaster relief, migration, revolt) are quantitatively described with proxy indicator time-series. It is found that the dominant responsive strategy altered significantly in different stages: (1) stage of cropland expansion (1644–1720); (2) stage of governmental disaster relief (1721–1780); (3) stage of increasing climate refugees (1781–1860); (4) stage of revolt and emigration (1861–1911). The multi-stage evolution of social response was impacted by various natural and social factors: (1) regional population–food balance and governmental finance were the most important limiting factors; (2) the interaction between the governmental policy and refugees’ behavior in disasters affected the social consequences to a certain extent; (3) decadal-to-multi-decadal climate change would also impact the social response measures, even directly trigger the shift of dominant responsive strategy. This study would be helpful for deeper understanding of social resilience and better responding to climate change and extreme events in the present and future.

DOI

[42]
Xiao L B, Fang X Q, Zheng J Yet al., 2015. Famine, migration and war: Comparison of climate change impacts and social responses in North China between the late Ming and late Qing dynasties.Holocene, 25(6): 191-196.The human-climate-ecosystem interactions in the past were valuable for today's human beings who face the challenge of global change. The multi-proxy reconstruction of climate change impacts and social responses and the comparative study between typical periods form an effective tool for elucidating the mechanisms of the interactions. In this paper, with a reconstruction of the proxy series of famine, migration and wars, the most typical social consequences related to climate change and disasters (flood/drought) in North China in 1470-1911 were quantitatively described, and two typical periods of human-climate interaction with similar climate change backgrounds (cold periods of the Little Ice Age'), which were the late Ming dynasty (1560-1644) and late Qing dynasty (1780-1911), were selected and compared. It is determined that the climate deterioration (rapid cooling and increasing extreme disasters) in the late 16th and 18th centuries both resulted in severe social consequences characterized by more famine and popular unrest. The differences were that the climatic impacts in the late Ming were much more serious, and interregional migration, which was an effective responsive measure in the late Qing, was not important in the late Ming; they were primarily influenced by three factors based on the analytical framework of the impacts of historical climate change and social responses: (1) climate deterioration in the late Ming was more severe (more rapid cooling and more extreme disasters), (2) social system were more sensitive to climate change in the late Ming because of its mode of agricultural production (especially cropping system and crop species), and (3) the capacity of social response to climate disaster, especially disaster relief and refugee settlement, was considerably greater in the late Qing.

DOI

[43]
Xu Xiaoyu, Zhu JiWei, Xie Jiancanget al., 2015. Analysis of spatial and temporal distribution characteristics and evolution trend of drought and flood disasters from 1470 to 2012 in Shaanxi Province.Journal of Xi’an University of Technology, 31(2): 231-237. (in Chinese)

[44]
Xu Zhentao, Jiang Yaotiao, 1990. Research and Modern Applications of the Sunspot in Ancient China. Nanjing: Nanjing University Press. (in Chinese)

[45]
Yang B, Qin C, Wang J Let al., 2014. A 3,500-year tree-ring record of annual precipitation on the northeastern Tibetan Plateau.Proceedings of the National Academy of Sciences of the United States of America, 111(8): 2903-2908.An annually resolved and absolutely dated ring-width chronology spanning 4,500 y has been constructed using subfossil, archaeological, and living-tree juniper samples from the northeastern Tibetan Plateau. The chronology represents changing mean annual precipitation and is most reliable after 1500 B.C. Reconstructed precipitation for this period displays a trend toward more moist conditions: the last 10-, 25-, and 50-y periods all appear to be the wettest in at least three and a half millennia. Notable historical dry periods occurred in the 4th century BCE and in the second half of the 15th century CE. The driest individual year reconstructed (since 1500 B.C.) is 1048 B.C., whereas the wettest is 2010. Precipitation variability in this region appears not to be associated with inferred changes in Asian monsoon intensity during recent millennia. The chronology displays a statistical association with the multidecadal and longer-term variability of reconstructed mean Northern Hemisphere temperatures over the last two millennia. This suggests that any further large-scale warming might be associated with even greater moisture supply in this region.

DOI PMID

[46]
Yang Xuexiang, 2008. Disaster chain rules can’t be ignored.Geography Teaching, (5): 1-4. (in Chinese)

[47]
Ye Y, Fang X, Khan M A U, 2012. Migration and reclamation in Northeast China in response to climatic disasters in North China over the past 300 years.Regional Environmental Change, 12(1): 193-206.Climatic disaster-induced migration and its effects on land exploitation of new settlements is a crucial topic that needs to be researched to better understand the impact of climate change and human adaptation. This paper focuses on the process and mechanism of migrant–reclamation in Northeast China in response to climatic disasters over the past 30002years. The research used comparative analysis of key interlinked factors in this response involving drought/flood events, population, cropland area, farmer revolts, administrations establishment, and land reclamation policies. It draws the following conclusions: (1) seven peaks of migrants–reclamation in Northeast China were evident, most likely when frequent climatic disasters happened in North China, such as the drought–flood in 1851–1859, drought in 1875–1877, and drought 1927–1929; (2) six instances of policy transformation adopted to cope with extreme climatic events, including distinctive examples like changing to a firm policy prohibiting migration in 1740 and a subsequent lifting of that prohibition in 1860; and (3) the fast expansion of the northern agricultural boundary since the middle of the nineteenth century in this area benefited from a climate change trend from a cold period into a warm period. Altogether, over the past 30002years, extreme climatic disasters in North China have deepened the contradiction between the limited land resources and the rapidly increasing population and have resulted in migration and reclamation in Northeast China. Climate, policy, and reclamation constructed an organic chain of response that dominated the land use/cover change process of Northeast China.

DOI

[48]
Yuan Lin, 1994. Disaster History in Northwest China. Lanzhou: Gansu People’s Publishing House. (in Chinese)

[49]
Yuan Yuan, Huang Shaoni, Guo Chunyanet al., 2015. The reconstruction and trend study of Shaanxi province’s drought and floods grade in recent 500 years.Agricultural Research in the Arid Areas, 33(5): 232-236, 244. (in Chinese)This article rebuilds the drought and floods grade of Shaanxi province's stations from 1470 to 2008,by using the historical documents and precipitation data. It analysis the basic features and evolution trend,and provides basis for forecast of drought and floods. There are five typical stations picked up that are Yulin,Yan'an,Xi'an,Hanzhong,Ankang. By analyzing 539 years drought and floods grade of five stations from 1470 to 2008,Yulin and Yan'an have the trend which is from drought to normal. Baoji and Xi'an has significant alternating of droughts and floods and the trend which is from drought to floods. The trend of Hanzhong and Ankang is mainly floods. The change points of drought and floods came out in southern,northern Shaanxi and Guanzhong in about 1640 s. The change of southern Shaanxi is from drought to normal in about 1640. The change of Baoji and Xi'an is from drought to floods in about 1648. The change of Hanzhong and Ankang is from normal to floods. The time sequences of 539years' drought and flood in 5 Shaanxi stations are decomposed by EOX. The first three EOF modes make a contribu-tion accounting for 91% of the total variance. The first EOF makes a contribution accounting for 60. 3%. The concordant form takes the leading position of all these years. The second EOF contributes 19. 8%,it is the opposite type of drought and flood between south and north. The third EOF contributes 10. 9%.

[50]
Zhang De’er, 2000. A Compendium of Chinese Meteorological Records of the Last 3000 Years. Nanjing: Jiangsu Education Press. (in Chinese)

[51]
Zhang D D, Zhang J, Lee Het al., 2007. Climate change and war frequency in eastern China over the last millennium.Human Ecology, 35(4): 403-414.We explore the association between climate change and warfare in eastern China over the past millennium from a macro-historic perspective. High-resolution palaeo-temperature reconstructions and the complete record of warfare incidence in eastern China were compared. Results show that warfare frequency in eastern China (its southern portion in particular) significantly correlated with the Northern Hemisphere temperature oscillations. Almost all peaks of warfare frequency and dynastic changes occurred in cooling phases. We suggest that in historic China, the reduction of thermal energy during cooling phases significantly shrank agricultural production. Such ecological stress interacted with population pressure and China unique historic and geographic setting to bring about the high frequencies of warfare over the last millennium. We recommend scholars take climate change into account as they consider the anthropology of warfare in the historic past.

DOI

[52]
Zhang P Z, Cheng H, Edwards Ret al., 2008. A test of climate, sun, and culture relationships from an 1810-year Chinese cave record.Science, 322(5903): 940-942.Abstract A record from Wanxiang Cave, China, characterizes Asian Monsoon (AM) history over the past 1810 years. The summer monsoon correlates with solar variability, Northern Hemisphere and Chinese temperature, Alpine glacial retreat, and Chinese cultural changes. It was generally strong during Europe's Medieval Warm Period and weak during Europe's Little Ice Age, as well as during the final decades of the Tang, Yuan, and Ming Dynasties, all times that were characterized by popular unrest. It was strong during the first several decades of the Northern Song Dynasty, a period of increased rice cultivation and dramatic population increase. The sign of the correlation between the AM and temperature switches around 1960, suggesting that anthropogenic forcing superseded natural forcing as the major driver of AM changes in the late 20th century.

DOI PMID

[53]
Zheng Jingyun, Hao Zhixin, Zhang Xuezhenet al., 2014. Drought/flood spatial patterns in centennial cold and warm periods of the past 2000 years over eastern China.Science Bulletin, 30: 2964-2971. (in Chinese)Drought/flood spatial patterns over eastern China under centennial cold and warm regimes were investigated. The 63-site yearly dry/wet grade data set derived from Chinese historical documents was used, together with an up-to-date 2000-year long temperature series reconstructed from synthesis of 28 temperature proxies in China. We defined the index of difference between drought and flood frequency to reconstruct the drought/flood spatial patterns for five cold periods(440–540, 780–920, 1390–1460, 1600–1700, and 1800–1900 CE) and four warm periods(650–750, 1000–1100, 1190–1290, and 1900–2000 CE). The results showed that there are no consistent patterns over eastern China among all cold/warm periods. However, for most warm periods, drought(flood) dominated north(south) of the Yangtze River. The ensemble mean drought/flood spatial patterns for all warm periods illustrated a dipole pattern with drought(south of 25°N)—flood(25°–30°N)—drought(north of 30°N), with the exception of flood in the Loess Plateau. For all cold periods, the ensemble mean drought/flood spatial patterns showed an east to west distribution, with flood east of 115°E and drought dominant west of 115°E, with the exception of flood between approximately110°E and 105°E. These differences in ensemble mean drought/flood patterns suggest that the probability of drought north of the Yangtze River and flood in the valleys of the XiangJiang and GanJiang rivers south of the Yangtze River is higher in warm periods than in cold periods.

DOI

[54]
Zheng Jingyun, Shao Xuemei, Hao Zhixinet al., 2010. An overview of research on climate change in China during the past 2000 years.Geographical Research, 29(9): 1561-1570. (in Chinese)

[55]
Zheng Jingyun, Wang Shaowu, 2005. Assessment on climate change in China for the last 2000 years.Acta Geographica Sinica, 60(1): 21-31. (in Chinese)The climate change in China was assessed synthetically for the last 2000 years, based on reviewing climatic change research literature published in the last 20 years. The main conclusions are as follows: (1) In the 20th century, a warming trend was clearly detected, but for eastern China the fluctuation magnitude was less than the maximum level, which occurred in the last 2000 years. (2) Precipitation showed the inter-centennial tendency having obvious spatial difference, especially in North China and south of the Yangze River, is opposite to the low frequency change trend. With respect to the entire change trend, before 280 AD, the climate was relatively wet but afterwards the climate gradually became dry. Furthermore, after 1230 AD, the climate was in the stabilized state of dryness. (3) The temperature change tendency in eastern China is consistent with western China but there were obvious differences in the magnitude and timing of the cold/warm epoch. (4) During the Medieval Warm Period, the climate was relatively dry in North China, while it was relatively wet in the south of the Yangtze River. In addition, the climate was relatively wet during the Little Ice Age in North China and the precipitation variation became greater in eastern China.

[56]
Zheng Jingyun, Zhang Peiyuan, Zhou Yufu, 1993. During historical times by using the number of drought/flood counties.Geographical Research, 12(3): 1-9. (in Chinese)

[57]
Zhou Qi, 2003a. Analysis on the correspondence between the agricultural disasters caused by droughts and waterloggings in Baoji and the climate change in east China during the past 1500 years.Arid Zone Research, 20(2): 123-126. (in Chinese)The historical climate fluctuations affected strongly the traditional dry farming in China. It is considered that the agricultural disasters caused by droughts and water loggings are the results of environmental change. It has become as one of the hot domains in the study on global change since recent years to reveal the response of agriculture to environment. Based on the Chinese historical documents about the agricultural disasters caused by droughts and water loggings during the past 1,500 years, in this paper, the statistical data show that the occurring frequency and the situation of the traditional dry farming disasters caused by droughts and water loggings had the obvious fluctuations in Baoji during the period from the 7th to the 20th century. Comparing with the temperature change in the monsoon areas in east China, the frequent occurrence of drought disasters corresponded with the cold periods but the drought disasters occurred less during the hot periods. Moreover, the situation of the traditional dry farming disasters caused by droughts and water loggings was serious during the periods when the temperature changed suddenly but it was not so serious during the periods when the temperature change was not so violent. The analyzed result shows that there were the millenium circles in the change of the traditional dry farming disasters caused by droughts and water loggings in Baoji. It is considered that the change of the farming disasters caused by droughts and water loggings was the response to climate change.

[58]
Zhou Qi, 2003b. Agriculture response to environmental change in west Guanzhong Plain during the past 1500 years.Journal of Arid Land Resources and Environment, 17(5): 26-29. (in Chinese)Revealing the response of human being to environmental change has become a new hotspot in global change studies lately. It is also an important research field for Chinese researchers. The temperature change sequence in east China during past 2000 years reconstructed by GE-quansheng ,etc.has take into account recently. On the basis of drought / flood historical records in Guanzhong plain during 1500 years,the number of drought/flood disasters had statistied. The history change of agricultural drought in Guanzhong plain had been analysed by the use of the frequency analytical method and disaster condition index analytical method. a good parallelism relationship between the regional agriculture drought frequency and China east climatic change was found:the more cold in the air, the more frequency of drought, and sharpen condition of disaster in climate heterogenesis period .

[59]
Zhu Kezhen, 1973. The primary study of climate changes in China since the past 5 ka.Science in China (Series B), (2): 169-189. (in Chinese)

[60]
Zhu Shengzhong, 2012. Spatial and temporal distributions of floods and droughts in Liangshan in Ming and Qing dynasties.Geographical Research, 31(1): 23-33. (in Chinese)Based on the historical data of floods and droughts collected from local records in Liangshan area of Sichuan Province,archival materials,investigation materials,collections of floods and droughts,atlas and books written by current authors,the article made a statistical analysis of the spatial and temporal distributions of floods and droughts in Liangshan in the Ming and Qing dynasties.Results are shown as follows.(1) Floods and droughts happened frequently and there were more floods than droughts in this area in Ming and Qing dynasties.(2) Most of the floods and droughts were observed in spring and summer.(3) Most of floods and droughts did not happen in the same year.(4) Most of the flood and drought disasters were at normal and severe degrees,and there were relatively few extremely severe disasters.Most of floods and droughts happened in the lower Jinsha River basin and Anning River basin.The studies on the historical floods and droughts in Liangshan might be helpful to prevent and alleviate the damages induced from these disasters in the area at present.More attention should be paid to the following aspects.Flood disasters should be concerned more than drought disasters in this area.All the construction works prepared for the flood and drought disasters should be done before spring.The lower Jinsha River basin and Anning River basin should get priority in funds and personnel arrangement.Some topics related to this article,such as what causes the spatial and temporal distribution of floods and droughts,and what people can do to deal with flood and drought disasters in Liangshan,need to be further studied in the future.

DOI

[61]
Zhu Shiguang, Wang Yuanlin, Hu Lingui, 1998. Study on climate variations in the region of Guanzhong in the historical period.Quaternary Sciences, (1): 1-11. (in Chinese)Guanzhong basin lies in the center of Shaanxi Province. It is near the QinlingMountains in the Southern of the region. In the Northern of the area, it is near theHuanglong and Qiaoshan Hill. Yellow River is in the eastern and Longshan Mountainis in the western of the district. Nowadays, the basin is governed by five cities i. e.Xi'an, Xianyang, Baoji, Weinan and Tongchuan.The basin consistent with Weihe River fault Weihe River going from west to east.In the center of area, it is a region of Weihe terrace. In the northern area. it is pallof the Loess Plateau. In the southern area, it is a series of alluvial fan of QinglingMountains.Guanzhong basin is' one of the birthplaces of Chinese Nationality. In the l.15whition years ago, Lantian ape-man lived here. In the middle of Holocene, that is,the clan community in the Neolithic age. It was the main distributed area of Yangshao Culture and Longshan Culture. The production of primitive agriculture and stockraising was very prosperous in the region.Since the year of 1000 B.C., the capitals of 13 Dynasties, such as Zhou, Qin,Han, Tang Dynasty and so on, had been built in Xi'an. Guanzhong area was apolitical, economic and culture center in China, it lasted above 1100 years as a capital.After Tang dynasty the capitals of feudal kingdom were not built here, but Xi'an wasalso an important city in Shaanxi province and the Northwest China. So, Guanzhongbasin is a center of Chinese traditional culture. Because of thes, there are a lot ofancient traces and a large quantity of historical documents, offering as the basis forstudying climatic change of historical time.Especially since the year of 221 B. C., in many historical periods, based on thehistorical data and other research results, such as arehaeological studies, pollen analysis,and loess, studies, we can establish the criterion which is a unit of 10 years or oneyear in different .rate on climate variation. If tracing to the early of Holocene, we canuse the ways of archaeology and geology to build up standard array of climate changein the whole Holocene. It is very necessary for us to research climate variation in theHolocene and in historical period.Based on collecting and sorting out for archaeological discoveries, pollen analysesand historical documents, it is divided into 10 stages of climate change in the area inhistorical period as followings:(1) In the early of Holocene (10 000 - 8 000 aB. P. ), frigid climate, the annualmean temperature was 5-6 lower than that of present.(2) In the middle of Holocene (8 000- 3 000 aB. P. ),warm and humid climate.During this period, the annual mean temperature was 2 higher than that of presentin Yangshao Culture period (7000- 5 000 aB.P.). The annual mean rainfall was 100-200mm more than that of present.(3) In the 11th Century B.C. -the sib Century B.C., frigid and arid climate. Theannual mean temperature was 1-2 lower than that of present, and the precipitationwas lower than that of present.(4) In the 8th Century B.C -1st Century B.C., warm and humid climate. Theannual mean temperature was 1 -2 higher than that of present and the rainfall wasmore than that of present.(5) In the 1st cent Century B.C. -the 6th Century A.D., cold and arid climate.(6) In the 7th A.D. - the 8th A. D., warm and humid climate. The annual meantemperature was 1 higher than that of present(7) In the 9th Century A.D. -the 11th Century A.D., cold and arid climate.(8) In the 12th Century A. D., warm and arid climate. The annual meantemperature was higher than that of present.(9) In the early of the 13th Century A.D.-the early of 14th Century A.D., coldand arid climate.(10) In the early of 14th Century A. D. - the early of 20th Century A.D., frigidand arid climate.In every stage, there were some fluctuations on temperature and rainfall.

DOI

Outlines

/