Research Articles

An index-based spatial evaluation model of exploitative intensity: A case study of coastal zone in Vietnam

  • WANG Wenyue , 1, 2, 3 ,
  • ZHANG Junjue 1, 2, 3, 4, * ,
  • SU Fenzhen , 1, 3
Expand
  • 1. LREIS, Institute of Geographic Sciences and Natural Resources Research, CAS, Beijing 100101, China
  • 2. University of Chinese Academy of Sciences, Beijing 100049, China
  • 3. Collaborative Innovation Center of South China Sea Studies, Nanjing 210023, China
  • 4. Beijing Normal University, Beijing 100875, China

Author: Wang Wenyue, specialized in remote sensing of marine fisheries. E-mail:

*Corresponding author: Su Fenzhen, Professor, E-mail:

Received date: 2017-01-09

  Accepted date: 2017-06-26

  Online published: 2018-03-10

Supported by

National Natural Science Foundation of China, No.41421001

Copyright

Journal of Geographical Sciences, All Rights Reserved

Abstract

Coastal zones play a major role in the conservation of marine ecosystems and the sustainable use of resources not only because of their special geographical environment but also because of their high temporal and spatial variability. With the development of urbanization, the exploitation and utilization of coasts have become important issues in the debate. To evaluate variations in the intensity of the land resource exploitation of coastal zones, an index-based model has been proposed in this paper, and coastal Vietnam has been established as the study area. The model is based on four normalized indexes to realize rapid evaluation of the spatial distribution of the exploitative intensity after zoning. The model was established to characterize the different exploitative intensities in different segments of the coast and to graphically present a sequence of decision choices for decision-makers. The results are as follows. (1) The simplicity and rapidity of the index operations can address the fast-changing characteristics of coastal exploitation and meet the desired precision. (2) The choices of the landward buffers fit well with the banded characteristics of the coastal zone. The buffers are horizontally divided into equidistant subregions, which can quantify the spatial differentiation of the exploitative intensity along the coast and perpendicular to the coast. (3) The average exploitative intensity is low, and the proportion of area that is to be exploited accounts for approximately 50%.Considering its spatial variation from north to south, the land exploitative intensity in the north is higher than that in the south. Compared to the intensity of land resource exploitation in the 20 km and 10 km buffers, the land exploitative intensity in the 5 km buffer is higher. The state of the intensity of land resource exploitation and how it can be used by stakeholders to manage coastal resources are then discussed.

Cite this article

WANG Wenyue , ZHANG Junjue , SU Fenzhen . An index-based spatial evaluation model of exploitative intensity: A case study of coastal zone in Vietnam[J]. Journal of Geographical Sciences, 2018 , 28(3) : 291 -305 . DOI: 10.1007/s11442-018-1473-1

1 Introduction

Being the interface between continental landmasses and the ocean, coastal areas are affected by the highly dynamic processes of nature and human activity (Privmavera, 2006; Pak and Majd, 2011). As humans have always had a close relationship with the coasts (Goudarzi, 2006; Jacobson et al., 2014), studies on coastal exploitation have become the most general and effective approach to characterize coastal management (Wu et al., 2014). Therefore, there is an ongoing need to evaluate the status of the intensity of land resource exploitation in coastal zones.
Many traditional studies about the exploitative intensity in coastal zones are based on classification (Anderson, 1976; Azab and Noor, 2003; Giri et al., 2005; Shalaby and Tateishi, 2007). While the extraction and classification of data have been fulfilled based on knowledge acquired from both field surveys and visual interpretation (Wu et al., 2014), the classification-based method needs both fieldwork and a process known as ground-truthing (Green et al., 1996), after which the classification can be extended over the entire dataset. To build an index of the degree of coast utilization, Wu et al. (2014) conducted ten field surveys that covered the whole coastal zone of China and obtained more than 7000 site photos and 578 control points, after which classified datasets of the mainland coastline from the 1940s to 2012 were created by digitizing the topographic maps and visually interpreting remote sensing imagery. Lin et al. (2010) analysed the spatial-temporal land use change of Xiamen Island in the last 100 years by using man-machine interactive interpretation. The assessment of coastal zone development by Sun Xiaoyu (2008) was also based on manual interpretation and field investigations. TM (Thematic Mapper) images were also employed for supervised classification in coastal zones to monitor land use change (Muttitanon and Tripathi, 2005). Although the accuracy of these classification-based methods is high, they consume a great deal of human effort and time. Because coasts exhibit extreme variations in their areal extent, spatial complexity, and temporal variability (Klemas, 2012), the planning and management of land resources often requires an efficient method (Willem, 2013).
Another way to assess the exploitation of coast resources is to compute geoindicators to measure the exploitative intensity. This kind of study involves the use of a great deal of reliable data (e.g., land use data, GDP per capita, arable land per capita, and crop yield per unit area). Xiao (2012) established an integrated exploitative intensity evaluation model of coastal zones by establishing evaluation indexes and statistical analyses with matrix calculations. Although the results of such an evaluation are comprehensive, this method necessitates a considerable amount of computational efforts (Zhou et al., 2000). The demands on the quantity and quality of basic information data are high. Devoting a long period to the collection and preparation of geographical and statistical information is essential for the accuracy of the original data and directly determines the accuracy of the evaluation results. When intuitively expressing the status of the exploitative intensity in a spatial context for an analysis, the statistical results continue to face serious challenges of visualization.
Numerous efforts (Hildebrand and Norrena, 1992; Sekhar, 2005; Nagothu, 2005; Ballinger et al., 2010; Ye et al., 2014; Schernewski et al., 2014) have been made simultaneously to evaluate the exploitative intensity of coastal zones using ICZM (Integrated Coastal Zone Management, Earth Summit, 1992). Land use maps from 2000 to 2010 for China’s coastal zones were produced, and the land use intensity comprehensive index (LUICI) was calculated to analyse land use spatial patterns and land-ocean gradient characteristics (Di et al., 2015), following which the land use vector map was transformed into a gridded dataset of land use data at a 1 km scale for presentation. Different segments of coast generally develop under different environmental, natural, demographic, and socio-economic conditions. These conditions often vary and have a direct impact on the exploitative intensity (Muttitanon and Tripathi, 2005).The unbalanced distribution of development among different subregions results in the inability to obtain a decent solution (Zhang et al., 2012), and thus, the banded characteristics of coastal zones should be taken into consideration.
The purpose of this paper is therefore to propose a scientifically sound and practical model for the assessment of the exploitative status in coastal zones by extracting exploitative information based on the integration of three normalized indexes within regular spatial units and by focusing on the calculation of quantitative exploitative intensity values in GIS.

2 Methodology

2.1 Study area

The study area for this research is Vietnam, which is located along the eastern coast of the Indo-China Peninsula between 8°10'N-23°24'N and 102°09'E-109°30'E. Vietnam is immediately adjacent to southern China. With a coastline/area ratio of 0.011, Vietnam can be regarded as a marine nation (Anh et al., 2008).
Vietnam is characterized by 3260 km of coastline and presents an S-shaped pattern in a north-south vertically long strip. Among the 64 provinces of Vietnam, 28 are situated on the coast. Over 50% of its population lives in coastal zones. In general, the economic activities in coastal zones, such as shipping, fishing, tourism, and industry, increase as the population grows, and vice versa (Hiroshi et al., 2014). Some of the major characteristics of the country of Vietnam are as follows.
(1) Mountainous area. Three-fourths of Vietnam is composed of mountains or plateaus, the majority of which is situated in northern and central Vietnam. Low-lying areas are found in the east near the ocean, while the higher elevations are found in the western inland region.
(2) Fertile plains. The Red River Delta in the north and the Mekong Delta plain in the south are the two largest plains in Vietnam. Because of their fertility, they are the densest populated areas in Vietnam. In addition, several smaller plains are distributed within the north-south coastal zone. Most of these plains are located above the latitude 18°N, including the Thanh Hoa, NgheAn, Ha Tinh and Hue plains. Smaller plains are also located to the south of Hue, near Quang Nam and Binh Dinh. Widespread fertile plains are suitable for the development of large-scale agriculture.
(3) Abundant natural resources. Vietnam currently has 3.5 billion tons of coal reserves and 6.0 billion tons of oil reserves. In addition, Vietnam has many timber reserves. Up to more than 2000 species of fish live in the sea within Vietnamese borders, and its fishery resources are approximately 300 million tons (Gu, 2007). Such conditions contribute substantial to the industry and fishery of Vietnam.
(4) Tropical monsoon climate. Vietnam has abundant sunshine and rainfall, which constitutes a suitable climate for crops. More than 900 acres of arable land are found in Vietnam. Rice is the main planting crop, followed by corn and sweet potatoes, and its economic crops are coffee, tobacco and pepper.

2.2 Data source and data preprocessing

Landsat 5 TM data acquired in 2009 and 2010 were used in this study. The data preprocessing methods employed include radiometric calibration and gap filling. Satellite images used in the study can be seen in Table 1.
Table 1 Satellite images used in the study
Path/row Acquisition date
123/50 2010.01.28
123/51 2011.06.08
123/52 2011.06.08
124/49 2011.02.17
124/50 2010.02.04
124/52 2009.12.18
124/53 2009.12.18
125/48 2010.07.05
125/49 2010.02.11
125/53 2009.02.08
125/54 2009.12.09
126/45 2010.11.01
126/46 2010.12.27
126/47 2009.07.09
126/48 2009.02.15
127/47 2010.02.25

2.3 Division of coastal zones

Coastal zones are typical areas that are characterized by long and narrow strips. For convenience, we geometrically divided the coastal zone into a number of boxes while ignoring administrative divisions and natural geographical units. Zoning is an efficient way to compare the results of an evaluation both laterally and longitudinally, which can more clearly reflect the variations of the exploitative intensity. The zoning was performed as described below.
(1) Lateral zoning. From the coastline landward, we draw the study area into different regions that are parallel to the coastline with buffers of 5 km, 10 km and 20 km. Different natural and geographical conditions in the study area lead to different widths of the buffers.
(2) Longitudinal subregions. We divide the landward buffers into a number of equal-width regions by a unit of some selected miles. The selected mileage should not be too long to ensure the exploitative intensity in each region would not change dramatically. In addition, each subregion is relatively independent.
The results of zoning are presented in Figure 1.
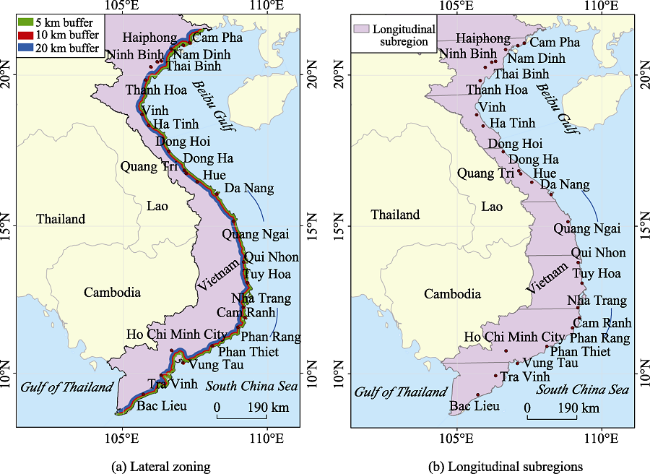
Figure 1 An example of coastal zoning
The advantages of the locations in separate areas are different. Natural conditions, such as the climatic and topographic conditions, hydrological conditions and vegetation distribution, also demonstrate some differences. As a result, the socio-economic conditions and exploitative intensities are different. Subdividing the area can provide an average of the summed exploitative intensity. There is no doubt that our method can only roughly estimate the average exploitative intensity of each region. However, a greater number of subdivisions will lead to a more accurate set of evaluation results and a more efficient use of time and manpower. An appropriate number of subdivisions is thus required according to our actual needs.

2.4 Extraction and calculation

Given the required amount of traditional manual interpretation work, we use an exponential method to extract the exploited regions. The principle of normalized indexes is discussed below, which we use to calculate the magnitude of the intensity of exploitation.
2.4.1 Normalized index
The NDVI (Normalized Difference Vegetable Index) (Rouse et al., 1974) is the most common and widely applied index (Robin et al., 2011). Similarly, other easy-to-calculate, simple and practical normalized difference indexes have been proposed as imitations of the NDVI in recent years. This type of index can be used individually without other image data. The basic principle is to find the bands with the strongest and weakest reflections of the object of interest among multiple spectral bands. Then, placing the strongest reflection in the numerator and the weakest reflection in the denominator, the gap between the two can be expanded by a normalized ratio operation. The primary objective of this approach is to obtain the maximum brightness enhancement of the generated index images while generally suppressing other information (Xu, 2008). A spectral graph of common coastal land use classes is given in Figure 2 using the samples of classes from imagery in the research area.
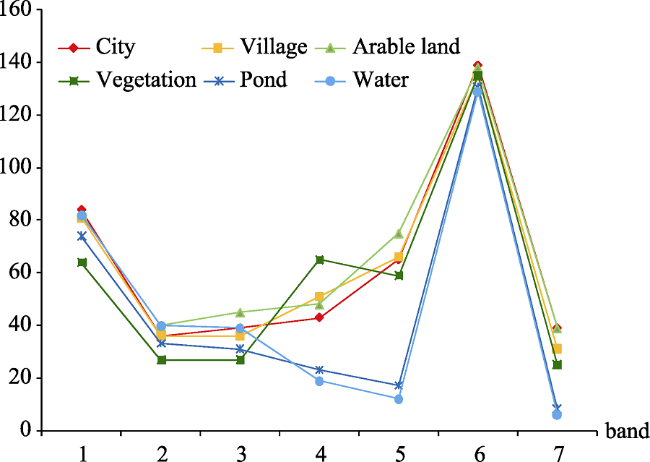
Figure 2 Spectral graph of six coastal land use classes
(1) NDISI (Normalized Difference Impervious Surface Index)
An impervious surface is a man- made or natural geomorphic object through which water cannot percolate into the soil, including roofs, roads, driveways, sidewalks, and parking lots (Slonecker et al., 2001). It has a close relationship with human activities and human life. From a remote sensing perspective, an impervious surface usually refers to a construction area with a smaller permeability relative to vegetation and soil and is characteristic of a city area (Lin et al., 2007).
The NDISI was proposed by Xu (2008). Building materials composed of impervious surfaces generally have characteristically high radiance in the thermal-infrared band and low reflectance in the near-infrared band. In accordance with the principle of normalized indexes, the ratio of the two reflectances is used to enhance impervious surface information. Impervious surfaces composed of cement primarily have high thermal radiation, and vegetation cannot grow on them. The thermal-infrared band represents the intensity of thermal radiation on the ground, and the near-infrared band represents the amount of vegetation. The ratio of these two can increase the distinction between them and highlight impervious surface information to the greatest extent (Xu, 2008, 2010). The NDISI is defined as follows (Xu, 2010):
$NDISI=\frac{TIR-(MNDWI+NIR+MIR)/3}{TIR+(MNDWI+NIR+MIR)/3}$ (1)
where TIR is the thermal-infrared band, such as band 6 in TM and ETM+ images, NIR is the near-infrared band, such as band 4 in TM and ETM+ images, and MIR is the mid-infrared band, such as band 5 in TM and ETM+ images.
When using this index, we make a 0-255 linear stretch for the thermal-infrared band and the MNDWI (Modified Normalized Difference Water Index) to make them consistent with the other bands (Xu, 2010). In the NDISI image, the value of an impervious surface is the biggest, followed by those of arable land and vegetation, while the value of water is the lowest. The NDISI has a high sensitivity to high-intensity building areas. The BSI (bare soil index) was used in rural areas as it has the advantage of being able to distinguish between low-intensity building areas and arable land.
(2) BSI (Bared Soil Index)
The BSI was proposed by Rikimaru (1996). It is based on the differences of the spectral signatures in the MIR and visible Red bands between bare soil and the background. In a BSI image, the value of bare soil or arable land is the biggest, followed by those of cities and low-intensity building areas (e.g., villages), while the values of water and vegetation are the lowest. The BSI may make mistakes while distinguishing between a city and arable land, but it is effective in distinguishing villages from arable land. It is defined as follows:
$BSI=\frac{(MIR+RED)-(NIR+BLUE)}{(MIR+RED)+(NIR+BLUE)}$ (2)
where RED represents band 3 in TM and ETM+ images, and BLUE represents band 1 in TM and ETM+ images.
(3) MNDWI (Modified Normalized Difference Water Index)
As is well known, the reflectance of buildings is suddenly strengthened from the near-infrared band to the mid-infrared band, while the reflectance of water in the mid-infrared band continues to decline. This approach makes the contrast between buildings and water obviously enhanced and reduces confusion and background noise greatly (Xu, 2005). Although the NSIDI and BSI are highly sensitive to water, some information from mudflats is also included. The MNDWI can facilitate the extraction of mudflat information from the built-up information. Xu defined the index as follows:
$MNDWI=\frac{Green-MIR}{Green+MIR}$ (3)
where Green represents band 2 in TM and ETM+ images.
(4) NDBI (Normalized Difference Built-up Index)
The NDBI was derived from the in-depth analysis of NDVI, and it was first proposed by Yang (2000) and subsequently renamed by Zha et al. (2003) as the NDBI. The reflectance of vegetation in the near-infrared band is larger than that in the mid-infrared band, which is the opposite relationship for built-up areas. The NDBI is established as follows:
$NDBI=\frac{MIR-NIR}{MIR+NIR}$ (4)
We use the NDBI to help screen out vegetation information that is otherwise mistakenly extracted by the NDISI as a referential index.
2.4.2 Index-based evaluation model
The use of a single index such as the NDISI or BSI may introduce the problem of an incorrect pixel. To enhance the precision, this paper uses the MNDWI, the BSI and the NDBI to assist the NDISI. The MNDWI is used for reducing water noise. The NDBI is applied for reducing vegetation noise. The MNDWI in conjunction with the NDBI may eliminate interference and improve accuracy.
An appropriate threshold is chosen for the extraction of information from the Landsat imagery after a number of attempts, the detailed processes for which are shown in Figure 3.
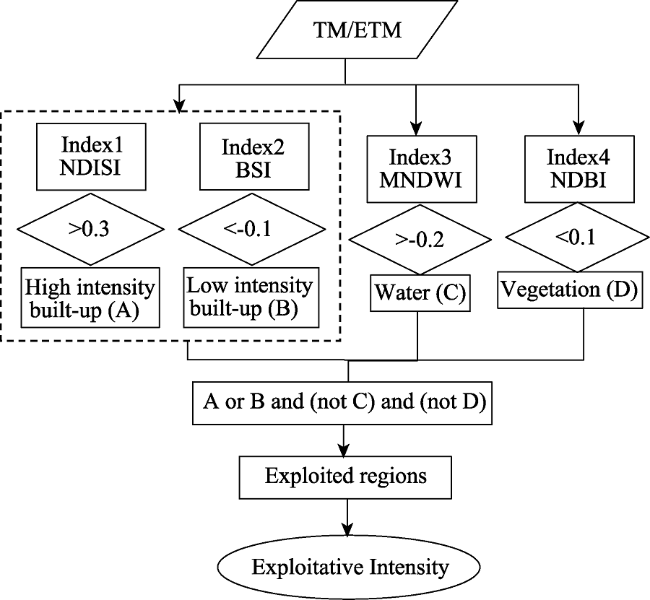
Figure 3 A flowchart of the extraction and calculation
We set high intensity built-up and low intensity built-up as A and B. The water is set to C and the vegetation is set to D. After the binarization images are acquired, we need to establish a logic operation and retrieve the desired exploited regions.
The original image and enhanced images using the above mentioned indexes are shown in Figure 4. The binarization results for each of the indexes are shown in Figure 5. The results of the logic operation are shown in Figure 6. A multi-resolution segmentation operation has been performed in both Figures 5 and 6.
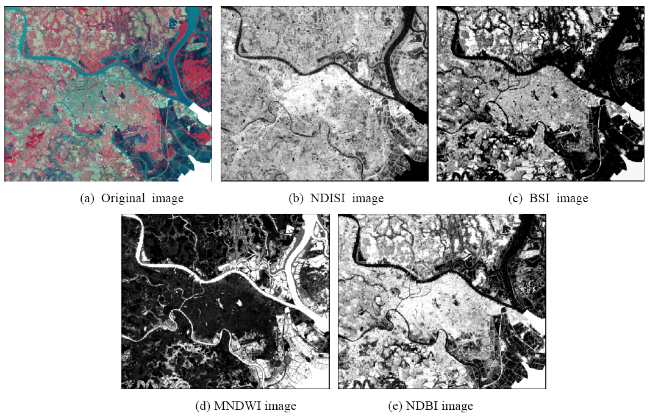
Figure 4 Original image (a) and enhanced images using the NDISI (b), BSI (c), MNDWI (d) and NDBI (e)
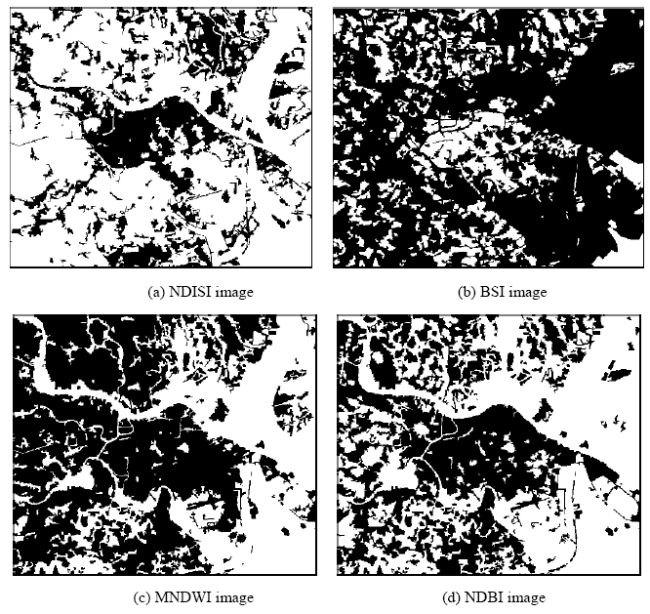
Figure 5 Binarization results for the NDISI (a), BSI (b), MNDWI (c) and NDBI (d)
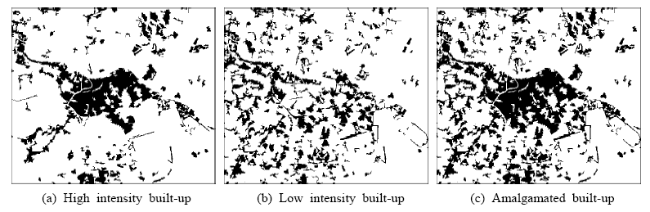
Figure 6 Logic operation results of high intensity built-up (a), low intensity built-up (b) and amalgamated built-up (c)
After the above processes, we calculate the percentage of the exploited area in each subdivided region to represent the exploitative intensity (EI). A higher proportion of the EI means the region is more exploited while a lower proportion means the region is less exploited.
$\text{EI=}\frac{\text{Exploitated area}}{\text{area}\ \text{of}\ \text{a}\ \text{sub-region}}$ (4)
EI stands for the exploitative intensity in each subregion.

2.5 Classification and evaluation

To intuitively express the grade of the EI, we separate the intensity index range into several intervals by the desired number of classes. We first choose the specific number of classes we need, after which we modify the range of each class according to the calculated intensity index. Obviously, this method is subjective and demonstrates a certain relativity. The results must vary according to different classification boundaries. However, it can adjust to the demands of the decision maker to some extent for operational convenience (Wijdeven, 2002). For example, we can adjust the boundaries to equalise the number in each class for balance purposes. At the same time, the classification results can show spatial variations among the exploitative intensity intuitively.

3 Results and discussion

3.1 Results

Considering the conditions of the South China Sea and Vietnam coastlines (Boateng, 2012), we choose 5 km, 10 km and 20 km as three different landward buffers for coastal Vietnam in the study area. We first divide the study area by units of 10 km. From south to north, it is divided into 151 subregions. Then, we calculate the proportion of the exploited area in each subregion. The evaluation and classification of the intensity of land resource exploitation are based on the calculated results.
According to the range of proportions in coastal Vietnam, we classify the buffers into 4 classes as follows: to be exploited (≤0.05), less exploited (0.05-0.15), moderately exploited (0.15-0.4) and highly exploited (>0.4). The area of each class is shown in Tables 2-4.
Table 2 Classification of the intensity of costal land resource exploitation in Vietnam and the South China Sea with a 20 km buffer
Class EI Number of regions Percentage
To be exploited <0.05 78 51.7%
Less exploited 0.05-0.15 43 28.5%
Moderately exploited 0.15-0.4 29 19.2%
Highly exploited >0.4 1 0.7%
Table 3 Classification of the intensity of costal land resource exploitation in Vietnam and the South China Sea with a 10 km buffer
Class EI Number of regions Percentage
To be exploited <0.05 76 50.3%
Less exploited 0.05-0.15 40 26.5%
Moderately exploited 0.15-0.4 31 20.5%
Highly exploited >0.4 4 2.6%
Table 4 Classification of the intensity of costal land resource exploitation in Vietnam and the South China Sea with a 5 km buffer
Class EI Number of regions Percentage
To be exploited <0.05 75 49.7%
Less exploited 0.05-0.15 37 24.5%
Moderately exploited 0.15-0.4 29 19.2%
Highly exploited >0.4 10 6.6%
As the tables show, the exploitative intensities throughout the coastal zones of Vietnam are not very high. The proportions increase from highly exploited intensity classes to lower exploitation classes. The proportion of the area to be exploited accounts for approximately 50%, which indicates the great potential for development. An overall difference of exploitative intensities coexists, and the weakly exploited classes are more prominent. The development and utilization of coastal areas require improvement to a great extent.
The classification of the intensity of land resource exploitation in coastal Vietnam is shown below in Figures 6-8.

3.2 Analysis of spatial variation

To clearly analyse the results, we partition coastal Vietnam into five regions from north to south for the sake of simplicity. The region stretching from the northern Vietnam border to Ninh Binh Province is labelled the North Area (the Red River Delta), that from Thanh Hoa Province to Quang Binh Province is labelled the Medio North Area, that from Quang Tri Province to Quang Ngai Province is labelled the Middle Area, that from Binh Dinh Province to Khanh Hoa Province is labelled the Medio South Area and that from Ninh Thuan Province to the southern Vietnam borderis labelled the South Area (the Mekong River Delta) (Figures 7-9).
(1) Spatial variation from the north to the south
The intensity of coastal exploitation exhibits extreme variations with the areal extent. The land exploitative intensities in the North and Medio North areas are obviously higher than in the Middle and South areas. In the vast areas of the Red River Delta plain and the Thanh Hoa - Nghe An - Ha Tinh plains, a great deal of arable land contributes to the development of cities and villages. Meanwhile, the land exploitative intensity in the Mekong River Delta plain is generally low except for within some denely populated areas such as Ho Chi Minh and Vung Tau. In the Middle Area, moderately exploited and highly exploited areas are scattered throughout the small coastal plains.
(2) Spatial variation by vertical direction
The distribution of land use types shows different characteristics of zonation with different offshore distances. A statistical analysis of the results on the offshore buffers is applied to obtain the proportion of the area with the same exploitation intensity among the different buffers. The offshore exploitative intensity of the 5 km buffer is higher than those of the 10 km and 20 km buffers. Inshore locations are advantageous due to their good conditions for transportation. In most port cities such as Da Nang, the exploitative intensity is higher closer to the coast. Port economies have a significant influence on the exploitative intensity. Meanwhile, the situation is opposite in some places. As Figure 9 shows, urban agglomeration cannot be illustrated in the 5 km buffer due to the influence of sediment deposition from the river, such as in the Port of Haiphong in the Red River Delta. Additionally, Quy Nhon in the Medio South Area is not particularly close to the coast. Coastal lands here cannot be utilized entirely for exploitative purposes due to restrictions presented by landforms in the 5 km buffer. Meanwhile, areas in the 10 km and 20 km buffer are highly developed.
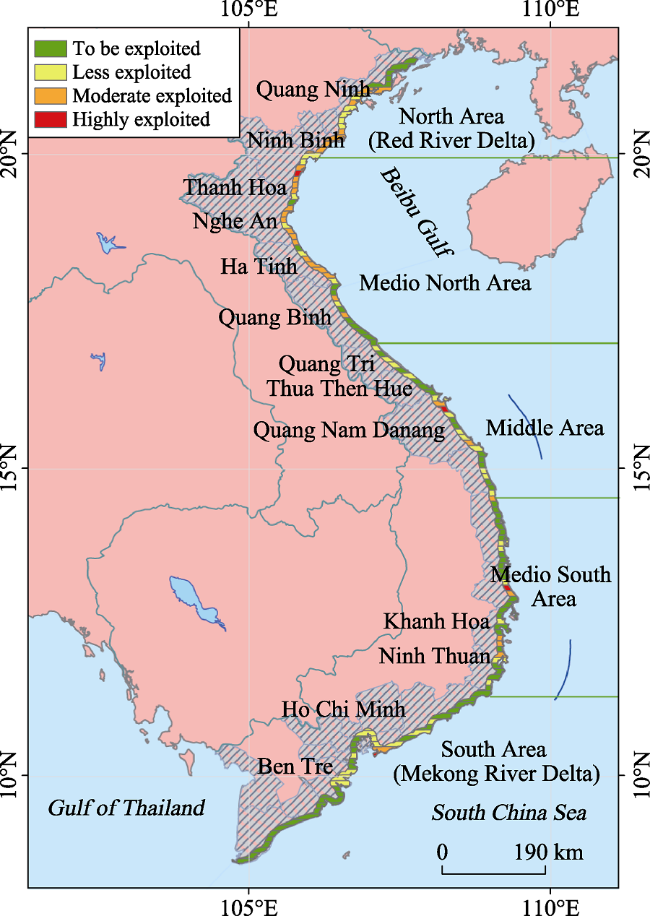
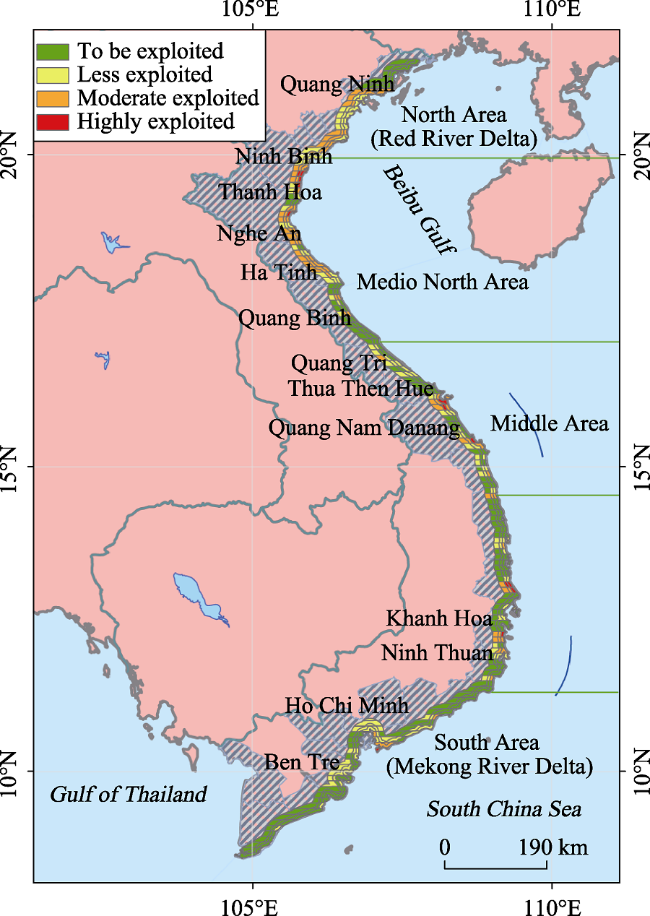
Figure 9 A classification map of the intensity of land resource exploitation in coastal Vietnam with a 5 km buffer (2010)

3.3 Discussion

Deltaic plains are often highly exploited. As shown in Figure 7, the Red River Delta is obviously highly exploited in 20 km buffer, and Haiphong and Ha Long are also well exploited (Figures 8 and 9). Haiphong is the biggest port in northern Vietnam, while Ha Long is a famous tourist city. In addition, Nam Dinh, Ninh Binh and Taiping are more relatively exploited. The city of Ho Chi Minh, which is located in the north eastern part of the Mekong River Delta, is a typical representation of a highly developed area (Figure 7). It is the largest city in Vietnam with convenient transportation facing the sea towards the south. Deltaic plains are low-lying areas with an average elevation of less than 2 m that contain many rivers and fertile soil. The Mekong River Delta is one of the most productive food regions in the world, and it is relied upon by the approximately 18 million people living within it as a primary food source (Ishida et al., 2007).
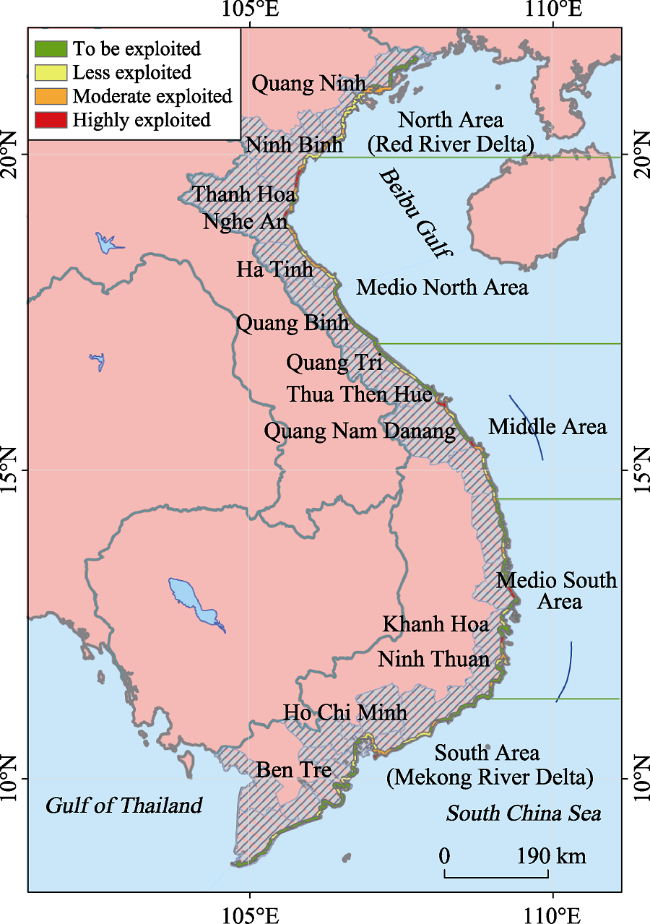
Figure 7 A classification map of the intensity of land resource exploitation in coastal Vietnam with a 20 km buffer (2010)
Harbours are also well exploited. Many major cities are on or near good harbours and have port facilities. For example, Da Nang and Hue (Figure 5) are two of the more highly exploited cities in the Middle Area. Approximately 8 km east of Hue is the coastline. It is located to the south of Da Nang, and it is the rice centre of Vietnam (Wang Peng, 2010). Coastal areas serve as the centre for not only human settlement but also a variety of commercial services (David, 2009; Fletcher et al., 2011). Haiphong is the biggest port in northern Vietnam. A port is an important aspect of coastal zone exploitation and management.
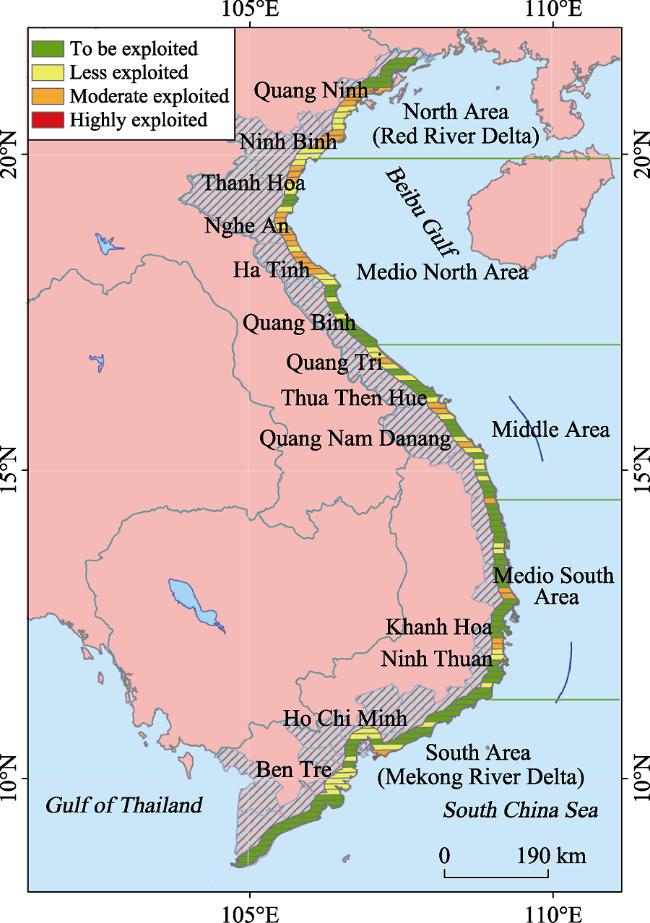
Figure 8 A classification map of the intensity of land resource exploitation in coastal Vietnam with a 10 km buffer (2010)
On the whole, the exploitative intensity in Vietnam is low and unbalanced, but the conditions of land use are superior (Figure 10). The coastal regions greatly need to be exploited. The ocean provides humanity with both animate and inanimate natural resources, such as food, materials, essential substances, and energy (Visbeck et al., 2014). Vietnam can sustain development by strengthening its management and moderately exploit its resources. Some decisions must be taken to achieve sustainable development under the balanced consideration of sustainability and resource shortages. Residents, who are associated with the development of industry, including that of tourism, can create more value by maintaining the excellent conditions of the coastal zones (Figure 10).
Figure 10 Comparison of the intensity of costal land resource exploitation with 5 km, 10 km and 20 km buffers

4 Conclusions

Since coastal zones tend to be spatially complex and exhibit high temporal variability, this paper aims to establish an index-based spatial heterogeneity evaluation model of the exploitative intensity in coastal zones. Based on the understanding of the evaluation of exploitative intensity (Esteves et al., 2003), four normalized indexes were combined to obtain the classification. This model has three advantages suitable for the characterization of the intensity of coastal resource exploitation, as summarized below.
(1) Efficiency. With the continuous development of human society, the development and utilization of coastal zones are changing. Due to the high temporal and spatial variability of coastal regions, up-to-date the intensity of coastal exploitation needs to be recalculated frequently. The simplicity and rapidity of the index operations in this model can address the fast-changing characteristics of coastal exploitation efficiently. Stakeholders can easily use it because of the simplicity of the processes and the generalization of the results (Debaine et al., 2012).
(2) Zonation. Coastal zones are typically shaped as long strips. In the study area, Vietnam appears as a north-south extension with a length of 3260 km. Coastal exploitation has regional characteristics. Different regions vary in their location, economic development and existing industries. Therefore, a zonation for striped buffer areas is suited for the coastline. This model can show the distribution of exploitation intensities directly.
(3) Visualization. The classification of the exploitation intensity makes the results easy to read. Decision-makers can observe the exploitative status of the study area clearly using the figures. The exploitation intensities were not only analysed, but also visualized, which is more intuitive to show the status land resources in this area.
These results provide useful information that is fundamental to the successes of coastal management and future studies. However, the method of grading is not absolute. The classification boundaries may impose different influences on the evaluation results.
Additionally, there are some shortcomings in the model and the method of analysis, and further improvement is expected. This index-based model is focused on the quick extraction of built-up information to satisfy continually changing coastal zone characteristics, which means that the precision may be differently influenced to some extent, especially in the ability to distinguish between built-up and bare land. As a result, the model needs subsequent manual revisions. The longitudinal segmentation method is effective for a north-south oriented coastline, while a latitudinal segmentation approach is better for a west-east oriented coastline. Meanwhile, if the fractal index of the coast is high, it may not perform well.

The authors have declared that no competing interests exist.

[1]
Anderson J R, 1976. A land use and land cover classification system for use with remote sensor data. US Government Printing Office.A revision of the land use classification system as presented in U.S. Geological Survey Circular 671

[2]
Anh N T, Huong N Tet al., 2008. Gastric and colo-rectal cancer mortality in Vietnam in the years 2005-2006.Asian Pacific Journal of Cancer Prevention, 9(2): 299.BACKGROUND: The International Collaborative Epidemiological Study of Host and Environmental Factors for Stomach and Colorectal Cancers in Southeast Asian Countries (SEACs) has been conducted in Viet Nam from 2003 to 2008 on a case-control basis. For further effective primary prevention, we examined gastric and colorectal cancer mortality nationwide in eight regions of Viet Nam in 2005-06. METHODS: Both demographic data and lists of all deaths in 2005-06 were obtained from all 10,769 commune health stations in Viet Nam. Five indicators included name, age, sex, date of death and cause of death was collected for each case. We selected only communes having the list of deaths with clear cause for each case and crude mortality rate for all causes from 300-600/100,000 as published by the Ministry of Health for a reasonable accuracy and completeness. Obtained data for all causes, all cancers, stomach and colorectal cancer deaths as well as demographic information were processed using Excel software and exported to STATA 8.0 for estimation of world age-standardized cancer mortality rates per 100,000. RESULTS: Data were available for 1,246 gastric cases, (819 male and 427 female) with age-standardized mortality rates from 12.7 to 31.3 per 100,000 in males and from 5.9 to 10.3 per 100,000 in females in the 8 regions of the country. For colorectal cancers, 542 cases (268 male and 274 female) gave mortality rates from 4.0 to 11.3 per 100,000 in males and from 3.0 to 7.8 per 100,000 in females. DISCUSSION: Stomach cancer mortality in males in the region of North East in the North Viet Nam (2005-06) was higher than that in Japan (2002) (31.3 versus 28.7 per 100,000) while colorectal cancer in Viet Nam was lower. While prevalence of Helicobacter pyloris infection in Viet Nam was from 70-75% in both males and females, the stomach cancer rate in males was significantly higher than in females, 31.3 versus 6.8 per 100,000, suggesting an influence of other environmental risk factors. Whether protective factors are operating against colorectal cancer in Viet Nam now needs to be explored.

PMID

[3]
Azab M A, Noor A M, 2003. Change detection of the North Sinai Coast by using remote sensing and geographic information system. In: The 4th International Conference and Exhibition for Environmental Technologies Environment.ABSTRACT The study area extends along North Sinai coastal plain which is considered an integral part of the Mediterranean Sea. Coastal zones are important issues in the international debate on the environment and sustainable development. The coastal zone generally consists of the interface between land and sea in such an equation where the marine space and recourses are as important as terrestrial ones. The coastal zone have become the major site for extensive economic activities where many of the coastal developing countries depend essentially on the scarce coastal recourses for economic growth. The main goal of this study is to assess the coastal hazards that may occurred due to shoreline changes (erosion or / and deposition). This will lead to determination of the hazard magnitude of the unstable coastal area, which will reduce the environmental risk for the national development and natural resources of North Sinai coastal area. The present study provides the end users and decision-makers with the necessary information on long term shoreline behaviors of the study areas. This approach could be applicable to other coastal areas of Egypt, e.g. Red Sea coast through : a) delineating the pattern of shoreline changes within three time intervals 1970, 1984, and 1996. b) delineating the hazard area due to coastal changes and natural hazards affecting use and development of the resources. c) providing maps showing the hazard areas over the coastal zones of the risk area. The shoreline changes have been delineated along the North Sinai coast by overlying different layers obtained from satellite images of Landsat Thematic Mapper acquired in 1984, 1996 and vector data obtained by vectorizing the shoreline from the topographic sheets scale 1:100,000 . The digital data ( satellite images ) and the topographic maps are geometrically corrected by the use of ERDAS IMAGINE 8.5 software.

[4]
Ballinger R, Pickaver A, Lymbery Get al., 2010. An evaluation of the implementation of the European ICZM principles.Ocean & Coastal Management, 53(12): 738-749.The European principles of Integrated Coastal Zone Management (ICZM) are often viewed as central, defining features of the EC approach to ICZM, enshrined within the EC Recommendation (2002/413/EC) and endorsed by the European Commission in its Communication on ICZM (COM(2007) 308 final). This paper presents the findings of COREPOINT surveys which evaluated the extent to which the ICZM principles are addressed and interpreted across the North West European region. An interpretation of these findings is undertaken in order to provide an assessment of local ICZM development against the European ICZM Progress Indicator. The surveys revealed rather mixed adherence to with the EC ICZM principles at national, regional and local levels, although there were some promising results related to the principles of local specificity and stakeholder engagement. The principles providing the greatest challenge were those promoting the broad holistic approach, the long-term approach and adaptive management. The surveys demonstrated the value of using a structured, clearly designed xpert survey for providing an insight into operational aspects of the ICZM principles and provided a means of assessing ICZM progress. As such, this paper provides a useful contribution to the ongoing European and wider debate about the principles and their evaluation.

DOI

[5]
Boateng I, 2012. GIS assessment of coastal vulnerability to climate change and coastal adaption planning in Vietnam.Journal of Coastal Conservation, 16(1): 25-36.Vietnam’s coastal zone provides a diverse range of natural resources and favourable conditions for social and economic development. However, its coastal ecosystems are highly vulnerable, due to several natural coastal hazards, over-exploitation and other human activities. In spite of diverse interventions, Vietnam’s coastal zone continues to experience significant damage from floods, erosion and typhoons. These hazards are being intensified by climate change and associated rising sea levels. This paper assesses the potential vulnerability of Vietnam’s coast to climate change and discusses possible adaptation policies and plan to reduce the impacts. GIS analysis was used for the assessment of coastal vulnerability. Related literature was reviewed to develop detailed understanding of coastal adaptation to climate change. Adaptation policies and plans were appraised to identify potential coastal adaptation policies and plans that could be adapted by Vietnam. It was identified that vulnerability of the coastal zone of Vietnam could not be attributed only to climatic factors, but also to the physical condition of the coastline. Much of Vietnam’s coastline, particularly, areas around the Red River delta and the Mekong River have elevations below 102m. These coastlines are largely developed and serve as economic centres of the country, which makes the coast more vulnerable to climate change and the rising sea level. The paper concluded that a non-structural approach (coastal buffer zones, building houses on stilts, storm warning systems, growing of flood-resistant crops and elevated storm shelters with medicine and food storage) could be used by Vietnam to adapt her low-lying coastline around the two deltas to climate change as this strategy enables vulnerable areas to be occupied for longer before eventual retreat. However, for these policies to be successful, it should be planned, implemented well in advance, monitored and evaluated over time.

DOI

[6]
Debaine F, Robin M, 2012. A new GIS modeling of coastal dune protection services against physical coastal hazards.Ocean& Coastal Management, 63: 43-54.Coastal dune management presents a unique problem to coastal scientists, not only because of the dynamic and complex nature of coastal dune systems but also because of the protection service against many coastal hazards such as storm surges in low and flat coastal countries, shoreline retreat, and aeolian erosion. In order to evaluate such a service, a new GIS modelling of a coastal dune protection service has been carried out on Noirmoutier Island. It is based upon geoinformation coming from LIDAR, Spot satellite and aerial photography data processing. This paper discusses the Geographic Information System (GIS) methodology used for data acquisition and analysis and presents a methodology developed (i) to characterise and map dune shapes using geoindicators in order to highlight aeolian deflation, marine coastal erosion and marine submersion over the long-term and (ii) to set up a transferable and synthetic methodology. This methodology is based upon spatial syntheses computed in regular 50 m*400 m boxes built up landward from the shoreline. Each variable is integrated within each box. This allows to quantify (i) spatial occurrence of each variable and (ii) spatial coincidence of many variables within each box. Each protection service is underlying by a set of variables. The state of the protection service is then discussed and quantified and can be used by stakeholders to manage dunes in a safe way for society stakes.

DOI

[7]
Di X, Hou X, Wang Yet al., 2015. Spatial-temporal characteristics of land use intensity of coastal zone in China during 2000-2010.Chinese Geographical Science, 25(1): 51-61.Based on remote sensing and GIS techniques, land use maps in 2000, 2005 and 2010 in China’s coastal zone were produced, and structural raster data of land use were further generated to calculate land use intensity comprehensive index (LUICI) for analyzing land use spatial-temporal characteristics at 1 km scale. Results show that: 1) from the perspective of spatial patterns of landforms at a macro scale, there is a significant difference in land use intensity between the north and the south of China’s coastal zone. Hotspots of changes mainly concentrated in metropolitan areas, estuaries and coastal wetlands; 2) elevation is an important factor that controlling land use spatial patterns at local scale. Land use intensity is much higher within areas below the elevation of 400 m and it decreased significantly as the elevation increasing; 3) there is a significant land-ocean gradient for land use intensity, which is low in island and near-shore areas, but high in the regions that 4–30 km far away the coastline because of much intensive human activities; however, in recent decades land use intensity had been promoted significantly in low near-shore area due to extensive sea reclamations; 4) significant differences of land use intensity were also found among provincial administrative units. A rising trend of land use intensity was found in provincial-level administrative units from 2000 to 2010. To sum up, elevation, land-ocean gradient, socio-economic status and policy are all influencing factors to the spatial patterns and temporal variations of land use intensity in China’s coastal zone.

DOI

[8]
Esteves L S, da Silva A R P, Arejano T Bet al., 2003. Coastal development and human impacts along the Rio Grande do Sul beaches, Brazil. Journal of Coastal Research, 23(9): 548-556.Rio Grande do Sul (RS), the southernmost state in Brazil, has a 630-km long shoreline dominated by undeveloped sandy beaches. Unlike other states in Brazil, its colonization was more intense inland resulting in less than 5% of the state's population living in coastal cities. Many of the urbanized shores consist in small villages occupied only in the summer months. However, in the last decade there has been a change in this trend as coastal population is growing faster than the state's average. Many studies show that most of RS beaches are retreating, so it is urgent the implementation of a management plan to regulate occupation along the undeveloped shores to avoid new settlements in a hazardous coast. This work characterizes the RS coast based on the state of alteration of its beaches, which might be useful to support a statewide coastal management plan. The state shores were classified into four classes according to the dominant coastal environment (rocky headlands or open sandy beaches), type and distribution of developed shores (i. e. degree of urban development, type of beachfront constructions, urbanization in dune areas), and the impact of human activities. Developed and impacted shores comprise Classes 1,2, and 3 that are prograding beaches influenced by headlands, accreted open sandy beaches, and mainly retreating open sandy beaches, respectively. Class 4 consists in undeveloped sandy beaches that represents 76% of the state shoreline length. Despite the long undeveloped shore segments, human activities are already impacting 31% of the RS shoreline. The length of impacted shores might increase in the near future (due to the implementation of new road access to undeveloped areas) as unplanned new development occurs along retreating shores.

DOI

[9]
Fletcher S, Kawabe M, Rewhorn S, 2011. Wetland conservation and sustainable coastal governance in Japan and England.Marine Pollution Bulletin, 62(5): 956-962.Abstract Coastal wetlands present particular challenges for coastal governance and for the implementation of the Ramsar Convention, not least because coastal areas are focal points of human activity and of governance ambiguity. Through the evaluation of Ramsar delivery at both national and local levels in Japan and England, the relationship between Ramsar implementation and coastal governance was examined. In England, Ramsar status is primarily treated as a nature conservation designation which limits the wider opportunities inherent in the designation. In contrast, in Japan, the Ramsar Convention is used as a policy driver at the national level and as a leverage to encourage citizen engagement, economic benefit, and wetland conservation at the local level. It was concluded that through the implementation of the Ramsar Convention in important coastal wetland areas, significant steps can be taken towards delivering integrated approaches to coastal governance. Copyright 2011. Published by Elsevier Ltd.

DOI PMID

[10]
Giri C, Zhu Z, Reed B, 2005. A comparative analysis of the Global Land Cover 2000 and MODIS land cover data sets.Remote Sensing of Environment, 94(1): 123-132.Accurate and up-to-date global land cover data sets are necessary for various global change research studies including climate change, biodiversity conservation, ecosystem assessment, and environmental modeling. In recent years, substantial advancement has been achieved in generating such data products. Yet, we are far from producing geospatially consistent high-quality data at an operational level. We compared the recently available Global Land Cover 2000 (GLC-2000) and MODerate resolution Imaging Spectrometer (MODIS) global land cover data to evaluate the similarities and differences in methodologies and results, and to identify areas of spatial agreement and disagreement. These two global land cover data sets were prepared using different data sources, classification systems, and methodologies, but using the same spatial resolution (i.e., 1 km) satellite data. Our analysis shows a general agreement at the class aggregate level except for savannas/shrublands, and wetlands. The disagreement, however, increases when comparing detailed land cover classes. Similarly, percent agreement between the two data sets was found to be highly variable among biomes. The identified areas of spatial agreement and disagreement will be useful for both data producers and users. Data producers may use the areas of spatial agreement for training area selection and pay special attention to areas of disagreement for further improvement in future land cover characterization and mapping. Users can conveniently use the findings in the areas of agreement, whereas users might need to verify the informaiton in the areas of disagreement with the help of secondary information. Learning from past experience and building on the existing infrastructure (e.g., regional networks), further research is necessary to (1) reduce ambiguity in land cover definitions, (2) increase availability of improved spatial, spectral, radiometric, and geometric resolution satellite data, and (3) develop advanced classification algorithms.

DOI

[11]
Goudarzi S, 2006.Flocking to the coast: World’s population migrating into danger.Live Science, 21-22.

[12]
Green E P, Mumby P J, Edwards A Jet al., 1996. A review of remote sensing for the assessment and management of tropical coastal resources.Coastal Management, 24(1): 1-40.This article reviews applications of remote sensing to the assessment of tropical coastal resources. These applications are discussed in the context of specific management objectives and sensors used. Remote sensing remains the only way to obtain synoptic data for large coastal areas uniformly in time and space, repeatedly and nonintrusively. Routine applications to tropical coastal management include the mapping of littoral and shallow marine habitats, change detection, bathymetry mapping, and the study of suspended sediment plumes and coastal currents. The case studies reviewed suggest that wider use of remote sensing in tropical coastal zone management is limited by (1) factors that affect data availability, such as cloud cover and sensor specification; and (2) the problems that decision makers face in selecting a remote sensing technique suitable to their project objectives. These problems arise from the difficulty in comparing the capabilities of different sensors and the limited amount of published information available on practical considerations, such as cost ffectiveness and accuracy assessments. The latter are essential if management decisions are to be based upon the results.

DOI

[13]
Gu Xiaosong, 2007. Is it the prediction of Vietnam’s rapid development in economy: The retrospect of Vietnam in 2006 and its prospect in 2007.Around Southeast Asia, (2): 1.In 2006,Vietnam held smoothly the 10th NPC and elected the new Central collective leadership,held successfully the APEC summit,gained the position of permanent normal trade offered by America,entering as its will into WTO.It's not only a certainty to the achievement of Vietnam's reform and openness during 20 years,but also laid the foundation for the future development.In addition,whether it is the prediction of Vietnam's rapid development in economy? To which people are paying attention.

[14]
Hadley D, 2009. Land use and the coastal zone.Land Use Policy, 26(12): 198-203.These physical changes in the coastal zone will occur alongside, and interact with, a variety of human impacts and drivers of change. Agricultural policy reform, and changes in production in response to this and to climate change, will alter coastal landscapes as well as sediment and nutrient inputs into coastal waters. Demographic change – an increasing UK population, who are on average older and who potentially have more leisure time – will be likely to bring about an increased demand for the recreational opportunities that the coast provides. This will mean more demand for land for housing and recreational facilities. A continuing trend of rising income levels may also fuel further demand for imported goods and hence the need for further port development, particularly in the south east of England. Coastal landscapes are also likely to be heavily impacted by the construction of renewable energy infrastructure, i.e. offshore wind farms and wave and tidal power projects.

DOI

[15]
Hildebrand L P, Norrena E J, 1992. Approaches and progress toward effective integrated coastal zone management.Marine Pollution Bulletin, 25(1): 94-97.The practice of Integrated Coastal Zone Management (ICZM) is growing in prominence worldwide as coastal nations realize that purely sectoral approaches to the management of land and marine resources are clearly inadequate. Growing environmental degradation and resource use conflicts in the coastal zone, the pursuit of unsustainable coastal development and narrowly focused conservation and protection strategies dictate the need for a more integrated and well coordinated approach. While some success has been realized in the application of the principles of ICZM in various coastal nations, the continued development of national and sub-national coastal management strategies, in concert with their further application in specific coastal regions, is required for the 1990s and beyond.

DOI

[16]
Hiroshi Takagi, Miguel Esteban, Nguyen Danh Thao, 2014. Introduction: Coastal disasters and climate change in Vietnam.Engineering and Planning Perspectives, 6: 21-28.The tsunami hazard along the coast of Vietnam was evaluated based on field survey of past tsunami events, reviewing present research results on the tectonic plate structures and seismic activity in the East Sea. It was found that there is no reliable information to confirm a strong tsunami on the Vietnamese coast in the past, and if tsunamis ever attacked the Vietnamese coast in the past, they were weak events with minor damage. From reviewing the published literature, it was found that the only sources for significant tsunamis that could affect the Vietnamese coast are the earthquakes in the Manila Trench. Calculated results using numerical models for the generation of a tsunami by a submarine earthquake, the propagation of tsunamis from the source to the coast of Vietnam and the flooding of coastal land by tsunamis, and with earthquake parameters derived from literature, show that if an earthquake with magnitude of=8.0 at the Manila Trench, a part of the coast of central Vietnam would experience tsunami heights of more than 1 m. With larger earthquakes, the part of the coast of Vietnam with a tsunami height of more than 1 m would expand to entire central Vietnamese coast and might cause significant damage to life and property among coastal residents. However, the possibility of an earthquake with magnitude of>8.0 happening at the Manila Trench is very small. Thus, the tsunami hazard and risk at the Vietnamese coast and its islands is insignificant.

DOI

[17]
Ishida M, Kudo T, 2007. Greater Mekong Subregion Economic Cooperation Program: Realizing Three Economic Corridors. Chiba: Institute of Developing Economies.

[18]
Jacobson C, Carter R W, Thomsen D Cet al., 2014. Monitoring and evaluation for adaptive coastal management.Ocean & Coastal Management, 89(2): 51-57.Monitoring and evaluation is a critical component of adaptive management, enabling adjustment of management actions and the assumptions upon which they are based. Despite the recognised need for adaptive management of the coastal zone, the way in which monitoring and evaluation can support practice is not often considered. Monitoring involves activities that measure the effectiveness of actions, whereas evaluation involves the interpretation of that information. In the first national study of its type, we analysed the extent that monitoring and evaluation was used to support adaptive management in the coastal zone in Australia. An on-line survey of 70 practitioners found 54 (77%) conducted monitoring and evaluation, and of these, only 25 (46%) used it for adapting management, and 17 (32%) for evaluating management effectiveness and assumptions. Use of monitoring and evaluation for adapting management was significantly correlated with organisation type, but not with perceived sufficiency of monitoring and evaluation, or the extent it informed decision-making. Assessment breadth was highly variable. Organisations who used monitoring and evaluation to adapt management and test assumptions were significantly more likely to conduct broad assessment, although assessment of socio-economic condition, resources and activities were least likely to be assessed. This has implications for the types of management decisions monitoring and evaluation can inform. For example, to determine which actions are most cost effective in preventing coastal erosion, both resources and outcomes need to be assessed. Overall, our results indicate a propensity for organisations to claim adaptive behaviour, but evaluation design does not facilitate it. Inappropriate design, insufficient resources (financial, technical skills), and concern for assessment scale (including the need to share information across organisations to inform regionally meaningful assessments) impede more adaptive behaviour. Capacity building in the use of evaluation frameworks designed to specifically support learning would enhance adaptive coastal management in Australia.

DOI

[19]
Klemas V, 2012. Airborne remote sensing of coastal features and processes: An overview.Journal of Coastal Research, 29(2): 239-255.Coastal ecosystems tend to be spatially complex and exhibit high temporal variability. Observing them requires the ability to monitor their biophysical features and controlling processes at high spatial and temporal resolutions, which can be provided by airborne remote sensors. High-resolution satellite data are now also available, yet the finer resolution and frequent, flexible overflights offered by airborne sensors can be more effective in a range of coastal research and management applications, such as wetlands mapping, coastal bathymetry, and tracking coastal plumes, salinity gradients, tidal fronts, and oil slicks. The airborne imagery is also useful for the interpretation of satellite data. This article reviews estuarine and coastal remote sensing applications that require the high spatial and temporal resolutions provided by airborne sensors.

DOI

[20]
Lin Tao, Li Xinhu, Zhang Guoqinet al., 2010. Dynamic analysis of island urban spatial expansion and its determinants: A case study of Xiamen Island.Acta Geographica Sinica, 65(6): 715-726.Most cities in the world are concentrated in coastal areas.As a special geographical component of coastal system,island urban spatial expansion is the outcome of interactions between city development and physical environment.This paper takes Xiamen Island,southeastern China,as an example to analyze island urban spatial expansion and its determinants by combining literature analysis of urban development policies,urban overall plans,population growth and industrial development,and geographical information analysis of historical maps and remote sensing images.Firstly,we reviewed the nearly 100 years of the Xiamen city development which can be identified into four periods:the embryo of modern city and early development (1908-1949;administrative boundary expansion and infrastructure development (1950-1979);special economic zone construction and rapid urbanization (1980-2003);changes from island city to bay city development since 2003.The dynamic changes of coastline,island shape,built-up area,transportation,administrative division,and major land use type conversion during the past about 100 years were analyzed individually and the characteristics of the island urban spatial expansion were concluded:expansion from a central point in the early days,expansion along a section of coastline,and expansion from coastline to inner land.Secondly,the potential determinants of island urban spatial expansion were discussed including administrative division adjustment,urban master planning revisions,industrial development,topography factors,coastal land reclamation,transportation expansion,and population growth.Finally,the effects of each potential determinant on island urban spatial expansion were summarized.The island urban spatial expansion is a result of interacted natural and social economic factors.The built-up area expansion is the major driver of island land cover and land use changes.This study can provide a scientific reference for further development of island and coastal regions of China.

DOI

[21]
Lin Yunshan, Xu Hanqiu, 2007. A study on urban impervious surface area and its relation with urban heat island: Quanzhou City, China.Remote Sensing Technology and Application, 22(1): 14-19.A remote sensing study on the urban impervious surface and its relation with urban heat island has been carried out taking Quanzhou city of SE China as an example.The remotely-sensed data have been obtained from two Landsat TM images of 1989 and 1996.Ridd(1995) indicated that the impervious surface area(ISA) and the fractional vegetation cover(Fr) have an inversely relation in urban areas.Accordingly,we obtained the spatial patterns of the impervious surface area by calculating fractional vegetation cover derived from the NDVI.The study revealed that the impervious surface area of the study area increased significantly from 1989 to 1996,expanding mainly southeastwards.Furthermore,this paper discussed the quantitative relation between the impervious surface area and the urban heat islands.The land surface temperature has been obtained from band 6 of the Landsat TM images.Based on the regression analysis between the impervious surface area and the land surface temperature,it can be concluded that the impervious surface area has a direct response to the increase of the urban heat island phenomenon.

[22]
Muttitanon W, Tripathi N K, 2005. Land use/land cover changes in the coastal zone of Ban Don Bay, Thailand using Landsat 5 TM data.International Journal of Remote Sensing, 26(11): 2311-2323.Land use/land cover of the Earth is changing dramatically because of human activities and natural disasters. Information about changes is useful for updating land use/land cover maps for planning and management of natural resources. Several methods for land use/land cover change detection using time series Landsat imagery data were employed and discussed. Landsat 5 TM colour composites of 1990, 1993, 1996 and 1999 were employed for locating training samples for supervised classification in the coastal areas of Ban Don Bay, Surat Thani, Thailand. This study illustrated an increasing trend of shrimp farms, forest/mangrove and urban areas with a decreasing trend of agricultural and wasteland areas. Land use changes from one category to others have been clearly represented by the NDVI composite images, which were found suitable for delineating the development of shrimp farms and land use changes in Ban Don Bay.

DOI

[23]
Pak A, Majd F, 2011. Integrated coastal management plan in free trade zones, a case study.Ocean & Coastal Management, 54(2): 129-136.Free Trade Zones (FTZs) around the world offer special advantages to investors and facilitate import/export of goods in order to boost the regional economy. Integrated coastal management in these areas faces special challenges in addition to what ordinary ICZMs usually encounter. For a successful ICZM plan, the very strong business orientation in FTZs has to be taken into account, while other important aspects such as environmental, social, and cultural issues should not be overlooked. The problem becomes more difficult where the free zone is situated in sensitive and valuable environmental circumstances.Kish Island, a free trade zone in the Persian Gulf region, has recently been the focus of a major ICZM study. In order to address the different needs of various stakeholders in the island, four strategic management plans are prepared. The investigations carried out in the course of this study indicated that the required management plans for this free trade zone should be provided with a spatial-plan-oriented approach, otherwise the integration can hardly be achieved and implemented.This article describes Kish FTZ characteristics and problems that required ICZM initiatives, the methodology for ICZM study, the preparation and implementation of strategic management plans considering the free zone obligations, and the need for a spatial umbrella plan to facilitate the integration among different plans in the implementation process.Research highlights? Applying ICM plan to small islands requires new definition and special attention. ? ICM plan in Free Trade Zones (FTZ)must observe the demand for a better economy. ? A spatial-planning-oriented approach in ICM plans in FTZs is recommended.

DOI

[24]
Primavera J H, 2006. Overcoming the impacts of aquaculture on the coastal zone.Ocean & Coastal Management, 49(9): 531-545.The wide variety of goods and services provided by the coastal zone (food, medicines, nutrient recycling, control of flooding, typhoon protection) account for its many uses (fisheries, aquaculture, agriculture, human settlements, harbors, ports, tourism, industries). Aquaculture now provides a third of total fisheries production. Half of the total aquaculture yield comes from land-based ponds and water-based pens, cages, longlines and stakes in brackish water and marine habitats. But the opportunities for employment, income and foreign exchange from coastal aquaculture have been overshadowed by negative environmental and social effects. The environmental impacts include: mangrove loss, bycatch during collection of wild seed and broodstock, introductions and transfers of species, spread of parasites and diseases, misuse of chemicals, and release of wastes. The socioeconomic impacts include: privatization of public lands and waterways, loss of fisheries livelihoods, food insecurity, and urban migration. The paper gives recommendations on the attainment of responsible and sustainable aquaculture with emphasis on herbivorous and omnivorous species, polyculture, integration with agriculture and mangroves, and self-regulation in the form of codes of conduct and best management practices. Recommended approaches include holistic Integrated Coastal Zone Management based on stakeholder needs, mechanisms for conflict resolution, assimilative capacity of the environment, protection of community resources, and rehabilitation of degraded habitats, to improvements in the aquaculture sector pertaining to management of feed, water, and effluents.

DOI

[25]
Rikimaru A, 1996. LANDSAT TM Data Processing Guide for Forest Canopy Density Mapping and Monitoring Model. ITTO Workshop on Utilization of Remote Sensing in Site Assessment and Planning for Rehabilitation of Logged-Over Forests, Bangkok 30 July-1 August 1996, 1-8.

[26]
Robin M, Chapuis J L, Lebouvier M, 2011. Remote sensing of vegetation cover change in islands of the Kerguelen archipelago.Polar Biology, 34(11): 1689-1700.The plant communities in the Iles Kerguelen (South Indian Ocean) have been extensively modified by human activities, particularly through the deliberate release of rabbits, and the intentional or accidental introduction of several plant species. During the 1990 and 2000s, a decrease in precipitation resulted in a drastic reduction of some native plant species and in the increase in alien taxa. To monitor at a wide spatial scale the rapid changes of vegetation cover induced by summer droughts, we developed a method combining field data and satellite image analysis. A long-term field monitoring of plant communities was initiated on five small islands in 1992, and annually continued for over 1502years on a total of 161 line transects. Among these islands, the rabbit—which was the only introduced herbivore—was eradicated on three, remained on one control island, and had never been present on a second control island. We computed a linear model to link remote sensored vegetation indexes to plant cover deduced from line transects in numerous habitat types. After testing 14 vegetation indexes, we used a model based on the normalized difference vegetation index to precisely map the vegetation cover at several dates. A map of differences and spatial statistics indicated that vegetation cover, as a whole, decreased over the 15-year period. This study provides a reliable tool for long-term monitoring of the dynamics of plant cover in relation to climate change on the Iles Kerguelen.

DOI

[27]
Rouse Jr J W, Haas R H, Schell J Aet al., 1974. Monitoring vegetation systems in the Great Plains with ERTS.NASA Special Publication, 351: 309-317.Not Available

[28]
Schernewski G, Schönwald S, Kataržytė M, 2014. Application and evaluation of an indicator set to measure and promote sustainable development in coastal areas.Ocean & Coastal Management, 101: 2-13.61Application of a new indicator system for coastal sustainable development.61Assessment based on nine evaluator groups in two contrasting sites in the Baltic.61Evaluation of the comparative temporal and trans-regional applicability.61Discussion of the reproducibility and the role of the human factor in indicator applications.61Reflections on the practical value of results for coastal management and planning.

DOI

[29]
Sekhar N U, 2005.Integrated coastal zone management in Vietnam: Present potentials and future challenges.Ocean & Coastal Management, 48(9): 813-827.The development of industrial activities, tourism as well as urban expansion in Vietnam has generally been concentrated in the coastal zone. Urbanization is likely to increase in the coastal zone in the future due to unchecked population growth and human activities. The paper presents a socio-economic and institutional analysis of the impact of human activities on the coastal region in Vietnam. Although the government is putting emphasis on environmental issues, including integrated coastal zone management (ICZM), the approach is still sectoral leading to stakeholder conflicts. In addition, improper planning and poor implementation of policies also contribute to the vulnerable socio-economic and institutional context. The present efforts for the development of co-ordinated strategies towards an ICZM and the policy and institutional constraints in the integrated management framework are discussed. In order to combat the pressures and promote sustainable development of coastal zone, cross-sectoral management, strategic environmental assessment and local community participation is essential. The paper emphasizes on partnerships at the local level, particularly regarding the sharing of responsibility for environmental stewardship among the public and private sectors and the civil society.

DOI

[30]
Shalaby A, Tateishi R, 2007. Remote sensing and GIS for mapping and monitoring land cover and land-use changes in the Northwestern coastal zone of Egypt.Applied Geography, 27(1): 28-41.In this study, maximum likelihood supervised classification and post-classification change detection techniques were applied to Landsat images acquired in 1987 and 2001, respectively, to map land cover changes in the Northwestern coast of Egypt. A supervised classification was carried out on the six reflective bands for the two images individually with the aid of ground truth data. Ground truth information collected during six field trips conducted between 1998 and 2002 and land cover map of 1987 were used to assess the accuracy of the classification results. Using ancillary data, visual interpretation and expert knowledge of the area through GIS further refined the classification results. Post-classification change detection technique was used to produce change image through cross-tabulation. Changes among different land cover classes were assessed. During the study period, a very severe land cover change has taken place as a result of agricultural and tourist development projects. These changes in land cover led to vegetation degradation and water logging in part of the study area.

DOI

[31]
Slonecker E T, Jennings D B, Garofalo D, 2001. Remote sensing of impervious surfaces: A review.Remote Sensing Reviews, 20(3): 227-255.One of the emerging areas of scientific interest in the control of non‐point‐source pollution (NPS) is the detection and analysis of impervious surfaces within watersheds. NPS runoff from urban surfaces is now a leading threat to water quality and the percentage of impervious surface within a particular watershed has been recognized as a key indicator of the effects of non‐point runoff and of future water and ecosystem quality. Although the effect of land use, population and impervious surface cover on water quality has been generally known for thirty years, a basic problem exists in quantifying the detailed spatial extent and distribution of various classes of impervious surface phenomena. Remote sensing technology has been one of the primary methods for acquiring data on the impervious areas of watersheds for tax assessment, mapping and modeling applications and continues to be one of the most promising technologies for providing detailed mapping information as input into watershed‐level management decisions. This paper reviews the past use of remotely sensed data for impervious surface detection and analysis. It further explores the broader use of remote sensing technology in this area, including the potential for a new generation of instruments to improve the analysis of impervious surfaces.

DOI

[32]
Sun Xiaoyu, 2008. Analysis of exploitative intensity of coastal zone area: A case study on the coastal zone of eastern part of Guangdong [D]. Beijing: Institute of Geographic Sciences and Natural Resources Research Chinese Academy of Sciences (CAS).

[33]
Visbeck M, Kronfeld-Goharani U, Neumann Bet al., 2014. Securing blue wealth: The need for a special sustainable development goal for the ocean and coasts.Marine Policy, 48(12): 184-191.The ocean regulates the global climate, provides humans with natural resources such as food, materials, important substances, and energy, and is essential for international trade and recreational and cultural activities. Together with human development and economic growth, free access to, and availability of, ocean resources and services have exerted strong pressure on marine systems, ranging from overfishing, increasing resource extraction, and alteration of coastal zones to various types of thoughtless pollution. Both economic theory and many case studies suggest that there is no “tragedy of the commons” but a “tragedy of open access”. With high likeliness, structures of open access are non-sustainable. International cooperation and effective governance are required to protect the marine environment and promote the sustainable use of marine resources in such a way that due account can be taken of the environmental values of current generations and the needs of future generations. For this purpose, developing and agreeing on one Sustainable Development Goal (SDG) specifically for the Ocean and Coasts could prove to be an essential element. The new SDGs will build upon the Millennium Development Goals (MDGs) and replace them by 2015. Ensuring environmental sustainability in a general sense is one of the eight MDGs but the ocean is not explicitly addressed. Furthermore, the creation of a comprehensive underlying set of ocean sustainability targets and effective indicators developed within a global Future Ocean Spatial Planning (FOSP) process would help in assessing the current status of marine systems, diagnosing ongoing trends, and providing information for inclusive, forward-looking, and sustainable ocean governance.

DOI

[34]
Wang Peng, 2010. Study on environmental impact of coastal zone’s development activities and sustainable development ability of Liaoning Province [D]. Beijing: Ocean University of China.

[35]
Wijdeven B, 2002. Coastal erosion on a densely populated delta coast. Delft, the Netherlands: Delft University of Technology.

[36]
Willem T Bakker, 2013. Advanced Series on Ocean Engineering. New York: World Scientific.

[37]
Wu T, Hou X, Xu X, 2014. Spatio-temporal characteristics of the mainland coastline utilization degree over the last 70 years in China.Ocean & Coastal Management, 98: 150-157.61ICUD was built to valuate impacts of human activities on coastline.61Coastline utilization degree variations were detected at three scales.61Mainland coastline utilization degree rose significantly over the nearly 7002years.61There's notable spatio-temporal variability of human impacts on coastline.61Coastal development and utilization in the northern part surpassed the southern part after 1990s.

DOI

[38]
Xiao Jinben, 2012. Research on the strength of coastal zone development and utilization and its evaluation: Evidence from Wenzhou [D]. Beijing: China University of Geosciences.

[39]
Xu H Q, 2005. A study on information extraction of water body with the Modified Normalized Difference Water Index (MNDWI).Journal of Remote Sensing, 9(5): 589-595.A modified normalized difference water index(MNDWI) has been proposed in this paper based on the normalized difference water index(NDWI) of Mcfeeters (1966), which uses MIR(TM5) instead of NIR(TM4) to construct the MNDWI. The MNDWI has been tested in the ocean, lake and river areas with the background of built-up lands and/or vegetated lands, and with both clean and polluted water bodies using Landsat TM/ETM+ imagery. This reveals that the MNDWI can significantly enhance the water information, especially in the area mainly with built-up land as background. The MNDWI can depress the built-up land information effectively while highlighting water information, and accurately extract the water body information from the study areas. While the enhanced water information using the NDWI always has been mixed with built-up land noise and the area of a water body extracted based on the index is thus overestimated. Therefore, the NDWI is not suitable for enhancing and extracting water information in built-up land-dominated areas. Furthermore, the MNDWI can reveal subtle features of water more efficiently than the NDWI or other visible spectral bands do due largely to its wider dynamic data range. The application of the MNDWI in the Xiamen image has achieved an excellent result. The MNDWI image successfully reveals significant non-point pollution of the water surrounding the Xiamen Island due to agricultural activities. In addition, taking the advantage of the ratio computation, the MNDWI can remove shadow noise from water information without using sophisticated procedures, which is otherwise difficult to be removed.

[40]
Xu H Q, 2008. A new remote sensing index for fastly extracting impervious surface information.Geomatics and Information Science of Wuhan University, 33(11): 1150-1153.Based on the spectral characteristics of the impervious materials,a new index,normalized difference impervious surface index(NDISI),for enhancing and extracting ISA using a band combination method,is put forward.The applications of the index in landsat and ASTER images show that the new index can efficiently enhance ISA while suppress background noise.It can be used in a fast extraction of ISA in a large region.

DOI

[41]
Xu H Q, 2010. Analysis of impervious surface and its impact on urban heat environment using the normalized difference impervious surface Index (NDISI).Photogrammetric Engineering & Remote Sensing, 76(5): 557-565.The fast urban expansion has led to replacement of natural vegetation-dominated land surfaces by various impervious materials. This has a significant impact on the environment due to modification of heat energy balance. Timely understanding of spatiotemporal information of impervious surface has become more urgent as conventional methods for estimating impervious surface are very limited. In response to this need, this paper proposes a new index, normalized difference impervious surface index (NDISI), for estimating impervious surface. The application of the index to the Landsat ETM+ image of Fuzhou City and the ASTER image of Xiamen City in China has shown that the new index can efficiently enhance and extract impervious surfaces from satellite imagery, and the normalized NDISI can represent the real percentage of impervious surface. The index was further used as an indicator to investigate the impact of impervious surface on urban heat environment by examination of its quantitative relationship with land surface temperature (

DOI

[42]
Yang S, 2000. On extraction and fractal of urban and rural residential spatial pattern in developed area.Acta Geographica Sinica, 55(6): 671-678. (in Chinese)Changjiang River Delta is a developed and rich area in China, which has become one of the most crowded urban and rural residential areas. From the late 1970s, urbanization process in Changjiang River Delta has been quickened greatly, which resulted in number increasing and spatial expansion of urban and rural settlements. In the 1990s urbanization level in Changjiang River Delta has been about 50%, and many cities such as Suzhou, Wuxi and Changzhou have become large cities with a population of more than one million, many small cities have also become medium sized cities with a population of 100 thousand to 200 thousand. At the same time, the most typical economic development character in Changjiang River Delta is prosperous rural industrial enterprises. So spatial pattern of urban and rural residential areas has changed greatly, which was reflected mainly in spatial diffusion. Along with the above mentioned spatial changes, the problem of how can we realize sustainable development of urban and rural residential areas in scale, form, pattern and function in a certain spatial and temporal range should be paid attention to. In light with above mentioned problem, we need to analyze urban and rural residential spatial pattern and find inner basic law of spatial pattern change. But the basics to study spatial pattern change lie in how to extract information of urban and rural residential areas rapidly and exactly. The paper explores how to exact residential information from topographic map and remote sensing images at first, then it studies the spatial pattern and change characters of urban and rural residential areas in Changjiang River Delta according to fractal theory.

[43]
Yao D M, Chen Y, Zhang Fet al., 2008. Research of the land developing intensity evaluation of Hainan Province.Journal of Hebei Agricultural Sciences, 12(1): 86-90. (in Chinese)Based on the clarification of the connotation of'land developing intensity',Hainan Province as an example choosed 14 indexes to build an evaluation system of land developing intensity in 4 aspects,which were land utilization condition,land utilization degree,input intensity and utilization profit.With the help of comparison method under a reference frame,the Hainan Province and its 18 towns and cities were analyzed.The conclusion were the land developing intensity of Hainan Province level was a little higher than the nation average,but compared with north seaside area,there was still a great space for further development,and the land developing intensity between different areas of Hainan had a wide range of variation.

[44]
Ye G, Chou L M, Yang Let al., 2014. Evaluating the performance of integrated coastal management in Quanzhou, Fujian, China. Ocean & Coastal Management, 96: 112-122. (in Chinese)61We propose indicators and methodologies for the evaluation of ICM performance.61We validate the indicators and methodologies by a case study.61Proper indicators and measuring methods could be a useful tool kit to indicate the performance of ICM.

DOI

[45]
Zha Y, Gao J, Ni S, 2003. Use of normalized difference built-up index in automatically mapping urban areas from TM imagery.International Journal of Remote Sensing, 24(3): 583-594.Remotely sensed imagery is ideally used to monitor and detect land cover changes that occur frequently in urban and peri-urban areas as a consequence of incessant urbanization. It is a lengthy process to convert satellite imagery into land cover map using the existing methods of manual interpretation and parametric image classification digitally. In this paper we propose a new method based on Normalized Difference Built-up Index (NDBI) to automate the process of mapping built-up areas. It takes advantage of the unique spectral response of built-up areas and other land covers. Built-up areas are effectively mapped through arithmetic manipulation of re-coded Normalized Difference Vegetation Index (NDVI) and NDBI images derived from TM imagery. The devised NDBI method was applied to map urban land in the city of Nanjing, eastern China. The mapped results at an accuracy of 92.6% indicate that it can be used to fulfil the mapping objective reliably. Compared with the maximum likelihood classification method, the proposed NDBI is able to serve as a worthwhile alternative for quickly and objectively mapping built-up areas.

DOI

[46]
Zhang D, Zhou C, Su Fet al., 2012. A physical impulse-based approach to evaluate the exploitative intensity of bay: A case study of Daya Bay in China.Ocean & Coastal Management, 69: 151-159.The exploitative intensity evaluation of bays is meaningful for the ecological conservation, future utilization and integrated management of bays in China; especially for the regions where the economic development is depending on the coastal exploitation. Nevertheless, the complexity of morphology and structure of bays make the study a little bit difficult. A physical impulse-based approach to evaluate the exploitative intensity of bay was put forward in this paper. First of all, the differentiation in morphological, spatial location and structure of bays were analyzed, and the bay was separated into geographical elements of axes and areas accordingly; secondly, the exploitation and utilization process was abstracted and assumed using physical principles; Thirdly, physical Impulse-based Model of exploitative intensity evaluation was build according to the Law of Momentum which can convert the process variable to state variable. Daya Bay of Guangdong province in China was taken as a case study, four key time indicating the construction of large coastal engineering near Daya Bay coast were selected, namely year 1986, 1991, 2001 and 2004. The exploitative intensities of each spatial element of Daya Bay during 1986–1991, 1991–2001, and 2001–2004 were calculated and analyzed. The results show that the exploitative intensity of intertidal flat in Daya Bay during the study time spans is highest. The potential applications, current limitations, and future challenges of the approach were discussed.

DOI

[47]
Zhou B, Bao H, Peng B, 2000. Evaluation on exploitative intensity of land resources in the Yangtze River Delta Region.Scientia Geographica Sinica, 20(3): 213-228. (in Chinese)The exploitative intensity of land resources in Yangtze River Delta region has been discussed in this paper. Through interpretation in terms of theory and quantitative evaluation, the implication of land exploitative intensity is stated clearly, and relative measurement method is put forward. "High intensity exploitation of land resources" is defined scientifically. It shows that land exploitative intensity grade in Yangtze River delta is high intensity in country, and that its grade is low intensity in the world. The authors put forward the ways to deal with land high intensity exploitation in the Delta, such as the improvement of exploitative technology and human environment, the strengthening of exploitative intensity of low-grade units in the region, and the exploitation of water and land resources by sticking to principles of integration, high efficiency and lastingness. In the same time, the authors emphasize that utilization and protection are both important.

Outlines

/