Research Articles

Spatial pattern and influencing factors of landslide casualty events

  • WANG Ying , 1, 2 ,
  • LIN Qigen 1, 2 ,
  • SHI Peijun 1, 2
Expand
  • 1. Key Laboratory of Environmental Change and Natural Disaster of Ministry of Education, Beijing Normal University, Beijing 100875, China
  • 2. Academy of Disaster Reduction and Emergency Management, Beijing Normal University, Beijing 100875, China

Author: Wang Ying, Professor, specialized in disaster risk assessment and post-disaster recovery research. E-mail:

Received date: 2017-06-14

  Accepted date: 2017-07-20

  Online published: 2018-03-10

Supported by

National Key Research and Development Program Project, No.2017YFC1502505, No.2016YFA0602403

National Natural Science Foundation of China, No.41271544

Copyright

Journal of Geographical Sciences, All Rights Reserved

Abstract

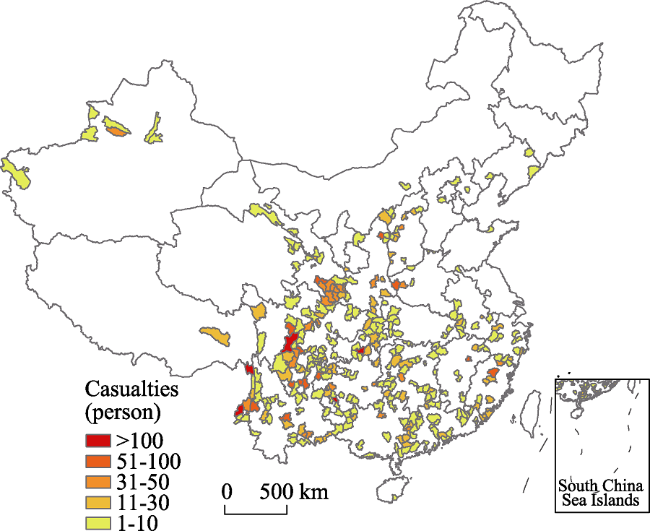
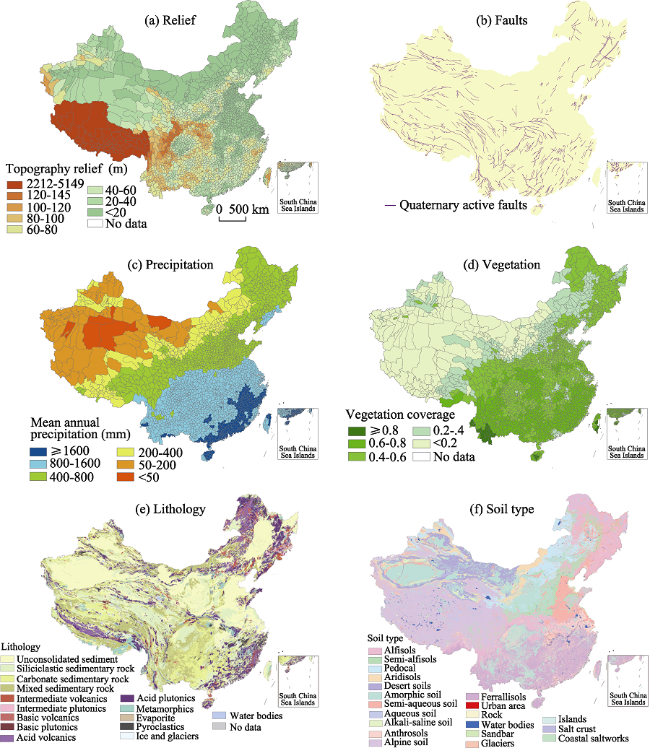
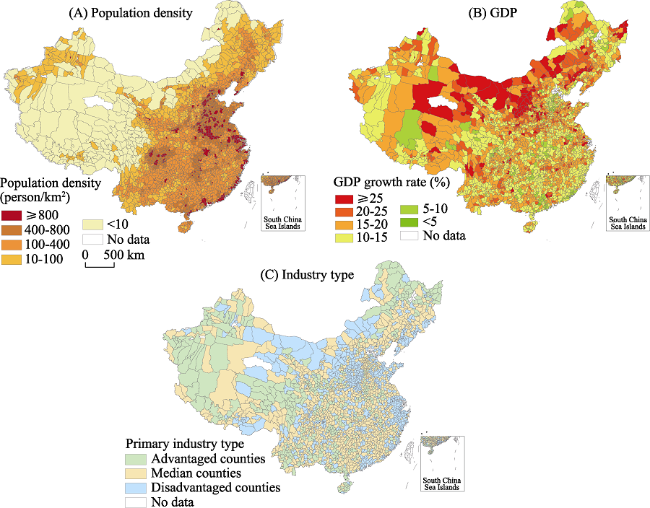
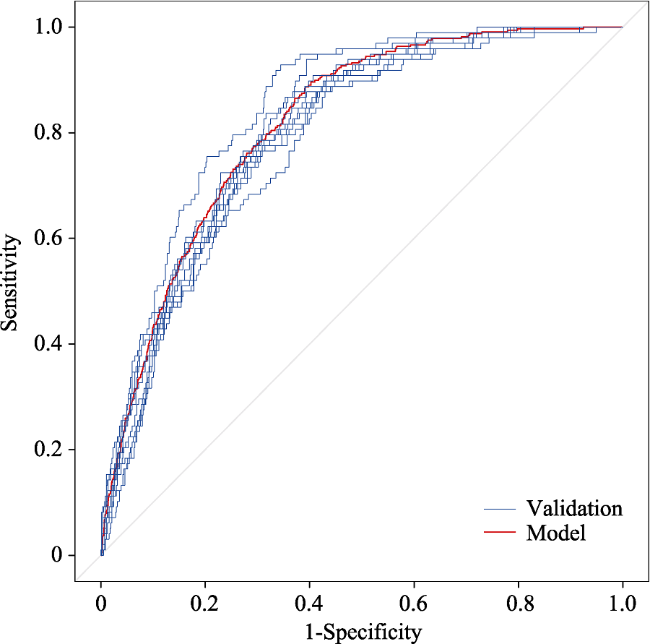
Analysis of casualties due to landslides from 2000 to 2012 revealed that their spatial pattern was affected by terrain and other natural environmental factors, which resulted in a higher distribution of landslide casualty events in southern China than in northern China. Hotspots of landslide-generated casualties were in the western Sichuan mountainous area and Yunnan-Guizhou Plateau region, southeast hilly area, northern part of the loess hilly area, and Tianshan and Qilian Mountains. However, local distribution patterns indicated that landslide casualty events were also influenced by economic activity factors. To quantitatively analyse the influence of natural environment and human-economic activity factors, the Probability Model for Landslide Casualty Events in China (LCEC) was built based on logistic regression analysis. The results showed that relative relief, GDP growth rate, mean annual precipitation, fault zones, and population density were positively correlated with casualties caused by landslides. Notably, GDP growth rate ranked only second to relative relief as the primary factors in the probability of casualties due to landslides. The occurrence probability of a landslide casualty event increased 2.706 times with a GDP growth rate increase of 2.72%. In contrast, vegetation coverage was negatively correlated with casualties caused by landslides. The LCEC model was then applied to calculate the occurrence probability of landslide casualty events for each county in China. The results showed that there are 27 counties with high occurrence probability but zero casualty events. The 27 counties were divided into three categories: poverty-stricken counties, mineral-rich counties, and real-estate overexploited counties; these are key areas that should be emphasized in reducing landslide risk.

Cite this article

WANG Ying , LIN Qigen , SHI Peijun . Spatial pattern and influencing factors of landslide casualty events[J]. Journal of Geographical Sciences, 2018 , 28(3) : 259 -374 . DOI: 10.1007/s11442-018-1471-3

1 Introduction

Landslides are likely to cause loss of lives in China. During the period from 2000 to 2012, China had frequent landslides, 338,964 identifiable individual landslides resulting in 45,381 casualties, approximately 3500 casualties per year (Sheng et al., 2013). In terms of natural disasters, casualties caused by the landslides are only less than those caused by earthquakes and floods. There are various types of landslides in China. According to the Geological Disaster Prevention Regulations promulgated by the State Council (2004), landslides refer to geological hazards, including landslides, rock falls, debris flows, ground fissures, ground subsidence, and ground collapse, which are harmful to people’s lives, property, and geological environment. The term “landslides” in this paper encompasses landslide, rock fall, and debris flow, which are the three major land mass wasting movements that cause casualties in China.
The Rockfall and Landslide Disaster Map of China (CIGEM, 2007a) and Debris Flow Disaster Map of China (CIGEM, 2007b) were compiled by the China Institute for Geo-Environment Monitoring based on the environmental geological investigations. They showed that most landslides have occurred in the hilly and mountainous areas of northeast, north and southeast China, Longmen mountain area of northwest, Sichuan, Qinling-Daba mountainous area, area along the coast of the Three Gorges Reservoir, southwest Guizhou mountainous area, Loess Plateau, northwest mountain, basin and plateau area, and Qinghai-Tibet Plateau. Since the 20th century, large-scale landslides in China have been disproportionally distributed by region: 70% on the first slope-descending zone of the continental landform along the eastern margin of the Qinghai-Tibet Plateau; 16% in central Hunan province and middle mountainous area of Guangxi province; and 12% in the mountainous areas of Zhejiang and Fujian provinces (Huang, 2007). However, these maps mainly contain contents on the magnitudes of the landslides, and lack losses caused by the landslides. Such losses, especially casualties, are more important than landslide frequency for disaster risk prevention.
Landslide occurrence is affected by natural environment factors, such as topography, lithology, geology, faults, soil types, land cover, and rainfall (Atkinson and Massari, 1998; Ohlmacher and Davis, 2003; Guzzetti et al., 2007; García-Rodríguez et al., 2008; Eeckhaut et al., 2011; Ramani et al., 2011; Althuwaynee et al., 2016; Tsangaratos and Ilia, 2016; Samia et al., 2017). Moreover, there is a clear close relationship between landslide occurrence and the impact of human activities on the natural environment. The primary reason for large-scale catastrophic landslides in China since the 1980s was the increase in anthropogenic activities. Statistical analyses have shown that 50% of large-scale landslides that occurred on the Chinese Mainland are directly or indirectly related to human activities (Huang, 2007). Many anthropogenic activities, such as road construction (Brenning et al., 2015) and land-use change (Cerovski-Darriau and Roering, 2016; Tarolli and Sofia, 2016; Bartelletti et al., 2017), influence the occurrence of landslides (Gill and Malamud, 2017).
Brenning et al. (2015) investigated landslide initiation frequency along highways in the tropical Andes of southern Ecuador. They found that landslide susceptibility was more than an order of magnitude higher in close proximity to paved interurban highways. Ayalew and Yamagishi (2005) assessed landslide susceptibility around Kakuda-Yahiko Mountain in central Japan using logistic regression analysis and considering factors, such as lithology, bed rock-slope relationship, slope gradient, aspect, elevation, and road network. Their findings showed that the road network was the chief determinant of landslide occurrence and distribution. Jadda et al. (2011) using a frequency ratio model and GIS technology, combined with geology, geomorphology, soil, topography, land use, distance from roads, drainages, and faults to map landslide susceptibility at Alborz Mountain in Iran. They found that roads were the second most important factor after geology, and that landslide susceptibility increased as the distance from roads decreased. Taking various factors into account, such as slope gradient, lithology, land use, soil humidity, Eeckhaut et al. (2011) analysed landslide susceptibility in Europe based on six land-use types: cropland, forest, grassland, bare land, urban area, and regularly flooded land. In general, forests are more prone to landslides than cropland, and cropland has a higher hazard than urban areas. Bartelletti et al. (2017) analysed the influence of land use on landslide occurrence from a geological-morphological perspective. Their results indicated that terraced agricultural areas are more prone to landslides than woodland. Such studies have primarily focused on the impact of roads and land use types on landslide occurrence. Human activities, such as mining and real estate development, may also trigger landslides. However, there have been few studies that have analysed the general relationship between human activity and landslide occurrence. This paper is intended to bridge this gap, exploring the influence of human activities on landslides that have caused casualties in China.
Based on data for landslide-generated casualty events in China from 2000 to 2012, this study evaluates the spatial pattern of the casualty events on a national scale. It should be noted that a casualty event in this paper refers to a single landslide causing one casualty or multiple casualties. Then a logistic regression model is applied to quantitatively evaluate the relative contribution of natural environment and human activity factors to landslide casualty events. This type of analysis is very important for understanding the relationships between landslides and casualties in China, identify hotspots, and establish corresponding disaster prevention and mitigation measures.

2 Material and methods

2.1 Study area and data

China lies between 18°-54°N and 73°-135°E, covering 9.6 million km2. The geological and geographic environment is complex and results in spatial and temporal differences in climate. The terrain of China is low in elevation in the east but high in the west, and mountainous areas account for nearly two-thirds of the land area. Correspondingly, nearly half of the towns are in the mountainous areas, with a population of accounting for 50% of the country’s total. Landslides occur frequently in the mountainous areas resulting in serious loss of lives every year in China (Li et al., 2004; Cees van Westen et al., 2010; Li et al., 2013).
Statistics and reports on landslide disasters in China have gradually been standardized and perfected since 2011. Real-time reports of landslide events are published by the Ministry of Land and Resources of China in the form of Reports on Geological Disaster Situation. Annual losses from landslide disasters are published in the form of the China Geological Hazard Bulletin by the China Institute for Geo-Environment Monitoring. However, data reporting landslide events prior to 2011 was not uniform. Landslide events that caused casualties were documented from 2000 to 2012 by the National Disaster Reduction Center of China (NDRCC, 2013), Ministry of Land and Resources of China (MLRC, 2013), China Institute for Geo-Environment Monitoring (CIGEM, 2013), and news websites. The Landslides Casualty Inventory of China was established, characterizing the type, time, location, casualties, and damage caused by each landslide disaster, incorporating 576 landslide disaster events in total. Events duplicated from multiple sources were removed after considering the time and location of the disaster. Table 1 presents the data sources for the Landslides Casualty Inventory of China. There are some cases of flash flood and debris flow concurrence, such as disastrous flash floods and debris flows in Zhouqu in 2010 and Shannan Town, Ning’an City, Heilongjiang Province in June 2005. Such concurrent disasters often cause enormous casualties and property losses, but their formation mechanism is quite different from a single debris flow event, therefore in this study, landslide inventory does not include this type of disasters.
Table 1 Data sources for the Landslides Casualty Inventory of China
Source Data compiler Cases Channel
China Geological Hazard Bulletin China Institute for Geo-Environment Monitoring 81 CIGEM
Reports on Geological Disaster Situation Ministry of Land and Resources
of China
95 MLRC
Yesterday Disaster Report NDRCC 228 NDRCC
Web news search News websites 172 Network collection and
arrangement
Based on identifications of counties where landslide disasters occurred, a distribution map of landslide casualty events in China for the period 2000-2012 was generated. As shown in Figure 1, landslide casualty events occurred in a total of 334 counties. These counties are mainly distributed in the Sichuan Basin and Yunnan-Guizhou Plateau (39%) and southeast hilly area (34%) in southern China. About 12% of the counties are distributed in the loess hilly area and about 10% in Tianshan and Qilian mountains. There are a few counties distributed in the North and Northeast China Plains and Tibetan Plateau.
Figure 1 Distribution of counties in China with landslide casualties (2000-2012)
Based on analysing the characteristics of China’s natural environment, six factors including topography, faults, precipitation, lithology, vegetation, and soil types were selected as natural environment influencing factors. These factors are illustrated in Figure 2: relative topographic relief (Figure 2a), Quaternary active faults (Figure 2b), mean annual precipitation (Figure 2c), vegetation coverage (Figure 2d), lithology (Figure 2e), and soil type (Figure 2f). These maps for each county were generated using the ArcGIS spatial analysis modules. The datasets were obtained from the Computer Network Information Center of CAS (2015), Institute of Geographic Sciences and Natural Resources Research of CAS (2015), and Hartmann and Moosdorf (2012). Comparing Figures 1 and 2, it is clear that these natural environmental factors have a spatial correlation with landslide casualty events in China. The counties with high relative relief, fault zones, more precipitation, and high vegetation coverage are more prone to landslide events that have caused casualties.
Figure 2 Distribution of natural environment factors in landslide casualty events across China
There are some counties with these described natural environmental characteristics but no casualty events have occurred. For instance, some counties in Yunnan and Fujian provinces have similar environmental characteristics with their surrounding casualty counties and yet no landslide casualties have occurred since 2000. The difference appears to be driven by human activity factors, such as population density (Figure 3a) and human-economic activity intensity, which have provided the physical characteristics leading to casualties.
Figure 3 Distribution of human-economic activity factors in landslide casualty events across China
Economy is a most comprehensive indicator reflecting human activity intensity. Since 2000, China’s economy has maintained rapid growth. From 2000 to 2012, China’s GDP had an average annual growth rate of 10.14% (in comparable price); however this rapid economic growth has been achieved through over-exploiting resources at the expense of the natural environment. The World Bank’s empirical data show that a society’s golden development period is also a period of high incidence of conflicts and high-risk emergence (Zhang and Tong, 2009). Therefore, GDP growth rate (Figure 3b) and industry type (Figure 3c) were selected to mirror the intensity of human activity. In this study, GDP growth rate in each county was calculated as the average annual GDP growth rate from 2000 to 2012 at current prices. Industry type was calculated as the proportion of the primary industry in GDP in 2010. The natural break classification method used in Hu et al. (2011) and Luo et al. (2016) was applied to divide the counties into three categories: the primary industry advantaged counties, median counties, and disadvantaged counties.
Comparing Figures 3 and 1, there is not a clear spatial correlation between landslide casualty events and human activity. In the population density map, counties with high population density are mainly concentrated in eastern China, while those with low population density are mainly in western China. In comparison, counties with high GDP growth rate are scattered across various provinces, and industrial types also showed a mixed county distribution. Therefore, to accurately evaluate the correlation between potential factors and landslide casualties, a logistic regression model was used to analyse the data.

2.2 Modelling

2.2.1 Logistic regression model
Logistic regression analysis is a type of probabilistic nonlinear regression model. The advantage of logistic regression for statistical analyses is that independent variables can be either continuous or discrete (with dummy variables). In recent years, logistic regression models have been widely applied to landslide hazard and susceptibility assessments of factors influencing the occurrence of geological disasters (Chau and Chan, 2005; Lee and Pradhan, 2006; García-Rodríguez et al., 2008; Falaschi et al., 2009; Bui et al., 2011; Eeckhaut et al., 2011; Shirzadi et al., 2012; Devkota et al., 2013; Pourghasemi et al., 2013; Xu et al., 2013; Nourani et al., 2014). The binary logistic regression equation is often used to study the relationship between classified observation results and their influencing factors, which is provided as follows:
$P=\frac{\exp ({{\beta }_{0}}+{{\beta }_{1}}{{x}_{1}}+\cdots +{{\beta }_{P}}{{x}_{n}})}{1+\exp ({{\beta }_{0}}+{{\beta }_{1}}{{x}_{1}}+\cdots {{\beta }_{P}}{{x}_{n}})}$ (1)
where P is the dependent variable in the interval [0, 1] that reflects the occurrence probability of a casualty event caused by landslides, xi is an independent variable related to influencing factors (i = 1, 2, …, k); β0 is a constant; and βi is the regression coefficient for the influencing factors xi, reflecting the influence of independent variable xi on P.
In the logistic regression model, independent variables can be continuous or categorical. Continuous variables can be added directly to Equation (1). After regression analysis, we obtained the partial regression coefficient βi, which refers to the degree of influence on P in the case of continuous change in the independent variable. Categorical variables were first classified by values, assigned to corresponding numerical values, and then added to Equation (1). The coefficient βi enabled us to evaluate the strength of the relationship between a variable and landslides occurrence, compared with a reference category. Stronger relationships identified the categorical variables having an impact on the dependent variables.
The dependent variable in this study was the presence (1) or absence (0) of a casualty event caused by landslides in a single county. Of the 2215 Chinese counties, those that appeared in the Landslides Casualty Inventory of China were classified to 1, otherwise they were classified as 0. P was set to 1 for counties with casualty event, and P was 0 for counties with no casualty event. Due to the lack of data in the municipal districts of Beijing, Tianjin, and Shanghai, and the special terrain of Tibet, seven counties with casualty events in these areas were not included. The 327 counties with landslide casualty events were applied to establishing the model. Bringing human-economic activity and natural environment data from these counties into Equation (1) resulted in quantitative relationships between influencing factors and landslide casualty events in China according to coefficient βi.
In total, 327 “1” counties and 1888 “0” counties were identified. Using information from all “0” counties in the logistic regression model analysis would have resulted in a bias towards “0” counties. Currently, no conclusions have been drawn about the number of 1 and 0 samples that should be used in the logistic regression. According to King and Zeng (2001), too few 1 samples “grossly undervalued” the probability of prediction, and they suggested keeping the rate of 0 samples to 1 samples between 0.2 and 1. Therefore, to better predict “1” casualty counties, and considering the information of “0” casualty counties, weighting of the data was performed using all the “0” non-casualty counties as samples and four times the number of “1” casualty counties as samples in the logistic model analysis. Therefore, the number of “1” casualty county samples was 327 × 4 (i.e., 1308) and the number of “0” non-casualty county samples was 1888. The ratio of 1 to 0 is 0.69. This is called the oversampling method, which is currently widely used in machine learning to achieve uniformity of training sample data (Yen et al., 2006).
For the independent variables, topographic relief, mean annual precipitation, vegetation coverage, GDP growth rate, and population density were continuous variables. As there is a big difference in the numerical values of these factors, the first step in the analysis was to conduct natural logarithm standardization processing. The processed data were then used as input in the logistic regression modelling.
Faults, lithology, soil type, and industry type were categorical variables in this study. Fault variables were assigned values based on the occurrence of a Quaternary active fault in the county; mapped occurrence was assigned a value of 1, otherwise they were 0. Lithology variables were classified into 15 categories, including unconsolidated sediment, siliciclastic sedimentary rock, pyroclastics, mixed sedimentary rock, carbonate sedimentary rock, evaporite, acid volcanic, intermediate volcanics, basic volcanics, acid plutonics, intermediate plutonics, basic plutonics, metamorphics, water bodies, ice, and glaciers based on the classification of the world lithology map (Hartmann et al., 2012). Lithology variables were converted into 14 binary dummy variables with unconsolidated sediment as the reference category. Lithology was assigned based on the largest coverage. For instance, for carbonate sedimentary rock accounting for the largest area in one county compared to other lithology types, the county was assigned a value of 1 in the carbonate sedimentary rock variable and 0 in other lithology variables. Soil type variables were classified to 12 categories, including alfisols, semi-alfisols, pedocal, aridisols, desert soils, amorphic soil, semi-aqueous soil, aqueous soil, alkali-saline soil, anthrosols, alpine soil, and ferrallisols, based on the "Soil Classification" system (GB). The soil type variables were converted into 11 binary dummy variables with alfisols as the reference category. For industry type, the natural break method was applied to divide the industry type variables into three categories based on the proportion of the primary industry in GDP in 2010. Primary industry accounting for the proportion of GDP ≥ 31.21% resulted in categorization as a primary industry advantaged county. The proportion of primary industry to GDP of 14.70%-31.21% resulted in categorization as a primary industry median county. The remaining counties were categorized as primary industry disadvantaged. The industry type variables are converted into two binary dummy variables with primary industry advantaged county as the reference category.
2.2.2 Evaluation methods
The performances of the model were firstly evaluated based on the confusion matrix and receiver operating characteristic (ROC) curve. The confusion matrix can be used to determine the percentages of correctly classified observations and number of false positive (FP), false negative (FN), true positive (TP), and true negative (TN) observations. A high percentage of correctly classified observations and low number of false positive and false negative observations indicate a better model fitting. The ROC curve measures the goodness of fit of the model prediction by plotting the true positive rates and false positive rates at different susceptibility threshold values. The area under the ROC curve (AUC) ranges from 0.5 to 1, with higher values indicating a better predictive capability of the model. AUC values less than 0.7 indicate poor predictive ability, values between 0.7 and 0.8 indicate moderate ability, values between 0.8 and 0.9 indicate good ability, and values > 0.9 indicate excellent predictive ability (Swets, 1988).
To further evaluate the robustness of the model, a simple random sampling was conducted ten times to divide the counties into 70% training, i.e., 229 casualty counties, 1322 non-casualty counties, and 30% validation groups (Chung and Fabbri, 2003; Poiraud, 2014). Then, a 70% training group was used to create ten models and the remaining 30% was used to validate the ten models. Category variables, lithology, soil type and industry type, were not included in the process of random sampling cross validation due to the excessive number of classes in the category variables.

3 Results

Table 2 shows that nine variables, including topographic relief, mean annual precipitation, vegetation coverage, GDP growth rate, population density, faults, lithology, soil type, and industry type were selected using the likelihood ratio variable selection method based on the p-value < 0.05, which is indicated with the Sig. column in Table 2. The results indicated that these variables make a difference to casualty event caused by landslides.
Table 2 Variables applied in the logistic regression model
Variables β S.E. Sig. Exp(β)
ln (Topography relief) 1.922 0.117 0.000 6.834
ln(GDP growth rate) 0.996 0.209 0.000 2.706
ln(Mean annual precipitation) 0.535 0.178 0.003 1.707
ln(Vegetation coverage) -0.333 0.159 0.037 0.717
Faults 0.374 0.093 0.000 1.453
ln(Population density) 0.317 0.063 0.000 1.373
Lithology a 0.000
siliciclastic sedimentary rock -0.649 0.171 0.000 0.523
pyroclastics -0.448 0.330 0.174 0.639
mixed sedimentary rock -0.173 0.168 0.302 0.841
carbonate sedimentary rock -0.572 0.178 0.001 0.564
acid volcanic -1.574 0.408 0.000 0.207
intermediate volcanics -0.866 0.475 0.069 0.421
basic volcanics -19.936 9093 0.998 0.000
acid plutonics -0.204 0.184 0.268 0.815
intermediate plutonics -20.172 12480 0.999 0.000
basic plutonics -19.612 40190 1 0.000
metamorphics 0.238 0.309 0.442 1.268
water bodies -17.337 27290 0.999 0.000
Soil type a 0.000
semi-alfisols -0.396 0.241 0.1 0.673
pedocal 0.567 0.31 0.068 1.762
aridisols 1.183 0.477 0.013 3.263
desert soils 2.083 0.532 0.000 8.026
amorphic soil 0.447 0.169 0.008 1.564
semi-aqueous soil 0.857 0.468 0.067 2.357
alkali-saline soil -17.918 12030 0.999 0
anthrosols 0.893 0.284 0.002 2.443
alpine soil 0.467 0.3 0.119 1.595
ferrallisols 0.524 0.157 0.001 1.69
Industry type a 0.000
primary industry median county 0.536 0.126 0.000 1.71
primary industry disadvantaged county 0.352 0.145 0.015 1.422
Constant -11.913 1.344 0.000 0.000

a. The reference categories of lithology, soil type and industry type are unconsolidated sediment, alfisols and primary industry advantaged county respectively

The degree of influence of each variable depends on the size of Exp (β). Exp (β) is an odds ratio (OR for short), indicating the ratio of casualty event occurrence probability due to every variable change. Exp (β) > 1 indicates a positive influence; Exp (β) < 1 shows a negative influence. Greater differences between Exp (β) and 1, indicate a greater degree of influence of the variable. Exp (β) of the influencing variables in Table 2 indicate that topographic relief, mean annual precipitation, GDP growth rate, population density, and faults had a positive effect on the occurrence of landslide casualty events. While vegetation coverage had a negative influence on the occurrence of landslide casualty events. The negative effect of vegetation coverage indicates that although counties with high numbers of landslide casualty events were mainly distributed in the southern region with high vegetation coverage on the national scale, an increase in vegetation coverage can reduce occurrences of landslide casualty events when the other natural environment factors are similar. Regarding soil type, aridisols, desert soils, amorphic soils, and anthrosols increased the possibility of the landslide casualty events in comparison with alfisols. Regarding lithology, carbonate sedimentary rock and acid volcanics decreased the possibility landslide casualty events compared with unconsolidated sediment. Regarding industry type, primary industry median county and primary industry disadvantaged county increased the possibility landslide casualty events compared with the reference, primary industry advantaged county.
Substituting the parameters in Table 2 into Equation (1) resulted in Equations (2) and (3), as follows:
$\begin{align} & Z=-11.913+1.922{{X}_{1}}+0.996{{X}_{2}}+0.535{{X}_{3}}-0.333{{X}_{4}}+0.374{{X}_{5}}+0.317{{X}_{6}}- \\ & 0.649{{X}_{71}}-0.448{{X}_{72}}-0.173{{X}_{73}}-0.572{{X}_{74}}-1.574{{X}_{75}}-0.866{{X}_{76}}-19.936{{X}_{77}}- \\ & 0.204{{X}_{78}}-20.172{{X}_{79}}-19.612{{X}_{710}}+0.238{{X}_{711}}-17.337{{X}_{712}}-0.396{{X}_{81}}+ \\ & 0.567{{X}_{82}}+1.183{{X}_{83}}+2.083{{X}_{84}}+0.447{{X}_{85}}+0.857{{X}_{86}}-17.918{{X}_{87}}+0.893{{X}_{88}}+ \\ & 0.467{{X}_{89}}+0.524{{X}_{810}}+0.536{{X}_{91}}+0.352{{X}_{92}} \end{align}$ (2)
$P=\frac{\exp (Z)}{1+\exp (Z)}$ (3)
where P is the occurrence probability of casualty event caused by landslides; X1 is ln(topographic relief); X2 is ln(GDP growth rate); X3 is ln(mean annual precipitation); X4 is ln(vegetation coverage); X5 is fault; X6 is ln(population density); X71 is siliciclastic sedimentary rock; X72 is pyroclastics; X73 is mixed sedimentary rock; X74 is carbonate sedimentary rock; X75 is acid volcanic; X76 is intermediate volcanics; X77 is basic volcanics; X78 is acid plutonics; X79 is intermediate plutonics; X710 is basic plutonics; X711 is metamorphics; X712 is water bodies; X81 is semi-alfisols; X82 is pedocal; X83 is aridisols; X84 is desert soils; X85 is amorphic soil; X86 is semi-aqueous soil; X87 is alkali-saline soil; X88 is anthrosols; X89 is alpine soil; X810 is ferrallisols; X91 is primary industry median county; and X92 is primary industry disadvantaged county. Equations (2) and (3) form the Probability Model for Landslide Casualty Events in China (LCEC model).
Table 3 shows the correct percentages in confusion matrix for the LCEC model. The accuracy in predicting the occurrence of casualty event was 74.9%, and the accuracy in predicting no occurrence of casualty event was 75.0%, giving a total accuracy of 75.0%. Figure 4 shows the ROC curve for the LCEC model. The area under the ROC curve (AUC) is 0.826 with a standard error of 0.007. Therefore, the LCEC model was of relatively high predictive value.
Table 3 Confusion matrix for the LCEC model
Observed Predicted
Casualty Percentage
correct (%)
0 1
0 1416 472 75.0
1 328 980 74.9
Overall percentage 75.0
The AUC values from ten training models ranged from 0.811 to 0.831. The validation results of these ten models ranged from 0.781 to 0.821 (Figure 4). These results indicate that the LCEC model performed accurately.
Figure 4 ROC curve for LCEC model and validation of models produced from 10 samples of 70% training data
To summarize, topographic relief, mean annual precipitation, vegetation coverage, GDP growth rate, population density, faults, lithology, soil type, and industry type all contributed to the occurrence of landslide casualty events in China. In Table 2, the odds ratio (OR) of GDP growth rate is 2.706. This indicates that for every 2.72% increase in the GDP growth rate, the occurrence probability of a landslide casualty event increased by 2.706 times. Thus, as shown, rapid growth in GDP has an important impact on casualties caused by landslides. This has been confirmed on a county-by-county basis, where rapid growth of GDP has occurred at the cost of environmental damage, which in turn has resulted in numerous casualty events.

4 Discussion

After placing the values of independent variables from the 2215 counties in China into Equations (2) and (3), the occurrence probability of landslide casualty events was determined for each county (Figure 5). At present, no conclusions exist to classify landslide susceptibility and hazard maps in the literature. In this study, we divide the occurrence probability into five categories: very low, low, medium, high, and very high based on the classification method in Hu et al. (2011) and Luo et al. (2016). Figure 5 shows that the very high and high occurrence probability areas are similar to Figure 1, mainly distributed in the Sichuan Basin and Yunnan-Guizhou Plateau, southeast hilly area in southern China, loess hilly area, and Tianshan and Qilian mountains.
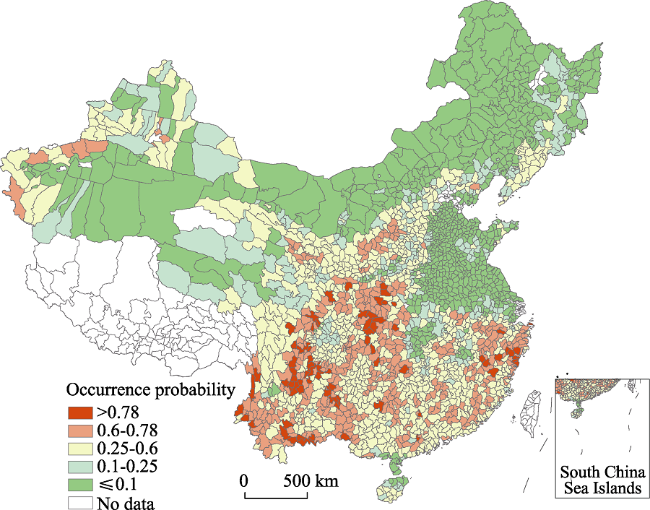
Figure 5 Distribution of landslide casualty event probabilities across China
However, there were 80 counties with occurrence probability > 0.78. Among them, 42 counties have suffered casualty events. County GDP growth exceeded average provincial GDP growth in 27 out of the remaining 38 counties where no casualty events occurred from 2000 to 2012. Based on probability analysis, these 27 counties are locations where it is necessary for China to spare efforts in their landslides risk prevention in the future. The natural environmental conditions of these counties, such as topographic relief, mean annual precipitation, and vegetation coverage, are prone to landslides. Moreover, these counties have witnessed a fast-growing economy for nearly a decade. According to the distinctive characteristics of economic development in each county, they were divided into three categories: poverty-stricken, mineral-rich, and real-estate overexploited counties (Table 4).
Table 4 Counties, stressing geological disaster risk prevention
Category County
Poverty-stricken counties Jinyang County, Yongshan County, Qianjiang District, Luding County, Mao County, Mianning County, Zhenkang County, Shizhu County, Xichang City, Huili County, Ludian County, Mojiang County, Pingbian County, Hekou County, Yuanyang County
Mineral-rich counties Feng County, Jingxi County, Miyi County, Emeishan city, Hongya County, Hongya County, Huidong County, Shui Fu County, Shangluo municipal district
Real-estate overexploited counties Lishui municipal district, Zhoushan municipal district, Qingtian County, Wuyishan City
Poverty-stricken counties have been the focus of state poverty relief work. Despite the support of state aid-the-poor programmes, and the relatively rapid development of the region’s economy in recent years, they are still quite economically disadvantaged and disaster-prevention work has been minimal. Therefore, measures must be taken to intensify landslide disaster prevention work, which in the process may facilitate a decrease in poverty.
Mineral-rich counties have greatly contributed to the high-speed growth of GDP because of their mineral wealth. For example, Fengxian County in Shaanxi Province is one of the four major lead-zinc ore bases in the country, with 3.5 million tons of ore reserves accounting for 80% of the whole province. For nearly a decade, Fengxian has prioritized its mineral development to such an extent that its average GDP growth is twice that of the province. However, mineral development has caused serious damage to the region’s vegetation and ecology, which increases the probability of future landslide casualty events. For this reason, development of mineral resources should be combined with appropriate measures to protect the ecological environment and conduct landslide disaster prevention work.
Real-estate overexploited counties are municipal districts primarily in eastern China. In view of their relatively high economic significance, decreasing dependence on raw materials of industrial development, extensive processing development, and involvement of an increasingly large proportion of tertiary industries, these counties have sufficient economic strength to undertake precautions against natural disasters. However, vigorous development of the real estate industry and tourism has expanded development to the mountainous region. For instance, Zhejiang is a province with a vast mountainous area that occupies 70.4% of the land area. Lishui city in southwestern Zhejiang Province has about 88.42% of the city’s total mountainous area. In recent years, real estate development has been rapid. The area under construction has risen from 5.4055×10⁶ m2 in 2003 to 19.1346×10⁶ m2 in 2012. Therefore, many newly constructed buildings have been erected in mountainous regions, and more residents will live in landslide disaster prone places. Therefore, landslide disaster prevention work should be strengthened in these eastern counties, in spite of their rapid economic development.

5 Conclusion and perspective

Based on county-level casualty data in the Landslides Casualty Inventory of China and a logistic regression model, this study analysed the spatial pattern of landslide casualty events and quantitatively evaluated the effect of natural environment and human activity factors on landslide casualty events. The spatial distribution of casualty events was higher in south China than in north China. Hotspots of landslide casualty events included the western Sichuan mountainous area and Yunnan-Guizhou Plateau region, southeast hilly area, northern part of the loess hilly area, and Tianshan and Qilian mountains.
The LCEC model was established and results showed that both the natural environment and human activity were factors affecting the probability of landslide casualty events; sub-factors included topographic relief, mean annual precipitation, vegetation coverage, GDP growth rate, population density, faults, lithology, soil type, and industry type. In descending degree, topographic relief, GDP growth rate, mean annual precipitation, vegetation coverage, fault zones, and population density were most important in contributing to landslide casualty events. For every 2.72% increase in the GDP growth rate, the occurrence probability of casualty event caused by landslides increased 2.706 times. This result quantitatively proved that the fast-growing economy damaged the natural environment and triggered more landslide disasters.
An analysis of the LCEC model shows that about 71% of the counties with high occurrence probability but no casualty events have been rapidly developing economically and the GDP growth of these counties has been far greater than their host provinces. They can be divided into three categories: poverty-stricken, mineral-rich, and real-estate overexploited counties, which relate their natural and economic factors. These countries are key areas where great importance must be placed on landslide disaster risk prevention.
In Table 2, the hypothesis of a constant significance level <0.05, i.e., constant = 0, is false, which indicates that in addition to the factors considered in this study, there are likely other factors that contribute to the occurrence of landslide casualty events. Therefore, additional and more detailed data are required to use as indicators of natural environment and human activity factors. Such data will further improve the accuracy of the LCEC model. The study did consider the GDP, per capita GDP, and per area GDP as human activity factors, but the results showed that these factors had no significant effect on landslide casualty events. The lack of correlation may have been due to the long time period that the size of a regional GDP develops, which makes it less sensitive to local developments that impact county-scale GDP. Therefore, these factors cannot effectively reflect the intensity of local human activities.
Due to lack of detailed information on risk elements in the Landslides Casualty Inventory of China, this study only adopted a binary logistic regression model to analyse the occurrence of landslide casualty events. With improvements to the database, methods, such as Geodetector (Wang and Li, 2010), can also be applied to detect the spatial association between influencing factors and landslide casualty events.

The authors have declared that no competing interests exist.

[1]
Althuwaynee O F, Pradhan B, Lee S, 2016. A novel integrated model for assessing landslide susceptibility mapping using CHAID and AHP pair-wise comparison.International Journal of Remote Sensing, 37(5): 1190-1209.This article uses an integrated methodology based on a chi-squared automatic interaction detection (CHAID) model combined with analytic hierarchy process (AHP) for pair-wise comparison to assess medium-scale landslide susceptibility in a catchment in the Inje region of South Korea. An inventory of 3596 landslide locations was collected using remote sensing, and a random sample comprising 30% of these was used to validate the model. The remaining portion (70%) was processed by the nearest-neighbour index (NNI) technique and used for extracting the cluster patterns at each location. These data were used for model training purposes. Ten landslide-conditioning factors (independent variables) representing four main domains, namely (1) topology, (2) geology, (3) hydrology, and (4) land cover, were used to produce two landslide-susceptibility maps. The first landslide-susceptibility map (LSM1) was produced by overlaying the terminal nodes of the CHAID result tree. The second landslide-susceptibility map (LSM2) was produced using the overlay result of AHP pair-wise comparisons of CHAID terminal nodes. The prediction rate curve results were better with LSM2 (area under the prediction curve (AUC) = 0.80) than with LSM1 (AUC = 0.76). The results confirmed that the integrated hybrid model has superior prediction performance and reliability, and it is recommended for future use in medium-scale landslide-susceptibility mapping.

DOI

[2]
Atkinson P, Massari R, 1998. Generalised linear modelling of susceptibility to landsliding in the Central Apennines, Italy.Computers & Geosciences, 24(4): 373-385.

[3]
Ayalew L, Yamagishi H, 2005. The application of GIS-based logistic regression for landslide susceptibility mapping in the Kakuda-Yahiko Mountains, Central Japan.Geomorphology, 65(1): 15-31.As a first step forward in regional hazard management, multivariate statistical analysis in the form of logistic regression was used to produce a landslide susceptibility map in the Kakuda-Yahiko Mountains of Central Japan. There are different methods to prepare landslide susceptibility maps. The use of logistic regression in this study stemmed not only from the fact that this approach relaxes the strict assumptions required by other multivariate statistical methods, but also to demonstrate that it can be combined with bivariate statistical analyses (BSA) to simplify the interpretation of the model obtained at the end. In susceptibility mapping, the use of logistic regression is to find the best fitting function to describe the relationship between the presence or absence of landslides (dependent variable) and a set of independent parameters such as slope angle and lithology. Here, an inventory map of 87 landslides was used to produce a dependent variable, which takes a value of 0 for the absence and 1 for the presence of slope failures. Lithology, bed rock-slope relationship, lineaments, slope gradient, aspect, elevation and road network were taken as independent parameters. The effect of each parameter on landslide occurrence was assessed from the corresponding coefficient that appears in the logistic regression function. The interpretations of the coefficients showed that road network plays a major role in determining landslide occurrence and distribution. Among the geomorphological parameters, aspect and slope gradient have a more significant contribution than elevation, although field observations showed that the latter is a good estimator of the approximate location of slope cuts. Using a predicted map of probability, the study area was classified into five categories of landslide susceptibility: extremely low, very low, low, medium and high. The medium and high susceptibility zones make up 8.87% of the total study area and involve mid-altitude slopes in the eastern part of Kakuda Mountain and the central and southern parts of Yahiko Mountain.

DOI

[4]
Bartelletti C, Giannecchini R, D'Amato Avanzi Get al., 2017. The influence of geological-morphological and land use settings on shallow landslides in the Pogliaschina T. basin (northern Apennines, Italy).Journal of Maps, 13(2): 142-152.On 25 October 2011, the eastern Liguria (Vara Valley and Cinque Terre area) and northwestern Tuscany (Magra Valley) were affected by an extreme rainstorm (almost 600 mm/24 h) that caused floods, thousands of shallow landslides, 13 casualties and damage to villages and infrastructure. This study aims at analysing the main features of the 25 October 2011 shallow landslides occurred in the Pogliaschina Torrent basin (25 km2 wide, Vara Valley), in order to investigate the influence of specific predisposing factors (land use, geological and structural setting, plan and profile curvature, slope angle and aspect) on landslide occurrence. For this purpose, both a landslide inventory map and a geology map (scale 1:10,000) were prepared. In addition, a database including the main geological, geomorphological, structural and land use features of the landslide source areas was implemented. The relationship between landslide source areas and the main predisposing factors was evaluated through spatial and statistical analysis.

DOI

[5]
Brenning A, Schwinn M, Ruiz-Páez A Pet al., 2015. Landslide susceptibility near highways is increased by 1 order of magnitude in the Andes of southern Ecuador, Loja province.Nat. Hazards Earth Syst. Sci., 15: 45-57.Mountain roads in developing countries are known to increase landslide occurrence due to often inadequate drainage systems and mechanical destabilization of hillslopes by undercutting and overloading. This study empirically investigates landslide initiation frequency along two paved interurban highways in the tropical Andes of southern Ecuador across different climatic regimes. Generalized additive models (GAM) and generalized linear models (GLM) were used to analyze the relationship between mapped landslide initiation points and distance to highway while accounting for topographic, climatic, and geological predictors as possible confounders. A spatial block bootstrap was used to obtain nonparametric confidence intervals for the odds ratio of landslide occurrence near the highways (25 m distance) compared to a 200 m distance. The estimated odds ratio was 18 21, with lower 95% confidence bounds >13 in all analyses. Spatial bootstrap estimation using the GAM supports the higher odds ratio estimate of 21.2 (95% confidence interval: 15.5 25.3). The highway-related effects were observed to fade at about 150 m distance. Road effects appear to be enhanced in geological units characterized by Holocene gravels and Laramide andesite/basalt. Overall, landslide susceptibility was found to be more than 1 order of magnitude higher in close proximity to paved interurban highways in the Andes of southern Ecuador.

DOI

[6]
Bui D T, Lofman O, Revhaug Iet al., 2011. Landslide susceptibility analysis in the Hoa Binh province of Vietnam using statistical index and logistic regression.Natural Hazards, 59(3): 1413-1444.The purpose of this study is to evaluate and compare the results of applying the statistical index and the logistic regression methods for estimating landslide susceptibility in the Hoa Binh province of Vietnam. In order to do this, first, a landslide inventory map was constructed mainly based on investigated landslide locations from three projects conducted over the last 10 years. In addition, some recent landslide locations were identified from SPOT satellite images, fieldwork, and literature. Secondly, ten influencing factors for landslide occurrence were utilized. The slope gradient map, the slope curvature map, and the slope aspect map were derived from a digital elevation model (DEM) with resolution 20 20 m. The DEM was generated from topographic maps at a scale of 1:25,000. The lithology map and the distance to faults map were extracted from Geological and Mineral Resources maps. The soil type and the land use maps were extracted from National Pedology maps and National Land Use Status maps, respectively. Distance to rivers and distance to roads were computed based on river and road networks from topographic maps. In addition, a rainfall map was included in the models. Actual landslide locations were used to verify and to compare the results of landslide susceptibility maps. The accuracy of the results was evaluated by ROC analysis. The area under the curve (AUC) for the statistical index model was 0.946 and for the logistic regression model, 0.950, indicating an almost equal predicting capacity.

DOI

[7]
Cees van Westen, Fan Xuanmei, Huang Runqiu, 2010. Examples of international practice in landslide hazard and risk mapping. Assessing the state of art of landslide hazard and risk assessment in the P.R. of China. In: Living with landslide risk in Europe: Assessment, effects of global change, and risk management strategies. The Safeland Project Reports.

[8]
Cerovski-Darriau C, Roering J J, 2016. Influence of anthropogenic land-use change on hillslope erosion in the Waipaoa River Basin, New Zealand.Earth Surface Processes and Landforms, 41(15): 2167-2176.Abstract European settlement of the Poverty Bay Region resulted in deforestation and conversion of > 90% of the landscape to pastureland. The resulting loss of vegetation triggered a rapid increase in hillslope erosion as widespread landslide complexes and gully systems developed on weak lithologic units in the Waipaoa Basin. To quantify the rate and volume of historic hillslope degradation, we used a 1956–2010 sequence of aerial photographs for a ~16 km 2 catchment to map temporal changes in the spatial extent of active landslides. Then we created a ‘turf index’ based on the extent and style of pastoral ground disruption, which correlates with downslope velocity. Based on the movement of trees and other features, we assigned average velocities to the turf classes as follows: (1) minimal disrupted ground: 0.6 m/yr, (2) a mix of disrupted ground and intact blocks: 3.4 m/yr, and (3) no intact blocks or vegetation: > 6 m/yr. We then calculated the average annual sediment flux using these turf-derived velocities, the width of the landslide-channel intersection, and an average toe depth of 4.4 ± 1.3 m (mean ± standard deviation [SD]) from 37 field measurements. The resulting catchment averaged erosion rates are (mean ± SD): 29.9 ± 12.9 mm/yr (1956), 28.8 ± 13.7 mm/yr (1969), 13.4 ± 4.9 mm/yr (1979), 17.0 ± 6.2 mm/yr (1988), and 9.9 ± 3.6 mm/yr (2010). Compared with long-term (post-18 ka) erosion rates (1.6 mm/yr) and the long-term uplift rate (~1 mm/yr) for this site, the 50-year anthropogenically-driven rate is an order of magnitude larger (~20 mm/yr). Previously, we measured an increase in erosion over the past 3.4 kyr (2.2 mm/yr), and here, we demonstrate this increase could be primarily due to human land-use change – showing that a century of rapid erosion superimposed on the background geologic rate can profoundly skew the interpretation of erosion rates. Copyright 08 2016 John Wiley & Sons, Ltd.

DOI

[9]
Chau K T, Chan J E, 2005. Regional bias of landslide data in generating susceptibility maps using logistic regression: Case of Hong Kong Island.Landslides, 2(4): 280-290.On the basis of 1,834 landslide data for Hong Kong Island (HKI), landslide susceptibility maps were generated using logistic regression and GIS. Regional bias of the landslide inventory is examined by dividing the whole HKI into a southern and a northern region, separated by an east-west trending water divide. It was found that the susceptibility map of southern HKI generated by using the southern data differs significantly from that generated by using northern data, and similar conclusion can be drawn for the northern HKI. Therefore, a susceptibility map of HKI was established based on regional data analysis, and it was found to reflect closely the spatial distributions of historical landslides. Elevation appears to be the most dominant factor in controlling landslide occurrence, and this probably reflects that human developments are concentrated at certain elevations on the island. Classification plot, goodness of fit, and occurrence ratio were used to examine the reliability of the proposed susceptibility map. The size of landslide susceptible zones varies depending on the data sets used, thus this demonstrates that the historical landslide data may be biased and affected by human activities and geological settings on a regional basis. Therefore, indiscriminate use of regional-biased data should be avoided.

DOI

[10]
China Institute for Geo-Environment Monitoring (CIGEM), 2007a. Rockfall and Landslide Disaster Map of China. Beijing: SinoMaps Press. (in Chinese)

[11]
China Institute for Geo-Environment Monitoring (CIGEM), 2007b. Debris Flow Disaster Map of China. Beijing: SinoMaps Press. (in Chinese)

[12]
China Institute for Geo-Environment Monitoring (CIGEM), 2013. China Geological Hazard Bulletin (2004-2012). China Geological Environmental Monitoring Institute Web. . Accessed on 20 June 2014.

[13]
Chung C-J F, Fabbri A G, 2003. Validation of spatial prediction models for landslide hazard mapping.Natural Hazards, 30(3): 451-472. (in Chinese)This contribution discusses the problemof providing measures of significance ofprediction results when the predictionswere generated from spatial databases forlandslide hazard mapping. The spatialdatabases usually contain map informationon lithologic units, land-cover units,topographic elevation and derived attributes(slope, aspect, etc.) and the distributionin space and in time of clearly identifiedmass movements. In prediction modelling wetransform the multi-layered databaseinto an aggregation of functional values toobtain an index of propensity of the landto failure. Assuming then that the informationin the database is sufficiently representativeof the typical conditions in which the massmovements originated in space and in time,the problem then, is to confirm the validity ofthe results of some models over otherones, or of particular experiments that seem touse more significant data. A core pointof measuring the significance of a prediction isthat it allows interpreting the results.Without a validation no interpretation is possible,no support of the method or of theinput information can be provided. In particularwith validation, the added value canbe assessed of a prediction either in a fixedtime interval, or in an open-ended time orwithin the confined space of a study area.Validation must be of guidance in datacollection and field practice for landslidehazard mapping.

DOI

[14]
Computer Network Information Center of CAS, 2015. Geospatial Data Cloud. . Accessed on August, 2015. (in Chinese)

[15]
Devkota K C, Regmi A D, Pourghasemi H Ret al., 2013. Landslide susceptibility mapping using certainty factor, index of entropy and logistic regression models in GIS and their comparison at Mugling-Narayanghat road section in Nepal Himalaya.Natural Hazards, 65(1): 135-165.Landslide susceptibility maps are vital for disaster management and for planning development activities in the mountainous country like Nepal. In the present study, landslide susceptibility assessment of Mugling–Narayanghat road and its surrounding area is made using bivariate (certainty factor and index of entropy) and multivariate (logistic regression) models. At first, a landslide inventory map was prepared using earlier reports and aerial photographs as well as by carrying out field survey. As a result, 321 landslides were mapped and out of which 241 (7502%) were randomly selected for building landslide susceptibility models, while the remaining 80 (2502%) were used for validating the models. The effectiveness of landslide susceptibility assessment using GIS and statistics is based on appropriate selection of the factors which play a dominant role in slope stability. In this case study, the following landslide conditioning factors were evaluated: slope gradient; slope aspect; altitude; plan curvature; lithology; land use; distance from faults, rivers and roads; topographic wetness index; stream power index; and sediment transport index. These factors were prepared from topographic map, drainage map, road map, and the geological map. Finally, the validation of landslide susceptibility map was carried out using receiver operating characteristic (ROC) curves. The ROC plot estimation results showed that the susceptibility map using index of entropy model with AUC value of 0.9016 has highest prediction accuracy of 90.1602%. Similarly, the susceptibility maps produced using logistic regression model and certainty factor model showed 86.29 and 83.5702% of prediction accuracy, respectively. Furthermore, the ROC plot showed that the success rate of all the three models performed more than 8002% accuracy (i.e. 89.1502% for IOE model, 89.1002% for LR model and 87.2102% for CF model). Hence, it is concluded that all the models employed in this study showed reasonably good accuracy in predicting the landslide susceptibility of Mugling–Narayanghat road section. These landslide susceptibility maps can be used for preliminary land use planning and hazard mitigation purpose.

DOI

[16]
Eeckhaut M, Hervás J, Jaedicke Cet al., 2011. Statistical modelling of Europe-wide landslide susceptibility using limited landslide inventory data.Landslides, 9(3): 357-369.In many regions, the absence of a landslide inventory hampers the production of susceptibility or hazard maps. Therefore, a method combining a procedure for sampling of landslide-affected and landslide-free grid cells from a limited landslide inventory and logistic regression modelling was tested for susceptibility mapping of slide- and flow-type landslides on a European scale. Landslide inventories were available for Norway, Campania (Italy), and the Barcelonnette Basin (France), and from each inventory, a random subsample was extracted. In addition, a landslide dataset was produced from the analysis of Google Earth images in combination with the extraction of landslide locations reported in scientific publications. Attention was paid to have a representative distribution of landslides over Europe. In total, the landslide-affected sample contained 1,340 landslides. Then a procedure to select landslide-free grid cells was designed taking account of the incompleteness of the landslide inventory and the high proportion of flat areas in Europe. Using stepwise logistic regression, a model including slope gradient, standard deviation of slope gradient, lithology, soil, and land cover type was calibrated. The classified susceptibility map produced from the model was then validated by visual comparison with national landslide inventory or susceptibility maps available from literature. A quantitative validation was only possible for Norway, Spain, and two regions in Italy. The first results are promising and suggest that, with regard to preparedness for and response to landslide disasters, the method can be used for urgently required landslide susceptibility mapping in regions where currently only sparse landslide inventory data are available.

DOI

[17]
Falaschi F, Giacomelli F, Federici Pet al., 2009. Logistic regression versus artificial neural networks: Landslide susceptibility evaluation in a sample area of the Serchio River valley, Italy.Natural Hazards, 50(3): 551-569.This article presents a multidisciplinary approach to landslide susceptibility mapping by means of logistic regression, artificial neural network, and geographic information system (GIS) techniques. The methodology applied in ranking slope instability developed through statistical models (conditional analysis and logistic regression), and neural network application, in order to better understand the relationship between the geological/geomorphological landforms and processes and landslide occurrence, and to increase the performance of landslide susceptibility models. The proposed experimental study concerns with a wide research project, promoted by the Tuscany Region Administration and APAT-Italian Geological Survey, aimed at defining the landslide hazard in the area of the Sheet 250 astelnuovo di Garfagnana (1:50,000 scale). The study area is located in the middle part of the Serchio River basin and is characterized by high landslide susceptibility due to its geological, geomorphological, and climatic features, among the most severe in Italy. Terrain susceptibility to slope failure has been approached by means of indirect-quantitative statistical methods and neural network software application. Experimental results from different methods and the potentials and pitfalls of this methodological approach have been presented and discussed. Applying multivariate statistical analyses made it possible a better understanding of the phenomena and quantification of the relationship between the instability factors and landslide occurrence. In particular, the application of a multilayer neural network, equipped for supervised learning and error control, has improved the performance of the model. Finally, a first attempt to evaluate the classification efficiency of the multivariate models has been performed by means of the receiver operating characteristic (ROC) curves analysis approach.

DOI

[18]
García-Rodríguez M J, Malpica J A, Benito Bet al., 2008. Susceptibility assessment of earthquake-triggered landslides in El Salvador using logistic regression.Geomorphology, 95(3): 172-191.This work has evaluated the probability of earthquake-triggered landslide occurrence in the whole of El Salvador, with a Geographic Information System (GIS) and a logistic regression model. Slope gradient, elevation, aspect, mean annual precipitation, lithology, land use, and terrain roughness are the predictor variables used to determine the dependent variable of occurrence or non-occurrence of landslides within an individual grid cell. The results illustrate the importance of terrain roughness and soil type as key factors within the model using only these two variables the analysis returned a significance level of 89.4%. The results obtained from the model within the GIS were then used to produce a map of relative landslide susceptibility.

DOI

[19]
Gill J C, Malamud B D, 2017. Anthropogenic processes, natural hazards, and interactions in a multi-hazard framework.Earth-Science Reviews, 166: 246-269.This paper presents a broad overview, characterisation and visualisation of the role of 18 anthropogenic process types in triggering and influencing 21 natural hazards, and natural hazard interactions. Anthropogenic process types are defined as being intentional, non-malicious human activities. Examples include groundwater abstraction, subsurface mining, vegetation removal, chemical explosions and infrastructure (loading). Here we present a systematic classification of anthropogenic process types, organising them into three groups according to whether they are subsurface processes, surface processes, or both. Within each group we identify sub-groups (totalling eight): subsurface material extraction, subsurface material addition, land use change, surface material extraction, surface material addition, explosions, hydrological change, and fires. We use an existing classification of 21 natural hazards, organised into six hazard groups (geophysical, hydrological, shallow Earth processes, atmospheric, biophysical and space hazards). Examples include earthquakes, landslides, floods, regional subsidence and wildfires. Using these anthropogenic process types and natural hazards we do the following: (i) Describe and characterise 18 anthropogenic process types. (ii) Identify 64 interactions that may occur between two different anthropogenic processes, which could result in the simultaneous or successive occurrence of an ensemble of different anthropogenic process types. (iii) Identify, through an assessment of > 120 references, from both grey- and peer-review literature, 57 examples of anthropogenic processes triggering natural hazards, citing location-specific case studies for 52 of the 57 identified interactions. (iv) Examine the role of anthropogenic process types (we use as an example vegetation removal) catalysing or inadvertently impeding a given natural hazard interaction, where the impedance of natural hazard interactions does not include deliberate hazard reduction activities (e.g., engineered defences). Through (i) (iii) above, this study aims to enable the systematic integration of anthropogenic processes into existing and new multi-hazard and hazard interaction frameworks. As natural hazards occur within an environment shaped by anthropogenic activity, it is argued that the consideration of interactions involving anthropogenic processes is an important component of an applied multi-hazard assessment of hazard potential.

DOI

[20]
Guzzetti F, Peruccacci S, Rossi Met al., 2007. Rainfall thresholds for the initiation of landslides in central and southern Europe.Meteorology and Atmospheric Physics, 98(3): 239-267.We review rainfall thresholds for the initiation of landslides world wide and propose new empirical rainfall thresholds for the Central European Adriatic Danubian South-Eastern Space (CADSES) area, located in central and southern Europe. One-hundred-twenty-four empirical thresholds linking measurements of the event and the antecedent rainfall conditions to the occurrence of landslides are considered. We then describe a database of 853 rainfall events that resulted or did not result in landslides in the CADSES area. Rainfall and landslide information in the database was obtained from the literature; climate information was obtained from the global climate dataset compiled by the Climate Research Unit of the East Anglia University. We plot the intensity-duration values in logarithmic coordinates, and we establish that with increased rainfall duration the minimum intensity likely to trigger slope failures decreases linearly, in the range of durations from 20 minutes to 12 days. Based on this observation, we determine minimum intensity-duration (ID) and normalized-ID thresholds for the initiation of landslides in the CADSES area. Normalization is performed using two climatic indexes, the mean annual precipitation (MAP) and the rainy-day-normal (RDN). Threshold curves are inferred from the available data using a Bayesian statistical technique. Analysing the obtained thresholds we establish that lower average rainfall intensity is required to initiate landslides in an area with a mountain climate, than in an area characterized by a Mediterranean climate. We further suggest that for rainfall periods exceeding 12 days landslides are triggered by factors not considered by the ID model. The obtained thresholds can be used in operation landslide warning systems, where more accurate local or regional thresholds are not available.

DOI

[21]
Hartmann J, Moosdorf N, 2012. The new global lithological map database GLiM: A representation of rock properties at the earth surface.Geochemistry, Geophysics, Geosystems, 13(12): 1-37.Abstract Studies of the recent history of Earth's magnetic field have revealed a rich spatial and temporal structure, but face limitations by a lack of Southern Hemisphere archeomagnetic data. Studies of Iron Age (200-1850 AD) peoples of southern Africa have revealed a potentially rich source of archeomagnetic information in the form of ceramics (specifically pottery). Additionally, contemporary pottery made with traditional techniques and materials can still be found. Reported here is the first step in addressing whether ancient pottery from southern Africa might faithfully record the geomagnetic field. We analyze contemporary pottery made with traditional techniques and methods. Rock magnetic measurements, including magnetic susceptibility as a function of temperature and magnetic hysteresis behavior, are discussed. Intensity results generated by three common paleointensity methods: Thellier- Coe double heating experiments, the multi-specimen method of Dekkers and B hnel, and Shaw's method (with and without the corrections of Kono) are compared to the known field at the time of firing. The Thellier-Coe method reproduces the field (with an accuracy of 1.3 T), the Shaw technique with the correction approach of Kono overestimates the field by 3.7%. The multispecimen method overestimates the field by 20%, however improvement upon this could be expected given recent improvements to the technique. These values bound the accuracies we can expect when applying the methods to ideal samples, representing a best-case for dealing with archeological ceramics from southern Africa

DOI

[22]
Hu Y, Wang J, Li Xet al., 2011. Geographical detector-based risk assessment of the under-five mortality in the 2008 Wenchuan earthquake, China.PloS One, 6(6): e21427.Abstract On 12 May, 2008, a devastating earthquake registering 8.0 on the Richter scale occurred in Sichuan Province, China, taking tens of thousands of lives and destroying the homes of millions of people. Many of the deceased were children, particular children less than five years old who were more vulnerable to such a huge disaster than the adult. In order to obtain information specifically relevant to further researches and future preventive measures, potential risk factors associated with earthquake-related child mortality need to be identified. We used four geographical detectors (risk detector, factor detector, ecological detector, and interaction detector) based on spatial variation analysis of some potential factors to assess their effects on the under-five mortality. It was found that three factors are responsible for child mortality: earthquake intensity, collapsed house, and slope. The study, despite some limitations, has important implications for both researchers and policy makers.

DOI PMID

[23]
Huang R Q, 2007. Large-scale landslides and their sliding mechanisms in China since the 20th century. Chinese Journal of Rock Mechanics and Engineering, 26(3): 433-454. (in Chinese)The landslides occur frequently in China. In particular,large-scale landslides are dominant and extremely important. In West China,the large-scale landslides are notable for their scale,complex formation mechanism and serious destruction,which are typical and representative in the world. Data were collected from some typical large-scale landslides occurred in mainland of China since the 20th century. Among these cases,nine landslides were comprehensively analyzed and discussed. These cases represent different geological conditions, different triggering mechanisms and induced factors. This study shows that the fundamental cause for large-scale landslide in China is due to the topographical and geomorphological conditions. About 80 percent of large-scale landslides were found in the first slope-descending zone of the mainland topography around the eastern margin of Tibet plateau. Moreover,this area is the most active area of the plate tectonic activities. The intensive interactions between the endogenic and epigenetic geological process cause serious dynamic change of the high steep slope, which are resulted in the development of large-scale landslides. Strong earthquake,extreme weather conditions and the global climatic change are the main triggering factors of large-scale landslides. In South China,it is easy to trigger large-scale landslides when storm causes 200–300 mm/d of heavy rainfall. In Northwest China,the thawing of the frozen layer in spring is the main cause of large-scale landslides in loess region. In recent years, global warming causes the temperature to rise,snow line to shift,glacier recession and glacier lakes to collapse. These factors are also the triggering factors of large-scale landslides in some areas. In addition,the causation of more than 70 percent of large-scale landslides is closely related to the human activities. Detailed analyses of the cases show that the mechanisms of large-scale landslides in China are complex. The large-scale landslides can be summarized into three types:rock landslides,soil landslides and landslides in debris. The typical geomechanical models of large-scale landslides in rocks are shown as following:the “three sections” model(i.e. sliding-tension cracking-shearing),“retaining wall collapse”model,“horizontal-pushing”model in horizontal strata, large-scale toppling model in anti-dip strata,and the creep-bending-shearing model,etc.. Each model corresponds to some specific rock structure conditions and deformation processes. When large-scale rock landslides occur,they are generally accompanied by the suddenly brittle failure of the“locked section”along the potential sliding surface. The“locked section”is extremely important to the deformation control and stability of the rock slope, which is also the key factor for the assessment of slope geohazard and for the development of control methods. It is shown in engineering practice that the correct understanding and using of geological and mechanical model are the fundamental keys for the prevention of large-scale landslides.

[24]
Institute of Geographic Sciences and Natural Resources Research of CAS, 2015. Data Sharing Network of Earth System Science. . Accessed on June, 2015. (in Chinese)

[25]
Jadda M, Shafri HZM, Mansor SB, 2011. PFR model and GiT for landslide susceptibility mapping: A case study from Central Alborz, Iran.Natural Hazards, 57(2): 395-412.In northern parts of Iran such as the Alborz Mountain belt, frequent landslides occur due to a combination of climate and geologic conditions with high tectonic activities. This results in millions of dollars of financial damages annually excluding casualties and unrecoverable resources. This paper evaluates the landslide susceptible areas in Central Alborz using the probabilistic frequency ratio (PFR) model and Geo-information Technology (GiT). The landslide location map in this study has been generated based on image elements interpreted from IRS satellite data and field observations. The display, manipulation and analysis have been carried out to evaluate layers such as geology, geomorphology, soil, slope, aspect, land use, distance from faults, lineaments, roads and drainages. The validation group of actual landslides and relative operation curve method has been used to increase the accuracy of the final landslide susceptibility map. The area under the curve evaluates how well the method predicts landslides. The results showed a satisfactory agreement of 91% between prepared susceptibility map and existing data on landslide locations.

DOI

[26]
King G, Zeng L, 2001. Logistic regression in rare events data.Political Analysis, 9(2): 137-163.We study rare events data, binary dependent variables with dozens to thousands of times fewer ones (events, such as wars, vetoes, cases of political activism, or epidemiological infections) than zeros (090008nonevents090009). In many literatures, these variables have proven difficult to explain and predict, a problem that seems to have at least two sources. First, popular statistical procedures, such as logistic regression, can sharply underestimate the probability of rare events. We recommend corrections that outperform existing methods and change the estimates of absolute and relative risks by as much as some estimated effects reported in the literature. Second, commonly used data collection strategies are grossly inefficient for rare events data. The fear of collecting data with too few events has led to data collections with huge numbers of observations but relatively few, and poorly measured, explanatory variables, such as in international conflict data with more than a quarter-million dyads, only a few of which are at war. As it turns out, more efficient sampling designs exist for making valid inferences, such as sampling all available events (e.g., wars) and a tiny fraction of nonevents (peace). This enables scholars to save as much as 99% of their (nonfixed) data collection costs or to collect much more meaningful explanatory variables. We provide methods that link these two results, enabling both types of corrections to work simultaneously, and software that implements the methods developed.

DOI

[27]
Lee S, Pradhan B, 2006. Landslide hazard mapping at Selangor, Malaysia using frequency ratio and logistic regression models.Landslides, 4(1): 33-41.

[28]
Li Y, Meng H, Dong Yet al., 2004. Main types and characteristics of geo-hazard in China: Based on the results of geo-hazard survey in 290 counties.The Chinese Journal of Geological Hazard and Control, 15(2): 29-34. (in Chinese)China is one of the most serious geo-hazard country in the world. In order to find out the distribution of the geo-hazard in China, the Ministry of Land and Resources made a geo-hazard survey plan in serious geo-hazard counties. Based on the results of this survey in 290 counties, the paper analyzes the geo-hazard characterisitics of type, size, excitated facter, development and distribution.Considering the density of geo-hazard amount, volume and area, the development degree of geo-hazard in 290 counyies has been estimated. 30 counties with serious geo-hazard distribute in Chongqing City, Guizhou Province, Hubei Province, Gansu Province, Sichuan Province and Yunnan Province. 107 counties with relatively serious geo-hazard distribute in Hunan Province, Jiangxi Province, Shannxi Province,Sichuan Province, Guizhou Province, Hubei Province, Yunnan Province and Chongqing City. 90 counties with moderate geo-hazard distribute in Hebei Province,Sichuan Province, Zhejiang Province and Fujian Province. 62 counties with moderate geo-hazard distribute in Hebei Province, Guangxi Province, Xinjiang Province and Shanxi Province.

[29]
Li Y, Qu X, Yang Xet al., 2013. The spatial and temporal distribution of China geo-hazard and key prevention area.The Chinese Journal of Geological Hazard and Control, 24(4):71-78. (in Chinese)

[30]
Luo W, Jasiewicz J, Stepinski Tet al., 2016. Spatial association between dissection density and environmental factors over the entire conterminous United States.Geophysical Research Letters, 43(2): 692-700.Previous studies of land dissection density (D) often find contradictory results regarding factors controlling its spatial variation. We hypothesize that the dominant controlling factors (and the interactions between them) vary from region to region due to differences in each region's local characteristics and geologic history. We test this hypothesis by applying a geographical detector method to eight physiographic divisions of the conterminous United States and identify the dominant factor(s) in each. The geographical detector method computes the power of determinant (q) that quantitatively measures the affinity between the factor considered and D. Results show that the factor (or factor combination) with the largest q value is different for physiographic regions with different characteristics and geologic histories. For example, lithology dominates in mountainous regions, curvature dominates in plains, and glaciation dominates in previously glaciated areas. The geographical detector method offers an objective framework for revealing factors controlling Earth surface processes.

DOI

[31]
Ministry of Land and Resources of China (MLRC), 2013. Report on Geological Disaster Situation. Ministry of Land and Resources of China Web. . Accessed on 20 May 2014. (in Chinese)

[32]
National Disaster Reduction Center of China (NDRCC), 2013. Yesterday's Disaster 2004-2012. Ministry of Civil Affairs National Disaster Reduction Center. (in Chinese)

[33]
Nourani V, Pradhan B, Ghaffari Het al., 2014. Landslide susceptibility mapping at Zonouz Plain, Iran using genetic programming and comparison with frequency ratio, logistic regression, and artificial neural network models.Natural Hazards, 71(1): 523-547.Without a doubt, landslide is one of the most disastrous natural hazards and landslide susceptibility maps (LSMs) in regional scale are the useful guide to future development planning. Therefore, the importance of generating LSMs through different methods is popular in the international literature. The goal of this study was to evaluate the susceptibility of the occurrence of landslides in Zonouz Plain, located in North-West of Iran. For this purpose, a landslide inventory map was constructed using field survey, air photo/satellite image interpretation, and literature search for historical landslide records. Then, seven landslide-conditioning factors such as lithology, slope, aspect, elevation, land cover, distance to stream, and distance to road were utilized for generation LSMs by various models: frequency ratio (FR), logistic regression (LR), artificial neural network (ANN), and genetic programming (GP) methods in geographic information system (GIS). Finally, total four LSMs were obtained by using these four methods. For verification, the results of LSM analyses were confirmed using the landslide inventory map containing 190 active landslide zones. The validation process showed that the prediction accuracy of LSMs, produced by the FR, LR, ANN, and GP, was 87.57, 89.42, 92.37, and 93.27 %, respectively. The obtained results indicated that the use of GP for generating LSMs provides more accurate prediction in comparison with FR, LR, and ANN. Furthermore; GP model is superior to the ANN model because it can present an explicit formulation instead of weights and biases matrices.

DOI

[34]
Ohlmacher G C, Davis J C, 2003. Using multiple logistic regression and GIS technology to predict landslide hazard in northeast Kansas, USA.Engineering Geology, 69(3): 331-343.Landslides in the hilly terrain along the Kansas and Missouri rivers in northeastern Kansas have caused millions of dollars in property damage during the last decade. To address this problem, a statistical method called multiple logistic regression has been used to create a landslide-hazard map for Atchison, Kansas, and surrounding areas. Data included digitized geology, slopes, and landslides, manipulated using ArcView GIS. Logistic regression relates predictor variables to the occurrence or nonoccurrence of landslides within geographic cells and uses the relationship to produce a map showing the probability of future landslides, given local slopes and geologic units. Results indicated that slope is the most important variable for estimating landslide hazard in the study area. Geologic units consisting mostly of shale, siltstone, and sandstone were most susceptible to landslides. Soil type and aspect ratio were considered but excluded from the final analysis because these variables did not significantly add to the predictive power of the logistic regression. Soil types were highly correlated with the geologic units, and no significant relationships existed between landslides and slope aspect.

DOI

[35]
Poiraud A, 2014. Landslide susceptibility-certainty mapping by a multi-method approach: A case study in the Tertiary basin of Puy-en-Velay (Massif central, France).Geomorphology, 216: 208-224.The present study discusses the use of integrated variables along with a combination of multi-method forecasts for landslide susceptibility mapping. The study area is located in the south-eastern French Massif central, a volcanic region containing Tertiary sedimentary materials that are prone to landslides. The flowage-type landslides within the study area are very slow-moving phenomena which affect the infrastructures and human settlements. The modelling process is based on a training set of landslides (70% of total landslides) and a set of controlling factor (slope, lithology, surficial formation, the topographic wetness index, the topographic position index, distance to thalweg, and aspect). We create a composite variable (or integrated variable), corresponding to the union of geology and surficial formation, in order to avoid the conditional dependence between these two variables and to build a geotechnical variable. We use five classical modelling methods (index, weight-of-evidence, logistic regression, decision tree, and unique condition unit) with the same training set but with different architectures of input data made up of controlling factors. All the models are tested with a validation group (30% of total landslides), using the Area Under the Receiver Operating Characteristic curve ( AUC ) to quantify their predictive performance. We finally select a single est model for each method. However, these five models are all equivalent in quality, despite their differences in detail, so no single model stands out against another. Finally, we combine the five models into a unique susceptibility map with a calculation of median susceptibility class. The final AUC value of this combined map is better than that for a single model (except for Unique Condition Unit), and we can evaluate the certainty of the susceptibility class pixel by pixel. In agreement with the sparse literature on this topic, we conclude that i) integrated variables increase the performance of classical modelling processes and ii) the combination of multi-method forecasts is a pragmatic solution to the inherent problem of choosing the most suitable method for the available data and geomorphological context.

DOI

[36]
Pourghasemi H, Moradi H, Aghda S F, 2013. Landslide susceptibility mapping by binary logistic regression, analytical hierarchy process, and statistical index models and assessment of their performances.Natural Hazards, 69(1): 749-779.The current research presents a detailed landslide susceptibility mapping study by binary logistic regression, analytical hierarchy process, and statistical index models and an assessment of their performances. The study area covers the north of Tehran metropolitan, Iran. When conducting the study, in the first stage, a landslide inventory map with a total of 528 landslide locations was compiled from various sources such as aerial photographs, satellite images, and field surveys. Then, the landslide inventory was randomly split into a testing dataset 70 % (370 landslide locations) for training the models, and the remaining 30 % (158 landslides locations) was used for validation purpose. Twelve landslide conditioning factors such as slope degree, slope aspect, altitude, plan curvature, normalized difference vegetation index, land use, lithology, distance from rivers, distance from roads, distance from faults, stream power index, and slope-length were considered during the present study. Subsequently, landslide susceptibility maps were produced using binary logistic regression (BLR), analytical hierarchy process (AHP), and statistical index (SI) models in ArcGIS. The validation dataset, which was not used in the modeling process, was considered to validate the landslide susceptibility maps using the receiver operating characteristic curves and frequency ratio plot. The validation results showed that the area under the curve (AUC) for three mentioned models vary from 0.7570 to 0.8520 \( ({\text{AUC}}_{\text{AHP}} = 75.70\;\% ,\;{\text{AUC}}_{\text{SI}} = 80.37\;\% ,\;{\text{and}}\;{\text{AUC}}_{\text{BLR}} = 85.20\;\% ) \) . Also, plot of the frequency ratio for the four landslide susceptibility classes of the three landslide susceptibility models was validated our results. Hence, it is concluded that the binary logistic regression model employed in this study showed reasonably good accuracy in predicting the landslide susceptibility of study area. Meanwhile, the results obtained in this study also showed that the statistical index model can be used as a simple tool in the assessment of landslide susceptibility when a sufficient number of data are obtained.

DOI

[37]
Ramani S E, Pitchaimani K, Gnanamanickam V R, 2011. GIS based landslide susceptibility mapping of Tevankarai Ar sub-watershed, Kodaikkanal, India using binary logistic regression analysis.Journal of Mountain Science, 8(4): 505-517.

DOI

[38]
Samia J, Temme A, Bregt Aet al., 2017. Characterization and quantification of path dependency in landslide susceptibility.Geomorphology, 292: 16-24.Landslides cause major environmental damage, economic losses and casualties. Although susceptibility to landsliding is usually considered an exclusively location-specific phenomenon, indications exist that landslide history co-determines susceptibility to future landslides. In this contribution, we quantified the role of landslide path dependency (the effect of landslides on landslides) using a multi-temporal landslide inventory from Italy. The fraction of landslides following earlier landslides in the same location exhibited an exponential decay, with susceptibility increasing 15-fold right after an initial landslide, and returning to pre-landslide values after about 25 years. We investigated the role of the geometry and location of a previous landslide for the occurrence of follow-up landslides. Larger landslides are more likely to cause follow-up landslides. Also landslide shape, topographic wetness index, the vertical distance to the nearest channel network, the absolute profile curvature and relative slope position of an earlier landslide, however, are important in predicting whether a follow-up landslide occurs. Combined in a binary logistic model, these attributes correctly predict 60% of times whether a landslide will be followed-up. These findings open the way for time-variant mapping of susceptibility to landslides, by including the effect of the spatio-temporal history of landsliding on susceptibility.

DOI

[39]
Sheng L, Wang W, Zhong S, 2013. China Statistical Yearbook. Beijing: China Statistics Press. (in Chinese)

[40]
Shirzadi A, Saro L, Joo O Het al., 2012. A GIS-based logistic regression model in rock-fall susceptibility mapping along a mountainous road: Salavat Abad case study, Kurdistan, Iran.Natural Hazards, 64(2): 1639-1656.This study describes the application of logistic regression to rock-fall susceptibility mapping along 11 km of a mountainous road on the Salavat Abad saddle, in southwest Kurdistan, Iran. To determine the factors influencing rock-falls, data layers of slope degree, slope aspect, slope curvature, elevation, distance to road, distance to fault, lithology, and land use were analyzed by logistic regression analysis. The results are shown as rock-fall susceptibility maps. A spatial database, which included 68 sites (34 rock-fall point cells with value of 1 and 34 no rock-fall point cells with value of 0) was developed and analyzed using a Geographic Information System, GIS. The results are shown as four classes of rock-fall susceptibility. In this study, distance to fault, lithology, slope curvature, slope degree, and distance to road were found to be the most important factors affecting rock-fall. It was concluded that about 76 % of the study area can be classified as having moderate and high susceptibility classes. Rock-fall point cells were used to verify results of the rock-fall susceptibility map using success curve rate and the area under the curve. The verification results showed that the area under the curve for rock-fall susceptibility map is 77.57 %. The results from this study demonstrated that the use of a logistic regression model within a GIS framework is useful and suitable for rock-fall susceptibility mapping. The rock-fall susceptibility map can be used to reduce susceptibility associated with rock-fall.

DOI

[41]
Swets J A, 1988. Measuring the accuracy of diagnostic systems.Science, 240(4857): 1285-1293.

DOI

[42]
Tarolli P, Sofia G, 2016. Human topographic signatures and derived geomorphic processes across landscapes.Geomorphology, 255: 140-161.The Earth's surface morphology, in an abiotic context, is a consequence of major forcings such as tectonic uplift, erosion, sediment transport, and climate. Recently, however, it has become essential for the geomorphological community to also take into account biota as a geomorphological agent that has a role in shaping the landscape, even if at a different scale and magnitude from that of geology. Although the modern literature is flourishing on the impacts of vegetation on geomorphic processes, the study of anthropogenic pressures on geomorphology is still in its early stages. Topography emerges as a result of natural driving forces, but some human activities (such as mining, agricultural practices and the construction of road networks) directly or indirectly move large quantities of soil, which leave clear topographic signatures embedded on the Earth's morphology. These signatures can cause drastic changes to the geomorphological organization of the landscape, with direct consequences on Earth surface processes. This review provides an overview of the recent literature on the role of humans as a geological agent in shaping the morphology of the landscape. We explore different contexts that are significantly characterized by anthropogenic topographic signatures: landscapes affected by mining activities, road networks and agricultural practices. We underline the main characteristics of those landscapes and the implications of human impacts on Earth surface processes. The final section considers future challenges wherein we explore recent novelties and trials in the concept of anthropogenic geomorphology. Herein, we focus on the role of high-resolution topographic and remote-sensing technologies. The reconstruction or identification of artificial or anthropogenic topographies provides a mechanism for quantifying anthropogenic changes to landscape systems. This study may allow an improved understanding and targeted mitigation of the processes driving geomorphic changes during anthropogenic development and help guide future research directions for development-based watershed studies. Human society is deeply affecting the environment with consequences on the landscape. Therefore, establishing improved management measures that consider the Earth's rapidly changing systems is fundamental.

DOI

[43]
Tsangaratos P, Ilia I, 2016. Landslide susceptibility mapping using a modified decision tree classifier in the Xanthi Perfection, Greece.Landslides, 13(2): 305-320.The objective of this study was to validate the outcomes of a modified decision tree classifier by comparing the produced landslide susceptibility map and the actual landslide occurrence, in an area...

DOI

[44]
The State Council, 2004. Geological Disaster Prevention Regulations. . Accessed on 15 May 2014. (in Chinese)

[45]
Wang J F, Li X H, Christakos Get al., 2010. Geographical detectors-based health risk assessment and its application in the neural tube defects study of the Heshun Region, China.International Journal of Geographical Information Science, 24(1): 107-127.Physical environment, man‐made pollution, nutrition and their mutual interactions can be major causes of human diseases. These disease determinants have distinct spatial distributions across geographical units, so that their adequate study involves the investigation of the associated geographical strata. We propose four geographical detectors based on spatial variation analysis of the geographical strata to assess the environmental risks of health: the risk detector indicates where the risk areas are; the factor detector identifies factors that are responsible for the risk; the ecological detector discloses relative importance between the factors; and the interaction detector reveals whether the risk factors interact or lead to disease independently. In a real‐world study, the primary physical environment (watershed, lithozone and soil) was found to strongly control the neural tube defects (NTD) occurrences in the Heshun region (China). Basic nutrition (food) was found to be more important than man‐made pollution (chemical fertilizer) in the control of the spatial NTD pattern. Ancient materials released from geological faults and subsequently spread along slopes dramatically increase the NTD risk. These findings constitute valuable input to disease intervention strategies in the region of interest.

DOI

[46]
Xu C, Xu X, Dai Fet al., 2013. Application of an incomplete landslide inventory, logistic regression model and its validation for landslide susceptibility mapping related to the May 12, 2008 Wenchuan earthquake of China.Natural Hazards, 68(2): 883-900.The main purpose of this paper is to present the use of multi-resource remote sensing data, an incomplete landslide inventory, GIS technique and logistic regression model for landslide susceptibility mapping related to the May 12, 2008 Wenchuan earthquake of China. Landslide location polygons were delineated from visual interpretation of aerial photographs, satellite images in high resolutions, and verified by selecting field investigations. Eight factors, including slope angle, slope aspect, elevation, distance from drainages, distance from roads, distance from main faults, seismic intensity and lithology were selected as controlling factors for earthquake-triggered landslide susceptibility mapping. Qualitative susceptibility analyses were carried out using the map overlaying techniques in GIS platform. The validation result showed a success rate of 82.751 % between the susceptibility probability index map and the location of the initial landslide inventory. The predictive rate of 86.930 % was obtained by comparing the additional landslide polygons and the landslide susceptibility probability index map. Both the success rate and the predictive rate show sufficient agreement between the landslide susceptibility map and the existing landslide data, and good predictive power for spatial prediction of the earthquake-triggered landslides.

DOI

[47]
Yen S J, Lee Y S, Lin C H, et al., 2006. Investigating the effect of sampling methods for imbalanced data distributions. In: Systems, Man and Cybernetics, 2006. SMC'06. IEEE International Conference, 5: 4163-4168.

[48]
Zhang H B, Tong X, 2009. Public policy in a high-risk society.Journal of Nanjing Normal University (Social Science), (6): 23-28. (in Chinese)China has entered the period with a high-risk society,which constitutes a big challenge to the current Chinese public policy system.It has expanded the traditional boundaries of public policy,and changed the evaluation criteria of public policy as well as its mode of agenda setting.In order to meet the challenge,the current Chinese public policy system needs some positive changes,such as taking the risk policies of private sectors into the framework of public policy,paying attention to the legal status of netizens in policy agenda setting,and taking the acceptability of a policy as the judgment of good or bad.

Outlines

/