
Journal of Geographical Sciences >
Glacier changes in the Qilian Mountains in the past half-century: Based on the revised First and Second Chinese Glacier Inventory
Author: Sun Meiping (1981-), PhD and Associate Professor, specializing in the research of hydrological processes and climate change impact assessment. E-mail: sunmeiping1982@163.com
*Corresponding author: Liu Shiyin, Professor, E-mail: liusy@lzb.ac.cn; This paper has been published in Chinese and revised partially.
Received date: 2017-06-07
Accepted date: 2017-07-20
Online published: 2018-02-10
Supported by
National Natural Science Foundation of China, No.41261016, No.41561016
National Basic Work Program of MST, No.2013FY111400
Postdoctoral Science Foundation of China, No. 2015M572619
Opening Foundation Projection of State Key Laboratory of Cryosphere Sciences, CAS, No. SKLCS-OP-2016-10
Youth Scholar Scientific Capability Promoting Project of Northwest Normal University, No. NWNU-LKQN-14-4
Copyright
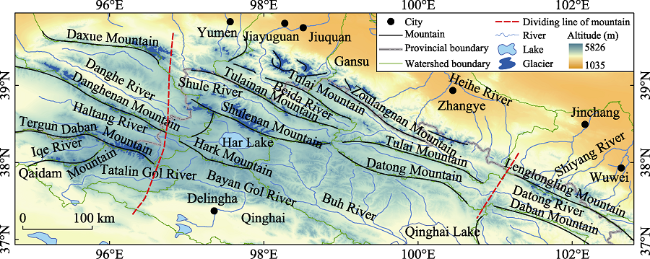
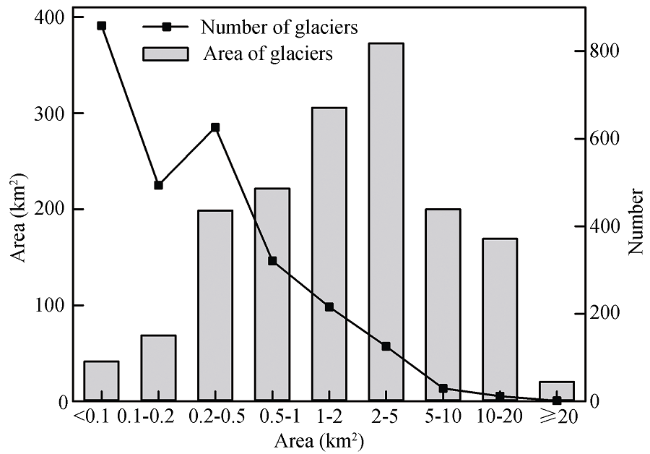
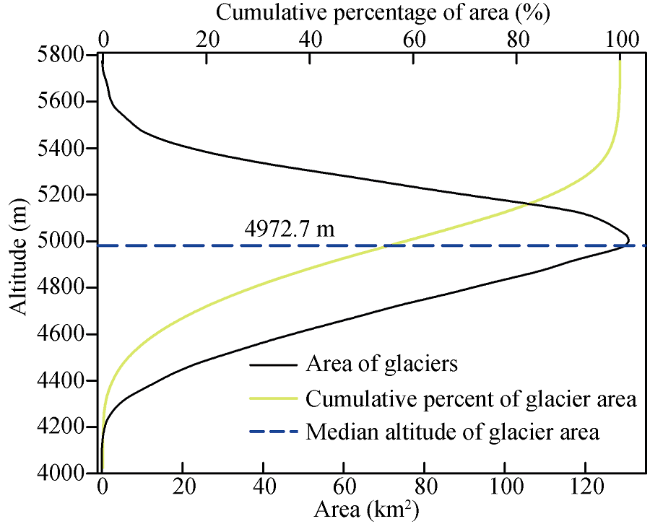
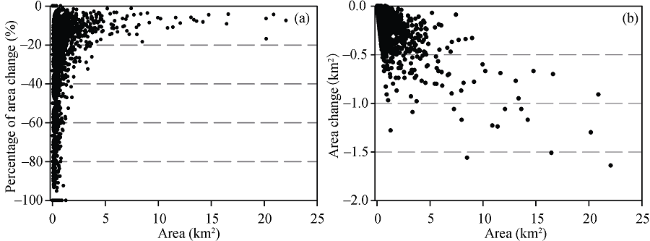
Glaciers are the most important fresh-water resources in arid and semi-arid regions of western China. According to the Second Chinese Glacier Inventory (SCGI), primarily compiled from Landsat TM/ETM+ images, the Qilian Mountains had 2684 glaciers covering an area of 1597.81±70.30 km2 and an ice volume of ~84.48 km3 from 2005 to 2010. While most glaciers are small (85.66% are <1.0 km2), some larger ones (12.74% in the range 1.0-5.0 km2) cover 42.44% of the total glacier area. The Laohugou Glacier No.12 (20.42 km2) located on the north slope of the Daxue Range is the only glacier >20 km2 in the Qilian Mountains. Median glacier elevation was 4972.7 m and gradually increased from east to west. Glaciers in the Qilian Mountains are distributed in Gansu and Qinghai provinces, which have 1492 glaciers (760.96 km2) and 1192 glaciers (836.85 km2), respectively. The Shule River basin contains the most glaciers in both area and volume. However, the Heihe River, the second largest inland river in China, has the minimum average glacier area. A comparison of glaciers from the SCGI and revised glacier inventory based on topographic maps and aerial photos taken from 1956 to 1983 indicate that all glaciers have receded, which is consistent with other mountain and plateau areas in western China. In the past half-century, the area and volume of glaciers decreased by 420.81 km2 (-20.88%) and 21.63 km3 (-20.26%), respectively. Glaciers with areas <1.0 km2 decreased the most in number and area recession. Due to glacier shrinkage, glaciers below 4000 m completely disappeared. Glacier changes in the Qilian Mountains presented a clear longitudinal zonality, i.e., the glaciers rapidly shrank in the east but slowly in the central-west. The primary cause of glacier recession was warming temperatures, which was slightly mitigated with increased precipitation.
Key words: glacier change; glacier inventory; glacier volume; climate change; Qilian Mountains
SUN Meiping , LIU Shiyin , YAO Xiaojun , GUO Wanqin , XU Junli . Glacier changes in the Qilian Mountains in the past half-century: Based on the revised First and Second Chinese Glacier Inventory[J]. Journal of Geographical Sciences, 2018 , 28(2) : 206 -220 . DOI: 10.1007/s11442-018-1468-y
Figure 1 The distribution of glaciers in the Qilian Mountains |
Figure 2 The total glacierized area and number of glaciers in different size classes in the Qilian Mountains between 2005 and 2010 |
Figure 3 Hypsography of glacier area in the Qilian Mountains |
Table 1 Glacier statistics by drainage basin in the Qilian Mountains |
| Basin (Code) | Sub-basin (Code) | Number | Area | Average area(km2) | Volume | |||
|---|---|---|---|---|---|---|---|---|
| (%) | (km2) | (%) | (km3) | (%) | ||||
| Datong River (5J4) | Datong River (5J42) | 68 | 2.53 | 20.83 | 1.30 | 0.31 | 0.73 | 0.86 |
| Hexi interior area (5Y4) | Shiyang River (5Y41) | 97 | 3.61 | 39.94 | 2.50 | 0.41 | 1.55 | 1.83 |
| Heihe River (5Y42) | 375 | 13.97 | 78.33 | 4.90 | 0.21 | 2.39 | 2.83 | |
| Beida River (5Y43) | 577 | 21.50 | 215.27 | 13.47 | 0.37 | 8.75 | 10.36 | |
| Shule River (5Y44) | 660 | 24.59 | 509.87 | 31.91 | 0.77 | 29.66 | 35.11 | |
| Danghe River (5Y45) | 318 | 11.85 | 203.77 | 12.75 | 0.64 | 10.08 | 11.93 | |
| Total | 2027 | 75.52 | 1047.18 | 65.54 | 0.52 | 52.43 | 62.07 | |
| Qaidam interior area (5Y5) | Buh River-Qinghai Lake (5Y51) | 24 | 0.89 | 10.27 | 0.64 | 0.43 | 0.42 | 0.50 |
| Haltang River (5Y56) | 268 | 9.99 | 283.52 | 17.74 | 1.06 | 17.58 | 20.81 | |
| Har Lake (5Y57) | 108 | 4.02 | 78.73 | 4.93 | 0.73 | 4.56 | 5.40 | |
| Iqe River-Tatalin Gol River (5Y58) | 179 | 6.67 | 155.08 | 9.71 | 0.87 | 8.69 | 10.29 | |
| Bayan Gol River (5Y59) | 10 | 0.37 | 2.20 | 0.14 | 0.22 | 0.06 | 0.07 | |
| Total | 589 | 21.94 | 529.8 | 33.16 | 0.90 | 31.31 | 37.07 | |
Table 2 Glacier statistics by province in the Qilian Mountains |
| Province | City/Autonomous Prefecture | Number | Area | Volume | |||
|---|---|---|---|---|---|---|---|
| (%) | (km2) | (%) | (km3) | (%) | |||
| Gansu | Jiuquan | 718 | 26.75 | 508.99 | 31.86 | 28.17 | 33.35 |
| Zhangye | 739 | 27.53 | 245.65 | 15.37 | 9.60 | 11.36 | |
| Wuwei | 35 | 1.31 | 6.32 | 0.40 | 0.17 | 0.20 | |
| Total | 1492 | 55.59 | 760.96 | 47.63 | 37.94 | 44.91 | |
| Qinghai | Haixi | 825 | 30.74 | 729.79 | 45.67 | 42.79 | 50.65 |
| Haibei | 367 | 13.67 | 107.06 | 6.70 | 3.75 | 4.44 | |
| Total | 1192 | 44.41 | 836.85 | 52.37 | 46.54 | 55.09 | |
Table 3 Glacier volume changes in the Qilian Mountains based on three sets of empirical constants |
| Ice volume of glaciers in the FCGI (km3) | Ice volume of glaciers in the SCGI (km3) | Glacier volume change | Method of glacier volume calculation | Reference | ||
|---|---|---|---|---|---|---|
| km3 | km3/10a | %/10a | ||||
| 101.90 | 81.30 | -20.60 | -5.12 | -5.65 | V=0.0365A1.375 | Radić and Hock (2010) |
| 109.86 | 87.52 | -22.34 | -5.56 | -5.69 | V=0.0433A1.29 | Grinsted (2013) |
| 108.44 | 86.49 | -21.95 | -5.46 | -5.66 | V=0.04A1.35 | Liu et al. (2003) |
Figure 4 Percentage and area changes in glaciers in the Qilian Mountains from 1956 to 2010 |
Figure 5 Altitudinal characteristics of glacial changes in the Qilian Mountains from 1956 to 2010 |
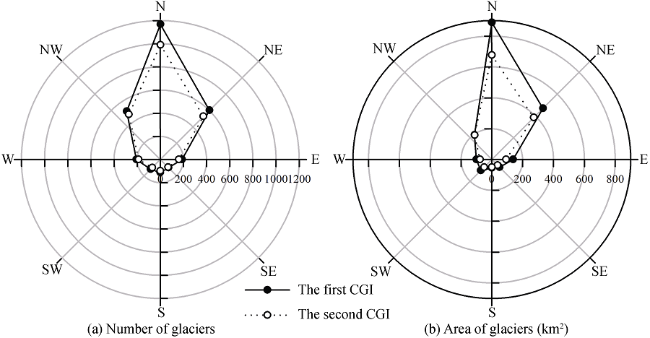
Figure 6 Orientation characteristics of glacial changes in the Qilian Mountains from 1956 to 2010 |
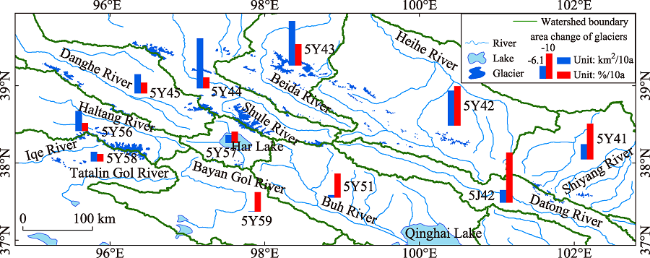
Figure 7 Area changes of glaciers in different drainage basins in the Qilian Mountains from 1956 to 2010 |
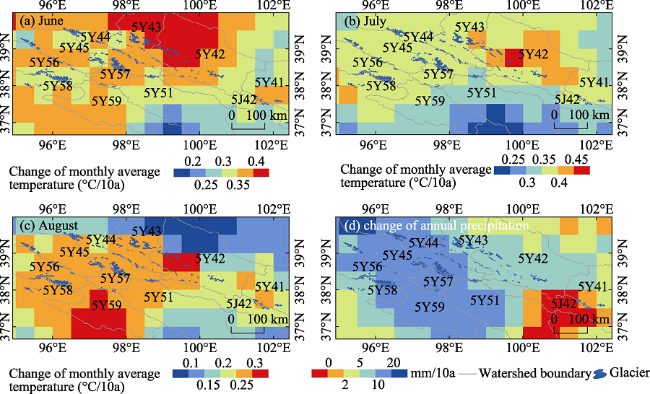
Figure 8 Change in summer temperature, (a) June, (b) July, (c) August, and (d) annual precipitation in the Qilian Mountains from 1961 to 2010 |
The authors have declared that no competing interests exist.
| [1] |
|
| [2] |
|
| [3] |
|
| [4] |
|
| [5] |
|
| [6] |
|
| [7] |
|
| [8] |
|
| [9] |
|
| [10] |
|
| [11] |
|
| [12] |
|
| [13] |
|
| [14] |
|
| [15] |
|
| [16] |
|
| [17] |
|
| [18] |
|
| [19] |
|
| [20] |
|
| [21] |
|
| [22] |
|
| [23] |
|
| [24] |
|
| [25] |
|
| [26] |
|
| [27] |
|
| [28] |
|
| [29] |
|
| [30] |
|
| [31] |
|
| [32] |
|
| [33] |
|
| [34] |
|
| [35] |
|
| [36] |
|
| [37] |
|
| [38] |
|
/
| 〈 |
|
〉 |
