
Journal of Geographical Sciences >
Dynamic identification of soil erosion risk in the middle reaches of the Yellow River Basin in China from 1978 to 2010
Author: Zhao Haigen (1983-), PhD, specialized in hydrological simulation and remote sensing. E-mail: zhaohaigen1983@163.com
*Corresponding author: Yang Shengtian (1965-), Professor, E-mail: yangshengtian@bnu.edu.cn
Received date: 2016-12-06
Accepted date: 2017-03-21
Online published: 2018-02-10
Supported by
National Natural Science Foundation of China, No.41701517
National Key Project for R&D, No.2016YFC0402403, No.2016YFC0402409
Copyright
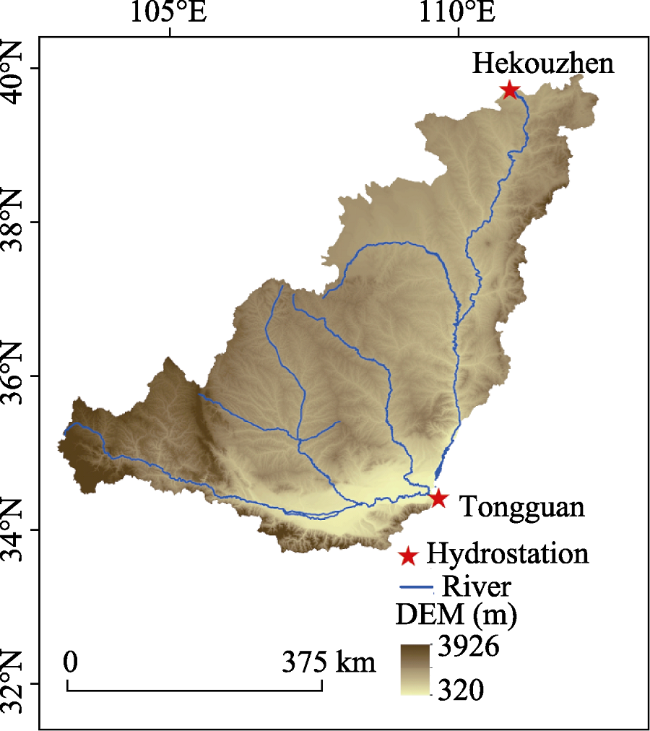
Soil erosion has become a significant environmental problem that threatens ecosystems globally. The risks posed by soil erosion, the trends in the spatial distribution in soil erosion, and the status, intensity, and conservation priority level in the middle reaches of the Yellow River Basin were identified from 1978 to 2010. This study employed a multi-criteria evaluation method integrated with GIS and multi-source remote sensing data including land use, slope gradient and vegetation fractional coverage (VFC). The erosion status in the study region improved from 1978 to 2010; areas of extremely severe, more severe, and severe soil erosion decreased from 0.05%, 0.94%, and 11.25% in 1978 to 0.04%, 0.81%, and 10.28% in 1998, respectively, and to 0.03%, 0.59%, and 6.87% in 2010, respectively. Compared to the period from 1978 to 1998, the area classed as improvement grade erosion increased by about 47,210.18 km2 from 1998 to 2010, while the area classed as deterioration grade erosion decreased by about 17,738.29 km2. Almost all severe erosion regions fall in the 1st and 2nd conservation priority levels, which areas accounted for 3.86% and 1.11% of the study area in the two periods, respectively. This study identified regions where soil erosion control is required and the results provide a reference for policymakers to implement soil conservation measures in the future.
ZHAO Haigen , TANG Yuyu , YANG Shengtian . Dynamic identification of soil erosion risk in the middle reaches of the Yellow River Basin in China from 1978 to 2010[J]. Journal of Geographical Sciences, 2018 , 28(2) : 175 -192 . DOI: 10.1007/s11442-018-1466-0
Figure 1 Location of the study area |
Table 1 Details of the remote sensing images in this study |
| Name | Resolution (m) | Acquired time | Acquired department |
|---|---|---|---|
| Landsat-MSS | 56 | July to September, 1978 | NASA of the US |
| Landsat-TM | 30 | July to September, 1998 | NASA of the US |
| HJ-CCD | 32 | July to September, 2010 | China Center for Resources Satellite Data and Application |
| KH-11 | 3 | July to September, 1978 | NASA of the US |
| ZY3-CCD | 2.1 | July to September, 2012 | China Center for Resources Satellite Data and Application |
| SPOT4 | 10 | July to September, 1998 | Yellow River Conservancy Commission in China |
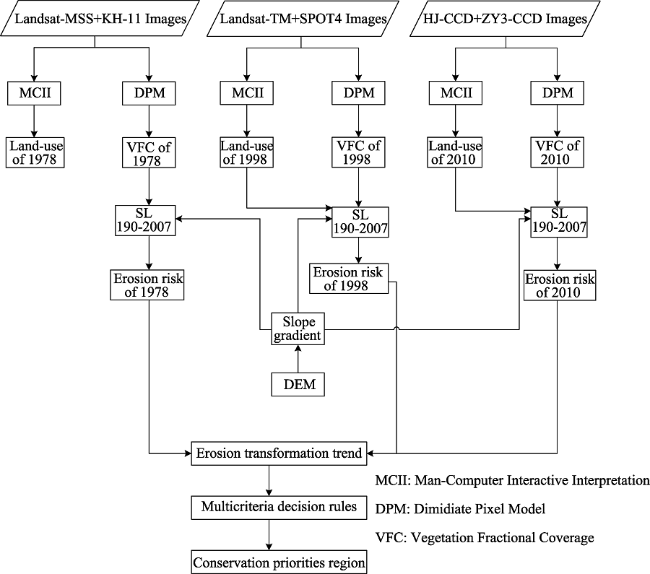
Figure 2 Flowchart of general methodology |
Table 2 Standards for the classification and gradation of soil erosion risk |
| Ground cover | VFC (%) | Slope (º) | |||||
|---|---|---|---|---|---|---|---|
| < 5 | 5-8 | 8-15 | 15-25 | 25-35 | > 35 | ||
| Non-farmland | >75 | Slight | Slight | Slight | Slight | Slight | Slight |
| 60-75 | Slight | Light | Light | Light | Moderate | Moderate | |
| 45-60 | Slight | Light | Light | Moderate | Moderate | Severe | |
| 30-45 | Slight | Light | Moderate | Moderate | Severe | More severe | |
| <30 | Slight | Moderate | Moderate | Severe | More severe | Extremely severe | |
| Farmland | Slight | Light | Moderate | Severe | More severe | Extremely severe | |
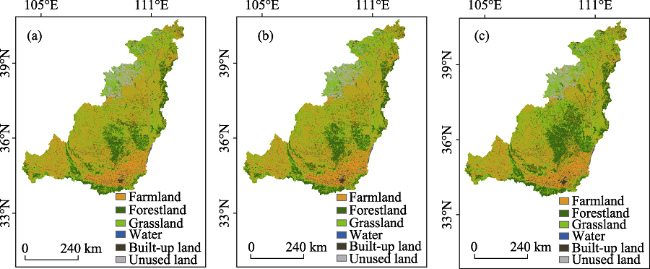
Figure 3 Land-use maps in the study area in 1978 (a), 1998 (b), and 2010 (c) |
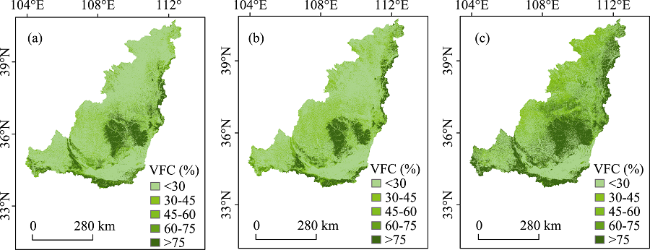
Figure 4 Vegetation fractional coverage (VFC) maps in the study area in 1978 (a), 1998 (b) and 2010 (c) |
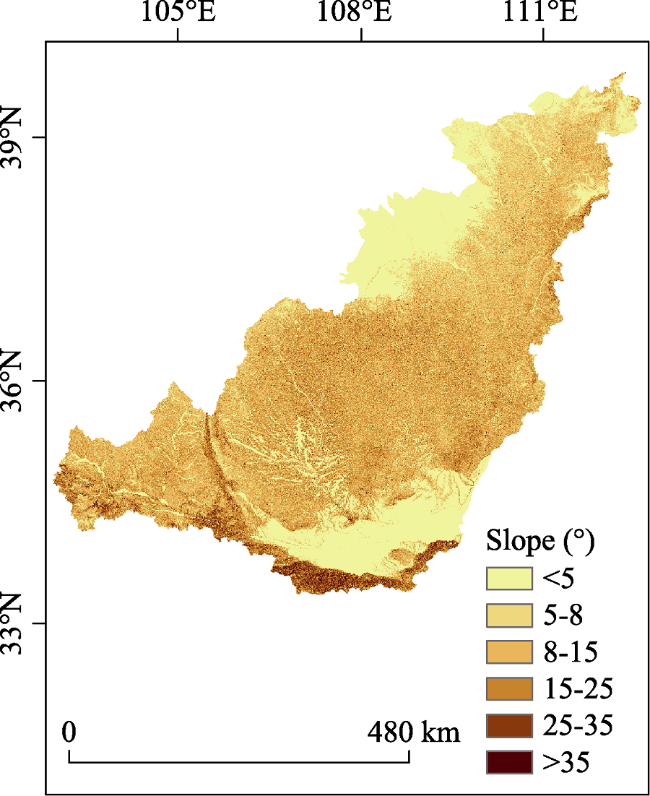
Figure 5 Ranks of slope gradient in the study area |
Table 3 Proportions of different classes of VFC in the study area from 1978 to 2010 (%) |
| Proportion (%) | 1978 | 1998 | 2010 |
|---|---|---|---|
| <30 | 62.23 | 57.28 | 39.94 |
| 30-45 | 10.30 | 17.08 | 9.20 |
| 45-60 | 7.45 | 7.83 | 12.50 |
| 60-75 | 6.16 | 5.43 | 12.01 |
| >75 | 13.86 | 12.38 | 26.35 |
Table 4 Proportions of different land-use types in the study area from 1980 to 2010 (%) |
| Land use type | 1980 | 1998 | 2010 |
|---|---|---|---|
| Farmland | 38.57 | 37.42 | 33.52 |
| Forestland | 15.85 | 16.70 | 21.65 |
| Grassland | 39.22 | 39.49 | 38.61 |
| Water | 0.93 | 0.93 | 0.59 |
| Built-up land | 2.01 | 2.22 | 2.34 |
| Unused land | 3.42 | 3.24 | 3.29 |
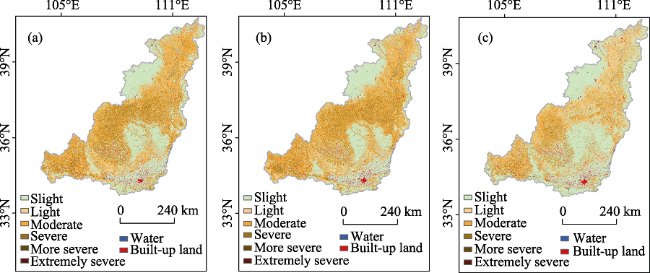
Figure 6 Soil erosion risk grades in the study area in 1978 (a), 1998 (b), and 2010 (c) |
Table 5 Distributions of soil erosion risk grades in the study area in 1978, 1998, and 2010 |
| Erosion risk grade | Erosion risk in 1978 | Erosion risk in 1998 | Erosion risk in 2010 | |||
|---|---|---|---|---|---|---|
| Area (km2) | Proportion (%) | Area (km2) | Proportion (%) | Area (km2) | Proportion (%) | |
| Slight | 105516.21 | 42.22 | 103337.17 | 41.35 | 132991.81 | 53.21 |
| Light | 34582.84 | 13.84 | 36547.61 | 14.62 | 56912.95 | 22.77 |
| Moderate | 79221.49 | 31.70 | 82230.37 | 32.90 | 41308.32 | 16.53 |
| Severe | 28114.40 | 11.25 | 25683.34 | 10.28 | 17157.76 | 6.87 |
| More severe | 2356.23 | 0.94 | 2033.02 | 0.81 | 1472.78 | 0.59 |
| Extremely severe | 129.89 | 0.05 | 89.55 | 0.04 | 77.42 | 0.03 |
Table 6 Proportion of transformation for each erosion grade in the study area between 1978 and 1998 |
| Erosion grade in 1998 (%) | |||||||
|---|---|---|---|---|---|---|---|
| Slight | Light | Moderate | Severe | More severe | Extremely severe | ||
| Erosion grade in 1978 (%) | Slight | 35.30 | 2.06 | 1.72 | 0.20 | 0.02 | 0.002 |
| Light | 1.70 | 8.85 | 3.14 | 0.14 | 0 | 0 | |
| Moderate | 1.20 | 3.58 | 25.91 | 0.96 | 0.05 | 0.001 | |
| Severe | 0.16 | 0.13 | 2.07 | 8.84 | 0.05 | 0.001 | |
| More severe | 0.04 | 0 | 0.07 | 0.14 | 0.70 | 0.002 | |
| Extremely severe | 0.01 | 0 | 0.004 | 0.003 | 0.002 | 0.03 | |
Table 7 Proportion of transformation for each erosion grade in the study area between 1998 and 2010 |
| Erosion grade in 2010 (%) | |||||||
|---|---|---|---|---|---|---|---|
| Slight | Light | Moderate | Severe | More severe | Extremely severe | ||
| Erosion grade in 1998 (%) | Slight | 38.06 | 0.35 | 0.13 | 0.07 | 0.02 | 0.004 |
| Light | 4.66 | 8.78 | 0.29 | 0.05 | 0 | 0 | |
| Moderate | 5.86 | 12.74 | 14.38 | 0.25 | 0.03 | 0.003 | |
| Severe | 0.97 | 1.15 | 1.72 | 6.51 | 0.02 | 0.001 | |
| More severe | 0.08 | 0 | 0.17 | 0.05 | 0.52 | 0.001 | |
| Extremely severe | 0.010 | 0 | 0.001 | 0.002 | 0.001 | 0.02 | |
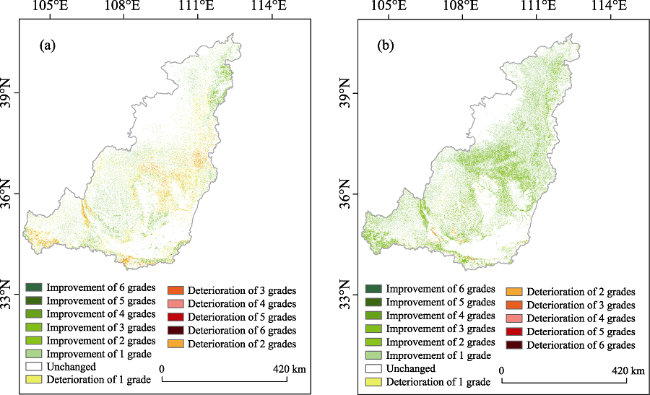
Figure 7 Changes in erosion risk grades in the study area from 1978 to 1998 (a) and from 1998 to 2010 (b) |
Table 8 Deterioration and improvement in erosion grades in the study area between 1980 and 2010 |
| Erosion grade variation | 1978 to 1998 | 1998 to 2010 | ||
|---|---|---|---|---|
| Area (km2) | Proportion (%) | Area (km2) | Proportion (%) | |
| Deterioration of 1 grade | 15508.13 | 6.21 | 2303.26 | 0.92 |
| Deterioration of 2 grades | 4780.16 | 1.91 | 534.25 | 0.21 |
| Deterioration of 3 grades | 491.20 | 0.20 | 193.21 | 0.08 |
| Deterioration of 4 grades | 51.78 | 0.02 | 56.92 | 0.02 |
| Deterioration of 5 grades | 4.50 | 0.002 | 9.83 | 0.004 |
| Improvement of 1 grade | 19141.65 | 7.66 | 50004.85 | 20.01 |
| Improvement of 2 grades | 3481.08 | 1.39 | 17731.47 | 7.09 |
| Improvement of 3 grades | 445.28 | 0.18 | 2463.94 | 0.99 |
| Improvement of 4 grades | 116.81 | 0.05 | 206.87 | 0.08 |
| Improvement of 5 grades | 36.21 | 0.01 | 24.08 | 0.01 |
| Summation of deterioration grades | 20835.77 | 8.34 | 3097.48 | 1.23 |
| Summation of improvement grades | 23221.03 | 9.29 | 70431.21 | 28.18 |
Table 9 Multi-criteria decision rules for identifying conservation priorities |
| Erosion grade in the next period | |||||||
|---|---|---|---|---|---|---|---|
| Slight | Light | Moderate | Severe | More severe | Extremely severe | ||
| Erosion grade in the previous period | Slight | Ⅳ | Ⅳ | Ⅱ | Ⅰ | Ⅰ | Ⅰ |
| Light | Ⅳ | Ⅳ | Ⅲ | Ⅱ | Ⅰ | Ⅰ | |
| Moderate | Ⅳ | Ⅴ | Ⅲ | Ⅱ | Ⅱ | Ⅰ | |
| Severe | Ⅳ | Ⅴ | Ⅳ | Ⅲ | Ⅱ | Ⅰ | |
| More severe | Ⅳ | Ⅴ | Ⅳ | Ⅲ | Ⅱ | Ⅰ | |
| Extremely severe | Ⅳ | Ⅵ | Ⅴ | Ⅳ | Ⅲ | Ⅰ | |
Table 10 Area and proportion of each priority level in the study area |
| Priority level | 1978 to 1998 | 1998 to 2010 | ||
|---|---|---|---|---|
| Area (km2) | Proportion (%) | Area (km2) | Proportion (%) | |
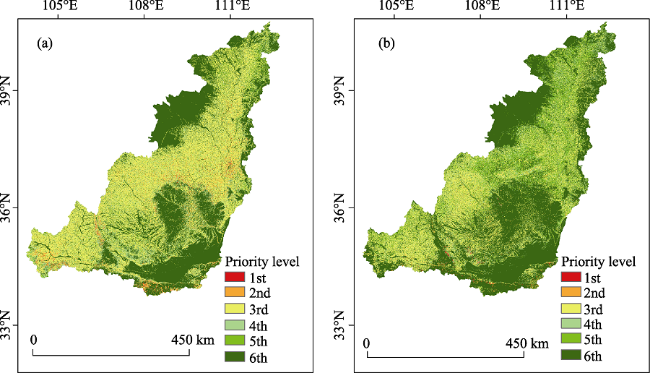
| 1st level | 627.06 | 0.25 | 298.80 | 0.12 |
| 2nd level | 9023.28 | 3.61 | 2464.15 | 0.99 |
| 3rd level | 95046.16 | 38.03 | 52536.04 | 21.02 |
| 4th level | 32618.80 | 13.05 | 27296.90 | 10.92 |
| 5th level | 9280.42 | 3.71 | 34332.97 | 13.74 |
| 6th level | 103325.32 | 41.34 | 132992.19 | 53.21 |
Figure 8 Maps showing the distributions of conservation priority levels in the study area from 1978 to 1998 (a) and from 1998 to 2010 (b) |
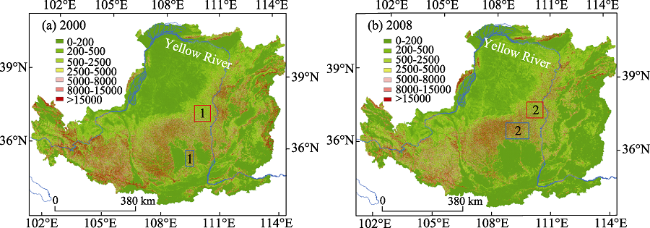
Figure 9 Spatial distributions of estimated soil loss (t km-2 yr-1) in the study area in 2000 (a) and 2008 (b) (Fu et al., 2011) |
The authors have declared that no competing interests exist.
| [1] |
|
| [2] |
|
| [3] |
|
| [4] |
|
| [5] |
|
| [6] |
|
| [7] |
|
| [8] |
|
| [9] |
|
| [10] |
|
| [11] |
|
| [12] |
|
| [13] |
|
| [14] |
|
| [15] |
|
| [16] |
|
| [17] |
|
| [18] |
|
| [19] |
|
| [20] |
|
| [21] |
|
| [22] |
|
| [23] |
|
| [24] |
|
| [25] |
|
| [26] |
|
| [27] |
|
| [28] |
|
| [29] |
|
| [30] |
|
| [31] |
|
| [32] |
MWRC (Ministry of Water Resources of China), 1997. National Professional Standards for Classification and Gradation of Soil Erosion, SL 190-1996. Beijing, China. (in Chinese)
|
| [33] |
MWRC (Ministry of Water Resources of China), 2008. SL190-2007: Standards for Classification and Gradation of Soil Erosion. Beijing, China: Water Resources & Hydropower Press of China. (in Chinese)
|
| [34] |
|
| [35] |
|
| [36] |
|
| [37] |
|
| [38] |
|
| [39] |
|
| [40] |
|
| [41] |
|
| [42] |
|
| [43] |
|
| [44] |
|
| [45] |
|
| [46] |
|
| [47] |
|
| [48] |
|
| [49] |
|
| [50] |
|
| [51] |
|
| [52] |
|
| [53] |
|
| [54] |
|
| [55] |
|
| [56] |
|
| [57] |
|
| [58] |
|
| [59] |
|
| [60] |
|
/
| 〈 |
|
〉 |