
Journal of Geographical Sciences >
The vulnerability evolution and simulation of social-ecological systems in a semi-arid area: A case study of Yulin City, China
Author: Chen Jia, PhD Candidate, specialized in social-ecological system and regional sustainable development E-mail: dongdongbj2010@126.com
Corresponding author: Yang Xinjun, Professor, E-mail: yangxj@nwu.edu.cn
Received date: 2017-06-16
Accepted date: 2017-07-30
Online published: 2018-02-10
Supported by
National Natural Science Foundation of China, No.41571163
Northwest University Doctorate Dissertation of Excellence Funds, No.YYB17016
Copyright
Taking the semi-arid area of Yulin City as an example, this study improves the vulnerability assessment methods and techniques at the county scale using the VSD (Vulnerability Scoping Diagram) assessment framework, integrates the VSD framework and the SERV (Spatially Explicit Resilience-Vulnerability) model, and decomposes the system vulnerability into three dimensions, i.e., exposure, sensitivity and adaptive capacity. Firstly, with the full understanding of the background and exposure risk source of the research area, the vulnerability indexes were screened by the SERV model, and the index system was constructed to assess the characteristics of the local eco-environment. Secondly, with the aid of RS and GIS, this study measured the spatial differentiation and evolution of the social-ecological systems in Yulin City during 2000-2015 and explored intrinsic reasons for the spatial-temporal evolution of vulnerability. The results are as follows: (1) The spatial pattern of Yulin City’s SESs vulnerability is “high in northwest and southeast and low along the Great Wall”. Although the degree of system vulnerability decreased significantly during the study period and the system development trend improved, there is a sharp spatial difference between the system vulnerability and exposure risk. (2) The evolution of system vulnerability is influenced by the risk factors of exposure, and the regional vulnerability and the spatial heterogeneity of exposure risk are affected by the social sensitivity, economic adaptive capacity and other factors. Finally, according to the uncertainty of decision makers, the future scenarios of regional vulnerability are simulated under different decision risks by taking advantage of the OWA multi-criteria algorithm, and the vulnerability of the regional system under different development directions was predicted based on the decision makers' rational risk interval.
CHEN Jia , YANG Xinjun , YIN Sha , WU Kongsen , DENG Mengqi , WEN Xin . The vulnerability evolution and simulation of social-ecological systems in a semi-arid area: A case study of Yulin City, China[J]. Journal of Geographical Sciences, 2018 , 28(2) : 152 -174 . DOI: 10.1007/s11442-018-1465-1
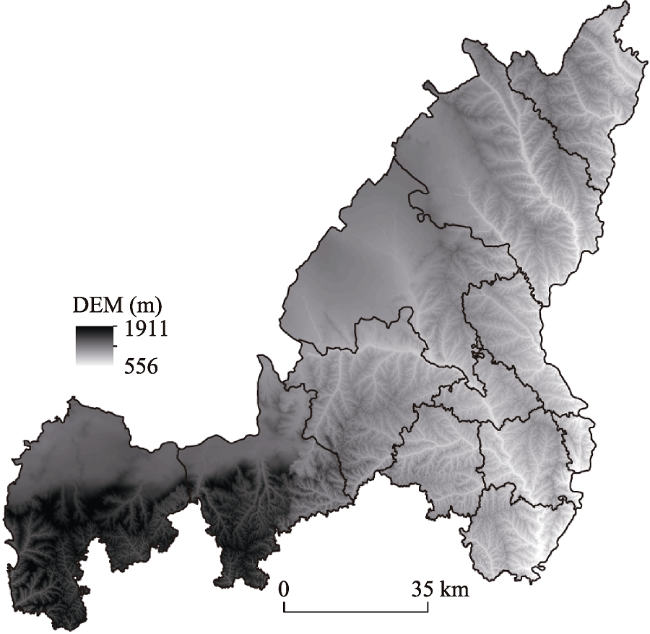
Figure 1 Location of the study area (Yulin City, Shaanxi Province, China) |
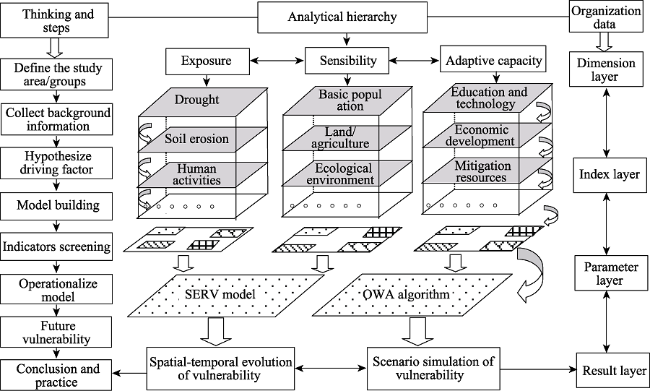
Figure 2 Ideas and methods of regional vulnerability assessment under the framework of VSD |
Table 1 Index system of exposure risk assessment |
| Dimension layer | Element type | Index layer | Weight | Indicator description and calculation |
|---|---|---|---|---|
| Exposure | Drought (0.4126) | Standardized precipitation index (SPI) | 0.2751 | SPI-SRI drought state model, combining the meteorological and horological drought indexes, adopting 12 months of data to reflect periodic changes in the river water level and reservoir |
| Standardized runoff index (SRI) | 0.1375 | |||
| Soil erosion (0.3275) | Rainfall erosion (R) | 0.0345 | Universal soil loss equation (USLE): A=R×K×LS×C×P A: Soil loss volume; R: Rainfall erosion; K: Soil erodibility; LS: Length of slope; C: Crop cover and management; P: Soil and water conservation measures | |
| Soil erodibility (K) | 0.0629 | |||
| Length of slope (LS) | 0.0307 | |||
| Crop cover and management (C) | 0.0900 | |||
| Soil and water conservation measures (P) | 0.1095 | |||
| Human activities (0.2599) | Urbanization rate (UB) | 0.1049 | Calculation formula of comprehensive land use intensity (Wang et al., 2006): . .Lx: Comprehensive index of land use degree in the xth sample; Ai: Classification index of land use grade i; Si: Land use area of grade i; S: Total land area of the sample area | |
| Land use intensity (LD) | 0.1550 |
Notes: (1) Drought, soil erosion and human activity indicators are positively related to exposure. (2) SPI and SRI were calculated by standardized precipitation index (SPI) formula from water regime of hydrology and water resources bureau of Yunnan province. (3) Precipitation erosion force factor (R), soil erodibility factor (K), and slope length factor (LS) data were from the National Earth System Science Data Sharing Infrastructure, and the data layer was generated via the spatial matching process. (4) Crop coverage and management factors (C) were estimated via the functional relationship between vegetation coverage N and vegetation coverage factor C: C=0.6508-0.3436lgN. (5) By integrating the results of Hu Wenmin and Cai Chongfa and combining practical land use status in the study area to determine the values for the soil and water conservation measures factor (p), the p values of different land use types were determined. |
Table 2 Screening results of the sensitivity/adaptive capacity index |
| Dimension layer | Principal component factor | Universal index | Index properties | Specific index | Index pro- perties | ||||||||||
|---|---|---|---|---|---|---|---|---|---|---|---|---|---|---|---|
| Sensi- tivity | Basic population principal component | The proportion of female population (%) The proportion of agricultural population (%) The proportion of employed population of agriculture, forestry, animal husbandry and fishery (%) Natural population growth rate (‰) The average education level of labor (years) Population density (people/km2) | + * - + - + | The number of employees employed in extractive industry (people) | * | ||||||||||
| Agriculture and land principal component | The proportion of cultivated land area (%) The proportion of paddy field/irrigated land area (%) The growth rate of housing construction area (%) The proportion of abandoned cultivated land area due to disasters (%) Grain yield per unit area (ha/kg) | * * + + - | Aquaculture area (ha) Main cash crop yield (Chinese jujube etc.) (tons) | * - | |||||||||||
| Ecology and environment principal component | Forest coverage (%) The proportion of effective irrigation area (%) Area of forest for water and soil conservation (103 ha) Total energy consumption (tons of standard coal) | - - - * | Total emission of industrial waste/waste water (104 tons) | + | |||||||||||
| Economic development principal component | Per capita gross domestic product (yuan) The proportion of total value of output of agriculture, forestry, animal husbandry and fishery (%) Industrial structure dependence index Engel’s coefficient Comprehensive energy consumption per unit GDP (10,000 yuan/ tons of standard coal) | - - + + + | Industrial water consumption per unit GDP (tons/104 yuan) | + | |||||||||||
| Adaptive capacity | Education and technology principal component | The number of teachers of per ten thousand people possessed (people/10,000 people) The proportion of students on campus (%) The number of communications equipment per 100 households (telephone/100 households) Comprehensive utilization of product output value of “three wastes” (104 yuan) The proportion of fiscal expenditure on education (%) | + + + + + | The attainment rate of the industrial wastewater (%) Water saving irrigation machinery (suits)/drainage and irrigation power machinery (kw) | + + | ||||||||||
| Social infrastructure principal component | The number of medical beds of per ten thousand people possessed (people/10,000 people) The number of health service employees (people) Fiscal expenditure on water affairs of agriculture and forestry (104 yuan) Social security expenditure per capita (104 yuan/10,000 people) The number of employees of transportation, storage and postal service (people) | + + + + + | / | ||||||||||||
| Population and economy principal component | Per capita net income of farmers (yuan) The density of social fixed assets investment (104 yuan/ km2) The total output value of agriculture, forestry, animal husbandry and fishery (104 yuan) The third industrial added value accounted for the proportion of GDP (%) Local fiscal expenditure (104 yuan) Industrial structure diversification index | + + + + + + | / | ||||||||||||
| Dimension layer | Principal component factor | Universal index | Index properties | Specific index | Index properties | ||||||||||
| Adaptive capacity | Disaster prevention and mitigation facilities principal component | Reservoir capacity (104 m3) The density of drought resistant infrastructure (number/km2) Afforestation area in the year (ha) The area of forest for water and soil conservation (1000 ha) | + + + + | Dike length (km) | + | ||||||||||
| Results of sensitivity principal component | Results of adaptive capacity principal component | ||||||||||||||
| Years | 2000 | 2005 | 2011 | Years | 2000 | 2005 | 2011 | ||||||||
| Minimum eigenvalue | 1.070 | 1.139 | 1.330 | Minimum eigenvalue | 1.202 | 1.062 | 1.351 | ||||||||
| Cumulative contribution rate | 91.94% | 90.75% | 89.99% | Cumulative contribution rate | 88.30% | 89.53% | 88.75% | ||||||||
Notes: (1) Sensitivity and adaptive capacity: these two dimensions have no influence on each other. The detailed results of principal component analysis in each year are not listed here separately. “+” indicates that the indexes and the sensitivity or the adaptive capacity are positively correlated. “-” indicates that the indexes and the sensitivity or the adaptive capacity are negatively correlated. “*” indicates a moderate index, in which a certain value of the index value is the best. The moderate value is calculated from the standard mean value of indexes of each year in the study area. (2) The index system of the dimension of sensitivity and adaptive capacity is composed of universal indexes and specific indexes. Among them, the universal index is suitable for index factors of the whole region and the specific index reflects the index factor satisfying the actual habitat of each county. (3) The minimum eigenvalue means that principal component analysis of the index system in this year was used to extract the principal components with minimum eigenvalues. In Table 2, all the minimum eigenvalues are greater than 1, and the cumulative contribution rate is greater than 85%, indicating that the extraction of the principal components is representative. |
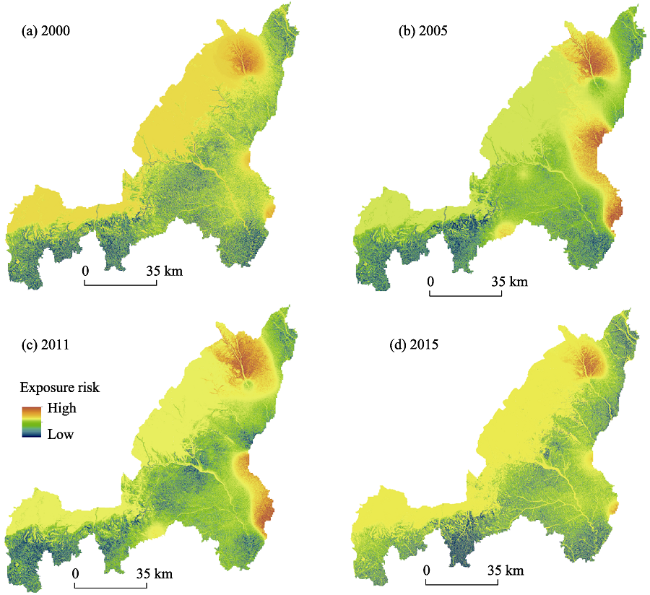
Figure 3 The spatial framework of exposure risk in Yulin City during 2000-2015 |
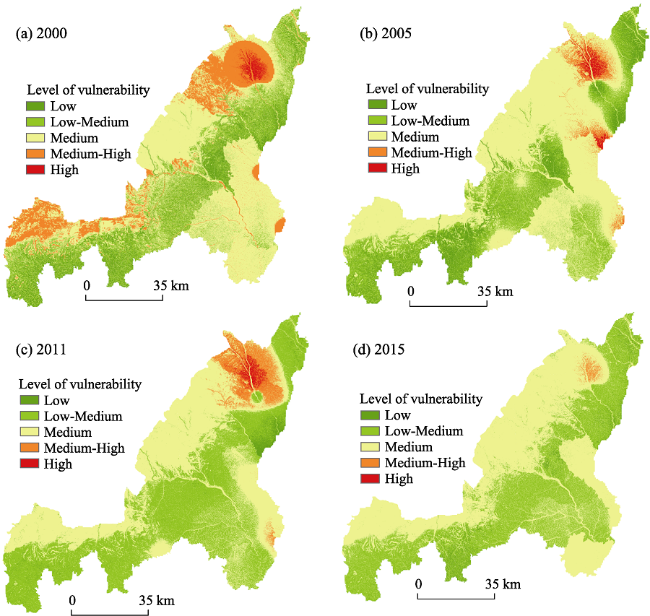
Figure 4 Spatial-temporal distribution of the vulnerability of social-ecological systems (SESs) in Yulin City during 2000-2015 |
Table 3 Classification of social-ecological system vulnerability in the study area during 2000-2015 |
| Year / Type | High vulnerability | Medium-high vulnerability | Medium vulnerability | Low-medium vulnerability | Low vulnerability | Above medium vulnerability | |
|---|---|---|---|---|---|---|---|
| 2000 | Proportion/% | 1.098 | 16.116 | 49.373 | 21.459 | 11.951 | 66.587 |
| Area/km2 | 478.836 | 7023.390 | 21515.901 | 9351.638 | 5208.232 | 29018.127 | |
| 2005 | Proportion/% | 1.791 | 2.679 | 57.833 | 25.471 | 12.224 | 62.303 |
| Area/km2 | 780.551 | 1167.519 | 25202.816 | 11099.949 | 5327.163 | 27150.886 | |
| 2011 | Proportion/% | 1.460 | 5.644 | 44.871 | 45.863 | 2.160 | 51.975 |
| Area/km2 | 636.319 | 2459.650 | 19553.933 | 19986.428 | 941.6683 | 22649.902 | |
| 2015 | Proportion/% | 0.0009 | 0.563 | 56.540 | 39.800 | 2.997 | 57.103 |
| Area/km2 | 0.414 | 245.344 | 24682.578 | 17344.043 | 1306.033 | 24928.336 | |
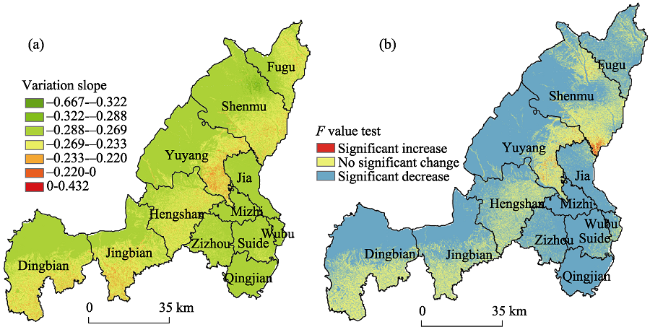
Figure 5 SES vulnerability variation trend (a) and F test (b) in Yulin City during 2000-2015 |
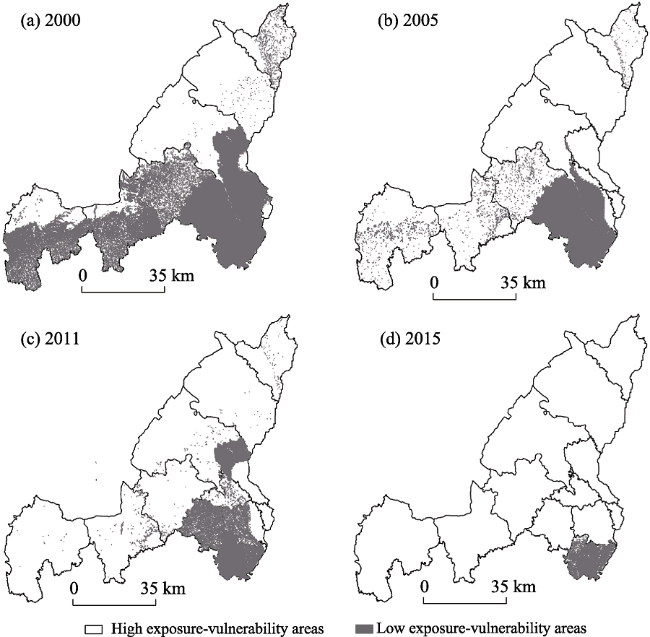
Figure 6 The spatial heterogeneity of SESs vulnerability and exposure risk in Yulin City during 2000-2015 |
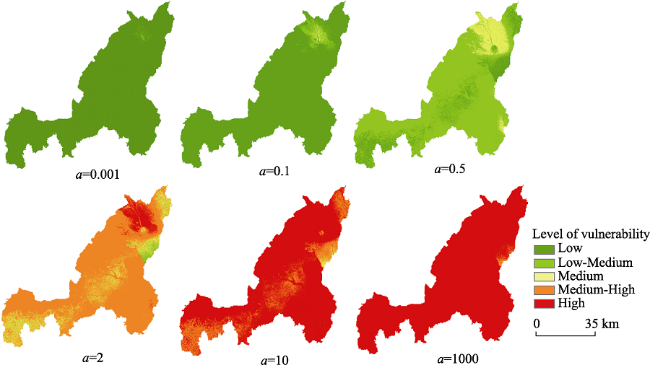
Figure 7 The simulation results of the vulnerability of social-ecological systems (SESs) in decision-making risk |
Table 4 Results of the ordered weight |
| Decision risk coefficient Decision-maker's risk attitude | a=0.0001 Extremely optimistic | a=0.1 Optimistic | a=0.5 Relatively optimistic | a=1 Unbiased representation | a=2 Relatively pessimistic | a=10 Pessimistic | a=1000 Extremely pessimistic | |
|---|---|---|---|---|---|---|---|---|
| OWA Order weight | Environment and technology | 1.000 | 0.786 | 0.301 | 0.090 | 0.008 | 0.000 | 0.000 |
| Social resources | 0.000 | 0.056 | 0.124 | 0.090 | 0.024 | 0.000 | 0.000 | |
| Economic development | 0.000 | 0.034 | 0.095 | 0.090 | 0.041 | 0.000 | 0.000 | |
| Disaster prevention and mitigation resources | 0.000 | 0.025 | 0.080 | 0.090 | 0.057 | 0.000 | 0.000 | |
| Basic population | 0.000 | 0.020 | 0.071 | 0.090 | 0.074 | 0.000 | 0.000 | |
| Land and agriculture | 0.000 | 0.017 | 0.064 | 0.090 | 0.090 | 0.002 | 0.000 | |
| Ecosystem | 0.000 | 0.014 | 0.059 | 0.090 | 0.107 | 0.008 | 0.000 | |
| Economic resources | 0.000 | 0.012 | 0.055 | 0.090 | 0.124 | 0.030 | 0.000 | |
| Drought | 0.000 | 0.011 | 0.051 | 0.090 | 0.140 | 0.093 | 0.000 | |
| Soil erosion | 0.000 | 0.010 | 0.048 | 0.090 | 0.157 | 0.251 | 0.000 | |
| Human activity | 0.000 | 0.009 | 0.046 | 0.090 | 0.173 | 0.614 | 1.000 | |
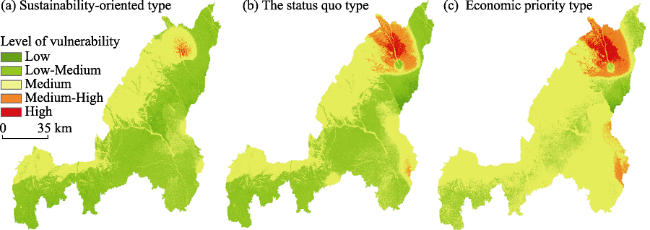
Figure 8 The SESs vulnerability spatial distribution of different scenarios simulation in Yulin city |
The authors have declared that no competing interests exist.
| [1] |
|
| [2] |
|
| [3] |
|
| [4] |
|
| [5] |
|
| [6] |
|
| [7] |
|
| [8] |
|
| [9] |
|
| [10] |
|
| [11] |
|
| [12] |
|
| [13] |
|
| [14] |
IPCC, 2014. Climate Change 2014. Impacts, adaptation, and vulnerability Part B: Regional aspects. In: Working Group II Contribution to the Fifth Assessment Report of the Intergovernmental Panel on Climate Change. Cambridge: Cambridge University Press.
|
| [15] |
|
| [16] |
|
| [17] |
|
| [18] |
|
| [19] |
|
| [20] |
|
| [21] |
|
| [22] |
|
| [23] |
|
| [24] |
|
| [25] |
|
| [26] |
|
| [27] |
|
| [28] |
|
| [29] |
|
| [30] |
|
| [31] |
|
| [32] |
|
| [33] |
|
| [34] |
|
| [35] |
|
| [36] |
|
| [37] |
|
| [38] |
|
| [39] |
|
| [40] |
|
| [41] |
|
| [42] |
|
| [43] |
|
| [44] |
|
| [45] |
|
/
| 〈 |
|
〉 |