
Journal of Geographical Sciences >
Optimizing the spatial organization of rural settlements based on life quality
Author: Tang Chengli (1964-), Professor, specialized in human geography and regional development.
E-mail: tclxy68@163.com
Received date: 2017-09-15
Accepted date: 2017-10-20
Online published: 2018-03-30
Supported by
National Natural Science Foundation of China, No.41471145
National Social Science Foundation of China, No.41201169
The Key Discipline of Hunan Province Geography Construction Project, No.2011001
Copyright
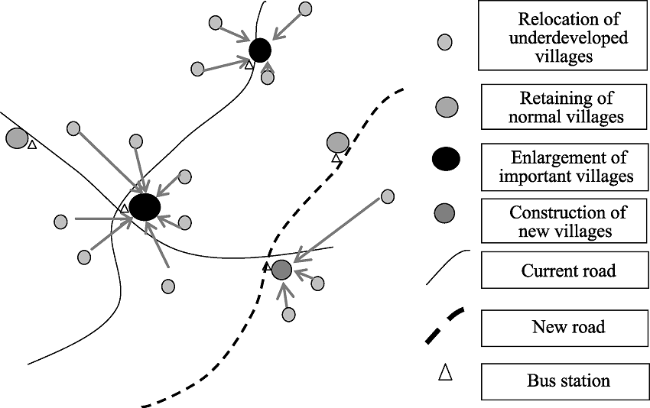
Optimizing rural settlements is an important measure to cope with rural decline, and improve the quality of rural life and attractions. This study introduces the "life quality theory". Based on the mechanisms governing the interactions between rural settlement space and life quality, this study examines how to optimize the spatial organization of rural settlements. Three aspects are evaluated - the integration of rural settlement spatial functions, optimization of spatial structure, and regulation of spatial scale - with the objective of building an optimization mode and framework for the spatial organization of rural settlements with high life quality. Our results suggest the following: (1) The settlement is the spatial carrier of life quality, which is an essential settlement component, and these two aspects influence and improve each other. Therefore, reasonable rural settlement space is an important precondition for higher life quality. (2) The spatial function types of rural settlements can be divided into those that maintain livelihoods, develop industry, and upgrade life quality. Optimizing spatial organization of rural settlements based on life quality requires promoting the maintenance of livelihood, integration of industrial development, and implantation in quality improvement. (3) There are two important components of optimizing the spatial organization of rural settlements. One is promoting the organic concentration of living, agricultural, and industrial spaces, the reasonable distribution of social intercourse, recreational, and services spaces, and the organic balance of living, production, and ecological spaces, so as to reasonably optimize the combination of internal spatial types in settlements. The other is forming a functional structure level of a “comprehensive village-featured village” and building spatial organization settlement modes connected by rural roads by relocating and adjusting the function of villages. These changes would require the destruction of underdeveloped villages, retaining normal villages, enlarging important villages, and constructing new villages. (4) As an ideal mode for optimizing rural settlements space based on life quality, the Rural Road-Oriented Development Model (RROD model) should be built at a rational scale for unit settlement and distance between settlements, leading to a fully functional RROD system with rational structure, auxiliary facility, and well-organized distribution.
Key words: rural settlement; life quality; spatial optimization; RROD model
TANG Chengli , HE Yanhua , ZHOU Guohua , ZENG Shanshan , XIAO Luyao . Optimizing the spatial organization of rural settlements based on life quality[J]. Journal of Geographical Sciences, 2018 , 28(5) : 685 -704 . DOI: 10.1007/s11442-018-1499-4
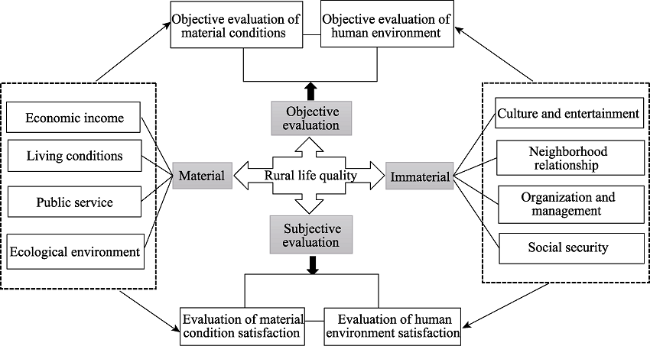
Figure 1 “MIOS” evaluation framework for rural life quality |
Table 1 The objective index values of the quality of national rural life evaluation in 2015 |
| Index | Index value | Index | Index value |
|---|---|---|---|
| Rural per capita net income (yuan/person) | 10772 | Cumulative rate of return to water in rural areas (%) | 98.5 |
| Engel’s Coefficient (%) | 37.1 | Average number of elderly welfare agencies per township | 0.81 |
| Rural per capita steel brick structure (m2/person) | 33.4 | Rate of rural residents participating in new rural cooperative medical system (%) | 98.8 |
| Compulsory student-teacher ratio | 14.0 | Prevalence rate of sanitary toilet (%) | 78.4 |
| Average number of technical training schools for each township | 2.26 | Expenditure on cultural and educational entertainment (%) | 10.5 |
| Rural access roads proportion of administrative village (%) | 95.5 | Average number of comprehensive cultural stations per township | 0.86 |
| Number of rural doctors and health workers per thousand agricultural population | 1.47 |
Sources: Rural Statistical Yearbook of China in 2016, China Statistical Yearbook in 2016, and Bulletin of Statistics on the Development of Health and Family Planning Undertakings in China in 2015. “Rural per capita steel brick structure”, “average number of technical training schools for each township”, “average number of elderly welfare agencies per township” are from the statistical data of 2012, “the cumulative rate of return to water in rural areas” is from 2014, and “rural access roads proportion of administrative village” is from the second agricultural census data (2006). |
Table 2 Research and results on the satisfaction of rural life quality |
| Research | Study area | Research time | Main findings | ||
|---|---|---|---|---|---|
| Ren et al., (2006) | Chengdu | 2005 | In the reform of household registration system, living conditions, road traffic facilities, and ecological environment are rated as having high public satisfaction, up to 40%. However, satisfaction is low in terms of per capita income, industrial development, and employment and social security, the proportion of general satisfaction being 54%, 48%, and 40%, respectively. For the policy system and medical insurance, dissatisfaction reached more than 30%. | ||
| Zhang and Pan (2008) | Anhui | 2008 | Farmers are not satisfied with rural production and living conditions, highlighting that despite rural infrastructure construction has improved, development has been irregular. Rural cultural infrastructure has received fewer investments, and the rural financial system has little effect on rural economic and social development. Furthermore, rural environmental pollution has become a problem, and the prospects for farmland protection are poor. After 30 years of reform and opening-up, farmers’ income have been raised, but not significantly. | ||
| Zhu et al. (2009) | Ningxia | 2008 | Farmers’ life satisfaction in Yanchi County; more satisfied and very satisfied ratings account for 36%, unsatisfactory and quite unsatisfactory ratings account for 14%, and generally satisfied accounts for about 50% of the total survey. Farmer life satisfaction and income have a very significant correlation. | ||
| Li H et al. (2010) | Yunnan, Henan | 2010 | Farmer life satisfaction responses indicate general satisfaction, but lower-class groups have scores that are significantly lower than those of other groups in overall life satisfaction and each factor. | ||
| Zheng (2010) | Zhejiang | 2010 | First, under the premise of limited public financial resources, the total amount of public services in rural areas is low and per capita indicators are relatively low; therefore, the farmer satisfaction rates are not high. Second, constrained by input and output factors, the comprehensive efficiency of rural public service is low and effective supply is relatively inadequate. | ||
| Hu and Chen (2012) | Jiangsu | 2011 | The comprehensive score of rural resident satisfaction is 3.12, indicating general satisfaction, among which family satisfaction has the highest score (3.67) and economic status has the lowest score (2.09). The main factors that have a positive impact on improving the satisfaction of rural residents are interpersonal relationships and government public policy; however, economic status, work, and environment are important factors that lower life satisfaction. | ||
| Li W Y (2012) | Hubei | 2012 | Farmer satisfaction with rural public infrastructure is better than in other regions, but the proportion of very satisfactory responses is not high; reasons for poor responses are insufficient funds for investing in infrastructure, overlapping functions in agricultural institutions, low investment benefits, and poor investment quality. The primary role of farmers participating in construction is also unclear. | ||
| Li and Huang (2013) | Hubei | 2012 | Farmers have a high degree of satisfaction with power supply facilities, drinking water facilities, and transportation facilities, and are generally satisfied with information and communication facilities and with educational and medical facilities. The maintenance of infrastructure and construction of infrastructure, irrigation and irrigation facilities, waste water treatment facilities, and recreational facilities are ranked as having a low degree of satisfaction. | ||
| Li F et al. (2013) | Guangxi, Henan, Heilongjiang, Jiangxi, Ningxia, Sichuan, Gansu, Anhui, Yunnan, Shandong | 2013 | The proportion of farmer life satisfaction responses that are unsatisfactory and quite unsatisfactory is only 18%, whereas the proportion of more satisfactory and very satisfactory is 49%, indicating a generally high quality of life. The life satisfaction of poor households is lower than that of middle and affluent households in general. Higher life satisfaction is correlated with age of householder, health, housing area, types of consumer durables, road condition, village democracy, and social intercourse. Finally, farmer life satisfaction first increases and then decreases with increasing educational. | ||
| Zheng et al. (2017) | Jiangsu | 2014-2015 | Farmers show a high degree of satisfaction with their rural human settlement environment (infrastructure) and rural human settlement environment (natural environment), but they are less satisfied with the rural ecological environment and rural eco-economy. The farmer satisfaction scores are higher in electric power facilities, air quality, lifestyle, water facilities, garbage collection facilities, irrigation facilities, and greening status. Low satisfaction scores are in pond pollution treatment, industrial pollution treatment, fertilizer and pesticide pollution treatment, domestic sewage treatment, eco-industrial development, both human and poultry excrement treatment, eco-agriculture development, and ecological services development. | ||
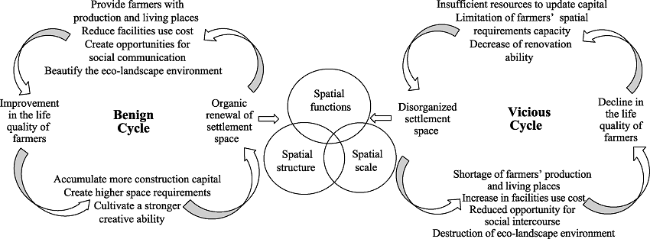
Figure 2 Two-way interactive mechanisms between rural settlement space and life quality |
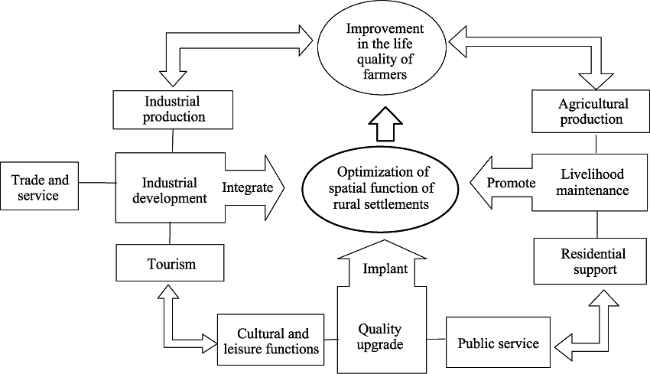
Figure 3 Integrated spatial function of rural settlements based on life quality |
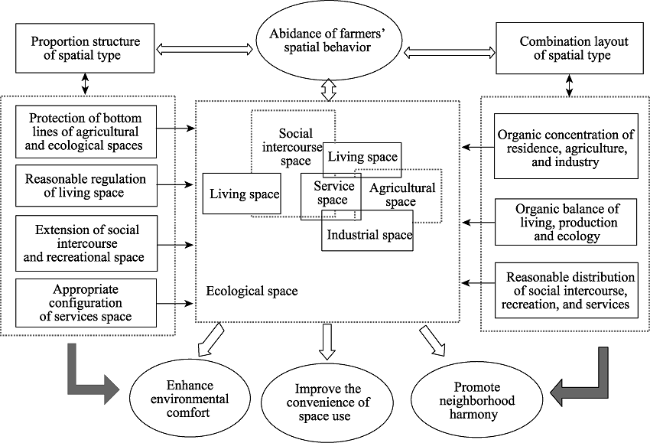
Figure 4 Optimizing the internal spatial organization of rural settlements based on life quality |
Figure 5 Optimizing the spatial organization of settlement system connected by rural roads |
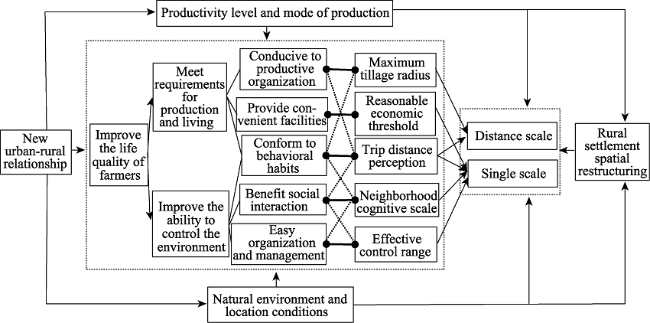
Figure 6 Diagram outlining the mechanisms influencing the spatial organization of rural settlements based on life quality |
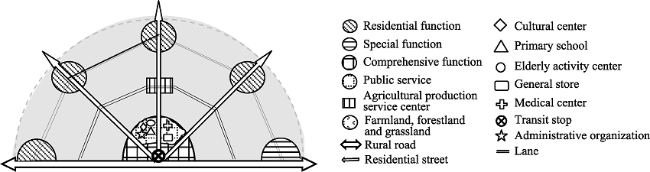
Figure 7 Diagram outlining the basic structure of a complete RROD unit |
Table 3 Parameter values for the RROD spatial scale in different landform areas |
| RROD scale | RROD distance (km) | ||
|---|---|---|---|
| Unite radius (m) | Population size (person) | ||
| Plain | 650-800 | 2000-3500 | 4.0-5.0 |
| Hilly | 450-700 | 2000-3000 | 3.5-4.5 |
| Mountain | 400-600 | 1500-2500 | 4.5-5.5 |
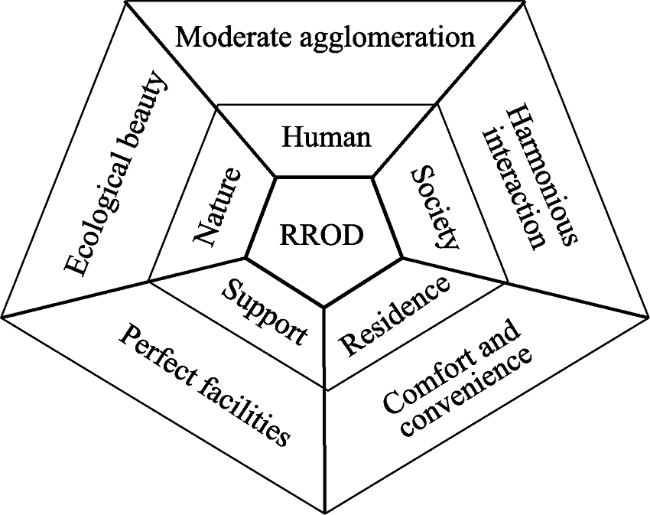
Figure 8 Diamond diagram of the “Five Collaborative Effect” around the RROD model to improve the quality of rural life |
The authors have declared that no competing interests exist.
| [1] |
|
| [2] |
|
| [3] |
|
| [4] |
|
| [5] |
|
| [6] |
|
| [7] |
|
| [8] |
|
| [9] |
|
| [10] |
|
| [11] |
|
| [12] |
|
| [13] |
|
| [14] |
|
| [15] |
|
| [16] |
|
| [17] |
|
| [18] |
|
| [19] |
|
| [20] |
|
| [21] |
|
| [22] |
|
| [23] |
|
| [24] |
|
| [25] |
|
| [26] |
|
| [27] |
|
| [28] |
|
| [29] |
|
| [30] |
|
| [31] |
|
| [32] |
|
| [33] |
|
| [34] |
|
| [35] |
|
| [36] |
|
| [37] |
|
| [38] |
|
| [39] |
|
| [40] |
|
| [41] |
|
| [42] |
|
| [43] |
|
| [44] |
|
| [45] |
|
| [46] |
|
| [47] |
|
| [48] |
|
| [49] |
|
| [50] |
|
| [51] |
|
| [52] |
|
| [53] |
|
| [54] |
|
| [55] |
|
| [56] |
|
| [57] |
|
| [58] |
|
| [59] |
|
| [60] |
|
| [61] |
|
| [62] |
|
| [63] |
|
| [64] |
|
| [65] |
|
| [66] |
|
| [67] |
|
| [68] |
|
| [69] |
|
| [70] |
|
| [71] |
|
| [72] |
|
| [73] |
|
| [74] |
|
| [75] |
|
| [76] |
|
| [77] |
|
| [78] |
|
| [79] |
|
| [80] |
|
| [81] |
|
| [82] |
|
| [83] |
|
| [84] |
|
| [85] |
|
| [86] |
|
| [87] |
|
| [88] |
|
| [89] |
|
| [90] |
|
| [91] |
|
| [92] |
|
| [93] |
|
| [94] |
|
| [95] |
|
| [96] |
|
| [97] |
|
/
| 〈 |
|
〉 |