Research Articles

Examining the distribution and dynamics of impervious surface in different function zones in Beijing

  • QIAO Kun , 1, 2, 3 ,
  • ZHU Wenquan 1, 2 ,
  • HU Deyong , 3 ,
  • HAO Ming 4 ,
  • CHEN Shanshan 3 ,
  • CAO Shisong 3
Expand

Author: Qiao Kun (1989-), PhD Candidate, specialized in remote sensing of resource and environment, remote sensing of vegetation. E-mail:

*Corresponding author: Hu Deyong (1974-), PhD and Professor, specialized in remote sensing of resource and environment, remote sensing monitoring of natural disasters. E-mail:

Received date: 2017-09-20

  Accepted date: 2017-10-30

  Online published: 2018-03-30

Supported by

The National Basic Research Program of China, No.2015CB953603

National Natural Science Foundation of China, No.41671339

State Key Laboratory of Earth Surface Processes and Resource Ecology, No.2017- FX-01(1)

Copyright

Journal of Geographical Sciences, All Rights Reserved

Abstract

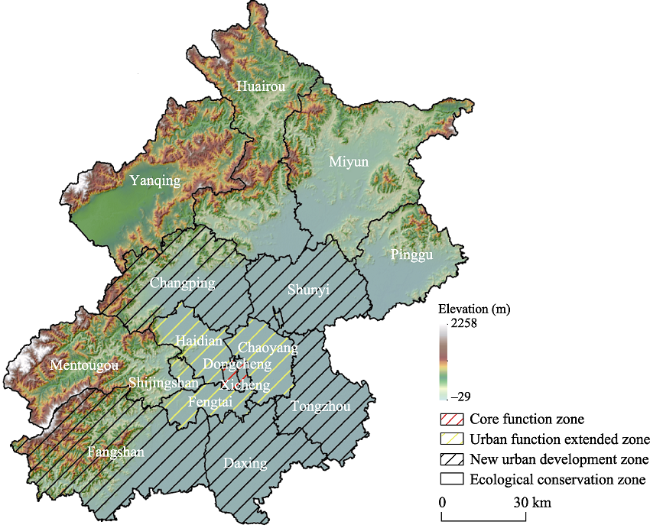
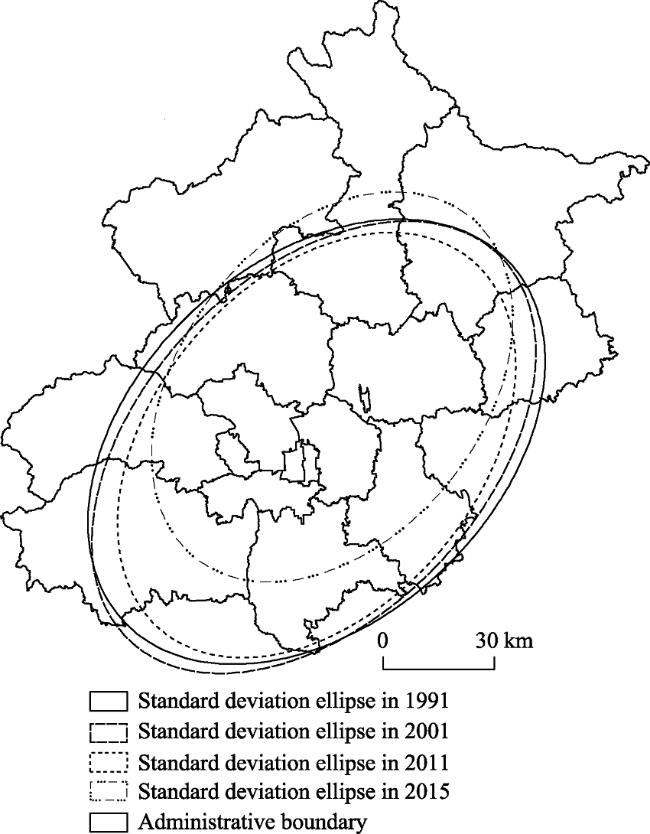
Impervious surface (IS) is often recognized as the indicator of urban environmental changes. Numerous research efforts have been devoted to studying its spatio-temporal dynamics and ecological effects, especially for the IS in Beijing metropolitan region. However, most previous studies primarily considered the Beijing metropolitan region as a whole without considering the differences and heterogeneity among the function zones. In this study, the subpixel impervious surface results in Beijing within a time series (1991, 2001, 2005, 2011 and 2015) were extracted by means of the classification and regression tree (CART) model combined with change detection models. Then based on the method of standard deviation ellipse, Lorenz curve, contribution index (CI) and landscape metrics, the spatio-temporal dynamics and variations of IS (1991, 2001, 2011 and 2015) in different function zones and districts were analyzed. It is found that the total area of impervious surface in Beijing increased dramatically during the study period, increasing about 144.18%. The deflection angle of major axis of standard deviation ellipse decreased from 47.15° to 38.82°, indicating the major development axis in Beijing gradually moved from northeast-southwest to north-south. Moreover, the heterogeneity of impervious surface’s distribution among 16 districts weakened gradually, but the CI values and landscape metrics in four function zones differed greatly. The urban function extended zone (UFEZ), the main source of the growth of IS in Beijing, had the highest CI values. Its lowest CI value was 1.79 that is still much higher than the highest CI value in other function zones. The core function zone (CFZ), the traditional aggregation zone of impervious surface, had the highest contagion index (CONTAG) values, but it contributed less than UFEZ due to its small area. The CI value of the new urban developed zone (NUDZ) increased rapidly, and it increased from negative to positive and multiplied, becoming an important contributor to the rise of urban impervious surface. However, the ecological conservation zone (ECZ) had a constant negative contribution all the time, and its CI value decreased gradually. Moreover, the landscape metrics and centroids of impervious surface in different density classes differed greatly. The high-density impervious surface had a more compact configuration and a greater impact on the eco-environment.

Cite this article

QIAO Kun , ZHU Wenquan , HU Deyong , HAO Ming , CHEN Shanshan , CAO Shisong . Examining the distribution and dynamics of impervious surface in different function zones in Beijing[J]. Journal of Geographical Sciences, 2018 , 28(5) : 669 -684 . DOI: 10.1007/s11442-018-1498-5

1 Introduction

In 2014, the Chinese government released the National New-Type Urbanization Plan, which notes that there have been 142 cities with a population more than one million and 10 cities with a population of more than ten million. In addition, China’s urbanization rate is predicted to reach 60% by 2020 (Xinhua News Agency, 2014). The human activities in urban area are the most intense, especially in metropolitan regions. With the rapid acceleration of urban development, large numbers of natural surfaces have been replaced by anthropogenic surfaces, such as asphalt roads and high buildings, which inevitably have resulted in various effects on the eco-environment (Peng, 2008; Sun, 2013; Peng et al., 2016b). The dynamics of urban underlying surface and its effects on eco-environment have received more and more attention from the governments and researchers.
The impervious surface is usually defined as the collection of anthropogenic landforms that water cannot directly infiltrate into, including rooftops, roads and parking lots (Chester et al., 1996; Qiu et al., 2011). The dynamics of impervious surface impact urban regional climate by altering the thermal environment and water quality (Brun and Band, 2000; Gillies et al., 2003; Xie et al., 2009; Kuang et al., 2011; Fu and Weng, 2016), due to its characteristics of strong capacity of heat storage and weak ability of evapotranspiration, which impede the transmission of airflow (Nie, 2013). Impervious Surface Percentage (ISP) is the percentage of impervious surface area in a unit surface area (Gao et al., 2010; Zhang et al., 2010; Song, 2014). It is a kind of continuous spatial data, which can be used to describe the urban land use pattern comprehensively and accurately, revealing the urban landscape dynamics and change processes quantitatively. In addition, ISP is not susceptible to the change of season, phenology and other external influences. Therefore, it has been recognized as a key indicator in environmental assessment.
As China’s political, cultural center and international exchange center, as well as the science and technology innovation center, Beijing has experienced a rapid urbanization process in recent years, and has become one of the cities with the highest urbanization rate in northern China. Currently, numerous research efforts have been devoted to quantifying the spatio-temporal dynamics of impervious surface in Beijing and its ecological influences (Peng et al., 2016a). Xiao et al. (2007) and Wang et al. (2014) adopted CART (Classification and Regression Tree) and V-I-S (Vegetation-Impervious surface-Soil) model, respectively, to retrieve the distribution of impervious surface in Beijing urban core area, and found that the impervious surface areas increased rapidly each year. Moreover, the ratio of impervious surface decreased from the urban core to the suburbs gradually, presenting a strong spatial gradient. A long time-series spatial data of impervious surface and land surface temperature (LST) in Beijing urban core area were retrieved from Landsat series data and land cover data by Cui et al. (2015) and Hao et al. (2015), respectively. It is reported that the impervious surface in Beijing mainly extended along the ring roads. Besides, it is also found that there was a close relationship between the ISP and LST, and the negative impact of impervious surface on urban thermal environment was greater than the positive impact of vegetation. However, most previous studies primarily considered Beijing metropolitan region as a whole and focused on the impervious surface in major zones without considering the differences and heterogeneity of impervious surface’s distribution among the function zones. As a result, the development pattern and change process of impervious surface in Beijing cannot be interpreted fully.
In addition, there are various shape characteristics and spatial arrangement features of impervious surface in Beijing’s function zones, which are important for quantifying urban sprawl and environment. These different characteristics and features can lead to the heterogeneity of impervious surface’s distribution (Zhou et al., 2011; Liu and Yang, 2015). Therefore, it is necessary to quantify the landscape pattern of impervious surface accurately to expound the dynamics of urban expansion. The integration of landscape ecology theory and remote sensing technology can be quite useful for analyzing the spatial patterns and ecological impacts of impervious surface at different scales. However, previous landscape studies about the impervious surface are mostly based on the “hard” classification results, few researchers focused on the “soft” classification results, the subpixel impervious surface (Peng et al., 2010; Zhang et al., 2015). The “soft” classification results of impervious surface provide more realistic descriptions and information of urban landscape structure than the “hard” classification results.
The subpixel impervious surface results in Beijing metropolitan region within a time series were retrieved from the CART and change detection models, and then the distribution and spatio-temporal dynamics of impervious surface were analyzed. To clarify the role and status of different function zones in Beijing, the spatio-temporal dynamics of impervious surface in each function zone and district were discussed. Meanwhile, the contribution index of each function zone was calculated. Through converting continuous ISP data to discrete data of ISP density classes, the landscape metrics of impervious surface in each function zone were further calculated, and then the landscape pattern of impervious surface was analyzed, which aims to provide relatively reliable decision bases for urban planning and management.

2 Study area and data

2.1 Study area

Beijing is situated in North China between 115.7°-117.4°E and 39.4°-41.6°N. The northwest of the city with a higher terrain is surrounded by low mountains and hills, and the southeast side with a flat terrain slopes to the Bohai Rim (Figure 1). It is characterized by a typical continental monsoon climate with distinct seasons. Beijing has an area of 16412 km2, of which, the area of major zones is 1369 km2. The population and urbanization rate of Beijing increased rapidly in the past decades. The urbanization rate and the resident population have reached 86.5% and 21.705 million by 2015, respectively. The urban population has increased to 18.777 million. Overall, the process of urbanization in Beijing is accelerating.
Figure 1 Location of the study area and its function zones
According to the government documents and The Master Plan For Beijing City (2004-2020) released in 2005, the 16 districts of Beijing have been divided into four function zones (Figure 1), including: (1) core function zone (CFZ), which is the center of Beijing, mainly characterized by the political, cultural and international exchange functions; (2) urban function extended zone (UFEZ), which is the important industrial cluster for economy, education, modern services and tourism; (3) new urban development zone (NUDZ), which is the agglomeration of high technology, modern manufacturing and agricultural industries, and is also a major driver for Beijing’s future development; and (4) ecological conservation zone (ECZ), which plays a significant role in protecting water resource and environment, and serves as an ecological barrier for Beijing.

2.2 Data

Landsat 5 thematic mapping (TM) data acquired in 1991 (May 16), 2001 (May 19 and August 31), 2005 (May 6 and November 14) and 2011 (June 8), together with Landsat 8 operational land imager (OLI) data acquired in 2015 (February 11 and September 7) were selected as the main data source to retrieve ISP. All the above data are with a spatial resolution of 30 m. Moreover, a QuickBird image covering the major zones was used to collect the training/reference data for obtaining and assessing the mapping results of ISP in 2005. The QuickBird image with a high resolution of 2.4 m was obtained on 5 July, 2005. The DMSP/OLS and VIIRS/NPP data in 1992, 2001, 2005, 2011 and 2016 were collected simultaneously as auxiliary data for the simulation of impervious surface. All the data were geometrically corrected and matched, and re-projected into the UTM/WGS 84 projection with a pixel size of 30 m by 30 m for all bands.

3 Methods

3.1 Retrieval of impervious surface

CART model is one of the commonly used methods for ISP retrieval. It is a decision tree model conducting a binary recursive partitioning process, which can deal with mass, nonlinear and high-dimensional data effectively. Furthermore, it allows both continuous and discrete variables to be put into CART model, which is conducive to ISP retrieval at large scales. Currently, impervious surface data retrieved by CART model has been added to the US National Land Cover Database (Yang et al., 2003). Thus, the CART model was used to obtain ISP data in Beijing in this study, and the process consists of several steps: (1) The binary classification result of impervious surface was obtained from the QuickBird image by means of unsupervised classification and recode, and then the training and reference data of ISP over 30 m×30 m grids were derived from the classification result by means of neighborhood block statistics; (2) the simulation model was built by using 7 spectral bands of Landsat 5 TM, DMSP/OLS and VIIRS/NPP night light data as independent variables, the ISP data derived from the QuickBird image as target variable, and then the mapping result of ISP in 2005 was retrieved from the simulation model; and (3) based on the CART simulation model and change detection models, the mapping results of ISP in 1991, 2001, 2011 and 2015 were derived from the Landsat data combined with ISP results in 2005. It should be noted that we assumed the ISP always increases with urban sprawl in the modeling process, since most urbanization processes are irreversible. Therefore, based on ISP result in 2005 and night light data in each year, the ISP data in high urbanization area were collected as the sample data for other years.
The simulation model was evaluated by 10-fold cross-validation method. It means the training data set was divided into 10 blocks of roughly equal size. For each block in turn, a model is built from the data in the remaining blocks and tested using the holdout block (Yang et al., 2003). The ISP result in 2005 was evaluated by the reference data derived from the QuickBird image. Meanwhile, the ISP results in other years were assessed by the ISP data in high urbanization area. The ISP data in high urbanization area were derived based on ISP data in 2005 and night light data in each year (note the assumption that the ISP values of high urbanization area changed little during 1991-2015). Besides, the high resolution images of Google Earth were used as supplementary data for accuracy evaluation.

3.2 Standard deviation ellipse and Lorenz curve

Standard deviation ellipse analysis is one of the classical methods for analyzing directional features of spatial distribution. The spatial pattern and dominant direction of spatial elements can be measured well by the ellipse. To be specific, the aggregation of elements can be described by the elliptic semi-axial length. The deflection angle of ellipse from the north is a measurement of spatial predominant direction (Li et al., 2015). In order to determine the spatial dynamics of ISP in Beijing, the standard deviation ellipses of ISP results were calculated. The formulas for the parameters in an ellipse are presented in the studies of David (1999) and Lauren et al. (2010).
The Lorenz curve was proposed by M. Lorenz for describing the inequality in distribution of wealth, land and income among social classes or other population units. The frequency accumulation is commonly used to depict the inequality, and the equality or inequality in distribution of income can be demonstrated intuitively by Lorenz curve (Zhang et al., 2007). In addition, the spatial density and heterogeneity of geographical elements can also be depicted vividly by Lorenz curve (Yang et al., 2012). Therefore, the Lorenz curve was used to analyze the spatial heterogeneity of ISP.

3.3 Contribution index

In order to quantify the roles of each function zone in Beijing, the contribution index of each zone was calculated using Eq. (1)
CI=(\(\overline{ISP}_F\)-\(\overline{ISP}\))×(SF/S) (1)
where CI denotes the contribution index; \(\overline{ISP}_F\) and \(\overline{ISP}\) denote the average ISP values of each function zone and Beijing, respectively; and SF and S denote the total area of each function zone and Beijing, respectively.

3.4 Landscape metrics

To analyze the spatial characteristics and dynamics of impervious surface landscape, the weighted centroid and landscape metrics of impervious surface were calculated. The weighted centroid was used to measure the dynamics of impervious surface in different density classes, while landscape metrics were used to analyze the shape characteristics and spatial arrangement features of impervious surface.
The contagion index (CONTAG) of landscape level was selected to analyze the aggregation of impervious surface landscape in Beijing metropolitan region. Higher CONTAG values indicate a more connected landscape, while lower values indicate less connected. The patch density (PD) and landscape shape index (LSI) were selected to describe the spatial fragmentation and shape complexity of impervious surface in different density classes. The higher the PD and LSI values are, the more the fragmented and complex is the landscape (Huang et al., 2012).
The impervious surface results in Beijing were divided into 5 density classes with an equal interval. That is: low-density impervious surface (0<ISP≤0.2), medium low-density impervious surface (0.2<ISP≤0.4), medium-density impervious surface (0.4<ISP≤0.6), medium high-density impervious surface (0.6<ISP≤0.8) and high-density impervious surface (0.8<ISP≤1.0).

4 Results

4.1 The spatial dynamics of impervious surface in Beijing

Evaluated by the ISP result derived from the high resolution image (i.e., QuickBird) in 2005, the simulation model of 2005 has a good performance, and the average error (AE), relative error (RE) and correlation coefficient (R) of ISP results are 12.8%, 0.39 and 0.86, respectively. The accuracies of simulated ISP results in other years (1991, 2001, 2011 and 2015) are shown in Table 1. It can be seen that the AE value in each year was less than 14.5%, RE was less than 0.44, and R was larger than 0.73.
Table 1 Accuracies of simulated ISP results in different years
Year Average
error (%)
Relative
error
Correlation
coefficient
1991 10.40 0.43 0.73
2001 8.90 0.36 0.80
2011 8.60 0.44 0.76
2015 14.50 0.41 0.78
The impervious surface in Beijing developed rapidly during 1991-2015 (Figure 2). The spatial pattern of impervious surface developed as a single core mode. From 1991 to 2015, there was a clear expansion of impervious surface area, spreading from CFZ to NUDZ and continuously expanding. The NUDZ became a new aggregation center of impervious surface in 2015, and the ISP values also increased dramatically.
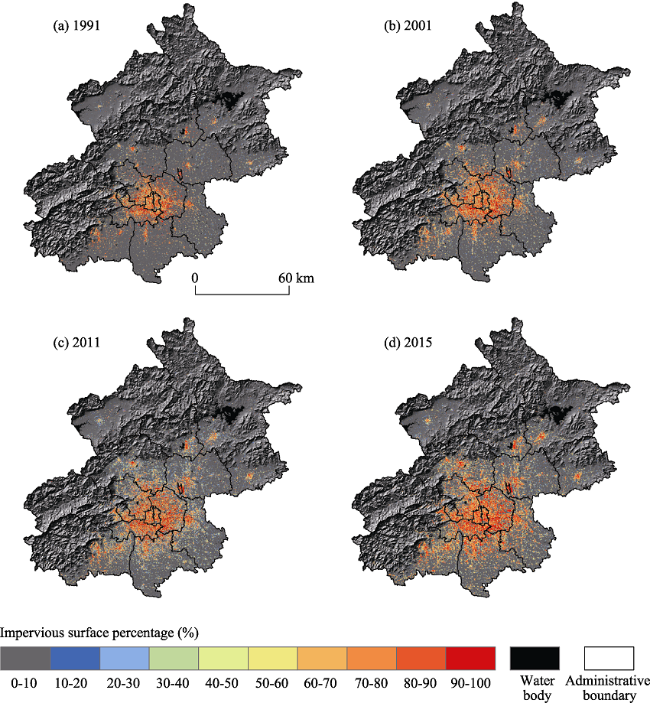
Figure 2 The spatial pattern of impervious surface percentage in Beijing in different years
The total absolute values of area of impervious surface in Beijing in 1991, 2001, 2011 and 2015 were 714.69 km2, 1109.65 km2, 1429.77 km2 and 1745.13 km2, respectively, increasing by about 144.18% from 1991 to 2015. At the same time, the average values of ISP increased significantly, and Beijing experienced a rapid urbanization process during 1991-2015.
The size of standard deviation ellipse was getting smaller from the year 1991 to 2015, and meanwhile, the ellipse moved northward gradually (Figure 3). The deflection angle of major axis decreased from 47.15° in 1991 to 38.82° in 2015 (Table 2), indicating there was a tendency that the major development axis in Beijing moved from northeast-southwest to north-south gradually. However, northeast-southwest profile was still the main direction of urban growth.
Figure 3 The spatial pattern evolution of impervious surface in Beijing from 1991 to 2015
The semi-axial length of standard deviation ellipse also changed a lot from 1991 to 2015 (Figure 2 and Table 2). During 1991-2001, the semi-major axial length increased from 72.37 km to 73.34 km, and the semi-minor axial length decreased from 49.42 km to 46.88 km, indicating the impervious surface’s distribution showed a weak discretization tendency in the major axis and an aggregation tendency in the minor axis. During 2001-2015, the semi-major axial length decreased from 73.34 km to 60.13 km, and the semi-minor axial length continued to decrease from 46.88 km to 41.41 km, which demonstrates that both the impervious surface in major axis and minor axis showed an aggregation tendency.
Table 2 The parameter values of standard deviation ellipses in different years
Year Deflection angle (o) Semi-major axial length (km) Semi-minor axial length (km)
1991 47.15 72.37 49.42
2001 43.79 73.34 46.88
2011 40.05 66.37 44.69
2015 38.82 60.13 41.41

4.2 The spatial dynamics of impervious surface in different function zones

The spatial Lorenz curve of impervious surface was getting closer to the standard line from 1991 to 2015 (Figure 4), indicating the distribution of impervious surface among Beijing’s 16 districts became equal gradually. The UFEZ had the highest CI values and contributed the most to the urban impervious surface (Figure 5). Its average ISP values were much higher than those in Beijing. Besides, the CI value increased continually from 1991 to 2015. The CFZ and NUDZ were important contributors to the rise of urban impervious surface. The average ISP values of CFZ were the highest. However, CFZ contributed less than UFEZ owing to its small area, and its CI values were stable and relatively low. From 1991 to 2015, the CI value of NUDZ increased from negative to positive and multiplied. The role of CFZ was replaced by NUDZ gradually. The ECZ had a constant negative contribution, and its CI value decreased continually. It demonstrates that although the total area of impervious surface in ECZ increased, the average ISP values in this zone were much less than those in Beijing.
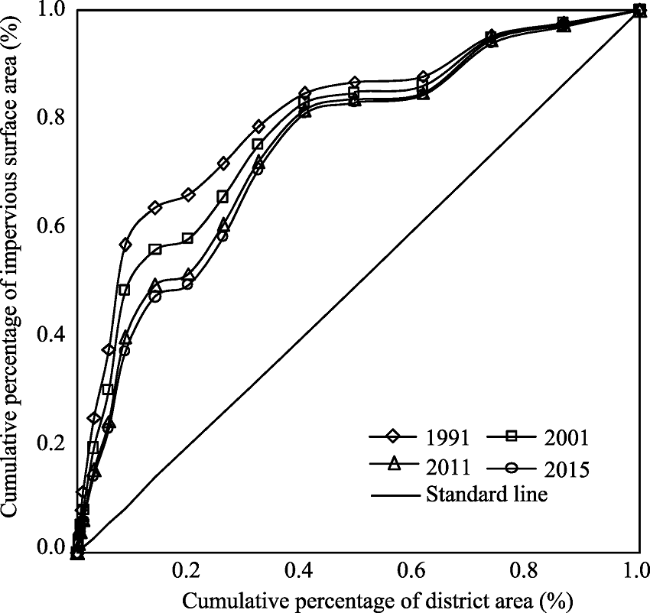
Figure 4 The spatial Lorenz curve in Beijing metropolitan region in 1991, 2001, 2011 and 2015. The horizontal axis represents the cumulative percentage of area of 16 districts in Beijing, and the vertical axis represents the cumulative percentage of the impervious surface proportion in each district. The straight line in the middle is the “standard line”. The closer the spatial Lorenz curve is to the standard line, the more equally distributed is the impervious surface. On the contrary, a departure from the standard line represents an inequality in the impervious surface’s distribution.
The CI values of different districts and function zones differed greatly. Chaoyang district located in UFEZ had the highest CI value of 1.21 in 2015, and Pinggu district located in ECZ had the lowest CI value of -1.15 in 2015. In addition, the CI values of different districts in the same function zones also differed greatly, except for the two districts in CFZ. Yet the variation trend of CI values in districts was almost consistent with that in function zones.
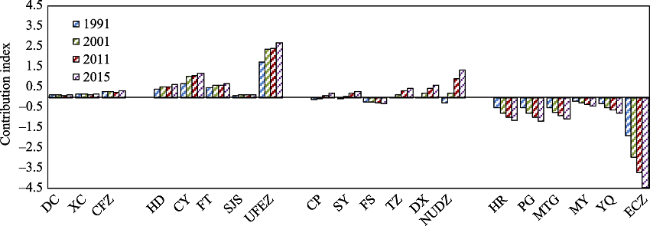
Figure 5 The contribution of each function zone and district to the growth of impervious surface in Beijing. The horizontal axis represents the 16 districts and 4 function zones. DC represents Dongcheng district, XC represents Xicheng district, HD represents Haidian district, CY represents Chaoyang district, FT represents Fengtai district, SJS represents Shijingshan district, CP represents Changping district, SY represents Shunyi district, FS represents Fangshan district, TZ represents Tongzhou district, DX represents Daxing district, HR represents Huairou district, PG represents Pinggu district, MTG represents Mentougou district, MY represents Miyun district, and YQ represents Yanqing district.

4.3 The landscape pattern dynamics of impervious surface in function zones

4.3.1 The variations of centroid
CFZ is the traditional aggregation zone of impervious surface in Beijing (Figure 6). The centroids of impervious surface in different density classes were mainly located in the area between Xicheng district in CFZ and Chaoyang district in UFEZ during the study period. From 1991 to 2015, the landscape patches of high-density and medium-density impervious surface developed fast in the northeast at early stage, and then developed rapidly in the northern part, so the centroid tended to move to northeast at first and then to north. The centroid of medium-high density impervious surface constantly moved to the northeast during 1991 to 2015. For the medium-low density impervious surface, its centroid moved to the southwest during 1991 to 2001, then moved to the northeast during 2001 to 2011, and finally moved to the northwest. The centroid migration trajectory of low-density impervious surface showed a U-shaped pattern, and the centroid first moved to the south, then to the west and finally to the north. Furthermore, it is found that the centroids’ movements during 2011 to 2015 were much larger than those during other periods, indicating there was an obviously directional trend in urban development during this period. On the contrary, the centroids’ movements were the smallest during 2001 to 2011, thus, the urban area developed along multi-directions.
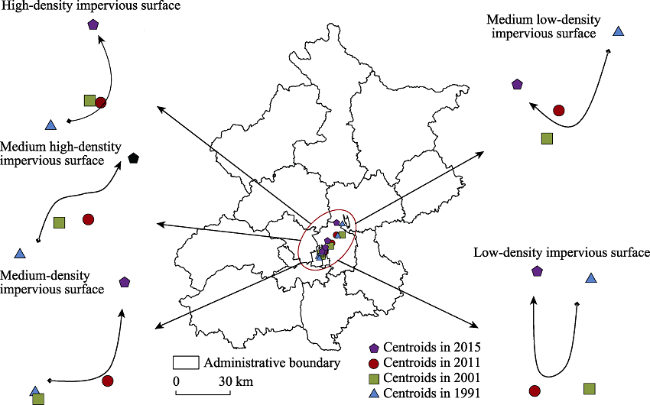
Figure 6 The migration of spatial centroids of impervious surface landscape in Beijing
Table 3 The CONTAG values of each function zone and Beijing in different years
Year CFZ UFEZ NUDZ ECZ Beijing
1991 31.75 23.20 9.04 10.62 13.19
2001 31.22 23.41 11.05 10.52 13.42
2011 30.64 19.50 12.35 12.35 12.61
2015 36.90 24.17 16.03 19.96 15.72
4.3.2 The landscape metrics of impervious surface
The CONTAG values in CFZ were the highest in the four function zones in all the four years (Table 3). It means the impervious surface landscape in CFZ was more connected and compact than that in other zones. Besides, the landscape patches of impervious surface in both NUDZ and ECZ developed fast. As a result, the gap of CONTAG values between these two zones and UFEZ was narrowed. From 1991 to 2015, the CONTAG values in CFZ and UFEZ decreased at first and then increased. However, unlike CFZ and UFEZ, the CONTAG values in NUDZ and ECZ increased all the time, indicating that the spatial aggregation of impervious surface increased over time. The CONTAG values exhibited a slight variation in Beijing metropolitan region. In the whole urbanization process of Beijing, increasing the patches of impervious surface outwards was the main way of urban expansion in the early-developed stage. However, during the later developed period, the main way of urban expansion had changed to enhancing the connectedness among patches.
The values of LSI and PD in both CFZ and UFEZ increased with the rise of ISP and then decreased (Figures 7 and 8). This means as the ISP rose, the landscape structure and shape of impervious surface became increasingly fragmented and irregular at first, and then became less fragmented and less complex. In NUDZ and ECZ, the values of LSI and PD showed a downtrend, indicating the fragmentation and complexity of impervious surface landscape attenuated as the ISP rose. Besides, it is noticeable that in all function zones, the landscape structure and shape of high-density impervious surface were much more compact and aggregative than other types of impervious surface (note the landscape metrics of low-density impervious surface were the lowest in CFZ due to its small area). The changing trend of LSI and PD in Beijing metropolitan region was similar to that in NUDZ.
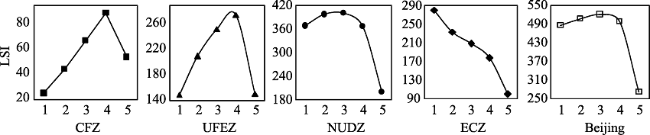
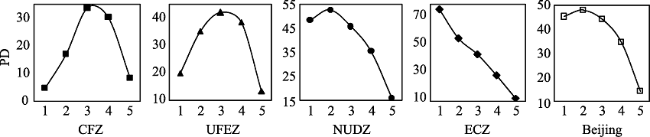
Figure 7 The LSI values of different impervious surface’s types in four function zones and Beijing in 2015. The number 1, 2, 3, 4 and 5 in the x-axis represent the low-density impervious surface, medium low-density impervious surface, medium-density impervious surface, medium high-density impervious surface and high-density impervious surface, respectively.
Figure 8 The PD values of different impervious surface’s types in four function zones and Beijing in 2015

5 Discussion

5.1 Expansion of impervious surface and contribution of function zones

The period 1991-2015 is a typical representation of the developed stage of urbanization in Beijing. The area and magnitude of impervious surface increased dramatically during this period. Besides, the spatial pattern of impervious surface developed as a single core mode with the impervious surface area expanding from CFZ to NUDZ gradually. These results have been confirmed by many studies (e.g., Wang, 2014; Li et al., 2015; Wang et al., 2015). However, most previous studies primarily focused on the spatio-temporal changes of impervious surface in major zones without considering the differences and heterogeneity among the function zones in Beijing (Kuang et al., 2014).
The distribution of impervious surface among function zones was getting more equal over time. The function zones played different roles in the development of urban impervious surface in Beijing metropolitan region, because of their differences in functions, areas and landscapes. CFZ was the traditional aggregation zone of impervious surface in Beijing and had the highest average ISP values among four zones. However, it only accounts for 8.5% of the area of Beijing metropolitan region and developed earlier than other zones (Qiao et al., 2013; Wang, 2014). Thus, the area and magnitude of impervious surface in this zone spanned a relatively small range. CFZ is the second main source of the rise of impervious surface in Beijing. UFEZ has the highest CI values among the four zones, and its average ISP values were also much higher than those in Beijing metropolitan region. As a result, UFEZ played the most important role in the growth of impervious surface in Beijing. NUDZ is a major driver for Beijing’s future development (State Council Letter [2005] No.2, 2005), and its CI value increased from negative to positive and multiplied, turning to be one of the main sources of the rise of impervious surface. With the economic development and population growth, UFEZ and NUDZ will be the critical zones in the future developments of Beijing metropolitan region. They are the important areas for industrial development and population evacuation (Qiao and Tian, 2014). Therefore, more attention should be paid to these two zones to keep the balance of eco-environments and economic development in the future. Although the impervious surface in ECZ developed rapidly, the average ISP values of this zone were much less than those in Beijing due to its high elevation and dense vegetation. Thus, ECZ had a constant negative contribution, and the CI values also showed a decreasing trend. ECZ plays an important role in protecting water resource and environment in Beijing, and serves as the ecological barrier (Li et al., 2015). However, the absolute values of area of impervious surface in this zone showed an increasing trend and the natural resources were damaged continually, such as the reduction of forests, water areas and wetlands. In the future developments, more attention should be paid to this zone so as to ensure a friendly ecological function in Beijing.

5.2 Advantages and ecological implications of impervious surface’s landscape metrics based on “soft” classifications

The landscape metrics are more sensitive to the changes of impervious surface derived from the “soft” classifications than the “hard” classifications. The differences of CONTAG values calculated from the “soft” classifications among four zones were greater than those calculated from the “hard” classifications, especially for NUDZ and ECZ (Table 4). Because the small patches are preserved in the results of impervious surface derived from the “soft” classifications, and the local features of landscape can be better reflected by these “soft” results (Zou et al., 2014).
Table 4 The comparisons of CONTAG values calculated from the “hard” classifications and “soft” classifications for different function zones in 2015
Classification method CFZ UFEZ NUDZ ECZ
“soft” classifications 36.90 24.17 16.03 19.96
“hard” classifications 44.84 30.12 23.23 28.17

The pixel with its ISP retrieved from the “soft” classifications greater than 50% was regarded as the impervious surface pixel of the “hard” classifications

At the landscape level, the CONTAG values in CFZ were the highest in the four function zones, indicating the spatial aggregation of impervious surface in this zone was the strongest. Besides, the CONTAG values in CFZ decreased at first and then increased. As the key area in the development of Beijing, UFEZ played an important role in the rise of impervious surface. There were two main ways for the growth of impervious surface in this zone. One was increasing the patches of impervious surface outwards, and the other was enhancing the connectedness among patches (Qiao and Tian, 2014). Thus, the spatial connectedness of impervious surface in this zone also decreased at first and then increased. NUDZ and ECZ were the major driver and ecological barrier for the developments of Beijing, respectively. The only way for the growth of impervious surface in these zones was enhancing the connectedness among landscape patches (Kuang et al., 2009). The CONTAG values in the two zones both showed a decreasing trend over time. At the class level, as the ISP rose, the values of LSI and PD both in CFZ and UFEZ firstly increased and then decreased. It means the landscape structure and shape of impervious surface became increasingly fragmented and irregular at first, and then became less fragmented and less complex. In NUDZ and ECZ, the values of LSI and PD showed a downtrend, indicating the fragmentation and complexity of impervious surface landscape attenuated gradually as the ISP rose.
The spatial pattern of impervious surface is one of the important factors influencing the urban ecosystem services, water and thermal environment (May et al., 1997; Xian, 2007; Liu et al., 2013; Zhang et al., 2015). It has close relations with the water pollution and urban heat island (UHI). The rapid growth of impervious surface may aggravate the deterioration of water quality and UHI effects (Yuan and Bauer, 2007; Zhang et al., 2009; Zou et al., 2014). In addition, the high-density impervious surface had the most compact configuration, leading to a greater impact on the urban eco-environment than other types of impervious surface. Therefore, more attention should be paid to the growth and spatial pattern of high-density impervious surface to minimize its increase rate and aggregation.

6 Conclusions

The subpixel impervious surface results in Beijing metropolitan region within a time series (1991, 2001, 2005, 2011 and 2015) were derived by means of classification and regression tree (CART) model and change detection models. The spatio-temporal dynamics of impervious surface (1991, 2001, 2011 and 2015) in different function zones and districts were analyzed based on the method of standard deviation ellipse, Lorenz curve, contribution index (CI) and landscape metrics. The following conclusions can be obtained from this study.
The landscape metrics are more sensitive to the changes of impervious surface derived from the “soft” classifications than the “hard” classifications. This lays a foundation for examining the impact of impervious surface’s distribution on eco-environments, and may also offer new insights for exploring the quantitative relationships between impervious surface and ecological factors.
The total area of impervious surface in Beijing grew rapidly during 1991-2015, increasing by about 144.18%. The deflection angle of major axis of standard deviation ellipse decreased from 47.15° to 38.82°, indicating the major development axis in Beijing moved from northeast-southwest to north-south gradually. Moreover, the heterogeneity of impervious surface’s distribution among Beijing’s 16 districts decreased, but the CI values and landscape metrics in four function zones differed greatly. The urban function extended zone (UFEZ) had the highest CI values and contributed the most to the growth of urban impervious surface. Its lowest CI value was 1.79 that is still much higher than the highest CI values in other function zones. The core function zone (CFZ), the traditional aggregation zone of impervious surface, had the highest CONTAG values. However, it contributed less than UFEZ due to its small area. The CI value of the new urban developed zone (NUDZ) increased from negative to positive and multiplied, becoming an important contributor to the urban impervious surface. The ecological conservation zone (ECZ) had a constant negative contribution, and the CI value decreased continually. In addition, the landscape metrics and centroids of impervious surface in different density classes differed greatly. The LSI and PD values of high-density impervious surface were the lowest among the five types of impervious surface. It means the high-density impervious surface had the most compact configuration, leading to a greater impact on urban eco-environment than other types of impervious surface in Beijing. The development pattern of high-density impervious surface should be planned and controlled reasonably to minimize its increase rate and aggregation. Furthermore, more attention should be paid to the coordinated development between regional construction and ecological protection to achieve sustainable development in Beijing.

The authors have declared that no competing interests exist.

[1]
Brun S E, Band L E, 2000. Simulating runoff behavior in an urbanizing watershed.Computers Environment & Urban Systems, 24(1): 5-22.Land-use change in urbanizing watersheds has significant impacts on hydrolic processes and stream quality. Geographic information system (GIS) processing of spatial information is now commonly used to parameterize hydrologic models. We use and evaluate a system developed for the US Environmental Protection Agency (US EPA), coupling Hydrologic Simulation Program02— Fortran (HSPF) with a commonly used GIS (ArcView03) to assess the effects of land-use change on watershed behavior. We extend this anlaysis to investigate relationships beetween runoff ratio and baseflow as a function of percent impervious cover and percent soil saturation for upper Gwynns Falls watershed, Baltimore, MD, USA. Hydrologic model output is used to define summary expressions to describe these relationships and condense complex system behavior. The summary expressions for the runoff ratio and baseflow relationships show that in upper Gwynns Falls from pre-urbanized times to 1990: (1) baseflow had declined by as much as 20%; and (2) only small changes in runoff ratio had occurred. The summary expression for the runoff ratio relationship indicates the existence of a threshold percent impervious cover (6520%), above which the runoff ratio changes more dramatically. By 1990, the percent impervious cover for upper Gwynns Falls (6518%) has not yet exceeded this threshold and may explain why only small changes in the runoff ratio had occurred.

DOI

[2]
Central Committee of the Communist Party of China, the State Council. The National New-type Urbanization Plan (2014-2020). Beijing: Xinhua News Agency, 2014. (in Chinese)

[3]
Chester L Arnold Jr, James Gibbons C, 1996. Impervious surface coverage: The emergence of a key environmental indicator.Journal of the American Planning Association, 62(2): 243-258.Planners concerned with water resource protection in urbanizing areas must deal with the adverse impacts of polluted runoff. Impervious surface coverage is a quantifiable land-use indicator that correlates closely with these impacts. Once the role and distribution of impervious coverage are understood, a wide range of strategies to reduce impervious surfaces and their impacts on water resources can be applied to community planning, site-level planning and design, and land use regulation. These strategies complement many current trends in planning, zoning, and landscape design that go beyond water pollution concerns to address the quality of life in a community.

DOI

[4]
Cui Y, Liu J, Qin Yet al., 2015. The impact of urban sprawl on heat island intensity in Beijing.Chinese Journal of Ecology, 34(12): 3485-3493. (in Chinese)Based on six land use and land cover change( LUCC) datasets,urban and suburban meteorological observation data and a Landsat TM image,this study analyzed the changes of land surface temperature and near surface air temperature with Beijing urban sprawl. Firstly,the urban land surface temperature and the urban underlying surface types were extracted by singlewindow inversion algorithm and linear spectral mixture analysis model. Then,six LUCC datasets and two meteorological observation datasets were used to analyze the impact of urban sprawl on the regional thermal environment. The results showed that the value of land surface temperature in a pixel mainly depended on the fraction of impervious surface of the pixel. The warming effect of impervious surface for land surface temperature was greater than the cooling effect of the vegetation fraction in the pixel. In the process of urban sprawl,urban heat island intensity increased along with the urban sprawl continuously in early stage. However,urban heat island intensity might be stable and even descend under a certain condition.

[5]
David W S Wong, 1999. Several fundamentals in implementing spatial statistics in GIS: Using centrographic measures as examples.Geographic Information Sciences, 5(2): 163-174.Significant research effort has been focusing on using GIS for advanced spatial statistics, modeling, and simulation. This paper argues that even though GIS have great potential to facilitate sophisticated spatial modeling and spatial statistics, the simple but important theme of combining spatial information with statistical analysis has not received enough attention and should not be neglected. This paper discusses how different types of geographic information can be derived from and stored in GIS with special attention on location information. Other types of geographic information such as spatial relationship and connectivity are derivatives of simple location information and are briefly discussed. Using a set of centrographic measures a subset of spatial statistics, this paper demonstrates how statistical techniques can be combined with geographic information such as longitude and latitude of points in analyses. Some of these techniques also utilize attribute data of the point locations in conjunction with locational information. As long as geographic information is extracted from GIS and made accessible to users, the GIS environment provides great potential to develop new spatial analytical methods by directly manipulating geographic information alone or together with attribute data. Using locational and attribute data of selected U.S. cities as an example, this paper shows how spatial mean, spatial median, standard distance and deviational ellipse are derived in a GIS environment.

DOI

[6]
Fu P, Weng Q, 2016. A time series analysis of urbanization induced land use and land cover change and its impact on land surface temperature with Landsat imagery.Remote Sensing of Environment, 175(4): 205-214.The relationship between land use and land cover (LULC) patterns and thermal characteristic has long been studied for examining the impact of urbanization on urban thermal environment. Previous studies were inclined to the use of one or a few images without fully considering the temporal domain of the reflective and thermal infrared data on board Landsat sensors. This paper took the Atlanta metropolitan area as a case study to illustrate LULC change and its impact on land surface temperature (LST) variations. The Landsat L1T (Standard terrain correction) images from TM/ETM + from 1984 to 2011 (507 in total) were downloaded through the USGS online portal and consistently calibrated to surface reflectance and brightness temperature (BT). The cloud-, cloud shadow-, and snow-contaminated pixels were excluded in the analysis according to the metadata, and a further screening procedure based on the RIRLS (Robust Iteratively Reweighted Least Squares) technique was implemented. The time series LSTs (TSLSTs) was derived using the single channel algorithm because it required only the parameters of water vapor and land surface emissivity and had a reported error close to 1 K. The LULC classification and change detection was accomplished by using the Continuous Change Detection and Classification (CCDC) algorithm. The TSLSTs were further decomposed into the seasonal and trend components by an additive model. Results showed that the overall LULC classification and change detection accuracies were 89% and 92%, respectively. Urban growth was mainly observed in Fulton County and Gwinnett County. High-intensity urban land had the largest mean LST value of 294.9 K and yearly amplitude of 17.4 K. A comparison of the trend component between urban and non-urban land covers showed a difference of 1.8 K per decade. Next, temporal thermal signatures were created to characterize and quantify the impact of urban LULC changes. Decomposition analysis showed that the conversion of evergreen forest to medium-intensity urban land generated the largest difference in annual LST variation (5.7 K) and the largest trend difference (0.0004 K/day).

DOI

[7]
Gao Z, Zhang L, Li Xet al., 2010. Detection and analysis of urban land use changes through multi-temporal impervious surface mapping.Journal of Remote Sensing, 14(3): 593-606. (in Chinese)As human activities expanding and the process of urbanization in the past decades,urban land use changes very quickly at different scales in China.Extensive studies have been carried out to extract information of land use changes from remote sensing data.Conventional remote sensing change detection methods such as direct comparison and post-classification comparison are performed at pixel level.However,these methods have been proved to be less effective in quantitatively detecting subtle changes within one land use class than detecting land use transitions,i.e.qualitative changes occurred between different land use classes.To enable the capability of detecting quantitative changes in urban land use,a change detection method is proposed based on impervious surface mapping with multi-resolution remotely sensed data.Urban development leads to the increase of impervious surfaces in urban areas,and the impervious surface has been recognized as an important urban land cover type and one of the key factors in the land,hydrological,climatic,ecological and environmental studies.In this paper,the classification and regression tree(CART) algorithm is used with both high-resolution(QuickBird) and medium-resolution(Landsat5 TM) remote sensing data to establish prediction models of impervious surface percentage(ISP).Based on bi-temporal results of ISP prediction,urban land use changes from 2002 to 2006 are detected in Tai'an city of Shandong province.Furthermore,preliminary analysis for these urban land use changes is carried out.The experimental results demonstrated the feasibility and effectiveness of this change detection method which can be used as a supplement to conventional change detection methods.

DOI

[8]
Gillies R R, Box J B, Symanzik Jet al., 2003. Effects of urbanization on the aquatic fauna of the Line Creek Watershed, Atlanta: A satellite perspective.Remote Sensing of Environment, 86(3): 411-422.Impervious surface area (ISA) was derived for a period from 1979 to 1997 from Landsat MSS and TM data for the Line Creek watershed that lies to the south of the city of Atlanta, GA. The change in ISA is presented as an ecological indicator to examine the cumulative water resource impacts on mussel population in three sub-watersheds of Line Creek—namely, Line, Flat, and Whitewater creeks. The satellite analysis shows that ISA expansion occurred substantially from 1987 to 1997 and is predominantly in industrial, commercial, and shopping center (ICS) complexes but also in smaller lot-size residential development. Evidence of mussel habitat degradation is indicated and loss of species (in the region of 50 to 70%) is present in areas where ISA expansion is observed—specifically in ICS complex development in and around Peachtree City that drains directly into the Line and Flat creeks. This is in marked contrast to Whitewater Creek where overall development of ISA is less and no major loss of mussel species is observed.

DOI

[9]
Hao P, Niu Z, Zhan Yet al., 2015. Spatiotemporal changes of urban impervious surface area and land surface temperature in Beijing from 1990 to 2014.Giscience & Remote Sensing, 53(1): 1-22.This study examined changes in urban expansion and land surface temperature in Beijing between 1990 and 2014 using multitemporal TM, ETM+, and OLI images, and evaluated the relationship between percent impervious surface area (%ISA) and relative mean annual surface temperature (RMAST). From 1990 to 2001, both internal land transformation and outward expansion were observed. In the central urban area, the high-density urban areas decreased by almost 7 km2, while the moderate- and high-density urban land areas increased by 250 and 90 km2, respectively, outside of the third ring road. From 2001 to 2014, high-density urban areas between the fifth and sixth ring roads experienced the greatest increase by more than 210 km2, and RMAST generally increased with %ISA. During 19900900092001 and 20010900092014, RMAST increased by more than 1.5 K between the south third and fifth ring roads, and %ISA increased by more than 50% outside of the fifth ring road. These trends in urban expansion and RMAST over the last two decades in Beijing can provide useful information for urban planning decisions.

DOI

[10]
Huang J, Zhao X, Tang Let al., 2012. Analysis on spatiotemporal changes of urban thermal landscape pattern in the context of urbanization: A case study of Xiamen city. Acta Ecologica Sinica, 32(2): 622-631. (in Chinese)Cities are centers of political,economic,cultural and social life.It is a symbol of human civilization and development,and urbanization is a common trend in many countries.Nowadays,world urbanization accelerates greatly,especially in developing countries.While providing great economic and social benefits,urbanization has also created some environmental problems,including the Urban Heat Island(UHI) effect.UHI has deep impacts on material cycles and energy transfers within urban ecosystems,and has become an important issue in urban climate and environmental research.Xiamen is one of the special economic zones,and its rapid urbanization induced the UHI becoming much more intense and extensive.To study UHI from a viewpoint of landscape is a new method in urban thermal environment research.Analyzing the dynamics of the urban thermal landscape in the context of urbanization will provide support for environmental protection,energy use policy making,and urban planning and management. This study analyzed the spatiotemporal changes of urban thermal landscape pattern in the main area of Xiamen City.Firstly,Landsat Thematic Mapper(TM) and Enhanced Thematic Mapper Plus(ETM+) thermal images,which were acquired on similar dates in the winter of 1987,1992,1997,2002 and 2007,were used to retrieve brightness temperature.Then a relative brightness temperature(R) was calculated and the thermal patches were classified into 6 grades by temperature difference.Landscape metrics were used here at both landscape and class level to quantify changes in the urban thermal landscape pattern.And they can describe the changes of thermal landscape pattern in 3 aspects,including quantity,shape and structure.Finally,we investigated the distribution of thermal pollution sources in Xiamen. The results showed that: 1) In terms of quantity,with the rapid urbanization of Xiamen City between 1987 and 2007,the thermal landscape became more fragmented,and was more and more dominated by high-grade thermal landscape patches.2) The shape of high-grade thermal patches even the whole landscape tends to complex.3) For structure,each grade of thermal landscape became well-distributed and even.The new high-grade thermal patches were found close to the old ones that induced the proximity index(PROX_MN) of high-grade thermal patches increased;the aggregation index(AI) of the whole landscape decreased while the high-grade thermal patches increased;the contagion index(CONTAG) of the whole landscape also decreased so that dominance of high-grade thermal patches gradually increased.4) The area of thermal patches which converted from low-grade to high-grade is bigger than the area converted from high-grade to low-grade.According to statistical analysis,we found that it is much easier that the high-grade thermal landscape patches converted into the middle-grade thermal landscape than converted among high grades.5) The high-grade thermal patches mainly distributed in the industry area,and they were increased remarkably.All the high-grade thermal patches experienced three kinds of changes(increasing number,expanding area and increasing grade),and grouped into five high temperature zones(Haicang,Xinyang,Xinglin,seaport of Xiamen island and airport),especially in the industrial districts of Xinyang and Xinglin.

DOI

[11]
Kuang W, Chi W, Lu Det al., 2014. A comparative analysis of megacity expansions in China and the U.S.: Patterns, rates and driving forces.Landscape & Urban Planning, 133(132): 121-135.Research on physical characteristics and land-cover dynamic changes of megacities over time provides valuable insights for effectively regulating urban planning and management. This study conducts a comparative analysis of 30-year urban expansion patterns and rates among three metropolises in China (Beijing, Shanghai, and Guangzhou) and another three in the USA (New York, Los Angeles, and Chicago) based on time-series impervious surface area (ISA) data extracted from multitemporal Landsat images using the linear spectral mixture analysis approach. This research indicates significantly different urbanization patterns and rates between the Chinese and American megacities. The ISA expansion area in Chinese megacities was five times higher than that in American megacities during the past three decades. The Chinese megacities expand outward from the urban core to the periphery in a concentric ring structure, whereas the American megacities increase ISA mainly within the inner cities with patch-filling patterns. The Chinese megacities are in the development stage where population and economic conditions significantly influence urban expansion patterns and rates, but the American megacities are in the developed stage where population and economic conditions are not important forces driving the ISA expansion. The ISA intensity in the American megacities decreases constantly and smoothly, but ISA intensity in Chinese megacities decays abruptly within certain distances, depending on different cities and years. The most obvious urban expansions were between 8 and 20km in Beijing in the 1980s, between 14 and 50km in Shanghai in the 2000s, and between 8 and 18km in Guangzhou in the 1990s.

DOI

[12]
Kuang W, Liu J, Lu D, 2011. Pattern of impervious surface change and its effect on water environment in the Beijing-Tianjin-Tangshan metropolitan area.Acta Geographica Sinica, 66(11): 1486-1496. (in Chinese)The impervious surface area(ISA)at the regional scale is one of important environmental factors for examining the interaction and mechanism of Land Use/Cover Change(LUCC)-ecosystem processes-regional climate change under the interactions of urbanization and global environment change.The timely and accurate extraction of ISA from remotely sensed data at the regional scale is becoming a bottle-neck issue.This study improved the MODIS NDVI and DMSP-OLS based ISA extraction method by incorporating LULC information of China.ISA datasets in Beijing-Tianjin-Tangshan Metropolitan Area (BTTMA)in 2000 and 2008 at a spatial resolution of 250 m were developed,their spatial-temporal changes were analyzed,and their impacts on water quality were evaluated. The results indicated that ISA in BTTMA has rapidly increased along urban fringe and urban transportation corridors and coastal belt both in intensity and extents from 2000 to 2008.The growth rates of ISA in Tianjin and three cities(Tanshan,Langfang,and Qinhuangdao)in Hebei Province were greater than that in Beijing.The ISA increase has great impacts on water quality;particularly,the water pollution in the Haihe River has deteriorated due to the increase and intensification of impervious surface areas.

DOI

[13]
Kuang W, Shao Q, Liu Jet al., 2009. Spatio-temporal patterns and driving forces of urban expansion in Beijing central city since 1932.Journal of Geo-information Science, 11(4): 428-435. (in Chinese)This study identifies the process of urban expansion and building density since 1932 using a combine of technology of RS and GIS.Urban expansion characteristics,urban land change from different building densities and its driving mechanism are analyzed.The results indicate that Yuan dynasty symbolizes the important stage of the beginning of urban development and construction.But the basic configuration of Beijing City was formed in Ming and Qing dynasty.Beijing City grew at a slow rate before 1984,and then the city began the first fast expansion under the socialist market economy during 1984-1992.Due to the implementation of the most severe farmland protection policy to prevent overheated real estate swallowing farmland in China,the urban expansion rate slowed down during 1992-2000.Beijing City has the fastest expansion rate after 2000 as a result of global economy development,Beijing urban planning and the Olympic Games in 2008.Urban land area per person has been gradually rising since 1956.Beijing City grew with relative high-density compact mode before 1984.But urban expansion indicates low-density sprawl trends after 1984,especially with "pie-like" form along the 5th and the 6th ring roads.The process of urban expansion shows the significant events,population growth and economic development are the most driving factors,in which the significant event is more prominent one.Highway construction and relative low land price in urban fringe area are the most important factors to accelerate urban low-density sprawl.

DOI

[14]
Lauren M S, Mark V J, 2010. Spatial statistics in ArcGIS. In: Fischer M M, Getis A (eds.). Handbook of Applied Spatial Analysis: Software Tool, Methods and Applications. Berlin: Springer.

[15]
Li X, Gong P, Liang L, 2015. A 30-year (1984-2013) record of annual urban dynamics of Beijing city derived from Landsat data.Remote Sensing of Environment, 166(1): 78-90.61An annual sequence of urban land has been produced in Beijing over a 30-year period.61Many Landsat images have been employed to make full use of their temporal contexts.61A temporal consistency check was conducted to make the sequence more reasonable.61The growth rates are different in Beijing during the past three decades.

DOI

[16]
Li Z, Wei Z, Liu Yet al., 2015. Research on Chinese central city impervious surface area growth pattern in recent 20 years: Take Nanchang as a case.Scienta Geographica Sinica, 35(11): 1444-1451. (in Chinese)Impervious surface Area(ISA) is an artificial surface as the specific components, mainly by the hard road, parking lot, a square and a roof and other buildings composition in the city. Because isolation of surface water infiltration into the soil, impervious surface can cut the urban surface and subsurface hydrological connection. It is regarded as important elements on process of urban hydrological cycle, thermal cycling, local climate and biodiversity changes, has become an important indicator of urbanization healthy and quality of the city growth. So it increasingly becomes a hot research issues in geography, ecology, urban planning, environmental science and remote sensing information in recent years in China. But the long-term monitoring and longitudinal comparison of impervious surface is a challenging work. Based on the exited correlation between typical samples' impervious rate, an innovation research method that we called it Reference model of Typical Samples(RTM) was constructed and used to do comparison of impervious surface in historical yearin this article. Besides, the paper examines the impervious surface area growth pattern in recent 20 years in Nanchang main urban areawas applying of Constraint Linear Spectral Unmixing Method(CLSUM). This study shows that the overall development shows the impervious surface area percentage(ISP) increases obviously in Nanchang main urban area in recent 20 years with the percentage of annual increase on 0.09% and the area of annual increase on 32 hatches. The growth pattern shows"decentralized-concentration-diffusion"expanding mode in study area, with the transition of impervious surface high-growth area from urban centers to urban fringe district. The preexisting dominant"road extending"developing mode is gradually transformed into"Satellite filling"mode and"Sporadic enclave"mode, with its contribution of ISP from 23% in 1995 to 11% in 2014 and at the same time Satellite Sporadic enclavemode contribution to study area ISP from 63% to 71%. From the macro view, the impervious surface pattern evolution was affected by the development of social economy and the spreading of convenient engineering technology and materials. On the micro level, this kind of surface changing is also impacted by land policy, urban planning and the investment of urban construction, et al. The present study found that the excessive growth of impervious surface can be effectively reduced by: 1) Rationally planning city expansion; 2) Paying more attention to the excessive growth of construction land in suburban areas; 3) Promoting the use of green permeable building materials; 4) Developing the new construction technology used for improving permeability. The before-and-after comparison of the impervious surface pattern can be unified into a bench mark by joint applying of RTM and CLSUM, with elimination of certain errors. So the reference model of typical samples lays an analyzing foundation for the long-term monitoring and comparing of urban impervious surface changing.

[17]
Liu T, Yang X, 2015. Monitoring land changes in an urban area using satellite imagery, GIS and landscape metrics.Applied Geography, 56: 42-54.61Stratified classification and sub-pixel analysis were used to map land changes in the Atlanta metropolitan area.61Spatial patterns and the urban land change nature have been examined through GIS-based operations and landscape metrics.61Atlanta has experienced a transition of urbanizing patterns with a limited outward expansion after 2000.

DOI

[18]
Liu Y, Wu W, Wen Xet al., 2013. Urban process and its eco-environmental impact in Shanxi-Shaanxi-Inner Mongolia energy area.Geographical Research, 32(11): 2009-2020. (in Chinese)Nowadays, urbanization is becoming a comprehensive subject in the process of socioeconomic development in China. So it is significant to probe into the urbanization process and its eco-environmental effect. As we know, the night light intensity index may reflect the change of urban population, economic strength and infrastructure construction. So in this paper, a group of DPMS/OLS data for continuous years(1992-2009) has been used to study the process and pattern of urbanization in Shanxi-Shaanxi-Inner Mongolia(Jin-Shaan-Meng) energy area. Furthermore, a line chart of urbanization pattern indices is made, which might reflect the dynamic conditions of urbanization in the energy area. The result shows that the total intensity of the urbanization process has been increased continuously, but the urbanization intensity of unit area is fluctuant and inconsistent. The changing trend of urbanization pattern tends to be the complex edges, as well as the decentralized layout. The distribution might be relative to the dispersive patterns of mining areas. Net primary productivity(NPP) value is taken as a representative of the ecological service for carbon fixation and oxygen release. The NPP value and urbanization intensity are both growing in most of the areas, though in a few of the areas the urbanization intensity grows very fast, while the NPP value comes to fall. This phenomenon indicates that although the ecological effect of vegetation is declining in some zones due to the increase of the impervious surface area, the urbanization process does not minimize the overall regional ecological effect. Moreover, the differences of the NPP value between the edge area and the outside area are small, which are only caused by the inferior natural conditions in the whole region. On the contrary, in the central area for human activities, the eco-environmental effect is recovered. In the arid area, a good eco-environment will become an objective demand in the urbanization process when the economic property has been accumulated to a certain extent. What's more, both the good environment demand and enough economic property can availably promote the ecological construction. Of course, the positive conclusion can be drawn through the short-term data analysis of urbanization, but the whole vegetation ecological effect cannot be extrapolated on time scale. The difference between short-term urbanization process and long-term irreversible urbanization behavior should be noticed, and more consideration of ecological restoration in energy area is surely in need at present.

DOI

[19]
May C W, Horner R R, Karr J Ret al., 1997. Effects of urbanization on small streams in the puget sound lowland ecoregion.Watershed Protection Techniques, 1997(4): 79-90.The Pacific Northwest, like many areas of North America, is experiencing an increase in urban development that is rapidly expanding into remaining natural aquatic ecosystems. In the Puget Sound lowland ecoregion, the natural resources most directly affected by watershed development are small streams and associated wetlands. The effects of watershed urbanization on streams are well-documented and include extensive changes in basin hydrologic regime, channel morphology, and water quality. May et al discuss the effects of urbanization on small streams in the Puget Sound ecoregion.

[20]
Nie Q, 2013. Fractal investigation of urban impervious surfaces and its thermal environment effect in Shanghai city [D]. Shanghai: East China Normal University. (in Chinese)

[21]
Peng J, 2008. Characteristics analysis of land-atmosphere energy transfer and turbulence over urban and suburban underlying surfaces in Nanjing winter [D]. Nanjing: Nanjing University of Information Science & Technology. (in Chinese)

[22]
Peng J, Liu Y, Shen Het al., 2016a. Using impervious surfaces to detect urban expansion in Beijing of China in 2000s.Chinese Geographical Science, 26(2): 229-243.The change of impervious surface area(ISA) can effectively reveal the gradual process of urbanization and act as a key index for monitoring urban expansion. Experiencing rapid growth of the built environment in the 2000 s, urban expansion of Beijing has not been fully characterized through ISA. In this study, Landsat TM images of Beijing in 2001 and 2009 were obtained, and the eight-year urban expansion process in Beijing was analyzed using the ISA extracted by means of the vegetation-imperious surface-soil(V-I-S) model. From the spatial variation in ISA, the ring structure of urban expansion in Beijing was significant during the study period, with decreasing urban density from the city center to the periphery. In the ring road analysis, the most dramatic changes of ISA were found between the fifth ring and the sixth ring. This area has experienced the most new residential development, and is currently the main source of urban expansion. The typical profile lines revealed the directional characteristics of urban expansion. The east-west profile was the most urbanized axes in Beijing, while ISA change in the east-north profile was more significant than in the other five profiles. Moreover, the transition matrix of ISA levels revealed an increase in urban density in the low density built areas; the Moran I index showed a clear expansion of the central urban area, which spread contiguously; and the standard deviational ellipse indicated the northeast was the dominant direction of urban expansion. These findings can provide important spatial control guidelines in the next round of national economic and social development planning, overall urban and rural planning, and land use planning.

DOI

[23]
Peng J, Wang Y, Zhang Yet al., 2010. Evaluating the effectiveness of landscape metrics in quantifying spatial patterns.Ecological Indicators, 10(2): 217-223.The effectiveness of landscape metrics in quantifying spatial patterns is fundamental to metrics assessment. Setting 36 simulated landscapes as sample space and focusing on 23 widely used landscape metrics, their effectiveness in quantifying the complexity of such spatial pattern components as number of patch types, area ratio of patch types and patch aggregation level, were analyzed with the application of the multivariate linear regression analysis method. The results showed that all the metrics were effective in quantifying a certain component of spatial patterns, and proved that what the metrics quantified were not a single component but the complexity of several components of spatial patterns. The study also showed a distinct inconsistency between the performances of landscape metrics in simulated landscapes and the real urban landscape of Shenzhen, China. It was suggested that the inconsistency resulted from the difference of the correlation among spatial pattern components between simulated and real landscapes. After considering the very difference, the changes of all 23 landscape metrics against changing of number of patch types in simulated landscapes were consistent with those in the real landscape. The phenomenon was deduced as the sign effect of spatial pattern components on landscape metrics, which was of great significance to the proper use of landscape metrics.

DOI

[24]
Peng J, Xie P, Liu Yet al., 2016b. Urban thermal environment dynamics and associated landscape pattern factors: A case study in the Beijing metropolitan region.Remote Sensing of Environment, 173: 145-155.61LST dynamic was examined in Beijing during 2001–2009.61LST increased averagely in the whole metropolitan area but decreased in city center.61Built-up areas and barren land contribute most to UHI.61Cooling effects of ecological land is obvious with the proportion above 70%.61LST is determined more by landscape composition than spatial configuration.

DOI

[25]
Qiu J, Sang F, Gao Z, 2011. RS estimating and analysis of urban impervious surface percentage and land surface temperature.Science of Surveying and Mapping, 36(4): 211-213. (in Chinese)As the rapid development of the global warming and urbanization,urban impervious surface increases suddenly and the urban heat island effect is more and more serious.Impervious surfaces percentage(ISP) and land surface temperature(LST) were estimated using multi-source remote sensing data in this paper.The experimental results reflected the spatial distribution and changes of ISP and LST.Furthermore,a brief analysis was made based on the estimated results,it could be concluded that the IS Phas a positive correlation relationshi Pwith the increase of the urban heat island effect.

DOI

[26]
Qiao Z, Tian G, 2014. Spatiotemporal diversity and regionalization of the urban thermal environment in Beijing.Journal of Remote Sensing, 18(3): 715-734. (in Chinese)Regionalization of the urban thermal environment is the technical basis for alleviating the conflict between urban socioeconomic development and the thermal environment based on partition management. In this paper,we constructed a regionalization model for the urban thermal environment.(1) Moderate Resolution Imaging Spectroradiometer land surface temperature products from four seasons were standardized and classified for characterizing the spatiotemporal pattern of the urban thermal environment in2008.(2) A comprehensive evaluation system of the urban thermal environment was constructed and the principal components were identified by using the spatial principal component analysis method.(3) A self-organizing mapping neural network was used for spatial regionalization of the urban thermal environment. The results show that the distribution levels of the urban heat island are clearer during the nighttime than during the daytime and the high-temperature zone has the higher aggregation degree in summer than in the other seasons. The composition of the underlying surface directly affects the urban thermal environment. The principal components affecting the urban thermal environment include vegetation coverage,geomorphology,urban construction scale,and anthropogenic heat emission. The Beijing metropolitan area was divided into seven urban thermal environment zones,and specific measures and suggestions were proposed for improving the urban thermal environment based on the multiple formation mechanisms of the urban thermal environment in each zone.

DOI

[27]
Qiao Z, Tian G, Xiao L, 2013. Diurnal and seasonal impacts of urbanization on the urban thermal environment: A case study of Beijing using MODIS data.ISPRS Journal of Photogrammetry & Remote Sensing, 85(2): 93-101.Beijing has experienced rapid urbanization and associated urban heat island effects and air pollution. In this study, a contribution index was proposed to explore the effect of urbanization on land surface temperature (LST) using Moderate-Resolution Imaging Spectroradiometer (MODIS)-derived data with high temporal resolution. The analysis indicated that different zones and landscapes make diurnally and seasonally different contributions to the regional thermal environment. The differences in contributions by the three main functional zones resulted from differences in their landscape compositions. The roles of landscapes in this process varied diurnally and seasonally. Urban land was the most important contributor to increases in regional LSTs. The contributions of cropland and forest varied distinctly between daytime and nighttime owing to differences in their thermal inertias. Vegetation had a notable cooling effect as the normalized vegetation difference index (NDVI) increased during summer. However, when the NDVI reached a certain value, the nighttime LST shifted markedly in other seasons. The results suggest that urban design based on vegetation partitions would be effective for regulating the thermal environment. (C) 2013 International Society for Photogrammetry and Remote Sensing, Inc. (ISPRS) Published by Elsevier B.V. All rights reserved.

DOI

[28]
State Council Letter [2005] No.2, 2005. Beijing City Master Plan (2004-2020). (in Chinese)

[29]
Song Y, 2014. The study of the relationship between impervious surface changes and urban heat island effect in Dianchi Lake Basin based on Landsat data. Kunming: Yunnan Normal University. (in Chinese)

[30]
Sun S, 2013. Observation and simulation study on distribution characteristics of radiation and energy balance over Nanjing in summer [D]. Nanjing: Nanjing University of Information Science & Technology. (in Chinese)

[31]
Wang J, Li C, Hu Let al., 2015. Seasonal land cover dynamics in Beijing derived from Landsat 8 data using a spatio-temporal contextual approach.Remote Sensing, 7(1): 865-881.Seasonal dynamic land cover maps could provide useful information to ecosystem, water-resource and climate modelers. However, they are rarely mapped more frequent than annually. Here, we propose an approach to map dynamic land cover types with frequently available satellite data. Landsat 8 data acquired from nine dates over Beijing within a one-year period were used to map seasonal land cover dynamics. A two-step procedure was performed for training sample collection to get better results. Sample sets were interpreted for each acquisition date of Landsat 8 image. We used the random forest classifier to realize the mapping. Nine sets of experiments were designed to incorporate different input features and use of spatial temporal information into the dynamic land cover classification. Land cover maps obtained with single-date data in the optical spectral region were used as benchmarks. Texture, NDVI and thermal infrared bands were added as new features for improvements. A Markov random field (MRF) model was applied to maintain the spatio-temporal consistency. Classifications with all features from all images were performed, and an MRF model was also applied to the results estimated with all features. The best overall accuracies achieved for each date ranged from 75.31% to 85.61%.

DOI

[32]
Wang J, Su G, Kuang Wet al., 2014. Spatial and temporal patterns analysis of impervious surface in megacity: A case study of Beijing.Bulletin of Surveying and Mapping, 2014(4): 90-94. (in Chinese)

[33]
Weng Q, 2001. Modeling urban growth effects on surface runoff with the integration of remote sensing and GIS.Environmental Management, 28(6): 737-748.Abstract A methodology is developed to relate urban growth studies to distributed hydrological modeling using an integrated approach of remote sensing and GIS. This linkage is possible because both studies share land-use and land-cover data. Landsat Thematic Mapper data are utilized to detect urban land-cover changes. GIS analyses are then conducted to examine the changing spatial patterns of urban growth. The integration of remote sensing and GIS is applied to automate the estimation of surface runoff based on the Soil Conservation Service model. Impacts of urban growth on surface runoff and the rainfall-runoff relationship are examined by linking the two modeling results with spatial analysis techniques. This methodology is applied to the Zhujiang Delta of southern China, where dramatic urban growth has occurred over the past two decades, and the rampant urban growth has created severe problems in water resources management. The results revealed a notably uneven spatial pattern of urban growth and an increase of 8.10 mm in annual runoff depth during the 1989-1997 period. An area that experienced more urban growth had a greater potential for increasing annual surface runoff. Highly urbanized areas were more prone to flooding. Urbanization lowered potential maximum storage, and thus increased runoff coefficient values.

DOI PMID

[34]
Xian G, 2007. Analysis of impacts of urban land use and land cover on air quality in the Las Vegas region using remote sensing information and ground observations.International Journal of Remote Sensing, 28(24): 5427-5445.Urban development in the Las Vegas Valley of Nevada (USA) has expanded rapidly over the past 50 years. The air quality in the valley has suffered owing to increases from anthropogenic emissions of carbon monoxide, ozone and criteria pollutants of particular matter. Air quality observations show that pollutant concentrations have apparent heterogeneous characteristics in the urban area. Quantified urban land use and land cover information derived from satellite remote sensing data indicate an apparent local influence of urban development density on air pollutant distributions. Multiear observational data collected by a network of local air monitoring stations specify that ozone maximums develop in the May and June timeframe, whereas minimum concentrations generally occur from November to February. The fine particulate matter maximum occurs in July. Ozone concentrations are highest on the west and northwest sides of the valley. Nightime ozone reduction contributes to the heterogeneous features of the spatial distribution for average ozone levels in the Las Vegas metropolitan area. Decreased ozone levels associated with increased urban development density suggest that the highest ozone and lowest nitrogen oxides concentrations are associated with medium to low density urban development in Las Vegas.

DOI

[35]
Xiao R, Ouyang Z, Cai Yet al., 2007. Urban landscape pattern study based on sub-pixel estimation of impervious surface.Acta Ecologica Sinca, 27(8): 3189-3197. (in Chinese)The urban impervious surface(IS)refers to any nonporous land cover that prevents water from infiltrating into sub-surface layers,e.g.,buildings,roads,parking lots,sidewalks,and other built surfaces.In addition to its use as an indicator of environmental influences,IS has also been applied to determine the spatial extent,intensity,and type of urban land use/cover changes.In recent years there has been increased interest in the use of classification and regression tree model(CART)technology to map sub-pixel impervious surfaces.This process uses medium-resolution Landsat imagery to extrapolate IS over large-scale areas with high-resolution imagery as training data to represent the urban land-cover heterogeneity.The main advantage of the regression tree algorithm is that it can account for non-linear relations between predictive and target variables,and thus allows both continuous and discrete variables to be used as input(predictive)data.The distribution of impervious surface index(ISI)distribution was deriveded fom Landsat Thematic Mapper(TM)and Enhanced Thematic Mapper Plus(ETM+)data by comparing it with CART and multi-stepwise regression(MSR).The results demonstrated that CART provided with the correlation coefficient of 0.94 and the average error of 8.59% with consistent and acceptable accuracy,which was better than MSR.The average ISI value for the total study area was 20.80% with standard deviation of 0.29.However,in most grids(58.60%)the average ISI was less than 10%.ISI percentage values in different regions also varied dramatically ranging from 67.32% in Zone 1 to 9.32% in Zone 6.Further,the spatial distribution patterns of IS exhibited spatial gradients increasing in value from the city outskirts to the inner urban areas.Utilizing ISI a new landscape classification system was developed,composed of the following four categories:natural cover(ISI10%),low-density urban(10 ISI40),medium-density urban(41ISI60),and high-density urban(ISI60).The results of landscape pattern analysis demonstrate that high-density urban is the dominant landscape within the 4th ring-road covering 67.41% of the surface area,while natural cover is the dominant form of land cover outside the 5th ring-road.Landscape patterns varied extremely with landscape fragmentation index and average patch area,and the average area of natural cover exhibits a U shape as you moved from the inner urban area to the outskirts.It can be concluded that ISI is able to serve as a useful indicator for landscape classification and landscape pattern analysis.

[36]
Xie M, Wang Y, Li G, 2009. Spatial variation of impervious surface area and vegetation cover based on sub-pixel model in Shenzhen.Resources Science, 31(2): 257-264. (in Chinese)Landscape pattern analysis on urban scale needs high resolution images.However,Landsat TM data is the most economical and temporal continuous remote sensing images.To resolve the mixed pixel problems and supply a distinct description on biophysical composition of land cover,this paper analyzes spatial variation of impervious surface area and vegetation cover by sub-pixel model.Based on vegetation-impervious surface-soil(VIS)model,Landsat TM data is unmixed by linear spectral mixture model in Shenzhen to calculate proportion of impervious surface area(ISA)and vegetation cover.Linear spectral mixture model comprises 5 main processes:minimum noise fraction,pixel purity index,end-members collection by n-D visualizer,linear spectral unmixing and results test.End-members include vegetation,high albedo surface,low albedo surface and soil.Impervious surface area is an aggregation of high albedo surface and low albedo surface.Results indicate that:using sub-pixel model to gain the proportion of impervious surface area and vegetation cover has high accuracy based on medium resolution images,and it helps to understand urban biophysical composition and spatial pattern.To analyze the spatial variation of impervious surface area and vegetation cover,zonal statistics,landscape metrics and spatial autocorrelation analysis were involved.Zonal statistics on average ISA and vegetation cover proportion indicates that there are significant differences in land cover characters among the six districts in Shenzhen.Fu-tian district is the most intensely urbanized area with highest average ISA.Yan-tian district is the area with the highest vegetation cover proportion.Seven grades of land cover indices are classified by natural break classification method.To define spatial characters of every land cover grade,three landscape metrics are used including patch density,perimeter-area fractal dimension,and aggregation index.Landscapes with high ISA and low vegetation cover proportion are more fragmental than landscape with low ISA and high vegetation cover proportion.The Moran I indices depicting spatial autocorrelation characters of impervious surface area and vegetation cover are positive and significant,indicating that land cover has the similar tendency within neighborhoods.The spatial autocorrelation character of vegetation is more significant than the impervious surface.Spatial patterns of impervious surface area and vegetation cover are quite different among the six districts in Shenzhen.The spatial variation of land cover can be defined by spatial analysis methods and urbanization characters of each district.It suggests that landscape is more aggregative in districts where there are limits to urban growth,such as Yan-tian district.Because of sprawling urbanization,landscape in Bao-an district shows high fragmentation,and reveals less significant spatial dependence than other districts.The spatial pattern is influenced by physical characteristics and urbanization mode.

[37]
Yang J, Wang J, Zhang Z, 2012. Inter-provincial discrepancy and abatement target achievement in carbon emissions: A study on carbon Lorenz curve.Acta Scientiae Circumstantiae, 32(8): 2016-2023. (in Chinese)This paper estimates provincial carbon dioxide emissions in China based on their fossil fuels consumption.We analyze inter-provincial differences of carbon dioxide emissions using tools measuring income inequality,such as the Lorenz curve,the Parade and the Gini-index.We further study the equalization of inter-provincial carbon dioxide emissions and the achievement of abatement target in China.The paper provides a more visual and receptive tool for the policymakers and the general public.Our results reveal that the inter-provincial differences in carbon dioxide emissions are small relative to the uneven economic development levels.The average carbon intensity in China was basically declining from 1997 to 2009.It is envisioned that the abatement target promised by the Chinese government can be roughly fulfilled.

[38]
Yang L, Huang C, Homer C Get al., 2003. An approach for mapping large-area impervious surfaces: Synergistic use of Landsat-7 ETM+ and high spatial resolution imagery.Canadian Journal of Remote Sensing, 29(2): 230-240.A wide range of urban ecosystem studies, including urban hydrology, urban climate, land use planning, and resource management, require current and accurate geospatial data of urban impervious surfaces. We developed an approach to quantify urban impervious surfaces as a continuous variable by using multisensor and multisource datasets. Subpixel percent impervious surfaces at 30-m resolution were mapped using a regression tree model. The utility, practicality, and affordability of the proposed method for large-area imperviousness mapping were tested over three spatial scales (Sioux Falls, South Dakota, Richmond, Virginia, and the Chesapeake Bay areas of the United States). Average error of predicted versus actual percent impervious surface ranged from 8.8 to 11.4%, with correlation coefficients from 0.82 to 0.91. The approach is being implemented to map impervious surfaces for the entire United States as one of the major components of the circa 2000 national land cover database.

DOI

[39]
Yuan F, Bauer M E, 2007. Comparison of impervious surface area and normalized difference vegetation index as indicators of surface urban heat island effects in Landsat imagery.Remote Sensing of Environment, 106(3): 375-386.This paper compares the normalized difference vegetation index (NDVI) and percent impervious surface as indicators of surface urban heat island effects in Landsat imagery by investigating the relationships between the land surface temperature (LST), percent impervious surface area (%ISA), and the NDVI. Landsat Thematic Mapper (TM) and Enhanced Thematic Mapper Plus (ETM+) data were used to estimate the LST from four different seasons for the Twin Cities, Minnesota, metropolitan area. A map of percent impervious surface with a standard error of 7.95% was generated using a normalized spectral mixture analysis of July 2002 Landsat TM imagery. Our analysis indicates there is a strong linear relationship between LST and percent impervious surface for all seasons, whereas the relationship between LST and NDVI is much less strong and varies by season. This result suggests percent impervious surface provides a complementary metric to the traditionally applied NDVI for analyzing LST quantitatively over the seasons for surface urban heat island studies using thermal infrared remote sensing in an urbanized environment.

DOI

[40]
Zhang D, Guo H, Sun Z, 2012. Estimating surface characteristic parameters in the megacities and the research on their effects towards the urban heat environment.Remote Sensing Technology and Application, 27(1): 51-57. (in Chinese)In recent years the significant changes have been occurred in the land surface environment of the megacities,and it has also brought the great impact to the ecosystem in regions.Therefore,it is urgent to quantity various kinds of land surface characteristic parameters in urban and research their relationships,so as to analysis their effects towards the urban heat environment.For this reason,we take the municipality of Beijing as an example to extract four typical surface parameters with Landsat-5 TM remote sensing image on June 2,2009,including the percentage of impervious layer,land surface temperature,land use/land cover and vegetation index,and their quantitative relationships have been analyzed.Finally,it can be found that the high impervious surface region has been expanded to the six-ring in Beijing with the rapid development of the urbanization,and the LST maintained at 40 ℃ or more within the six-ring,where it was the high temperature region.Especially in the business districts the LST was as high as 45 ℃,and the LST fluctuant magnitude was small within the six-ring.What s more,the forest and agricultural land played the role of cooling effect at the maximum cooling scale of 6 ℃,and it was clear that the LST of the bared soil region nearly arrived at that of high-density resident in the summer.

[41]
Zhang J, Feng Z, Yang Y, 2007. Lorenz curve and its application in the research of spatio-temporal pattern of cultivated land, grain and population in China.Journal of Arid Land Resources and Environment, 21(11): 63-67. (in Chinese)Lorenz curve is commonly used to describe the inequality degree of social distribution in income,and now it has been become a kind of effective statistical measurement for general equality analysis.Based on the basic of principle of Lorenz curve,grain-cultivated land distribution curve in 1980,1990 and 2000 year were set up, which dividing cultivated land to 5 kinds according to the production ability,cultivated land,grain and population of counties and probing the rule of spatio-temporal pattern of cultivated land,grain and population in China from 1980 to 2000.

[42]
Zhang L, Gao Z, Liao Met al., 2010. Estimating urban impervious surface percentage with multi-source remote sensing data.Geomatics and Information Science of Wuhan University, 35(10): 1212-1216. (in Chinese)Impervious surface is a significant factor in monitoring urban development and environmental quality. However, accurate and cost-effective extraction of impervious surface is still a challenge. In light of the increasing availability of multisource remote sensing data from different imaging sensors, this study developed a method to map large-area impervious surface percentage at the sub-pixel level using multi-source remote sensing data. A case study in Shenzhen was conducted for this purpose based on a classification and regression tree (CART) algorithm to SPOT, Landsat ETM+ images. Experiment results indicate that both of the data are capable of mapping urban impervious surface percentage (ISP) with a reasonable accuracy, but the SPOT image has a better performance of impervious surface percent (ISP) estimation accuracy owing to its higher spatial resolution compared with Landsat ETM+.

DOI

[43]
Zhang Y, Balzter H, Zou Cet al., 2015. Characterizing bi-temporal patterns of land surface temperature using landscape metrics based on sub-pixel classifications from Landsat TM/ETM+.International Journal of Applied Earth Observation & Geoinformation, 42: 87-96.Landscape patterns in a region have different sizes, shapes and spatial arrangements, which contribute to the spatial heterogeneity of the landscape and are linked to the distinct behavior of thermal environments. There is a lack of research generating landscape metrics from discretized percent impervious surface area data (ISA), which can be used as an indicator of urban spatial structure and level of development, and quantitatively characterizing the spatial patterns of landscapes and land surface temperatures (LST). In this study, linear spectral mixture analysis (LSMA) is used to derive sub-pixel ISA. Continuous fractional cover thresholds are used to discretize percent ISA into different categories related to urban land cover patterns. Landscape metrics are calculated based on different ISA categories and used to quantify urban landscape patterns and LST configurations. The characteristics of LST and percent ISA are quantified by landscape metrics such as indices of patch density, aggregation, connectedness, shape and shape complexity. The urban thermal intensity is also analyzed based on percent ISA. The results indicate that landscape metrics are sensitive to the variation of pixel values of fractional ISA, and the integration of LST, LSMA. Landscape metrics provide a quantitative method for describing the spatial distribution and seasonal variation in urban thermal patterns in response to associated urban land cover patterns.

DOI

[44]
Zhang Y, Odeh I O A, Han C, 2009. Bi-temporal characterization of land surface temperature in relation to impervious surface area, NDVI and NDBI, using a sub-pixel image analysis.International Journal of Applied Earth Observations and Geoinformation, 11(4): 256-264.

DOI

[45]
Zhou W, Huang G, Cadenasso M L, 2011. Does spatial configuration matter? Understanding the effects of land cover pattern on land surface temperature in urban landscapes. Landscape & Urban Planning, 102(1): 54-63.The effects of land cover composition on land surface temperature (LST) have been extensively documented. Few studies, however, have examined the effects of land cover configuration. This paper investigates the effects of both the composition and configuration of land cover features on LST in Baltimore, MD, USA, using correlation analyses and multiple linear regressions. Landsat ETM + image data were used to estimate LST. The composition and configuration of land cover features were measured by a series of landscape metrics, which were calculated based on a high-resolution land cover map with an overall accuracy of 92.3%. We found that the composition of land cover features is more important in determining LST than their configuration. The land cover feature that most significantly affects the magnitude of LST is the percent cover of buildings. In contrast, percent cover of woody vegetation is the most important factor mitigating UHI effects. However, the configuration of land cover features also matters. Holding composition constant, LST can be significantly increased or decreased by different spatial arrangements of land cover features. These results suggest that the impact of urbanization on UHI can be mitigated not only by balancing the relative amounts of various land cover features, but also by optimizing their spatial configuration. This research expands our scientific understanding of the effects of land cover pattern on UHI by explicitly quantifying the effects of configuration. In addition, it may provide important insights for urban planners and natural resources managers on mitigating the impact of urban development on UHI.

DOI

[46]
Zou C, Zhang Y, Huang H, 2014. Impacts of impervious surface area and landscape metrics on urban heat environment in Fuzhou city, China.Journal of Geo-information Science, 16(3): 490-498. (in Chinese)With the economic development, urbanization has been accelerating in recent years in Fuzhou City, Fujian Province of China. Rapid change on land surface property and its patterns may lead to change of thermal properties in urban areas of Fuzhou City. One of the main impacts of rapid urbanization is the effect of urban thermal environment. Landscape patches in a region are different in size, shape and spatial arrangements, which contribute to the spatial heterogeneity of landscape and are linked to the distinct behaviour of urban thermal environments. Studies on landscape metrics extracted from discretized percent impervious surface area data are comparatively rare. This research, which investigated the relationship of landscape metrics and urban thermal environments in Fuzhou City, Fujian Province, China, is based on both the analysis of land surface temperature (LST) in relation to normalized difference vegetation index (NDVI), and the percent impervious surface area (FISA). Two Landsat TM/ETM+ images acquired on June 15 1989 and March 4, 2001 were used to estimate LST, NDVI, and impervious surface area (ISA). This was extracted by applying linear spectral mixture analysis. We analyzed the relationship between the above-mentioned components of urban ecosystem. Using threshold value method and range method to discretize percent ISA into different categories. Landscape metrics such as cohesion, AI, LPI, etc. are calculated based on different FISA categories. The result showed that there is a positive linear relationship between LST and impervious surface over the region. The correlation coefficient is .66(1989) and .71(2001). To find the relationship between landscape metrics and LST, we analyzed landscape metrics from three aspects: shape, area and structure. The study indicated that landscape metrics are sensitive to the variation of FISA and LST. Therefore, the integration of FISA and landscape metrics provided a feasible way to describe the spatial distribution and temporal variation in urban thermal patterns in a quantitative manner.

DOI

Outlines

/