Research Articles

Overflow probability of the Salt Lake in Hoh Xil Region

  • YAO Xiaojun , 1 ,
  • SUN Meiping 1, 2 ,
  • GONG Peng 1 ,
  • LIU Baokang 3 ,
  • LI Xiaofeng 1 ,
  • AN Lina 1 ,
  • YAN Luxia 1
Expand
  • 1. College of Geography and Environment Sciences, Northwest Normal University, Lanzhou 730070, China
  • 2. State Key Laboratory of Cryosphere Sciences, Northwest Institute of Eco-Environment and Resources, CAS, Lanzhou 730000, China
  • 3. Qinghai Institute of Meteorological Sciences, Xining 810001, China

Author: Yao Xiaojun (1980-), PhD and Associate Professor, specialized in GIS and cryospheric change.
E-mail:

Accepted date: 2017-07-20

  Online published: 2018-03-30

Supported by

National Natural Science Foundation of China, No.41261016, No.41561016

Opening Foundation Projection of State Key Laboratory of Cryosphere Sciences, CAS, No.SKLCS-OP-2016-10

Youth Scholar Scientific Capability Promoting Project of Northwest Normal University, No.NWNU-LKQN-14-4

Copyright

Journal of Geographical Sciences, All Rights Reserved

Abstract

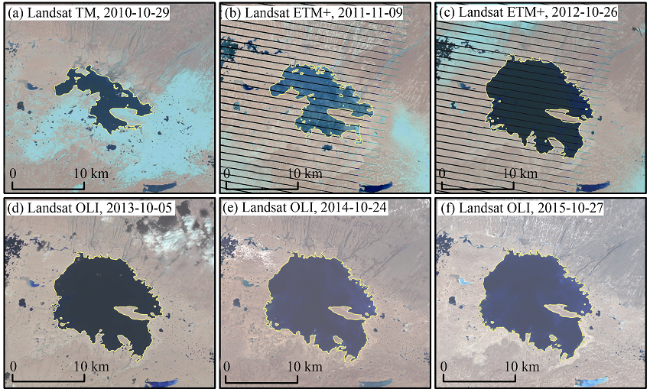
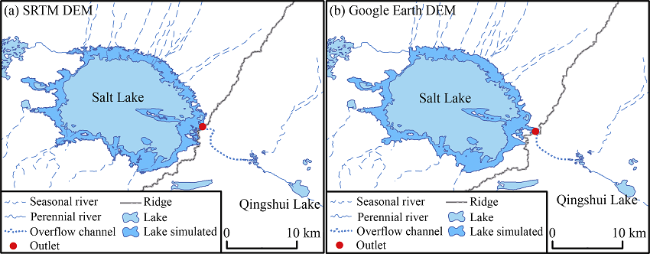
After the bursting of Huiten Nor in Hoh Xil Region in September, 2011, the topic on whether the water overflowed from the Salt Lake would enter into the Chumaer River and become the northernmost source of the Yangtze River has aroused wide concern from public and academic field. Based on Landsat TM/ETM+/OLI remote sensing images during 2010-2015, SRTM 1 arc-second data, Google Earth elevation data and the observation data from the Wudaoliang meteorological station, the study initially analyzed the variations of the Salt Lake and its overflowing condition and probability. The results showed that the area of the Salt Lake expanded sharply from October 2011 to April 2013, and then it stepped into a stable expansion period. On October 27, 2015, the area of the Salt Lake had arrived at 151.38 km2, which was about 3.35 times the area of the lake on March 3, 2010. The Salt Lake will overflow when its area reaches the range from 218.90 km2 to 220.63 km2. Due to the differences between SRTM DEM and Google Earth elevation data, the water level of the Salt Lake simulated would be 12 m or 9.6 m higher than the current level when the lake overflowed, and its reservoir capacity would increase by 23.71 km3 or 17.27 km3, respectively. Meanwhile, the overflowed water of the Salt Lake would run into the Qingshui River basin from its eastern part. Although the Salt Lake does not overflow in the coming decade, with watershed expansion of the Salt Lake and the projected precipitation increase in Hoh Xil region, the probability of water overflow from the Salt Lake and becoming a tributary of the Yangtze River will exist in the long term.

Cite this article

YAO Xiaojun , SUN Meiping , GONG Peng , LIU Baokang , LI Xiaofeng , AN Lina , YAN Luxia . Overflow probability of the Salt Lake in Hoh Xil Region[J]. Journal of Geographical Sciences, 2018 , 28(5) : 647 -655 . DOI: 10.1007/s11442-018-1496-7

1 Introduction

The Huiten Nor located in Hoh Xil Region broke on September 14, 2011, then the flood flowed into the Kusai Lake along the gully and Kusai River (Yang, 2015). Due to the quick rise of water level, the Kusai Lake started to overflow from September 20 to 30, 2011, and made a chain process of lake water spillover in its downstream (Yao et al., 2012). Finally, the Salt Lake on the east of the Haiding Nor received the spillover water. Up to now, the reasons of the Huiten Nor outburst are still controversial. Yao et al. (2012, 2013) thought that the main reasons were the increase of precipitation and the decrease of evaporation in Hoh Xil Region. Yang (2015) believed that this event was caused by the headward erosion of seasonal river in the palaeochannel. However, there is no doubt that the hydraulic connection was built among the four lakes including the Huiten Nor, Kusai Lake, Haiding Nor and Salt Lake because the Huiten Nor broke. If the area of the Salt Lake which is the last “recipient” of surface runoff in the basin continues to increase, will the situation like the Kusai Lake and Haiding Nor overflow occur? Once the overflowing water of the Salt Lake enters into the Qumar River along the Qingshui River, the Zhuonai River will be the most northern origin of the Yangtze River. Additionally, because the four lakes mentioned above belong to brackish lake or salt lake with higher mineralization (Hu, 1992; Wang and Dou, 1998), lake water overflowed can not only affect the water quality and ecological environment of the Yangtze River, but also increase the thickness of permafrost active layer in the area drained by lake water (Wu and Niu, 2013), which will eventually endanger some projects including the Qinghai-Tibet railway and highway in this region (Cheng, 2003). To answer these questions, it is the key to recognize the change of the Salt Lake and judge the possibility of lake water overflow.

2 Study area

The Salt Lake (35°32′N, 93°25′E) was named for its salt production, and was also named as 68 Dao Ban Salt Lake. It lies in the northeast part of the Hoh Xil National Nature Reserve and is about 12 km away from the Sonam Dhargey protection station in Zhidoi County of Qinghai Province (Figure 1). The Salt Lake is formed in the Tertiary continental downfaulted basin in the middle of the Kunlun Mountains and is surrounded by monadnocks composed of Tertiary-Pliocene continental stratas. The lakefront is Quaternary-Holocene lacustrine and paludal sediments and the lake water is mainly supplied by seasonal rivers. There were two rock islands in the middle of the lake, which were inundated in 2012 due to the rise of lake water level. The lake region belongs to Alpine Steppe semi-arid climate with the average annual temperature ranging from -4.0 to -1.0°C and the annual precipitation of 150-200 mm. According to Records of Chinese Lakes (Wang and Dou, 1998), the mineralization degree of the Salt Lake is up to 221.35 g/L and belongs to magnesium sulphate (MgSO4) subtype salt lake. The brine made up of sodium sulphate (NaSO4) and carbonate is developed locally, and the salt minerals are halite, mirabilite and gypsum. The Salt Lake was exploited in the 1980s and the salt was transported to the Shigatse Prefecture in Tibet Autonomous Region (Hu, 1992). With the establishment of the Hoh Xil National Nature Reserve, salt mining activities had stopped.
In the northwest of the Salt Lake, there are Haiding Nor, Kusai Lake and Huiten Nor from east to west (Figure 2), which belonged to closed-basin lakes before the outburst of Huiten Nor in Spetember 2011. The Huiten Nor is mainly supplied by the Huiten River originated from glacial melt water in Wuxuefeng region. The Kusai Lake relies on the Kusai River in the southern part of Kunlun Mountains. The intermittent stream and surface runoff constitute the main water source of the Haiding Nor. After the outburst of the Huiten Nor, the chain reaction of water spillover from the Kusai Lake and Haiding Nor made the Salt Lake expand rapidly and formed some river channels between each other (Yao et al., 2012).
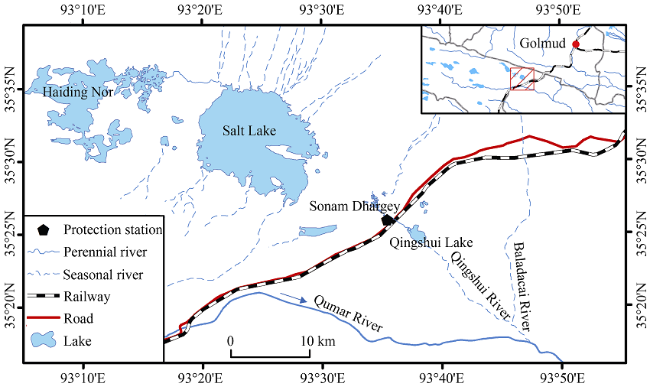
Figure 1 The map of Salt Lake
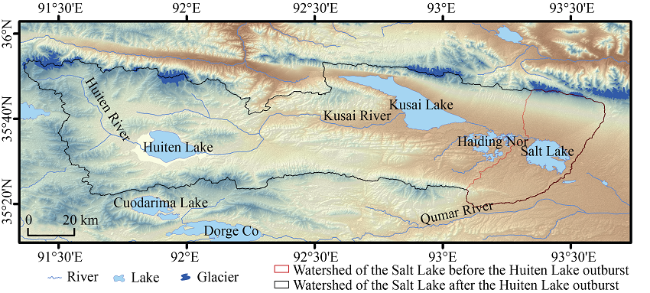
Figure 2 Lakes in the neighborhood of the Salt Lake

3 Data and methods

3.1 Data sources

In order to obtain the change of the Salt Lake, 81 Landsat TM/ETM+/OLI remote sensing images from 2010 to 2015 were collected and processed. These remote sensing images with the path/row of 137035 and 138035 were downloaded from the USGS website (http://glovis.usgs.gov). There are many advantages to selecting the Landsat TM/ETM+/OLI images as the basic data sources. For example, these images were preprocessed by geometric correction which helped to reduce the workload; the error caused by the scan line corrector off in Landsat ETM+ after 2003 could be diminished by the combination of Landsat TM and OLI images; the accuracy of lake interpretation could be improved by cross validation of multi-source remote sensing images. Due to the cover of cloud and snow on the Salt Lake, there were fewer remote sensing images with high quality in four months including June, July, September and December, having amount were 4, 5, 3 and 3 scenes, respectively.
The digital elevation model (DEM) data used in this study included the Shuttle Radar Topography Mission (SRTM) 1 arc-second DEM and Google Earth elevation data. The spatial resolution of the former was about 30 m, which were collected through the SRTM system carried by the space shuttle Endeavour in February 2000 and were published by NASA in the late 2014 (http://www2.jpl.nasa.gov). The aerial photographs, satellite remote sensing images and geographical information system (GIS) data were integrated in the Google Earth software, which had been widely used in some fields, such as the arrangement of GPS control network, the production of thematic maps and the survey of large scale terrain, etc (Huang and Zhang, 2015). Meanwhile, the Google Earth API was freely provided to help developers carry out the secondary development to extract relevant information (Mo et al., 2012). Some studies demonstrated that the topographic feature lines derived from Google Earth elevation data were consistent with its images, and the accuracy of elevation was better than topographic maps with the scale of 1:50 000 (Guan and Fang, 2011; Huang and Zhang, 2015). The spatial resolution of Google Earth elevation data available in this study area was about 15 m. In addition, the observation data from Wudaoliang meteorological station near the Salt Lake was selected as the reference of climate change, and this dataset was provided by China Meteorological Data Service Center (http://data.cma.cn).

3.2 Methods

Water body has strong absorption at the near infrared band and strong reflectivity at the blue band, so it is easier to be identified or extracted by means of band combinations or band operations. Currently, the commonly used methods for identifying the lake water include artificial visual interpretation, Normalized Difference Water Index (NDWI) and Modified Normalized Difference Water Index (MNDWI). The main difference between NDWI and MNDWI is the choice of near infrared band and mid-infrared band (Mcfeeters, 1996; Xu, 2005). In this study, the boundary of Salt Lake only needed be extracted to obtain its areas in different periods. Experiments showed that the workload of remote sensing image preprocessing and post-processing using NDWI and MNDWI methods was more than the digitalization by artificial visual interpretation. So the method of artificial visual interpretation was adopted and the extraction accuracy was limited to one pixel.
Based on the acquisition of the Salt Lake’s boundaries and the assumption of water level being stable in the moment of acquisition date of remote sensing image, the change of water level in different periods could be obtained by iteratively increasing the elevation value (e.g. 0.1 m for Google Earth elevation data and 1 m for SRTM DEM, respectively) which extent was same as the interpretation result of the Salt Lake from the remote sensing images, and then the change of lake reservoir capacity could been calculated by raster algebra function in the ArcGIS software. The formula is as follows:
ΔV = (Si × (hj - hi) + (Sj - Si) × (hj - hDEM)) / 1000 (1)
where ΔV is the change of lake reservoir capacity (km3); Si and Sj are areas of the lake (km2) for date i and j, respectively; hi and hj are lake water levels (m) for date i and j, respectively; hDEM is the elevation (m) which is not overwhelmed at the i moment.
Finally, the ridge between the Salt Lake and the Qingshui River watershed was derived by using the hydrology model in the ArcGIS software. Then the maximum extent of the Salt Lake was simulated by looping the elevation until the lake water overflowing into the Qingshui River watershed. The volume increment of lake water meeting this condition could be calculated by formula (1).

4 Results and discussion

4.1 Spatiotemporal variations of the Salt Lake from 2010 to 2015

The Salt Lake experienced a dramatic variation from 2010 to 2015 (Figure 3). Before the water from the Haiding Nor flowed into the Salt Lake in October 2011, the Salt Lake expanded slowly. Its area was 45.18 km2 on March 3, 2010 and 47.61 km2 on October 29, 2010, respectively. The percentage of area variation of the Salt Lake was only 5.37% and it enlarged toward the northeast during this period. On November 9, 2011, the area of Salt Lake increased to 73.18 km2. Then the Salt Lake entered into a period of rapid expansion. Its area was 84.29 km2 on December 11, 2011 and 99.33 km2 on May 19, 2012, respectively. Until October 26, 2012, the area of Salt Lake increased to 134.19 km2 which was nearly 3 times that on October 29, 2010. After April 12, 2013, the Salt Lake switched to a relatively slow expansion which growth speed (3.43 km2/a) was yet greater than that before 2011 (2.43 km2/a). Meanwhile, 9 islands were formed in the eastern, western and southern parts of the lake and the largest one had an area of 0.53 km2. The area of Salt Lake increased to 151.38 km2 on October 27, 2015, which was consistent with the interpretation result based on HJ1A/B remote sensing images (Liu et al., 2016).
Figure 3 Variations of the Salt Lake from 2010 to 2015
The variation trend of reservoir capacity of the Salt Lake was same as that of its area during the period of 2010-2015 (Table 1). Due to the difference of data type (e.g. the values of SRTM DEM and Google Earth elevation data were integer and float, respectively), the reservoir capacity calculations of the Salt Lake based on SRTM DEM were generally greater than that based on Google Earth elevation data, but their trends were consistent. It was noted that the changes of reservoir capacity based on Google Earth elevation data in 2010 and from 2014 to 2015 could not been obtained because of its limitation of data precision. Specifically, the variations of reservoir capacity were 23.84×10⁸ m3 and 18.88×10⁸ m3 from October 29, 2010 to October 24, 2014 based on SRTM DEM and Google Earth elevation data, respectively. On the consideration of interception of the Kusai Lake and the Haiding Nor on the overflowing water from the Huiten Nor (the areas of the Kusai Lake and the Haiding Nor actually increased after the outburst of the Huiten Nor) (Yao et al., 2012), the outburst flood amount of the Huiten Nor would exceed the value estimated by Yang (2015). As mentioned above, the Salt Lake turned to a situation of relatively slow expansion after April 12, 2013, for example, the lake undergone small variations from September 5, 2013 to September 30, 2015 and had a steady area of about 161 km2 (Liu et al., 2016). It implied the rapid area increase of the Salt Lake caused by the Huiten Nor outburst flood terminated and the Salt Lake would be supplied by the surface runoff in the basin. The area and reservoir capacity variations of the Salt Lake after 2013 were much more than that before the Huiten Nor outburst which made the watersheds of the Huiten Nor, Kusai Lake, Haiding Nor and Salt Lake merge into one (Figure 2). The fact was that the area of the Salt Lake watershed rapidly increased from 1261.64 km2 to 8563.54 km2. Except for the surface runoff in its own watershed, the Salt Lake received the upstream water from the Haiding Nor through the newly formed river channel. Compared with the reservoir capacity variation of the Salt Lake before 2010, its water amount from the Haiding Nor and its upstream basin was between 1.20×10⁸ and 1.78×10⁸ m3 and became an important water source of the Salt Lake.
Table 1 Reservoir capacity variations of the Salt Lake from 2010 to 2015
Period Variations based on
SRTM DEM (108 m3)
Variations based on
Google Earth DEM (108 m3)
March 3, 2010-October 29, 2010 0.80 -
October 29, 2010-November 9, 2011 4.46 2.64
November 9, 2011-May 19, 2012 6.08 5.02
May 19, 2012-October 26, 2012 10.72 10.66
April 12, 2013-October 24, 2014 2.58 0.56
October 24, 2014-October 27, 2015 2.00 -

Note: “-” denotes that the variation of reservoir capacity cannot be calculated due to the sameness of DEM maximum value in different periods.

4.2 Condition of water overflow from the Salt Lake

The condition of water overflow from the Salt Lake is that its boundary leaps over the ridge between the Salt Lake and Qingshui River basin, which can be simulated by iteratively setting increase of lake water level. Figure 4 showed that the expansion range of the Salt Lake meeting this condition based on SRTM DEM and Google Earth elevation data. It was obvious that the Salt Lake would expand around and the narrow southeastern part would evolve into an island. The area of the overflowed Salt Lake simulated was 220.63 km2 based on SRTM DEM and 218.90 km2 based on Google Earth elevation data, respectively. And the water level of the Salt Lake would expect to be 4473 m (SRTM DEM) and 4476.3 m (Google Earth elevation data) which was 12 m and 9.6 m higher than now. It was consistent with the fact that there were many lower ridges between lakes in northern Tibet (Yang, 2015). Similar to the results in Table 1, the increment of reservoir capacity calculated by SRTM DEM was greater than that by Google Earth elevation data. The former was 23.71 km3 and the latter was 17.27 km3. It should be pointed out that the water from the Salt Lake would flow into the Qingshui River basin in the vicinity of location (35°28′47″N, 93°30′10″E) if it came true.
Figure 4 The expansion range of the overflowed Salt Lake

4.3 Overflow probability of the Salt Lake

The observation data of Wudaoliang meteorological station showed that the precipitation fluctuated from 1970 to 1995 and the average annual precipitation was 264.8 mm (Figure 5). There was an obvious upward trend of precipitation after 1996; especially the average annual precipitation was as high as 383.2 mm during the period 2008-2014, with an increase of 44.71% than that before 1995. Numerous studies showed that the precipitation over the Tibetan Plateau would increase in the first half of the 21st century, and the northern and western parts of the Tibetan Plateau belonged to the precipitation amplification regions (Chen et al., 2011; Su et al., 2013; Zhang et al., 2015). In RCP 2.6 and RCP 8.5 scenarios, the average annual precipitation of Tibetan Plateau during the period 2006-2035 was expected to increase by 3.2% relative to the base period 1961-2005 (Su et al., 2013). In RCP 4.5 scenario, the average annual precipitation of Tibetan Plateau during the period 2016-2035 would also increase by 4.4% relative to the reference period of 1986-2005 (Hu et al., 2015). If the precipitation in Hoh Xil Region increases in the next few decades as expected, the Salt Lake will continue to expand and its water will finally enter into the Qingshui River basin.
Assuming that there are no more lake outburst floods in the upstream of Salt Lake and the increment of reservoir capacity remains constant being 2.00 km3 during the period 2014-2015, the water of the Salt Lake will flow into the Qingshui River basin in September 2026 based on SRTM DEM, which means the time needed is 11.86 years. The result simulated by Google Earth elevation data showed that the period was 30.83 years, e.g. the late September 2045. Not considering evaporation, surface seepage and interception, that is to say, all precipitation in the basin flows into the Salt Lake and there is no water loss, the runoff depth needed will reach 2.77×103 mm (SRTM DEM) or 2.02×103 mm (Google Earth elevation data). Based on the average annual precipitation of Wudaoliang meteorological station with a value of 296.6 mm from 1970 to 2014 and 383.2 mm from 2008 to 2014, respectively, the time needed will be 5.26 years at the least and 9.33 years at the most. The average annual potential evapotranspiration of Wudaoliang meteorological station calculated by Penman-Monteith formula was much larger than the annual precipitation, although it had a downward trend (Yao et al., 2013). It meant the latter case would not happen in reality. Therefore, it is believed that the Salt Lake will not overflow in the next decade, but this possibility still remains over a longer period.
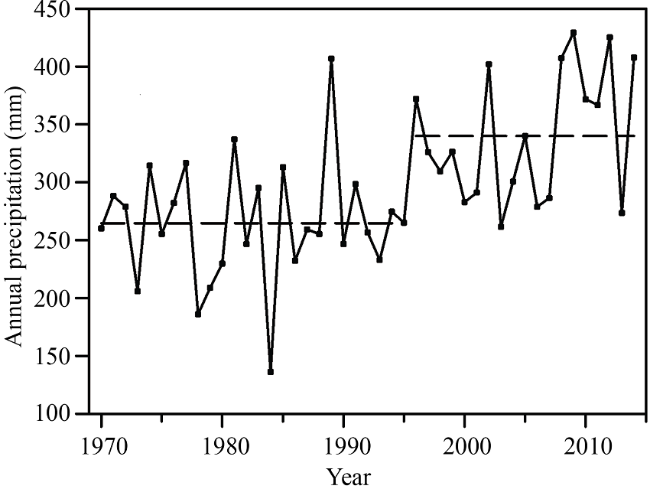
Figure 5 Precipitation variation observed at Wudaoliang meteorological station from 1970 to 2014

5 Conclusions

In this paper, the variation characteristics of the Salt Lake during the period 2010-2015 and its overflow probability was systematically analyzed based on multi-source remote sensing images and two DEM datasets. Conclusions were drawn as follows:
(1) The Salt Lake in Hoh Xil Region had undergone dramatic changes from 2010 to 2015. According to the speed of lake area increase, its evolution could be divided into three processes: a slow expansion caused by precipitation increase before October 2011; a sharp area increase of lake resulted by the Huiten Nor outburst flood and consecutively water overflow of the Kusai Lake and Haiding Nor; a higher stable expansion caused by the enlargement of watershed after April 2013. Until October 27, 2015, the area of the Salt Lake reached 151.38 km2 which was about 3.35 times the area on March 3, 2010. The increment of reservoir capacity was 18.88×10⁸-23.84×10⁸ m3 during the period from October 29, 2010 to October 24, 2014, based on SRTM DEM and Google Earth elevation data, respectively.
(2) When the area of the Salt Lake increased to 218.90-220.63 km2, its water would enter into the Qingshui River basin. Due to the differences between SRTM DEM and Google Earth elevation data, the water level of the Salt Lake simulated would be 12 m (SRTM DEM) or 9.6 m (Google Earth elevation data) higher than the current level when the lake overflowed, and its reservoir capacity would increase by 23.71 km3 or 17.27 km3, respectively.
(3) The results simulated under different assumptions showed that the Salt Lake would not overflow in the next decade. However, all projected precipitation in different RCP scenarios was expected to increase in the northern part of the Tibetan Plateau where the Salt Lake located in the early 21st century, as a result, the possibility of lake overflowing and becoming a tributary of the Yangtze River would exist in the longer period.
(4) Due to some limitations such as expensive DEM data, confidential large scale topographic maps and unavailable field measurements data in sparsely-populated region, there maybe a difference between the simulation result of the Salt Lake and its coming evolution. In order to acquire the variation of the Salt Lake and avoid the potential threat to the Qinghai-Tibet railway and highway in this region, the remote sensing monitoring and field investigation of the Salt Lake should been carried out in the future. Meanwhile, the change of permafrost active layer caused by climate warming should be paid more attention in this region.

The authors have declared that no competing interests exist.

[1]
Chen W, Jiang Z, Li L, 2011. Probabilistic projections of climate change over China under the SRES A1B scenario using 28 AOGCMs.Journal of Climate, 24(17): 4741-4756.Probabilistic projection of climate change consists of formulating the climate change information in a probabilistic manner at either global or regional scale. This can produce useful results for studies of the impact of climate change impact and change mitigation. In the present study, a simple yet effective approach is proposed with the purpose of producing probabilistic results of climate change over China for the middle and end of the twenty-first century under the Special Report on Emissions Scenarios A1B (SRES A1B) emission scenario. Data from 28 coupled atmosphere-ocean general circulation models (AOGCMs) are used. The methodology consists of ranking the 28 models, based on their ability to simulate climate over China in terms of two model evaluation metrics. Different weights were then given to the models according to their performances in present-day climate. Results of the evaluation for the current climate show that five models that have relatively higher resolutions-namely, the Istituto Nazionale di Geofisica e Vulcanologia ECHAM4 (INGV ECHAM4), the third climate configuration of the Met Office Unified Model (UKMO HadCM3), the CSIRO Mark version 3.5 (Mk3.5), the NCAR Community Climate System Model, version 3 (CCSM3), and the Model for Interdisciplinary Research on Climate 3.2, high-resolution version [MIROC3.2 (hires)]- perform better than others over China. Their corresponding weights (normalized to 1) are 0.289, 0.096, 0.058, 0.048, and 0.044, respectively. Under the A1B scenario, surface air temperature is projected to increase significantly for both the middle and end of the twenty-first century, with larger magnitude over the north and in winter. There are also significant increases in rainfall in the twenty-first century under the A1B scenario, especially for the period 2070-99. As far as the interannual variability is concerned, the most striking feature is that there are high probabilities for the future intensification of interannual variability of precipitation over most of China in both winter and summer. For instance, over the Yangtze-Huai River basin (28°-35°N, 105°-120°E), there is a 60% probability of increased interannual standard deviation of precipitation by 20% in summer, which is much higher than that of the mean precipitation. In general there are small differences between weighted and unweighted projections, but the uncertainties in the projected changes are reduced to some extent after weighting. 2011 American Meteorological Society.

DOI

[2]
Cheng G D, 2003. Effect of partial factors on permafrost distribution and its suggestion on the Qinghai-Xizang Railway design.Science in China (Series D), 33(6): 602-607. (in Chinese)

[3]
Guan J C, Fang C M, 2011. A Google Earth based new approach to pre-treatment of terrain for river simulation.Water Resources and Hydropower Engineering, 42(12): 21-24. (in Chinese)The conventional methods of terrain pre-treatment for river simulation are elaborated herein at first,and then a Google Earth based new approach to the preliminary treatment of terrain is discussed;in which the technology of elevation data extraction is described with the explanation on the functions of part of the API interfaces of Google Earth,furthermore,a problem existed in the calling process of a Google Earth API is pointed out and solved.The study demonstrates that the Google Earth based preliminary treatment of terrain for river simulation can significantly improve the efficiency of the pre-treatment concerned.

DOI

[4]
Hu D S, 1992. Investigation and study on lake resources in Kekexili region.Arid Land Geography, 15(3): 50-58. (in Chinese)The last blank area in the central part of the Qinghai—Xizang plateau was filled up by the national synthetical investigation during the period from 1989. A lot of valuable primary scientific data were obtained by the investigation of 24 specialities. The lake resources and their distribution law have been found out basically in the Kekexili Region. The lake degrees is up to 0.047—0.053. Moreover, a peculiar natural landscape was found in this region. The study provides the scientific basis for revealing the temporal and spatial position of lakes during the evolution processes of natural environment, protecting, utilizing, exploiting and managing the lake resources rationally, renovating the land, etc.

[5]
Hu Q, Jiang D B, Fan G Z, 2015. Climate change projection on the Tibetan Plateau: Results of CMIP5 models.Chinese Journal of Atmospheric Sciences, 39(2): 260-270. (in Chinese)Climate change for the 21 st century over the Tibetan Plateau(TP) is projected using multiple climate models within the phase five of the Coupled Model Intercomparison Project under the Representative Concentration Pathway 4.5(RCP4.5) scenario. These models have a demonstrated ability to simulate modern climatology. The results show an annual warming trend of 0.26°C per decade, which correlates positively with the topographical height in 2006-2100. With respect to the reference period 1986-2005, the TP annual temperature increases 2.7°C in the 2090 s, which is stronger than the warming in the early and middle 21 st century. In the early, middle, and end periods, annual warming is 0.8-1.3°C, 1.6-2.5°C, and 2.1-3.1°C, respectively. Temperature increases are seen in all seasons, with the strongest warming occurring in winter. On the contrary, overall annual precipitation increases slightly on the TP, with a trend of 1.15% per decade during 2006–2100 and an increase of 10.4% in the 2090 s relative to the reference period. Annual precipitation ranges from-1.8% to 15.2% in the early period, from-0.9% to 17.8% in the middle period, and from 1.4% to 21.3% in the end period. Precipitation generally increases in all seasons; the summer increase is larger compared with other seasons, particularly for the end of the 21 st century. The annual precipitation increase occurs mainly in summer. It is noted that the above results differ somewhat among models, which indicates a relatively large level of uncertainty and a relatively high(low) reliability of temperature(precipitation) projection.

[6]
Huang Q, Zhang Z Y, 2015. A method for earth surface elevation obtained based on Google Earth and its accuracy assessment.Bulletin of Surveying and Mapping, (2): 51-54. (in Chinese)

[7]
Liu B, Du Y, Li Let al., 2016. Outburst flooding of the moraine-dammed Zhuonai Lake on Tibetan Plateau: Causes and impacts.IEEE Geoscience and Remote Sensing Letters, 13(4): 570-575.The Kekexili region of the Tibetan Plateau has become warmer and wetter since the 1960s, resulting in a significant expansion of Zhuonai Lake (+0.46 km2/year, p <; 0.05) before an outburst flood event occurred on September 15, 2011, and mapped by the Chinese Huanjing (HJ)-A/B satellites with a two-day revisit ability and a 360-km orbit swath. The direct cause of the outburst was due to relatively heavy precipitation from May to September 2011, specifically the continuous rainfall from later August to middle September. Two nearby earthquakes that occurred two months before the outburst might have impacted the natural structure of the lakebed and moraine dam to accelerate the outburst. The outburst event of Zhuonai Lake caused large environmental impacts on the region: 1) the desertification of the exposed lakebed of Zhuonai Lake; 2) the significant expansion of the three downstream lakes Kusai, Haidingnuoer, and Salt Lakes that not only caused the grassland reduction and deteriorations but also the potential threat to the operations of the Qing-Tibet Railway and Highway; and 3) the calving relocation of Tibetan antelopes to the shore area of Kusai Lake due to the deep cutting riverbanks caused by the overflow of Zhuonai Lake. This study provides some scientific clues or alerts for local or central governments to pay some attention on this very issue so that possible future devastative disasters and environmental damages would be avoided or mitigated.

DOI

[8]
Mcfeeters S K, 1996. The use of the Normalized Difference Water Index (NDWI) in the delineation of open water features.International Journal of Remote Sensing, 17(7): 1425-1432.The Normalized Difference Water Index (NDWI) is a new method that has been developed to delineate open water features and enhance their presence in remotely-sensed digital imagery. The NDWI makes use of reflected near-infrared radiation and visible green light to enhance the presence of such features while eliminating the presence of soil and terrestrial vegetation features. It is suggested that the NDWI may also provide researchers with turbidity estimations of water bodies using remotely-sensed digital data.

DOI

[9]
Mo S J, Li Z L, Chen C Jet al., 2012. 3D terrain modeling based on Google Earth: Method and realization.Bulletin of Surveying and Mapping, (2): 39-42. (in Chinese)P209;TP391.7

DOI

[10]
Su F, Duan X, Chen Det al., 2013. Evaluation of the global climate models in the CMIP5 over the Tibetan Plateau.Journal of Climate, 26(10): 3187-3208.The performance of 24 GCMs available in the fifth phase of the Coupled Model Intercomparison Project (CMIP5) is evaluated over the eastern Tibetan Plateau (TP) by comparing the model outputs with ground observations for the period 1961-2005. The twenty-first century trends of precipitation and temperature based on the GCMs' projections over the TP are also analyzed. The results suggest that for temperature most GCMs reasonably capture the climatological patterns and spatial variations of the observed climate. However, the majority of the models have cold biases, with a mean underestimation of 1.1 degrees-2.5 degrees C for the months December-May, and less than 1 degrees C for June-October. For precipitation, the simulations of all models overestimate the observations in climatological annual means by 62.0%-183.0%, and only half of the 24 GCMs are able to reproduce the observed seasonal pattern, which demonstrates a critical need to improve precipitation-related processes in these models. All models produce a warming trend in the twenty-first century under the Representative Concentration Pathway 8.5 (rcp8.5) scenario; in contrast, the rcp2.6 scenario predicts a lower average warming rate for the near term, and a small cooling trend in the long-term period with the decreasing radiative forcing. In the near term, the projected precipitation change is about 3.2% higher than the 1961-2005 annual mean, whereas in the long term the precipitation is projected to increase 6.0% under rcp2.6 and 12.0% under the rcp8.5 scenario. Relative to the 1961-2005 mean, the annual temperature is projected to increase by 1.2 degrees-1.3 degrees C in the short term; the warmings under the rcp2.6 and rcp8.5 scenarios are 1.8 degrees and 4.1 degrees C, respectively, for the long term.

DOI

[11]
Wang S M, Dou H S, 1998. Records of Chinese Lakes. Beijing: Science Press, 481-493. (in Chinese)

[12]
Wu Q B, Niu F J, 2013. Permafrost changes and engineering stability in Qinghai-Xizang Plateau.Chinese Science Bulletin, 58(2): 115-130. (in Chinese)

[13]
Xu H Q, 2005. A study on information extraction of water body with the Modified Normalized Difference Water Index (MNDWI).Journal of Remote Sensing, 9(5): 589-595. (in Chinese)A modified normalized difference water index(MNDWI) has been proposed in this paper based on the normalized difference water index(NDWI) of Mcfeeters (1966), which uses MIR(TM5) instead of NIR(TM4) to construct the MNDWI. The MNDWI has been tested in the ocean, lake and river areas with the background of built-up lands and/or vegetated lands, and with both clean and polluted water bodies using Landsat TM/ETM+ imagery. This reveals that the MNDWI can significantly enhance the water information, especially in the area mainly with built-up land as background. The MNDWI can depress the built-up land information effectively while highlighting water information, and accurately extract the water body information from the study areas. While the enhanced water information using the NDWI always has been mixed with built-up land noise and the area of a water body extracted based on the index is thus overestimated. Therefore, the NDWI is not suitable for enhancing and extracting water information in built-up land-dominated areas. Furthermore, the MNDWI can reveal subtle features of water more efficiently than the NDWI or other visible spectral bands do due largely to its wider dynamic data range. The application of the MNDWI in the Xiamen image has achieved an excellent result. The MNDWI image successfully reveals significant non-point pollution of the water surrounding the Xiamen Island due to agricultural activities. In addition, taking the advantage of the ratio computation, the MNDWI can remove shadow noise from water information without using sophisticated procedures, which is otherwise difficult to be removed.

[14]
Yang Y, 2015. No trifle on the Qinghai-Tibet Plateau: The Zhuonai Lake is flooding.Chinese National Geography, 661: 78-93. (in Chinese)

[15]
Yao X J, Liu S Y, Sun M Pet al., 2012. Changes of Kusai Lake in Hoh Xil Region and causes of its water overflowing.Acta Geographica Sinica, 67(5): 689-698. (in Chinese)Based on topographic maps,Landsat TM/ETM+images,China Environment and Hazards Monitoring and Prediction Satellite(HJ1A/B)CCD images and meteorological materials observed at Wudaoliang meteorological station,we explore the change causes of Kusai Lake using geographical information techniques and mathematical statistics method. The results show that water overflowing Kusai Lake occurred in September 20-30 in 2011, and the direct reason was the flood from Zhuonai Lake flowing into Kusai Lake.In addition, Kusai Lake has been growing in recent decades;especially after 2006 it experienced a quick increase that formed the foundation of lake water overflow.The main factor resulting in the flood from Zhuonai Lake was the steady precipitation.Specifically,the heavy precipitation on August 17 and 21 made Zhuonai Lake water outflow on August 22,2011;then continuous precipitation during August 31 to September 9,16 and 17 subsequently formed a serious flood from September 14 to 21.Accordingly,there was a sudden drop in area of Zhuonai Lake.As of November 29,the lake decreased to 168.07 km 2 (a reduction of by 104.88 km 2 ), accounting for 62%of the area on August 22.The outflow water from Kusai Lake flowed into Haidingnuoer Lake,then into Yanhu Lake.The latter occurred during October 6-20.Due to sudden rapid flow,both Haidingnuoer and Yanhu lakes suffered a quick expansion from October to November,2011.

DOI

[16]
Yao X J, Liu S Y, Sun M Pet al., 2013. Spatial-temporal variations of lake area in Hoh Xil Region in the past 40 years.Acta Geographica Sinica, 68(7): 886-896. (in Chinese)As one of the areas with numerous lakes on the Tibetan Plateau,the Hoh Xil region plays an extremely important role in the fragile plateau eco-environment.Based on topographic maps in the 1970s and Landsat TM/ETM+ remote sensing images in the 1990s and the period from 2000 to 2011,the data of 83 lakes with the area above 10 km2 were obtained by digitization method and artificial visual interpretation technology,and the causes for lake variations were also analyzed.Some conclusions can be drawn as follows.(1) From the 1970s to 2011,the lakes in the Hoh Xil region firstly shrank and then expanded.In particular,the area of lakes generally decreased during the 1970s-1990s.Then the lakes expanded during the 1990s-2000 and their area was slightly higher compared with the 1970s.The area of lakes dramatically increased after 2000.(2) From 2000 to 2011,the lakes with different area scales in the Hoh Xil region showed an overall expansion trend.Meanwhile,some regional differences were also discovered.Most of the lakes expanded and were widely distributed in the northern,central and western parts of the region.Some lakes merged together or overflowed due to their rapid expansion.A small number of lakes with the trend of area decrease or strong fluctuation were scattered in the central and southern parts of the study area.And their variations were related to their own supply conditions or hydraulic connection with the downstream lakes or rivers.(3) The increase in precipitation was the dominant factor resulting in the expansion of lakes in the Hoh Xil region.The secondary factor was the increase in melt water from glaciers and frozen soil due to climate warming.

[17]
Zhang R H, Su F G, Jiang Z Het al., 2015. An overview of projected climate and environmental changes across the Tibetan Plateau in the 21st century.Chinese Science Bulletin, 60(32): 3036-3047. (in Chinese)Research into projected climate and environmental changes across the Tibetan Plateau in the 21 st century is reviewed. Climate and environmental factors involved include surface air temperature, rainfall, extreme weather and climate events, frozen soil, snow cover,glaciers, runoff, and vegetation. Projections are mainly from climate model simulations under the Special Report on Emissions Scenarios(SRES) and Representative Concentration Pathway(RCP) as well as from physical statistical models. In the future, surface air temperature across the Tibetan Plateau will rise and this rise will become more rapid in the late 21 st century. Generally, in that century, rainfall, extreme weather and climate events, and active layer depth of frozen soil across the plateau will increase. However,near-surface permafrost area, snow-covered days, snow water equivalent, and glacier coverage and amount will decrease. Changes of runoff across the plateau show complexity during the 21 st century. Runoff varies greatly by drainage basin, with some basins showing increases and others decreases. Vegetation is sensitive and fragile in response to the climate change. In the middle and late century,growing season will lengthen, evergreen forest/woodland will replace alpine tundra on the southern and eastern plateau, and scrub vegetation will expand and invade the alpine steppe region. Based on existing research, we comprehensively integrate all these projected climate and environmental factors and present their potential changing ranges in the middle(2030-2050) and late(2080-2100) portions of the 21 st century.

DOI

Outlines

/